

Abstract
Multiple light scattering in biomedical tissue limits the penetration depth of optical imaging systems such as optical coherence tomography. To increase the imaging depth in scattering media, a computational method based on coherent reflection matrix measurement has been developed using low coherence interferometry. The complex reflection matrix is obtained via point-by-point scanning followed by a phase-shifting method; then singular value decomposition is used to retrieve the singly back-scattered light. However, the in vivo application of the current reported method is limited due to the slow acquisition speed of the matrix. In this Letter, a wide-field heterodyne-detection method is adopted to speed up the complex matrix measurement at a deep tissue layer. Compared to the phase-shifting method, the heterodyne-detection scheme retrieves depth-resolved complex amplitudes faster and is more stable without mechanical movement of the reference mirror. As a result, the matrix measurement speed is increased by more than one order of magnitude.
Optical imaging inside a scattering media at a depth beyond what is currently accessible poses a great challenge to biomedical communities. Great efforts have been made in various modalities to increase the depth of imaging while maintaining the microscopic resolution [1]. Among all the modalities to wrestle with the light scattering, optical coherence tomography (OCT) is able to provide depth-resolved images with high spatial resolution by adopting low coherence interferometry with a broadband light source [2,3]. Nevertheless, the penetration depth of conventional OCT is limited to the range of 1–2 mm inside human skin tissue due to the increased ratio of multiple-scattered photons to the ballistic photons along the penetration depth. The multiple photons bounced from different layers will dominate and hinder the signal retrieval of ballistic signal light when they have the same optical path difference with the reference light.
Different methods have been proposed to highlight and distinguish the ballistic signal light from the background multiple scattered light from unrelated multi-layers. One solution can be found in the concept of Doppler OCT, where the moving scatters (i.e., red cells) can be distinguished from the immobile background tissue located in an uncorrelated regime. In Doppler OCT, the raw data sequences are obtained in hundreds of temporal frames during the blood flow, and the data are analyzed for signal retrieval to identify the moving blood cell by using varied algorithms [4]. To make this method work for a static sample without moving particles, one can put the relativity theory in time-space in consideration. The effect of a moving particle in time-space is equivalent to introducing a scanning focused beam flying over the particles. The multiple scattered photons bounced between multiple layers will result in a speckle field with a complex amplitude variance distribution uncorrelated with the scanning trajectory and the particle targets, while the singly back-scattered field of the particle targets represents a strong variance distribution if the particles are scanned over by a focused light. These two different variance distributions can be acquired in the imaging plane of the targets. Inspired by that, a scanning focused beam combined with wide-field detection can be used, so that the acquired two-dimensional (2D) field of the back-scattered complex amplitude can be analyzed to retrieve the signal of singly scattered components. The wide-field detection ensures that the information of the signals (including the spatial distribution of the 2D wavefront of the back-scattered light ignored by conventional OCT), which is correlated with the illuminated target particles, can be sufficiently collected for post-processing on the basis of a matrix analysis aiming to image reconstruction in deep tissue.
Previously, en-face (transversely scanning) time-domain OCT systems have been proposed to increase the imaging depth of conventional OCT by measuring the reflection matrix of the sample (in the focal plane) followed by matrix analysis [5-7]. Different from conventional fiber-coupled scanning OCT, the photons back-scattered from the peripheral outside area of each focal spot are selectively recorded on a 2D camera sensor by using a digital pinhole filter with an enlarged aperture. Thus, hundreds of frames of pinhole-filtered back-scattered 2D complex amplitudes, each of which corresponds to one focal spot in the focal plane, were combined to form a 2D reflection matrix. This matrix, consisting of a large number of complex amplitude components [9,10], contains abundant information regarding the position and reflectivity of the targets. The singly back-scattered components were then separated as the main carrier of the target information during the post-processing of the matrix analysis to reconstruct the depth-resolved image.
The four-step phase-shifting method used in the previous works to retrieve the complex amplitude [5,7,8] is based on the mechanical movement of the reference mirror, slowing down the phase and amplitude retrieval at each scanning point. Thus, the enhanced imaging depth was achieved by sacrificing the acquisition speed in the previous method. Here, a fast process of reflection matrix measurement is proposed by using wide-field heterodyne-detection in the en-face time-domain OCT system. By tuning the optical frequency of the reference arm, the heterodyne interference signal is recorded by the lock-in camera in the output end of the interferometer [9]. The in-phase and quadrature components are retrieved from the interference signal to calculate the phase and amplitude of the sample beam. A speed increase of measuring reflection matrix by more than one order of magnitude is demonstrated. The schematic of the system to measure the complex reflection matrix of the scattering sample is in Fig. 1.
Fig. 1.

Schematic of the imaging setup. Fs laser, femtosecond pulse laser; L, lens; BS, beam splitter; PBS, polarized beam splitter; HWP, half-wave plate; LP, linear polarizer; QWP, quarter-wave plate; Obj, objective (10XOlympus Plan Achromat Objective, 0.25 NA, 10.6mm WD); SLM, phase-only spatial light modulator (Pluto-NIR-015, Holoeye, Germany); AOM, acoustic optical modulator.
The target particle is placed in the focal plane of the incident beam underneath a scattering layer. A half-wave plate (HWP) and linear polarizer (LP) pair in the incident arm, reference arm, and sample arm work as adjustable attenuators. Two acoustic optical modulators (AOMs) [405AF3, IntraAction Corp.] are cascade connected to shift the optical frequency in the reference arm by 40 kHz. To minimize the return loss of back-scattered light from the sample, the combination of a rotatable QWP with PBS1 is adopted in the sample arm.
To test the performance of the wide-field heterodyne detection, microbead targets are placed ~1 mm underneath a strong scattering sample layer, as in Fig. 2. The spatial light modulator (SLM) works as a two-axis galvo scanner by successively displaying hundreds of phase-only grating patterns that have different periods and orientations to deflect the incident beam into different diffractive angles [Fig. 2(a)]. The sample beam is focused on the top surface of the cover glass for raster scanning after passing through the objective. Like a stone being thrown into the water to trigger a wide-field wavefront distribution nearby, an extended 2D optical field will be formed around the focal spot due to the multiple refractions and inner reflections of light inside the scatterer target, if the target is just positioned on the trajectory of the focused scan beam [Fig. 2(b)]. The fast Fourier transform (FFT) is applied to the recorded complex field to reconstruct the original speckle complex field in the target plane. By using an adjustable digital pinhole in the post-processing right after FFT, only the complex field in the peripheral area of the scanning point is chosen to be reconstructed [Fig. 2(c)]. The focused beam is then scanned point-by-point along the transverse direction in the target plane; thus, the whole reflection matrix of the scanned area can be obtained by using the lock-in complementary metal–oxide–semiconductor (CMOS) camera (300x300 pixels, 16 bits, Helicam C3,Heliotis, Switzerland).
Fig. 2.

Illustration of (a) the raster scanning process of the focused beam, which is formed by phase-only grating patterns successively displayed on the SLM. Here, one grating pattern corresponds to one single focal spot in the target plane; (b) the beam is focused on the target, resulting in a wide-field distorted optical distribution around; (c) detection of the wide-field distribution in the target plane by applying FFT to the Fourier plane distribution followed by digital pinhole filtering.
The principle of wide-field heterodyne-detection of interference field in the camera sensor plane is illustrated in Fig. 3. The wave function of the light takes the general form of Aei(ωt + φ). The superposition of two light waves (the sample beam and the reference beam in the interferometer) with different frequencies and amplitudes at a fixed point (i.e., one pixel of the lockin camera) is shown below, using the complex exponential expressions:
| (1) |
where ei(ω2t) is the rapidly changing component which is undetectable by the detector, and A1ei(Δωt + φ1) + A2ei φ2 is the slowly changing component, Δω = ω1 – ω2. The corresponding detectable intensity of the interference light field is
| (2) |
Fig. 3.

Flow chart of the control signal and illustration of signal processing. (a) Hardware connection of the proposed system; (b) signal processing flow inside the driver of the lock-in camera.
If the DC item ∣A1∣2 + ∣ A2∣2 is removed as background, the remaining signal is 2A1 A2 cos(Δωt + Δφ) = I1 cos(Δωt + Δφ). Here, A2 and φ2 are the reference beam’s amplitude and phase which are regarded as the constants, since the reference beam is approximately a plane wave. The lock-in camera outputs two local oscillations (LOs) of cos(Δωt) and sin(Δωt) in two individual channels of the camera’s driving circuit. By multiplying the two LOs with the detected signal I1 cos(Δωt + Δφ), the corresponding output signals become 1/2I1 cos(Δφ) and 1/2I1sin(Δφ), since the high-frequency components are removed by a low-pass filter inside the camera. These two signals are called in-phase (I) and quadrature (Q) signals. The phase of the sample beam can be calculated by φ1 = Δφ = arctan(Q/I), and the amplitude can be calculated by . Only a constant coefficient difference exists between A1 and I1.
The I and Q signals are retrieved from the interference signal through the camera’s output function, so as to calculate the phase and amplitude profile of the back-scattered sample beam. The two profiles acquired in Fig. 4 by the proposed heterodyne-detection method have undergone only one acquisition without a frame averaging process which is time-consuming and typically adopted by the four-step phase-shifting method to improve the signal-to-noise ratio (SNR).
Fig. 4.
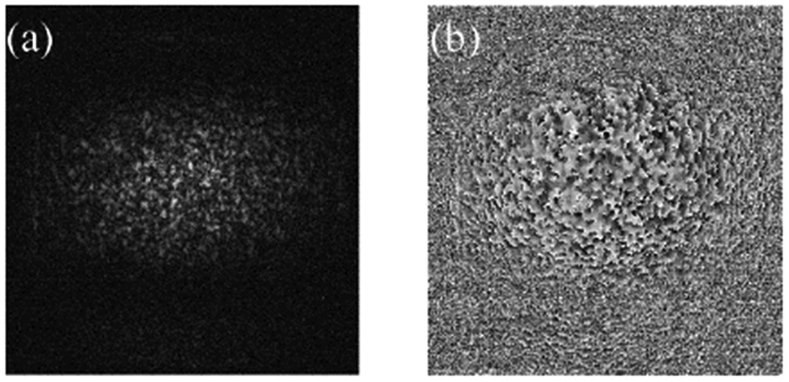
Back-scattered complex amplitude retrieval by the heterodyne-detection scheme. (a) Amplitude and (b) the phase profile in the camera plane corresponding to one scanning point, as shown in Fig. 1.
One focal spot in the target plane corresponds to one frame of 2D complex field in the sensor plane. Each frame of the 2D complex amplitude is reshaped into a vector for the matrix rearrangement. The rearrangement order complies with the scanning trajectory of the incident sample beam. Thus, hundreds of complex amplitudes are recombined into one reflection matrix for post-analysis. The digital pinhole in the target plane makes the original reflection matrix become a filtered matrix with multiple diagonals, as in Fig. 5. This step of wide-field detection with an enlarged pinhole filter is a key factor for the matrix analysis.
Fig. 5.

Combination of multiple complex frames into one filtered matrix.
After obtaining the filtered reflection matrix RM(rin, rout), a singular value decomposition (SVD) is applied to this matrix which can be expressed by the form of RM(rin, rout) = UΣV†, as in Fig. 6.
Fig. 6.

Primary component analysis for removing multiple scattering noises in the SVD process.
SVD is an effective tool for finding lower-rank approximations to a given matrix U and V are the unitary matrices whose columns correspond to the input and output singular vectors Ui and Vi, respectively. The subscript i represents the column number for the matrix U or the row number for the matrix V†. Σ is the diagonal matrix containing the real and positive singular values σi in a decreased order of σ1 > σ2 … > σN > σN+1. † is the conjugate transpose. The colors in the matrix above denote different complex values. The singular vectors Ui and Vi having the biggest singular values are chosen and reshaped from the original one-dimensional vectors into two 2D wavefronts and respectively. The reshaping order is matched with the scanning trajectory of the focused beam. The image can be reconstructed by , where σi weighting factor. Compared with the counterpart of ultrasonic imaging [8], the optical pulse and echo in our system are in the same focal plane, so there is no need to back-propagate the wavefront of and . Thus, the 2D target image is reconstructed according to the complex modulus of the Hadamard product between the two reshaped wavefronts.
In the experiment, the optical beating frequency is set at 40 kHz by tuning the two AOM drivers. To satisfy the Nyquist criterion, the matrix is measured by the lock-in camera operating at a demodulation rate of 80 kHz. The microbead images are successfully reconstructed by applying SVD onto the filtered reflection matrix followed by the reconstruction algorithm, as in Fig. 7. To demonstrate the extended imaging depth of our system compared to conventional OCT, a standard en-face OCT imaging process by conventional OCT with the same targets and scattering layer was also conducted. However, the commercial OCT (OCS1310V1 1300 nm MEMS-VCSEL swept source OCT, 100 kHz, Thorlabs) in the lab has a lateral resolution larger than 13 μm, due to low numerical aperture (NA) scan lens (OCT-LSM03, NA 0.06, Thorlabs) used. Thus, the en-face image of the microbeads with a 10 μm diameter in Fig. 7 cannot be successfully acquired by the OCS1310V1 system. To make the image results comparable, microbeads with a larger diameter (20 μm) are chosen as targets in Fig. 8, while a ~0.8 mm thickness lab-made phantom tissue (TiO2 powder dissolved in a curing agent and silicone with a scattering coefficient more than two times that of human skin) is used as the scattering layer. These microbeads made of polydimethylsiloxane (PDMS) are phase objects and evenly distributed via interference nanolithography on the same PDMS material base which is soft and flexible.
Fig. 7.

Image reconstruction results of the proposed method. (a) Two microbead targets are placed on a cover glass, while a white paper tissue (Amazon Basics 92 Bright Multipurpose Copy Paper) is put ~ 1 mm above; (b) standard microscopic image of the two TiO2 beads when the scattering paper tissue is removed; the reconstructed image of two microbeads by analyzing the filtered reflection matrix which is measured (c) without and (d) with the scattering tissue placed above.
Fig. 8.

(a) Standard en-face OCT image by Thorlabs OCS1310V1 OCT where microbeads are formed on the flexible PDMS; (b) enface OCT image of the same beads by the OCS1310V1 when the phantom tissue is put above the beads; (c) and (d) the zoomed images corresponding to the field of view inside the yellow square, as shown in (a) and (b), respectively; (e) and (f) reconstructed images of the microbeads in the same field of view, (e) without and (f) with the phantom tissue put above by the proposed matrix measurement method.
The images of microbeads are recovered successfully by the proposed method, whether or not the strong scattering tissue is placed above [Figs. 8(e) and 8(f)], while the commercial system fails to recover the image with the scattering tissue put above [Figs. 8(b) and 8(d)], even though its source has a longer center wavelength at 1310 nm. In previous systems using four-step phase shifting, the microbead image with the same tissue cannot be recovered either because of the decorrelation noises generated during the long-time measurement. The axial resolution is decided by the bandwidth of the light source, as in conventional OCT. Due to the large dispersion introduced by the AOMs and the objective, the measured axial resolution is ~20 μm, which is larger than the theoretical value and can be improved by further dispersion compensation in both arms. According to the Nyquist sampling criterion, the lateral resolution is two times that of the distance between each scanning point, that is, two times larger than conventional OCT. The lateral resolution in the current system is ~4 μm. One drawback of the heterodyne detection is that the pixel pitch of the lock-in camera is as large as 40 μm, which decreases the SNR of the recovered image.
In summary, deep tissue imaging at a depth beyond conventional OCT is demonstrated by combining the reflection matrix measurement with the wide-field heterodyne detection. The number of scattering mean free paths (MFPs) of the tissue is measured as 16.4 [7], approximately two times deeper than conventional OCT (which can image at a depth with ~6-9 scattering MFPs according to the literature) [5,10]. Here the number of scattering MFPs is measured according to Refs. [5,7]. The photodetector (DCC1645C, Thorlabs) used to measure the MFP is placed ~1 m away from the scattering layer. By using a detector with higher sensitivity and lower noise level, the ratio of ballistic light to scattering light can be further decreased, and the calculated number of scattering MFPs regarding the tissue will increase. Importantly, the speed of matrix measurement is improved by one order above by using a wide-field heterodyne-detection method with the lock-in camera. The consuming time of matrix measurement in the proposed system is ~6 min for 961 scanning points, compared with ~20-30 min for only 289 scanning points in previous works [5,7]. That is, the speed is ~0.37 sec/pt versus ~4.15 sec/pt, a significant improvement of more than one order of magnitude. The current matrix measurement speed is mainly limited by the liquid crystal SLM. Using the full speed of the lock-in camera (operated at 3800 fps) enables the entire scattering matrix to be acquired in just seconds. This experiment paves the way for deep tissue imaging in the next phase by using living tissues.
Acknowledgment.
The authors thank Kaustubh Asawa and Prof. Chang-Hwan Choi at the Stevens Institute of Technology for providing the PDMS samples.
Funding. National Institutes of Health (R01EY-026091, R01EY-028662, R01HL-125084, R01HL-127271).
Footnotes
Disclosures. Dr. Zhongping Chen has a financial interest in OCT Medical Imaging, Inc., which, however, did not support this Letter.
REFERENCES
- 1.Gigan S, Nat. Photonics 11, 14 (2017). [Google Scholar]
- 2.Fujimoto J and Swanson E, Invest. Ophthalmol. Visual Sci 57, October1 (2016). [DOI] [PMC free article] [PubMed] [Google Scholar]
- 3.Borycki D, Hamkalo M, Nowakowski M, Szkulmowski M, and Wojtkowski M, Biomed. Opt. Express 10, 2032 (2019). [DOI] [PMC free article] [PubMed] [Google Scholar]
- 4.Liu G, Lin A, Tromberg B, and Chen Z, Biomed. Opt. Express 3, 2669 (2012). [DOI] [PMC free article] [PubMed] [Google Scholar]
- 5.Badon A, Li D, Lerosey G, Boccara A, Fink M, and Aubry A, Sci. Adv 2, el600370 (2016). [DOI] [PMC free article] [PubMed] [Google Scholar]
- 6.Kang S, Jeong S, Choi W, Ko H, Yang T, Joo J, Lee J, Lim Y, Park Q, and Choi W, Nat. Photonics 9, 253 (2015). [Google Scholar]
- 7.Yang Q, Miao Y, Huo T, Li Y, Heidari E, Zhu J, and Chen Z, Appl. Phys. Lett 113, 011106 (2018). [DOI] [PMC free article] [PubMed] [Google Scholar]
- 8.Popoff S, Lerosey G, Carminati R, Fink M, Boccara A, and Gigan S, Phys. Rev. Lett 104, 100601 (2010). [DOI] [PubMed] [Google Scholar]
- 9.Liu Y, Ma C, Shen Y, and Wang LV, Opt. Lett 41, 1321 (2016). [DOI] [PMC free article] [PubMed] [Google Scholar]
- 10.Pan Y, Birngruber R, and Engelhardt R, Appl. Opt 36, 2979 (1997). [DOI] [PubMed] [Google Scholar]