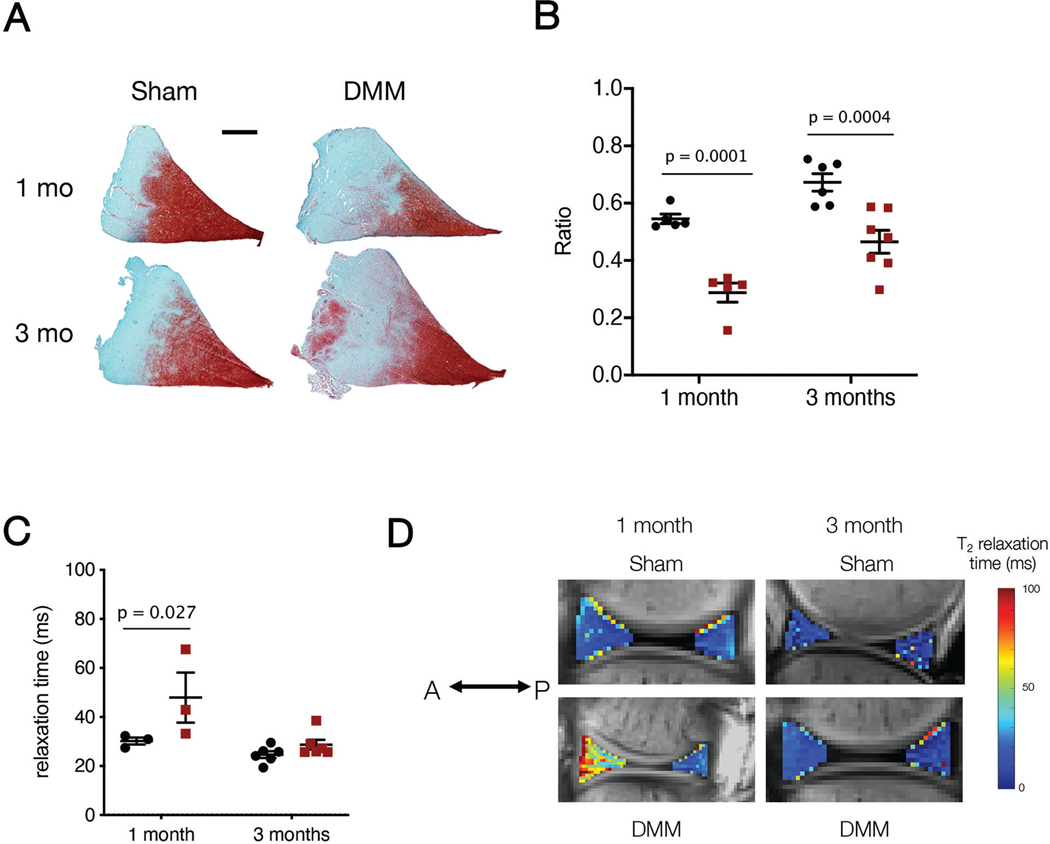
Abstract
The meniscus plays a central load bearing role in the knee joint. Unfortunately, meniscus injury is common and can lead to joint degeneration and osteoarthritis. In small animal models, progressive degenerative changes occur with unloading of the meniscus via destabilization of the medial meniscus (DMM). However, few large animal models of DMM exist and the joint-wide initiation of disease has not yet been defined in these models. Thus, the goal of this study was to develop and validate a large-animal model of surgically-induced destabilization of the medial meniscus and to use multi-modal (mechanical, histological, and MRI) and multi-scale (joint to tissue level) quantitative measures to evaluate degeneration in both the meniscus and cartilage. DMM was achieved using an arthroscopic approach in thirteen Yucatan minipigs. One month after DMM, joint contact area decreased and peak pressure increased, indicating altered load transmission as a result of meniscus destabilization. By three months, the joint had adapted to the injury and load transmission patterns were restored to baseline, likely due to the formation and maturation of a fibrovascular scar at the anterior aspect of the meniscus. Despite this, we found a decrease in the indentation modulus of the tibial cartilage and an increase in cartilage histopathology scores at one month compared to Sham operated animals; these deleterious changes persisted through three months. Over this same time course, meniscus remodeling was evident through decreased proteoglycan staining in DMM compared to Sham menisci at both one and three months. These findings support that arthroscopic DMM results in joint degeneration in the Yucatan minipig and provides a new large animal test bed in which to evaluate therapeutics and interventions to treat post-traumatic osteoarthritis (PTOA) that originates from meniscal injury.
Keywords: meniscus, destabilization, cartilage, minipig, knee
Introduction:
Given the centrality of the meniscus in knee function, it is commonly injured. More than 850,000 surgical meniscal repairs are performed annually in the United States, with an annual incidence of 66 tears per 100,000 persons.1,2 Surgical intervention most often consists of a partial meniscectomy, particularly when the tear occurs in the inner zone. This is due to the lack of vascularity in this region coupled with a low meniscal cellularity in adults,3 which limits endogenous healing capacity4–6 and predisposes any repair attempt to failure. Unfortunately, partial or complete meniscus injury and subsequent meniscectomy results in degenerative changes and accelerates the onset of osteoarthritis (OA) in that knee compartment.7–10 A number of retrospective studies7,8,11–13 support a correlation between meniscus removal and early OA. This may be due to increased stress on the underlying tibial plateau14 after tissue excision. Additionally, there is a positive correlation between the time since meniscal injury and onset of OA.7 Given that altered joint loading is associated with the development of OA, it is vital to understand how meniscal injury affects joint health.
Translational animal models have increasingly focused on meniscal pathology and subsequent joint disease. For example, small animal models have been used with much success to determine downstream effects of meniscal injury or meniscus insufficiency. Most notably, destabilization of the medial meniscus, or DMM, reliably induces OA in mice within four weeks.15 DMM has been used to characterize the progression of post traumatic OA (PTOA) functionally, structurally, biochemically, and biologically, and to assess the validity of various biological and surgical interventions in small animal models.15–19 The mouse knee joint is significantly smaller than the human joint, however, which limits the scope of this translational model. For example, the average cartilage thickness in mice is 50 microns20, whereas in humans, knee cartilage is ~ 2 mm thick.21
While most agree that large animal models are a necessary next step in translation, there is not yet consensus on which large animal is a gold standard for meniscus research,22 with each model having some strengths and weaknesses23. Indeed, a number of large animal meniscus injury/joint degeneration models have been developed across a range of species.24–27 Of particular note, Waller and colleagues developed an excisional model in the anterior horn of the Yucatan minipig using an open approach and showed marked degradation of the joint cartilage at 6 months.25 In a similar anterior horn excision procedure in sheep, Oláh and colleagues also saw marked degeneration at both 6 weeks and 6 months post injury26. In a canine model, Luther and colleagues developed an arthroscopic approach to bisect the posterior medial meniscus, creating a meniscal release injury model. This injury resulted in cartilage degeneration as evidenced by India Ink staining, arthroscopic and radiographic assessment, lameness measures, and histology.27–29
The goal of this study was to expand the number of large animal models available by developing and validating a DMM model (i.e. detachment of the anterior enthesis, only) in a Yucatan minipig model. To further isolate the role of the meniscus in degenerative outcomes relative to changes that occur with arthrotomy (open surgery), we used a minimally invasive arthroscopic approach. Using rigorous multi-modal (mechanical, histological, MRI) and multi-scale (joint to tissue level) quantitative outcomes, this study demonstrated persistent degenerative alterations in the meniscus and cartilage of the Yucatan minipig after arthroscopic destabilization of the medial meniscus. Our findings provide a new, minimally invasive large animal test bed in which to evaluate therapeutics and interventions to treat post-traumatic osteoarthritis (PTOA) that originates from meniscal insufficiency.
Methods:
Study design
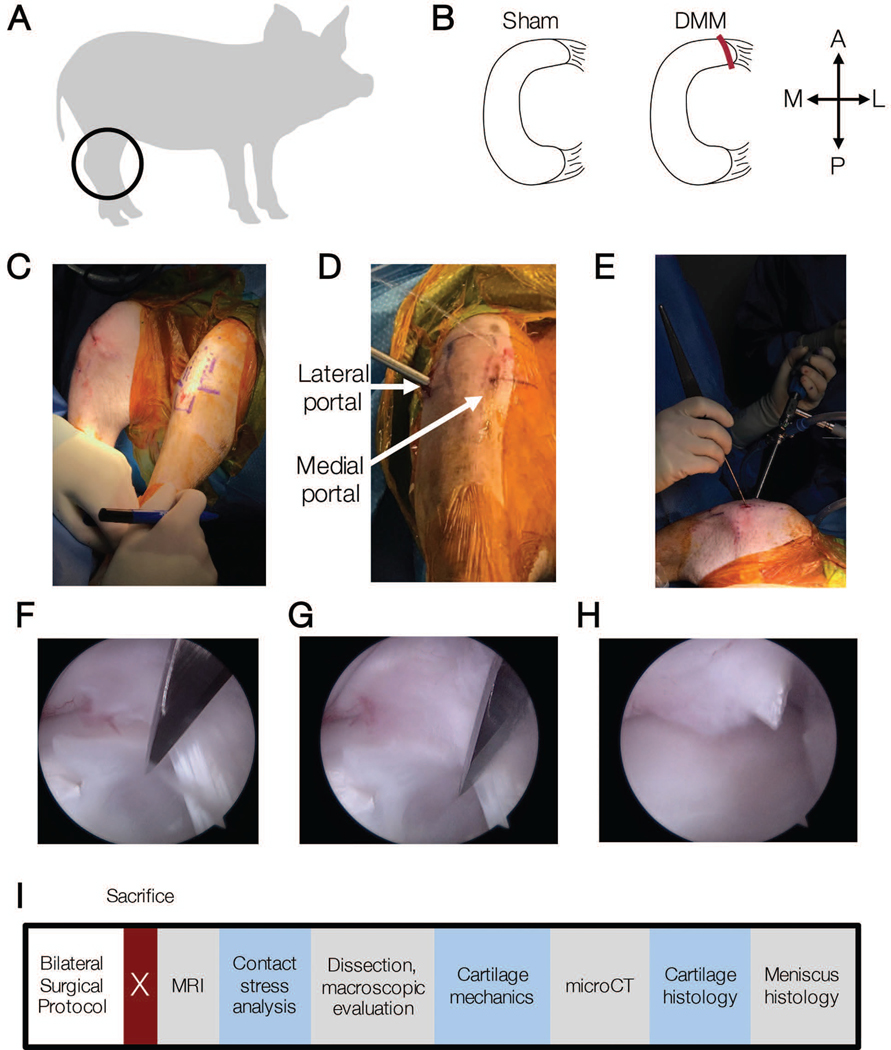
To carry out this study, arthroscopic surgery was performed on 24 stifle joints of juvenile Yucatan minipigs (Figure 1A) (Sinclair Bioresources, average age: 6.8 ± 0.4, range: 6.2–7.7 months; castrated males, average weight: 27.67 ± 4.6 kg, range: 19–34 kg; n = 24 joints total) with approval by the Institutional Animal Care and Use Committee of the University of Pennsylvania. Animals were housed individually in adjacent pens with open, sliding walls to allow for socialization in accordance with IACUC guidelines for social animals. Animals were singly housed for a maximum of 1 week following surgery. Animals were euthanized at one or three months following surgery. Experimental conditions included an arthroscopic Sham control (n = 5 at one month, n = 6 at three month) and a destabilization of the medial meniscus15 (DMM, n = 6 at one month, n = 7 at three month) (Figure 1B).
Figure 1.
A) Juvenile Yucatan minipigs (6 months) underwent bilateral hindlimb surgery and received B) Sham or DMM surgical procedures. A = anterior, P = posterior, M = medial, L = lateral. C) Pre-operative image showing joint markings to aid in portal placement. D) Intraoperative image showing locations of lateral and medial portals, and E) arthroscopic camera and probe locations. F) Intra-arthroscopy movie of DMM procedure and G) still images immediately prior to DMM procedure and H) after severing the anterior attachment. I) Timeline of outcome measures post-euthanasia.
Animal model and surgical procedures
To arthroscopically access the medial meniscus, a lateral parapatellar 2 cm vertical skin incision was made with a number 11 scalpel blade (Figures 1C–E). A trocar and arthroscopic probe were placed in the lateral aspect of the joint and sterile Lactated-Ringers solution was used for insufflation. A 1.5-inch, 18 gauge needle was inserted into the medial aspect of the joint as a guide to directly visualize the location of a medial portal. An arthroscopic shaver (Stryker, Kalamazoo, MI) was used to trim the fat pad to enhance visualization of the medial meniscus and guide needle. Once the medial meniscus was adequately exposed, a number 11 scalpel blade was used to create a medial portal in the location and at the angle of the needle. In all procedures, visualization was achieved through the lateral portal while the medial portal was reserved for a surgical injury tool or a probe. In sham surgeries, a probe was used to validate that the medial meniscus was attached to the tibial plateau. In DMM procedures, the anterior horn of the medial meniscus completely transected15 with a number 11 scalpel blade without removal of any tissue. A probe was utilized to confirm that the meniscus was completely detached and mobile at the time of surgery (Figures 1F–H).
Magnetic Resonance Imaging (MRI)
Post euthanasia, the intact hindlimbs were isolated and excess musculature was removed. Joints were wrapped in PBS-soaked pads for short term storage prior to MRI analysis. Samples were scanned in a Siemens Prisma 3T scanner using two different MRI sequences – a high resolution T1 VIBE sequence (0.216 × 0.216 × 0.400 mm, TR = 10 ms TE=3.45 ms) to guide segmentation and a multi-slice-multi-echo (MSME) T2-weighted mapping sequence (0.586 × 0.586 × 3.00 mm, TR = 3090 ms, TE = 10, 20, … 70 ms) to determine T2 time which is correlated to water content and degradation of the fibrous network of tissues.30 Total scan time was 20–25 minutes, after which samples were frozen prior to measurement of load transfer in the joint. T2 relaxation time was calculated ignoring the first echo because of noticeably low signal in the data that was likely due to imperfect refocusing pulses.31 T2 relaxation time was analyzed in the cartilage-cartilage and cartilage-meniscus contact areas of the medial tibial plateau, as well as in the anterior and posterior horns of the medial meniscus. For each region of interest, the signal was averaged across the volume then the average signal was curve fit to a noise corrected exponential decay to determine T2 time.32 The noise corrected exponential curve fit has been shown to be more robust to low signal-to-noise ratios and less bias compared to monoexponential fitting, which is particularly important in the meniscus where signal is very low.
Measurement of load transfer in the stifle
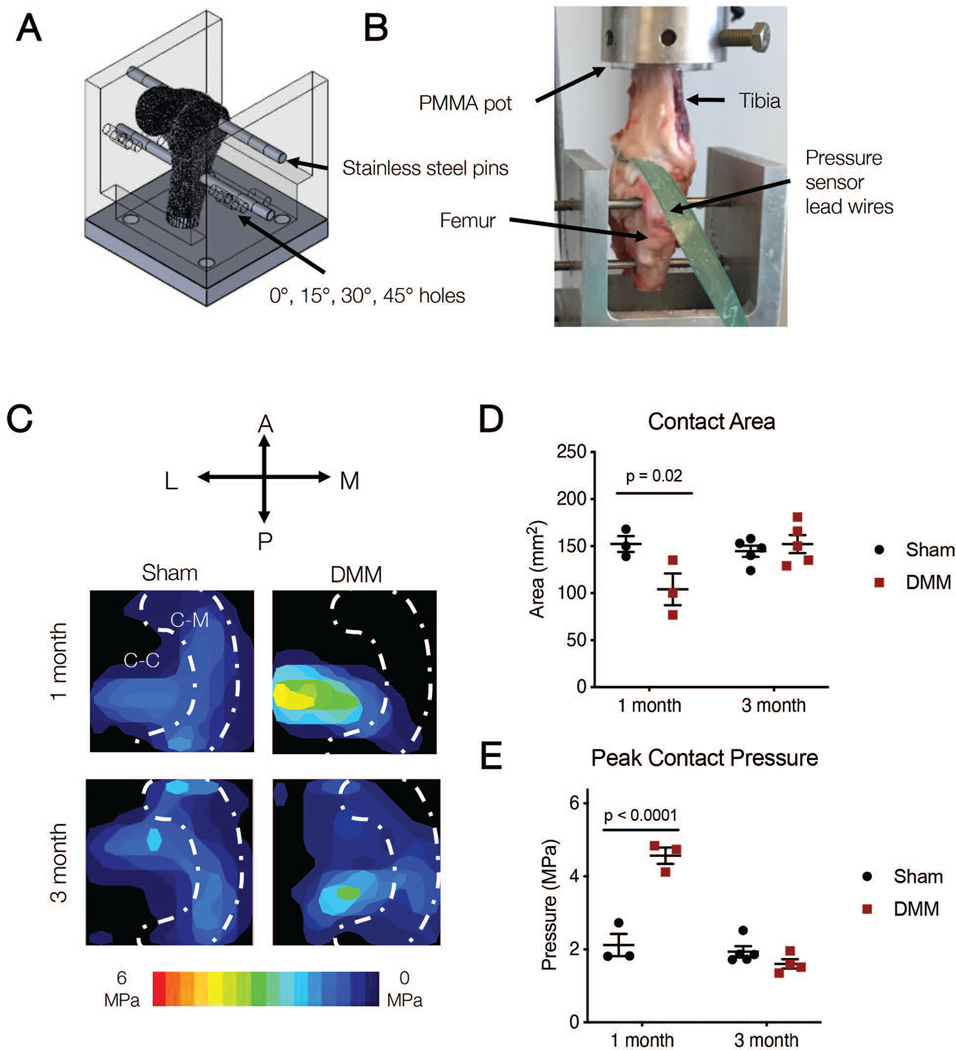
After MRI, stifles were dissected further and subjected to analysis of load transfer through the meniscus in the medial compartment. Specifically, patellae were removed while preserving the remaining joint capsules, medial and lateral meniscal attachments, and the four major stabilizing ligaments (MCL, LCL, ACL, PCL). Knee joints were isolated from the remainder of the hindlimb with an oscillating saw ~10 cm above and below the joint line. Tibiae were potted in polycarbonate tubes with poly(methyl-methacrylate) (PMMA, Ortho Jet, Lang Dental Manufacturing Company Incorporated, Wheeling, IL). A 7.9 mm diameter hole was drilled straight into the sagittal plane of the femoral head at the approximate center of rotation. An additional 7.9 mm diameter hole was drilled in the same plane, approximately 38 mm proximal to the first set of drilled holes. A custom aluminum testing jig in combination with 6.35 mm diameter stainless steel pins was used to fix the joints at desired flexion angles33 (Figure 2A). Thin film pressure sensors (I-Scan 6900, TekScan Boston MA) were equilibrated and calibrated no more than 24 hours before testing using previously established methods.34 Sensors were sealed with two layers of waterproof tape35 with extended tabs to facilitate insertion into the joint. Medial joint capsules were dissected with a number 11 blade for pressure sensor insertion without transection of the MCL and sensors were inserted under the meniscus from the anterior aspect of the joint. The tabs were fixed to the posterior aspect of the joint to secure sensors in the joint space as needed. Varus/valgus alignment was controlled with the use of a universal joint in the testing set up, allowing for rotational freedom of the tibia such that the femoral condyles freely settled into the medial and lateral compartments of the tibial plateau when compressive loads were applied. Joints were then fixed to 45 degrees of flexion due to porcine knee anatomy36,37 (Figure 2B). A universal test frame (TA Instruments, ElectroForce 3550, Eden Prairie, MN) was used to load joints between 10–400 N (approximately 1 body weight loading) for 100 cycles at 1 Hz with a sinusoidal waveform. Contact areas and peak contact pressures were recorded when 100 N was measured on the medial compartment.38 Estimates of the meniscal footprint were determined based on macroscopic observation of the location of the meniscus and the sensor positioning in the joint.
Figure 2.
A) Schematic of whole joint locked flexion angle loading rig, and B) photo of testing set up with inserted pressure sensor. C) Representative contact stress maps on the tibial plateau at 100 N total load on the tibial plateau at 45 degrees of flexion at one and three months. White dashed line outlines estimate of the location of the meniscus, showing Cartilage-Meniscus (C-M) and Cartilage-Cartilage (C-C) contact areas. D) Total contact area and E) peak contact pressure calculated from contact maps at 45 degrees of flexion at one and three months.
Macroscopic assessment of the joint
Following pressure distribution analysis, joints were then disarticulated by severing the capsule and collateral ligaments, taking care to minimize disruption to cartilaginous surfaces and menisci. Gross images (Figure 3) were taken of the femoral condyles, tibial plateaus, and menisci.25,39,40 India ink staining was performed on the cartilaginous surfaces and gross images were taken of these surfaces.27,41
Figure 3.
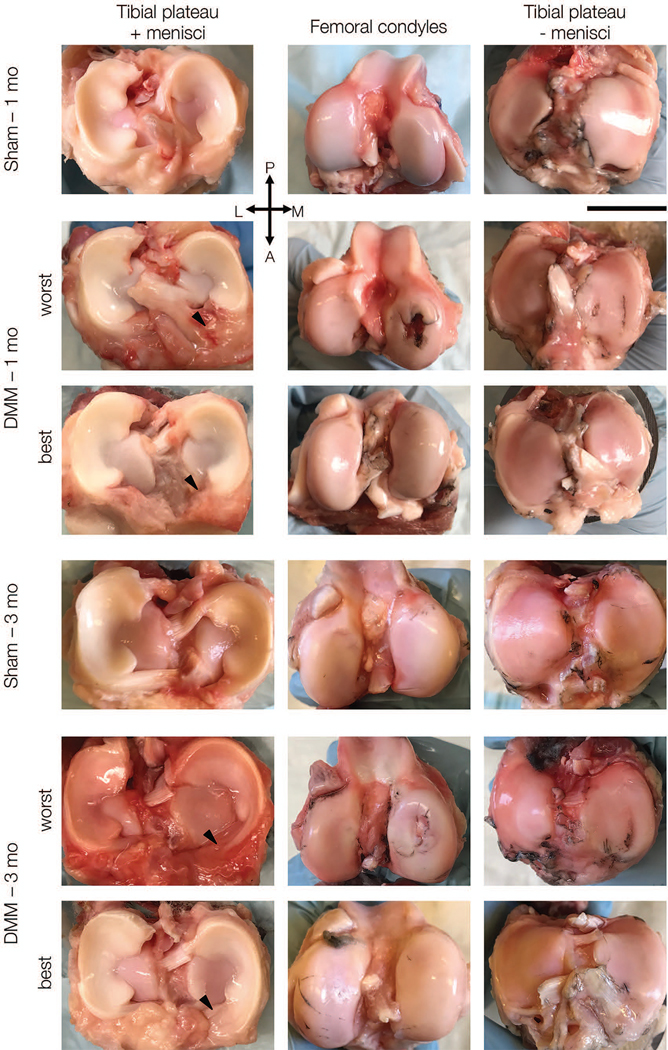
Representative macroscopic images of menisci on tibial plateau (left), femoral condyles (middle) and tibial plateaus without menisci (right) at one and three months. For DMM group, best and worst appearing joints are shown. Scale bar = 2 cm. (P = posterior, A = anterior, L = lateral, M = medial).
Measurement of cartilage mechanical properties
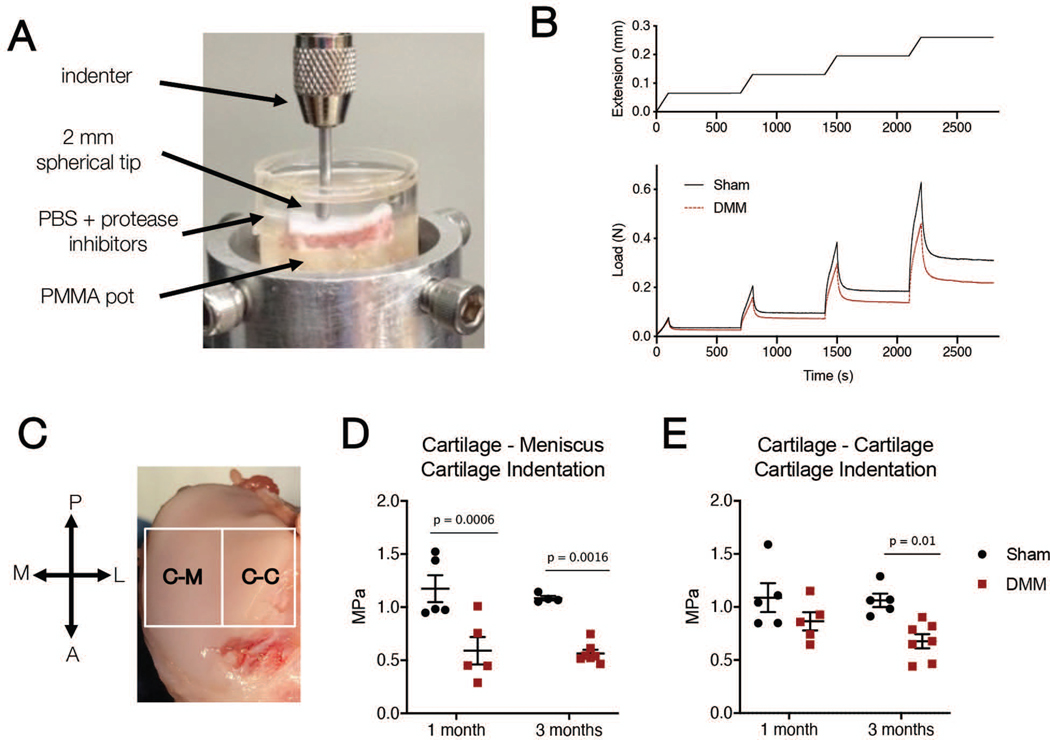
Osteochondral segments of the medial tibial plateau (width: whole medial-lateral distance of the medial plateau, length: approximately 20 mm in the middle of the anterior-posterior direction) were isolated from each joint, potted in PMMA, and hydrated with PBS with protease inhibitors (Sigma Aldrich, St. Louis, MO) to prevent degradation during testing (Figure 5A). Indentation testing was performed using a custom testing rig as reported previously.42 Samples were oriented perpendicularly to an impermeable stainless steel 2 mm diameter spherical indenter. Four consecutive 10% strain stress-relaxation tests were performed at a rate of 0.1% strain/s with 600 seconds of relaxation between each step. Data were collected at 10 Hz and used to calculate equilibrium modulus at the 20% strain step (Figure 5B). Samples were indented at the center of either the cartilage-cartilage (area not covered by the meniscus) or the cartilage-meniscus contact area (Figure 5C).
Figure 5.
A) Photo of cartilage indentation testing set up. B) Indentation was performed separately on samples taken from the Cartilage-Meniscus (C-M) and Cartilage-Cartilage (C-C) contact areas. (P = posterior, A = anterior, M = medial, L = lateral). C) Example compression (top) and load (bottom) versus time curves for Sham (solid) and DMM (dashed) samples from the C-M region. D) Cartilage indentation modulus in the cartilage-meniscus and E) cartilage-cartilage regions in Sham and DMM operated joints reported at the 20% strain step for one month and three month samples.
Micro-computed tomography of osteochondral segments
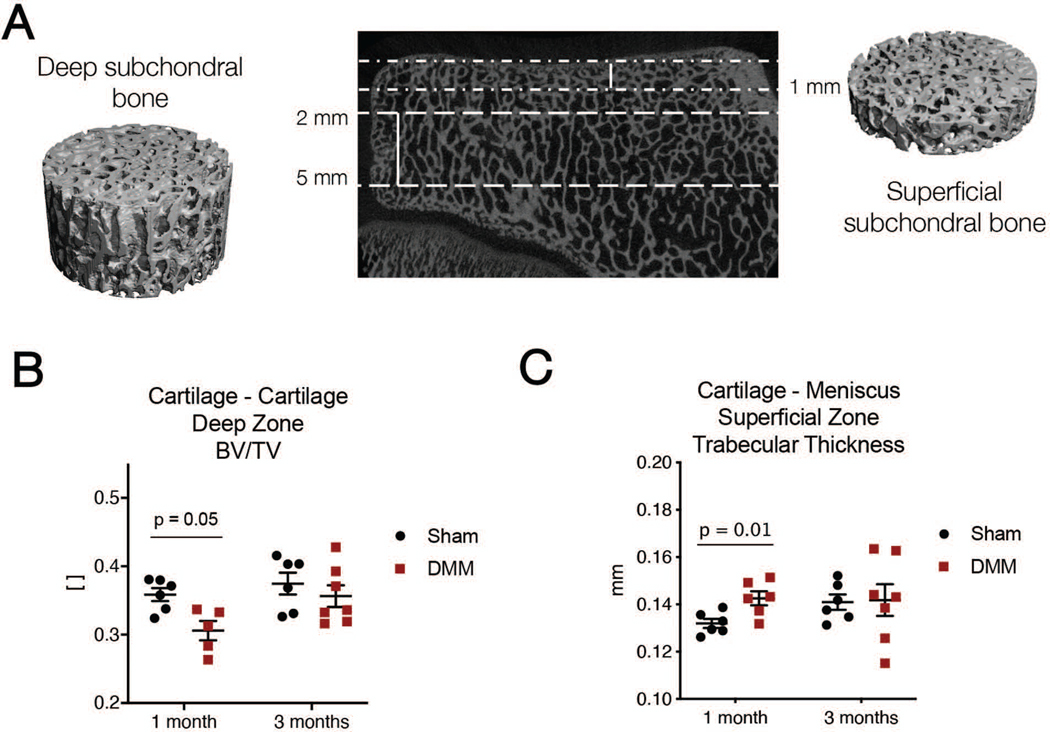
Osteochondral specimens were removed from pots after indentation testing and fixed in 10% Neutral Buffered Formalin (Sigma Aldrich, St. Louis, MO) for at least 24 hours. Micro-computed tomography (μCT) scans for each specimen was performed using a micoCT50 (Scanco, Wayne, PA). Specimens were scanned at 70 kV and 85 μA to image the subchondral bone. Cylindrical volumes of interest (VOI) were created in both the cartilage-cartilage and cartilage-meniscus contact areas. VOI diameter was 5 mm and height was either 3 mm for deep volumes or 1 mm for superficial volumes. Deep volumes started 2 mm from the cartilage surface and extended downwards from there. Superficial volumes extended 1 mm from the cartilage-bone interface39,40,43 (Figure 6A). In each VOI, bone volume per total volume and trabecular thickness were computed.
Figure 6.
A) Schematic of subchondral bone zones for analysis, where “deep” zones are 2 to 5 millimeters deep from the cartilage surface and “superficial” zones are 1 mm deep from the surface. B) Bone volume/total volume ratio in the cartilage-cartilage region and C) trabecular thickness in the cartilage-meniscus tibial plateau region in Sham and DMM operated joints at one and three months after surgery.
Cartilage Histology
After microCT, specimens were decalcified (Formical-2000; Thermo Fisher Scientific, Pittsburgh, PA) for 21 days and embedded in paraffin wax prior to sectioning for histological analysis. Eight-micron thick sections were stained with safranin-O/fast green to visualize proteoglycans and matrix proteins3 (Figure 7A, B). Five blinded reviewers scored the microscopic histological cartilage images according to the OARSI histopathology guidelines for sheep and goats.44 Samples from each time point were stained and scored independently. Scores were averaged across reviewers.
Figure 7.
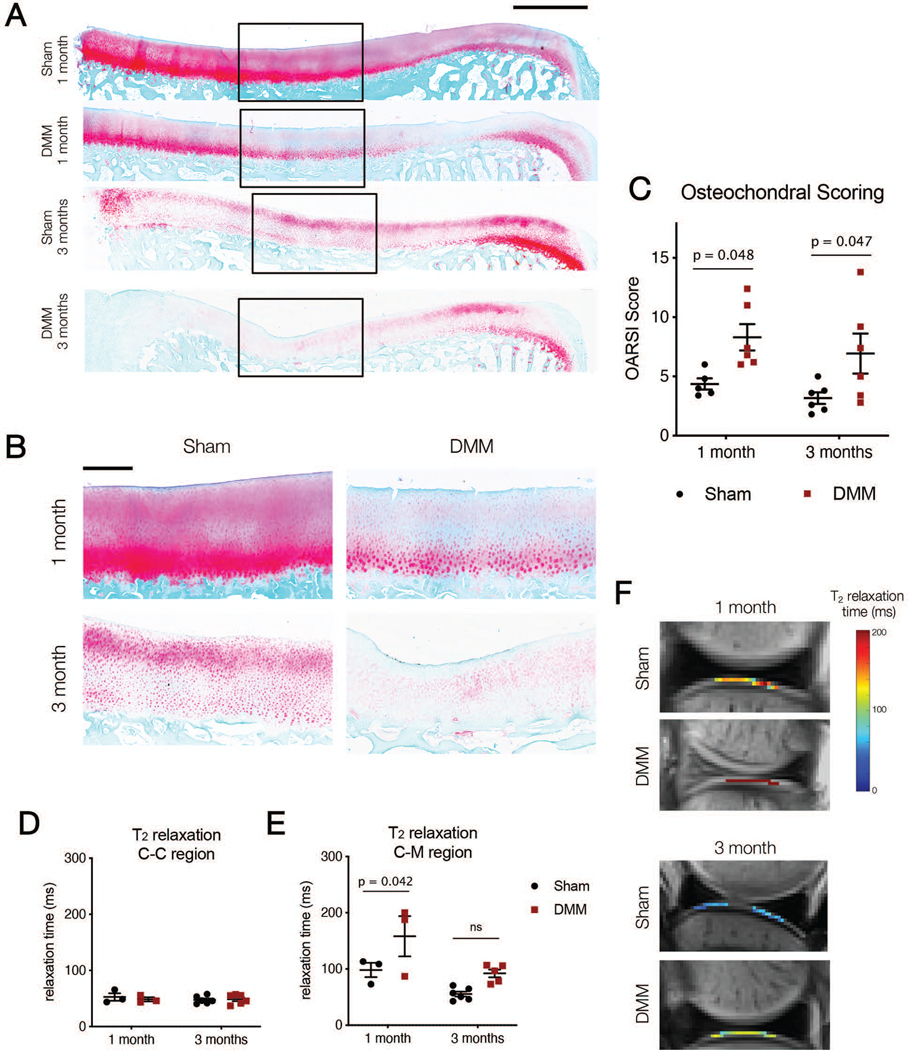
A) Osteochondral histology (Safranin O/Fast Green) for entire tibial plateau in Sham and DMM samples showing mean response. Scale bar = 2 mm. B) Zoom in images of osteochondral sections for Sham and DMM samples at one and three months. Scale bar = 500 microns. C) OARSI scoring for each condition at one and three months. D) T2 relaxation times in the cartilage-cartilage (C-C) and E) cartilage-meniscus (C-M) regions for Sham and DMM samples at one and three months. F) Representative T2 images of the C-M region from Sham and DMM samples at one and three months.
Meniscus Histology
In addition to cartilage samples, medial menisci were dissected from the tibial plateau, and the anterior and posterior horns were retrieved and embedded in Optimal Cutting Temperature (OCT) compound. Anterior and posterior horns were cryosectioned to produce 16-micron thick wedge-shaped cross-sections and were subjected to histological assessment (Figure 8A). Sections were fixed in 10% Neutral Buffered Formalin (Sigma Aldrich, St. Louis, MO) for 10 minutes prior to safranin-O/fast green staining to visualize proteoglycan and matrix content.45,46 The percent area of positive safranin-O staining was calculated using FIJI. Additionally, the anterior attachment of Sham menisci and fibrovascular scar of DMM menisci was isolated, cryosectioned to a 16 micron thickness, and stained with hematoxylin and eosin (H&E) for tissue structure and cellularity3,6 (Figure 4).
Figure 8.
A) Median meniscus histology (Safranin O/Fast Green) for Sham and DMM medial menisci in the anterior horn at one and three months. Scale bar = 2 mm. B) Quantification of Safranin O ratio for Sham and DMM medial menisci. C) T2 relaxation from MRI analysis of the meniscus anterior horn (AH). D) Representative T2 relaxation images from the anterior horn of Sham and DMM samples at one and three months (A = anterior, P = posterior).
Figure 4.
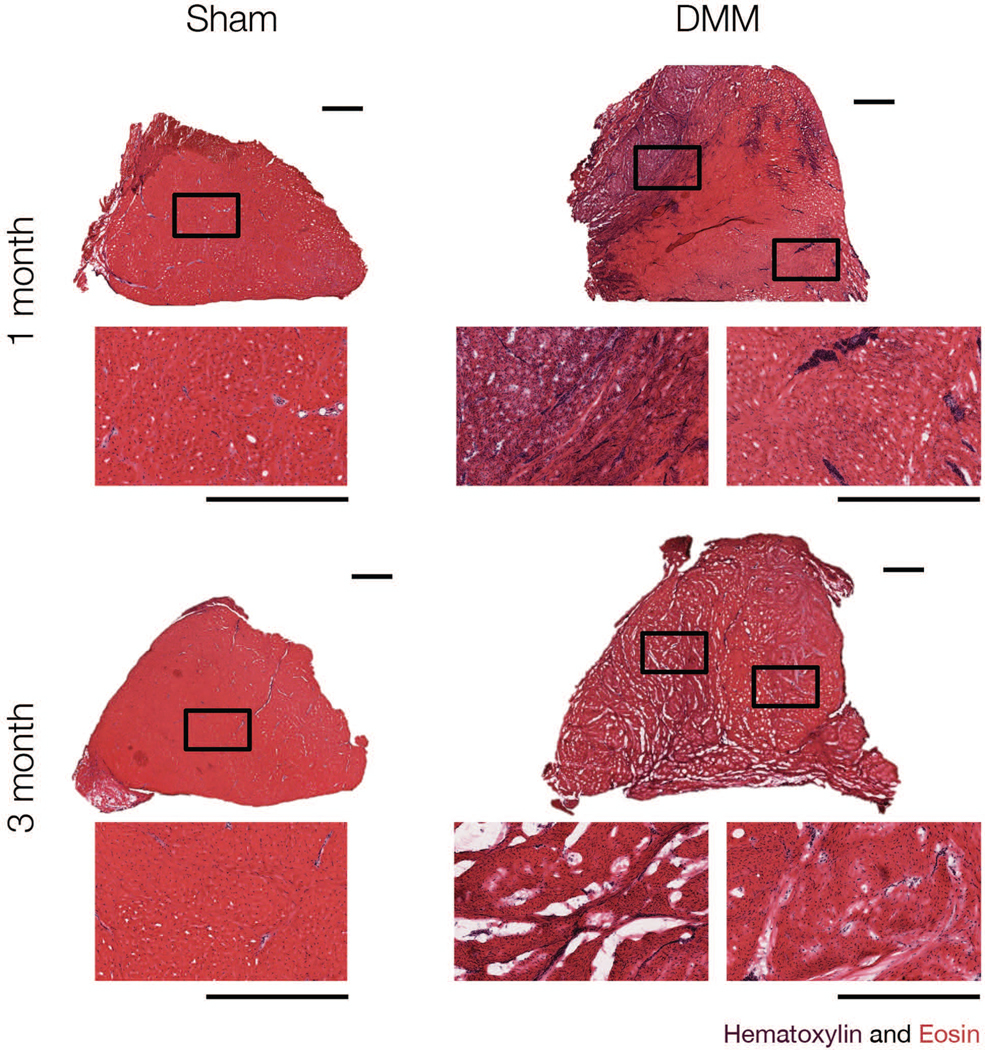
Representative hematoxylin and eosin staining of Sham and DMM anterior attachments, at one and three months. Scale bar = 1 mm.
Statistical Analysis
Statistics were performed in GraphPad Prism 8 (San Diego, CA) within time points. Sham and DMM treatments and time points were compared using two-way ANOVAs with a Bonferroni correction when assessing all outcome measures. For assessing cartilage mechanical properties, subchondral bone analysis, MRI measurements, and meniscus histology quantification, assessment location (i.e. cartilage-cartilage region and cartilage-meniscus region or anterior and posterior meniscal horns) were separated and statistics were performed independently.
Results:
Surgical details and post-surgical recovery
All animals returned to a standing position within 60 minutes post operatively and were weight bearing as tolerated within one day. The average surgical time per limb was 37 ± 19 minutes, with no significant differences between sham and DMM surgeries (p = 0.10). No animals were removed from the study and all study animals returned to normal activities after surgery, regardless of the specific surgical intervention.
Load transmission through the knee after DMM
Joint contact pressure maps were used to determine how and where loads were transferred through the joint after DMM (Figure 2C). At one month, in sham-operated joints, contact area spanned both cartilage-cartilage and cartilage-meniscus contact areas, whereas DMM joints showed a concentration of load in the cartilage-cartilage region. Specifically, DMM joints showed a decrease in contact area compared to Sham (DMM: 104.0 ± 29.2 mm2, Sham: 152.3 ± 14.7 mm2, p = 0.02) (Figure 2D). Peak pressure in DMM joints was more than twice that of sham joints (DMM: 4.6 ± 0.4 MPa, Sham: 2.1 ± 0.5 MPa, p < 0.0001) (Figure 2E). By 3 months post-surgery however, load transfer in the joint had returned to baseline levels. Specifically, DMM joints showed a similar contact area compared to sham at three months (DMM: 152.2 ± 21.6 mm2, Sham: 144.6 ± 13.3 mm2, p = 0.80) (Figure 2D). The peak pressure in DMM joints was also similar to that of sham joints (DMM: 1.6 ± 0.3 MPa, Sham: 1.9 ± 0.3 MPa, p = 0.40) (Figure 2E).
Macroscopic joint assessment after DMM
Sham joints showed minimal evidence of wear at either the one or the three month time point. DMM joints were variable in the extent of macroscopic damage observed on the tibial plateau and femoral condyles, with three of six joints showing no wear (as indicated by India ink), two joints each showing minor damage at the anterior aspect of the medial femoral condyle or anterior aspect of the medial tibial plateau, and one joint showing a significant cartilage lesion on the medial femoral condyle and corresponding tibial plateau. Additionally, four of six DMM joints showed a large contiguous fibrovascular scar tissue at the location of the severed anterior attachment. At three months, three of seven joints showed obvious evidence of chondral lesions on the medial femoral condyle, two joints showed minor damage at the anterior aspect of the medial femoral condyle or anterior aspect of the medial tibial plateau, and the remaining two joints showed minor to no evidence of cartilage wear. In addition to a more developed (compared to one month) fibrovascular scar in the anterior aspect of the joint in six of seven DMM joints, three also showed substantial meniscal narrowing at the anterior horn (Figure 3). Hematoxylin and eosin staining indicated high cellularity in the fibrovascular scar in DMM menisci at one month; at three months this cellularity had decreased slightly (Figure 4).
Cartilage mechanics after DMM
Indentation testing showed changes in cartilage mechanics in the tibial plateau at one and three months following DMM surgery. In the cartilage-meniscus contact region, there was a significant decrease in the cartilage indentation modulus in the of DMM joints compared to Sham joints at both one month (Sham: 1.17 ± 0.28 MPa, DMM: 0.59 ± 0.29 MPa, p = 0.0006, 50% decrease) and three months (Sham: 1.09 ± 0.04 MPa, DMM: 0.56 ± 0.09 MPa, p = 0.0016, 50% decrease) (Figure 5D). In the cartilage-cartilage contact region, there were no significant differences in cartilage indentation modulus between Sham and DMM joints at one month (Sham: 1.09 ± 0.30 MPa, DMM: 0.87 ± 0.19 MPa, p = 0.22, 20% decrease). However, there was a significant decrease in properties in this region at three months (Sham: 1.06 ± 0.14 MPa, DMM: 0.68 ± 0.18 MPa, p = 0.01, 35% decrease) (Figure 5E).
Subchondral bone morphology after DMM
MicroCT analysis was used to evaluate changes in the subchondral bone after Sham and DMM procedures. Deep (2 mm – 5 mm from cartilage surface) boney regions only showed transient differences in bone volume/total volume in the cartilage-cartilage contact region (one month Sham: 0.36 ± 0.02, one month DMM: 0.30 ± 0.03, p = 0.05; three month Sham: 0.38 ± 0.04, three month DMM: 0.36 ± 0.04, p = 0.75) (Figure 6B). There were no other differences in cartilage-meniscus regions or in trabecular thickness (data not shown) after DMM. Likewise, the superficial (1 mm from surface) regions showed only transient and small differences in trabecular thickness in the cartilage-meniscus contact region (one month Sham: 0.13 ± 0.005, one month DMM: 0.14 ± 0.007, p = 0.01; three month Sham: 0.14 ± 0.008, three month DMM: 0.14 ± 0.02, p = 0.91) (Figure 6C). There were no other differences in the cartilage-cartilage regions or in bone volume/total volume in any region (data not shown) after DMM.
Histological assessment of tibial cartilage and meniscus after DMM
An increase in histopathology score was observed in DMM compared to Sham cartilage at both one month (Sham: 4.4 ± 1.1, DMM: 8.3 ± 2.7, p = 0.048) and three months (Sham: 3.2 ± 1.2, DMM: 6.9 ± 4.1, p = 0.047) (Figure 7C). Meniscus staining also showed sustained differences as a consequence of DMM surgery. The anterior horn of menisci in Sham joints had a significantly higher proteoglycan ratio than in DMM joints at one month (Sham: 0.55 ± 0.04 a.u., DMM: 0.29 ± 0.07 a.u., p < 0.0001) (Figure 8B). These differences persisted through three months (Sham: 0.67 ± 0.08 a.u., DMM: 0.46 ± 0.11 a.u., p = 0.0004). Changes in staining were only observed in the posterior horn at the later time point (one month, Sham: 0.36 ± 0.09 a.u., one month, DMM: 0.25 ± 0.05 a.u., p = 0.15; three month Sham: 0.42 ± 0.11 a.u., three month DMM: 0.27 ± 0.12 a.u., p = 0.03) (data not shown).
MRI findings after DMM
MRI of intact joints was carried out to non-invasively assess changes in the cartilage and meniscus structure and composition. In the cartilage-cartilage contact region, there were no differences in T2 time between Sham and DMM joints at either time point (one month Sham: 52.3 ± 11.5 ms, one month DMM: 48.1 ± 6.4 ms, p > 0.99; three month Sham: 47.2 ± 6.7 ms, three month DMM: 48.3 ± 8.5 ms, p > 0.99) (Figure 7D). However, there was a significant increase in the T2 time of cartilage in the cartilage-meniscus region of DMM joints compared to Sham joints at one month (one month Sham: 98.2 ± 22.0 ms, one month DMM: 158.2 ± 62.0 ms, p = 0.042). By three months, these differences were no longer significant (three month Sham: 55.3 ± 10.9 ms, three month DMM: 92.0 ± 15.6 ms, p = 0.099) (Figure 7E, F).
In terms of the meniscus, the anterior horn showed increased T2 time between Sham and DMM joints at one month (one month Sham: 30.1 ± 2.5 ms, one month DMM: 47.7 ± 17.7 ms, p = 0.03), but no differences at three months (three month Sham: 24.5 ± 3.4 ms, three month DMM: 28.5 ± 5.0 ms, p = 0.75) (Figure 8C, D). There were no significant differences in the posterior horn between Sham and DMM at either time point (one month Sham: 29.0 ± 1.0 ms, one month DMM: 27.0 ± 2.6 ms, p > 0.999; three month Sham: 30.1 ± 8.1 ms, three month DMM: 23.3 ± 7.0 ms, p = 0.18) (data not shown).
Discussion:
Meniscal injuries are common and current clinical management addresses pain but does not restore meniscal function.2 Despite this, there are few large animal models of meniscus injury that evaluate joint-wide initiation of disease across scales. Here, we used a large animal model of complete detachment of the anterior horn of the medial meniscus, as this represents a ‘worst case’ injury condition and effectively eliminates the meniscus as a load transfer tissue in the joint at the time of injury.47 We also created this injury using an arthroscopic approach so as to minimize deleterious changes to the joint caused by open surgical procedures.48 Overall, our findings show that sham procedures produced little change in cartilage or meniscus properties or overall joint health, whereas arthroscopic DMM resulted in significant degenerative changes in both cartilage and meniscus, across length scales, which persisted through three months.
At the time of surgery, complete transection of the anterior horn was verified using an arthroscopic probe. Interestingly, at one month post-surgery, the majority of DMM menisci showed the growth of a fibrovascular scar tissue at the injury site, in place of the severed enthesis. While this scar was readily apparent macroscopically, the load bearing capacity of the DMM menisci remained compromised at one month, as indicated by the smaller contact area and larger contact pressures measured in DMM joints compared to Shams.14 By three months, however, this fibrous scar had further matured. Perhaps due to this healing process, distribution of contact forces across the joint returned to baseline levels, indicating engagement of the meniscus during loading of the joint.
At early time points (one month post DMM), histological inspection and mechanical evaluation of the tibial plateau cartilage revealed significant changes in mechanical properties, histopathologic scores, subchondral bone thickness and volume, and cartilage T2 time. These are representative of the initial stages of OA development in this model, and support that detachment of the anterior horn of the medial meniscus elicits degenerative changes in the minipig stifle.25 Interestingly, these changes were primarily isolated to the cartilage-meniscus contact region at this time point.
At the longer, three month time point, with resolution of load distribution capacity of the healing meniscus, some changes noted at one month persisted, while others resolved towards baseline. For example, changes noted in the subchondral bone were transient (apparent at one month and not through three months). This may be due to the rapid time scale of boney remodeling in response to load. However, other important changes in joint tissues were sustained at the three month time point. This includes indicators of cartilage health (cartilage mechanics and histopathological assessment), which showed persistent deficits in DMM-operated joints compared to Sham joints at three months.
Our findings in this new large animal arthroscopic model of DMM phenocopy in many respects previous reported outcomes in small animal models. For example, one previous study showed a decrease in cartilage indentation modulus (measured via AFM nanoindentation) after DMM in mice, with an approximate 50% decrease in modulus compared to Sham controls after one week.19 Other mouse studies have shown subchondral sclerosis in DMM joints six to eight weeks after DMM, compared to naïve contralateral limbs.17,49 These findings are consistent with our findings in the Yucatan cartilage-meniscus contact region one month after DMM. Additionally, in our study, microscopic evaluation of the tibial plateau and OARSI scoring showed an increase in cartilage pathology in DMM joints. This finding is consistent with small animal models of DMM, with those studies indicating increased degeneration in DMM joints compared to Shams as early as 4 weeks.15
Our findings are also consistent with a longer term (6 month) porcine and ovine models that showed severe degeneration of the cartilage surfaces after an open, en bloc removal of a segment of the anterior horn of the medial meniscus.25,26 Additionally, our findings are in agreement with a canine study in which an arthroscopic posterior medial meniscal release resulted in increased OA histologic scoring and slight subchondral sclerosis.28 Interestingly, we also found significant loss of proteoglycans in the anterior horn of the medial meniscus after DMM, which extended to the posterior horn at the 3 month time point. This has not been previously reported as a consequence of DMM. The lack of stable and functional anchorage of the anterior attachment likely results in meniscal extrusion, which in turn may reduce compressive load on the anterior portion of the tissue at the early time point in particular. As compressive loading is thought to maintain glycosaminoglycan content,50 decreased loading of the anterior horn may again be the driver of the emerging phenotype.
This study is not without limitations. Our sample size was low, and our two time points were relatively short. We also noted some variability in our outcome measures. Macroscopic evidence cartilage wear was not noted in every joint, while microscale measures of cartilage mechanics and histology showed consistent loss with DMM. It may be that degeneration originates at the microscale, where these measures were taken, but is not obvious at the macroscale until degeneration has worsened. This will be assessed in ongoing longer term evaluations of this model. Additionally, while this study did assess joint level mechanics, we did not assess the full range of animal activity and joint kinematics pre and post-injury. A more complete biomechanical characterization of the joint as a whole is needed to fully understand the link between mechanical forces and local tissue response in this model. Lastly, the use of a bilateral model has both strengths and weaknesses. While it does reduce the number of animals used in a study, following IACUC best practices, there are no contralateral controls. Additionally, bilateral surgeries may lead to compensation in one limb due to surgery in the other. It should be noted, however, that no lameness was observed in animals in this study post surgery or throughout the duration of the study. This will need to be addressed in longer term studies, with careful monitoring of animal activity and joint range of motion37.
Despite these limitations, the surgical model presented herein is novel in several ways. This large animal model of meniscal unloading (through DMM) is unique and builds on work done to create other types of meniscal injury in large animals in to induce cartilage wear and onset of osteoarthritis25 or augmented repair strategies.3 Large animal models have many advantages compared to small animal models, increasing clinical translation by providing for increased spatial resolution. This is particularly important given our findings that cartilage wear initially occurred within the cartilage-meniscus contact region of the medial compartment rather than across the condyle as a whole. This spatial difference is in agreement with another large animal model of meniscal injury26. Additionally, larger animals make possible the use of arthroscopic injury and repair approaches.51 These arthroscopic interventions are well tolerated, and so enable bilateral surgeries to be performed without compromising animal well-being (reducing animal numbers). The minimally invasive model also reduces the impact of trauma from open surgery, where in smaller animals open surgery causes a significant perturbation in gait and activity in the weeks following DMM surgery.17 Additionally, it has been reported that open procedures can alter joint-wide homeostasis in the context of cartilage biopsies52, emphasizing the need for minimally invasive procedures wherever possible.
This minimally invasive large animal model is clinically relevant in that it enhances our understanding of cartilage degeneration after meniscal detachment and unloading. Given that meniscal tears alter load transfer in the tissue, this study provides important information on how periods of meniscal unloading change joint homoeostasis. Our observation of potential ‘healing’ of the attachment and restoration of load transfer at the three month time point are intriguing, especially as some measures of cartilage degeneration continue to show decreases in properties. Longer time point studies are now being pursued to determine the progression of meniscal and cartilage degeneration following DMM in this model, and if this resolution of load transfer ultimately leads to a return to joint health. Alternatively, it is possible that even a transient period of unloading resulting from DMM causes irreversible damage to the joint. An understanding of where and when both osteochondral and meniscal degeneration initiates in response to meniscal tears may help direct clinical approaches to enhance meniscus repair.
Acknowledgements:
This work was supported by the Department of Veterans Affairs (I01 RX000174) and the National Institutes of Health (R01 EB002425, R01 AR056624, and T32 AR007132). Additional support was provided by a New Investigator Award from the Orthopaedic Research and Education Foundation (OREF) and a pilot award from the Penn Center for Musculoskeletal Disorders (P30 AR069619).
References:
- 1.Merriam AR, Patel JM, Culp BM, et al. 2015. Successful Total Meniscus Reconstruction Using a Novel Fiber-Reinforced Scaffold. Am. J. Sports Med. 43(10):2528–2537 Available from: http://journals.sagepub.com/doi/10.1177/0363546515595065. [DOI] [PubMed] [Google Scholar]
- 2.Mordecai SC. 2014. Treatment of meniscal tears: An evidence based approach. World J. Orthop. 5(3):233 Available from: http://www.pubmedcentral.nih.gov/articlerender.fcgi?artid=4095015&tool=pmcentrez&rendertype=abstract. [DOI] [PMC free article] [PubMed] [Google Scholar]
- 3.Qu F, Pintauro MP, Haughan JE, et al. 2015. Repair of dense connective tissues via biomaterial-mediated matrix reprogramming of the wound interface. Biomaterials 39:85–94 Available from: 10.1016/j.biomaterials.2014.10.067. [DOI] [PMC free article] [PubMed] [Google Scholar]
- 4.Arnoczky SP. 1992. Gross and vascular anatomy of the meniscus and its role in meniscal healing, regeneration and remodeling. Knee Meniscus Basic Clin. Found. :1–14. [Google Scholar]
- 5.Petersen W, Tillmann B. 1995. Age-related blood and lymph supply of the knee menisci:A cadaver study. Acta Orthop. Scand. 66(4):308–312 Available from: http://www.tandfonline.com/doi/full/10.3109/17453679508995550. [DOI] [PubMed] [Google Scholar]
- 6.Ionescu LC, Lee GC, Garcia GH, et al. 2011. Maturation State-Dependent Alterations in Meniscus Integration: Implications for Scaffold Design and Tissue Engineering. Tissue Eng. Part A 17(1–2):193–204 Available from: http://www.pubmedcentral.nih.gov/articlerender.fcgi?artid=3011923&tool=pmcentrez&rendertype=abstract. [DOI] [PMC free article] [PubMed] [Google Scholar]
- 7.Roos H, Adalberth T, Dahlberg L, Lohmander LS. 1995. Osteoarthritis of the knee after injury to the anterior cruciate ligament or meniscus: the influence of time and age. Osteoarthr. Cartil. 3(4):261–267 Available from: http://www.ncbi.nlm.nih.gov/entrez/query.fcgi?cmd=Retrieve&db=PubMed&dopt=Citation&list_uids=8689461. [DOI] [PubMed] [Google Scholar]
- 8.Lohmander LS, Englund PM, Dahl LL, Roos EM. 2007. The Long-term Consequence of Anterior Cruciate Ligament and Meniscus Injuries. Am. J. Sports Med. 35(10):1756–1769 Available from: http://ajs.sagepub.com/lookup/doi/10.1177/0363546507307396. [DOI] [PubMed] [Google Scholar]
- 9.Hunter DJ, Zhang YQ, Niu JB, et al. 2006. The association of meniscal pathologic changes with cartilage loss in symptomatic knee osteoarthritis. Arthritis Rheum. 54(3):795–801 Available from: http://doi.wiley.com/10.1002/art.21724. [DOI] [PubMed] [Google Scholar]
- 10.Papalia R, Del Buono A, Osti L, et al. 2011. Meniscectomy as a risk factor for knee osteoarthritis: A systematic review. Br. Med. Bull. 99(1):89–106. [DOI] [PubMed] [Google Scholar]
- 11.Biswal S, Hastie T, Andriacchi TP, et al. 2002. Risk factors for progressive cartilage loss in the knee: A longitudinal magnetic resonance imaging study in forty-three patients. Arthritis Rheum. 46(11):2884–2892. [DOI] [PubMed] [Google Scholar]
- 12.Raynauld JP, Martel-Pelletier J, Berthiaume MJ, et al. 2005. Long term evaluation of disease progression through the quantitative magnetic resonance imaging of symptomatic knee osteoarthritis patients: Correlation with clinical symptoms and radiographic changes. Arthritis Res. Ther. 8(1):R21 Available from: http://www.pubmedcentral.nih.gov/articlerender.fcgi?artid=1526551&tool=pmcentrez&rendertype=abstract. [DOI] [PMC free article] [PubMed] [Google Scholar]
- 13.Berthiaume MJ, Raynauld JP, Martel-Pelletier J, et al. 2005. Meniscal tear and extrusion are strongly associated with progression of symptomatic knee osteoarthritis as assessed by quantitative magnetic resonance imaging. Ann. Rheum. Dis. 64(4):556–563 Available from: http://ard.bmj.com/cgi/doi/10.1136/ard.2004.023796. [DOI] [PMC free article] [PubMed] [Google Scholar]
- 14.Bedi A, Kelly NH, Baad M, et al. 2010. Dynamic contact mechanics of the medial meniscus as a function of radial tear, repair, and partial meniscectomy. J. Bone Jt. Surg. - Ser. A 92(6):1398–1408 Available from: http://jbjs.org/cgi/doi/10.2106/JBJS.I.00539. [DOI] [PubMed] [Google Scholar]
- 15.Glasson SS, Blanchet TJ, Morris EA. 2007. The surgical destabilization of the medial meniscus (DMM) model of osteoarthritis in the 129/SvEv mouse. Osteoarthr. Cartil. 15(9):1061–1069. [DOI] [PubMed] [Google Scholar]
- 16.Sambamurthy N, Nguyen V, Smalley R, et al. 2018. Chemokine receptor-7 (CCR7) deficiency leads to delayed development of joint damage and functional deficits in a murine model of osteoarthritis. J. Orthop. Res. 36(3):864–875. [DOI] [PMC free article] [PubMed] [Google Scholar]
- 17.Sambamurthy N, Zhou C, Nguyen V, et al. 2018. Deficiency of the pattern-recognition receptor CD14 protects against joint pathology and functional decline in a murine model of osteoarthritis. PLoS One 13(11):1–25. [DOI] [PMC free article] [PubMed] [Google Scholar]
- 18.Hui Mingalone CK, Liu Z, Hollander JM, et al. 2018. Bioluminescence and second harmonic generation imaging reveal dynamic changes in the inflammatory and collagen landscape in early osteoarthritis. Lab. Investig. 98(5):656–669. [DOI] [PMC free article] [PubMed] [Google Scholar]
- 19.Doyran B, Tong W, Li Q, et al. 2017. Nanoindentation modulus of murine cartilage: a sensitive indicator of the initiation and progression of post-traumatic osteoarthritis. Osteoarthr. Cartil. 25(1):108–117. [DOI] [PMC free article] [PubMed] [Google Scholar]
- 20.Li J, Yuan H, Wu M, et al. 2014. Quantitative Assessment of Murine Articular Cartilage and Bone Using X-Ray Phase-Contrast Imaging. PLoS One 9(11):e111939. [DOI] [PMC free article] [PubMed] [Google Scholar]
- 21.Shepherd DET, Seedhom BB. 1999. Thickness of human articular cartilage in joints of the lower limb. Ann. Rheum. Dis. 58(1):27–34. [DOI] [PMC free article] [PubMed] [Google Scholar]
- 22.Bansal S, Keah NM, Neuwirth AL, et al. 2017. Large Animal Models of Meniscus Repair and Regeneration: A Systematic Review of the State of the Field. Tissue Eng. - Part C Methods 23(11):661–672 Available from: http://online.liebertpub.com/doi/10.1089/ten.tec.2017.0080. [DOI] [PMC free article] [PubMed] [Google Scholar]
- 23.Arnoczky SP, Cook JL, Carter T, Turner AS. 2010. Translational models for studying meniscal repair and replacement: What they can and cannot tell us. Tissue Eng. - Part B Rev. 16(1):31–39. [DOI] [PubMed] [Google Scholar]
- 24.Nishida M, Higuchi H, Kobayashi Y, Takagishi K. 2005. Histological and biochemical changes of experimental meniscus tear in the dog knee. J. Orthop. Sci. 10(4):406–413. [DOI] [PubMed] [Google Scholar]
- 25.Waller KA, Chin KE, Jay GD, et al. 2017. Intra-articular Recombinant Human Proteoglycan 4 Mitigates Cartilage Damage after Destabilization of the Medial Meniscus in the Yucatan Minipig. Am. J. Sports Med. 45(7):1512–1521 Available from: http://journals.sagepub.com/doi/10.1177/0363546516686965. [DOI] [PMC free article] [PubMed] [Google Scholar]
- 26.Oláh T, Reinhard J, Gao L, et al. 2019. Topographic modeling of early human osteoarthritis in sheep. Sci. Transl. Med. 11(508):1–13. [DOI] [PubMed] [Google Scholar]
- 27.Luther JK, Cook CR, Cook JL. 2009. Meniscal release in cruciate ligament intact stifles causes lameness and medial compartment cartilage pathology in dogs 12 weeks postoperatively. Vet. Surg. 38(4):520–529. [DOI] [PubMed] [Google Scholar]
- 28.Kuroki K, Cook CR, Cook JL. 2011. Subchondral bone changes in three different canine models of osteoarthritis. Osteoarthr. Cartil. 19(9):1142–1149 Available from: 10.1016/j.joca.2011.06.007. [DOI] [PubMed] [Google Scholar]
- 29.Cook JL, Smith PA, Bozynski CC, et al. 2016. Multiple injections of leukoreduced platelet rich plasma reduce pain and functional impairment in a canine model of ACL and meniscal deficiency. J. Orthop. Res. 34(4):607–615. [DOI] [PubMed] [Google Scholar]
- 30.Mosher TJ, Dardzinski BJ, Smith MB. 2000. Human articular cartilage: Influence of aging and early symptomatic degeneration on the spatial variation of T2 - Preliminary findings at 3 T. Radiology 214(1):259–266 Available from: http://pubs.rsna.org/doi/10.1148/radiology.214.1.r00ja15259. [DOI] [PubMed] [Google Scholar]
- 31.Milford D, Rosbach N, Bendszus M, Heiland S. 2015. Mono-exponential fitting in T2-relaxometry: Relevance of offset and first echo. PLoS One 10(12):1–13 Available from: 10.1371/journal.pone.0145255. [DOI] [PMC free article] [PubMed] [Google Scholar]
- 32.Raya JG, Dietrich O, Horng A, et al. 2010. T2 measurement in articular cartilage: Impact of the fitting method on accuracy and precision at low SNR. Magn. Reson. Med. 63(1):181–193. [DOI] [PubMed] [Google Scholar]
- 33.Ghodbane SA, Patel JM, Brzezinski A, et al. 2019. Biomechanical characterization of a novel collagen-hyaluronan infused 3D-printed polymeric device for partial meniscus replacement. J. Biomed. Mater. Res. Part B Appl. Biomater. Available from: http://doi.wiley.com/10.1002/jbm.b.34336. [DOI] [PubMed] [Google Scholar]
- 34.Zdero R. 2017. Experimental Methods in Orthopaedic Biomechanics. Elsevier. 428 p. Available from: https://linkinghub.elsevier.com/retrieve/pii/C2015000572X. [Google Scholar]
- 35.Park MC, Pirolo JM, Park CJ, et al. 2009. The effect of abduction and rotation on footprint contact for single-row, double-row, and modified double-row rotator cuff repair techniques. Am. J. Sports Med. 37(8):1599–1608. [DOI] [PubMed] [Google Scholar]
- 36.Tachibana Y, Mae T, Fujie H, et al. 2017. Effect of radial meniscal tear on in situ forces of meniscus and tibiofemoral relationship. Knee Surgery, Sport. Traumatol. Arthrosc. 25(2):355–361. [DOI] [PubMed] [Google Scholar]
- 37.Qu F, Stoeckl BD, Gebhard PM, et al. 2018. A Wearable Magnet-Based System to Assess Activity and Joint Flexion in Humans and Large Animals. Ann. Biomed. Eng. 46(12):2069–2078. [DOI] [PMC free article] [PubMed] [Google Scholar]
- 38.Seo JH, Li G, Shetty GM, et al. 2009. Effect of Repair of Radial Tears at the Root of the Posterior Horn of the Medial Meniscus With the Pullout Suture Technique: A Biomechanical Study Using Porcine Knees. Arthrosc. - J. Arthrosc. Relat. Surg. 25(11):1281–1287 Available from: 10.1016/j.arthro.2009.05.014. [DOI] [PubMed] [Google Scholar]
- 39.Pfeifer CG, Fisher MB, Saxena V, et al. 2017. Age-Dependent Subchondral Bone Remodeling and Cartilage Repair in a Minipig Defect Model. Tissue Eng. - Part C Methods 23(11):745–753 Available from: http://online.liebertpub.com/doi/10.1089/ten.tec.2017.0109. [DOI] [PMC free article] [PubMed] [Google Scholar]
- 40.Fisher MB, Belkin NS, Milby AH, et al. 2015. Cartilage Repair and Subchondral Bone Remodeling in Response to Focal Lesions in a Mini-Pig Model: Implications for Tissue Engineering. Tissue Eng. Part A 21(3–4):850–860 Available from: http://www.pubmedcentral.nih.gov/articlerender.fcgi?artid=4333259&tool=pmcentrez&rendertype=abstract. [DOI] [PMC free article] [PubMed] [Google Scholar]
- 41.Cook JL, Fox DB. 2007. A Novel Bioabsorbable Conduit Augments Healing of Avascular Meniscal Tears in a Dog Model. Am. J. Sports Med. 35(11):1877–1887 Available from: http://ajs.sagepub.com/content/35/11/1877.full.pdf. [DOI] [PubMed] [Google Scholar]
- 42.Meloni GR, Fisher MB, Stoeckl BD, et al. 2017. Biphasic Finite Element Modeling Reconciles Mechanical Properties of Tissue-Engineered Cartilage Constructs Across Testing Platforms. Tissue Eng. - Part A 23(13–14):663–674 Available from: http://online.liebertpub.com/doi/10.1089/ten.tea.2016.0191. [DOI] [PMC free article] [PubMed] [Google Scholar]
- 43.Fisher MB, Belkin NS, Milby AH, et al. 2016. Effects of Mesenchymal Stem Cell and Growth Factor Delivery on Cartilage Repair in a Mini-Pig Model. Cartilage 7(2):174–184. [DOI] [PMC free article] [PubMed] [Google Scholar]
- 44.Little CB, Smith MM, Cake MA, et al. 2010. The OARSI histopathology initiative - recommendations for histological assessments of osteoarthritis in sheep and goats. Osteoarthr. Cartil. 18(SUPPL. 3):S80–S92 Available from: 10.1016/j.joca.2010.04.016. [DOI] [PubMed] [Google Scholar]
- 45.Pauli C, Grogan SP, Patil S, et al. 2011. MAcroscopic And Histopathologic Analysis Of Human Knee Menisci In Aging And Osteoarthritis. Osteoarthr. Cartil. 19(9):1132–1141 Available from: 10.1016/j.joca.2011.05.008. [DOI] [PMC free article] [PubMed] [Google Scholar]
- 46.Andrews SHJ, Rattner JB, Jamniczky HA, et al. 2015. The structural and compositional transition of the meniscal roots into the fibrocartilage of the menisci. J. Anat. 226(2):169–174 Available from: http://doi.wiley.com/10.1111/joa.12265. [DOI] [PMC free article] [PubMed] [Google Scholar]
- 47.Beaufils P, Becker R, Kopf S, et al. 2017. The knee meniscus: Management of traumatic tears and degenerative lesions. EFORT Open Rev. 2(5):195–203 Available from: http://online.boneandjoint.org.uk/doi/10.1302/2058-5241.2.160056. [DOI] [PMC free article] [PubMed] [Google Scholar]
- 48.Del Pizzo W, Fox JM. 1990. Results of arthroscopic meniscectomy. Clin. Sports Med. 9(3):633–9 Available from: http://www.ncbi.nlm.nih.gov/pubmed/2199074. [PubMed] [Google Scholar]
- 49.Moodie JP, Stok KS, Müller R, et al. 2011. Multimodal imaging demonstrates concomitant changes in bone and cartilage after destabilisation of the medial meniscus and increased joint laxity. Osteoarthr. Cartil. 19(2):163–170 Available from: 10.1016/j.joca.2010.11.006. [DOI] [PubMed] [Google Scholar]
- 50.Abdelgaied A, Stanley M, Galfe M, et al. 2015. Comparison of the biomechanical tensile and compressive properties of decellularised and natural porcine meniscus. J. Biomech. 48(8):1389–1396 Available from: 10.1016/j.jbiomech.2015.02.044. [DOI] [PubMed] [Google Scholar]
- 51.Moran CJ, Ramesh A, Brama PAJ, et al. 2016. The benefits and limitations of animal models for translational research in cartilage repair. J. Exp. Orthop. 3(1):1–12 Available from: http://www.jeo-esska.com/content/3/1/1. [DOI] [PMC free article] [PubMed] [Google Scholar]
- 52.Lee CR, Grodzinsky AJ, Hsu HP, et al. 2000. Effects of harvest and selected cartilage repair procedures on the physical and biochemical properties of articular cartilage in the canine knee. J. Orthop. Res. 18(5):790–799 Available from: http://doi.wiley.com/10.1002/jor.1100180517. [DOI] [PubMed] [Google Scholar]


