Abstract
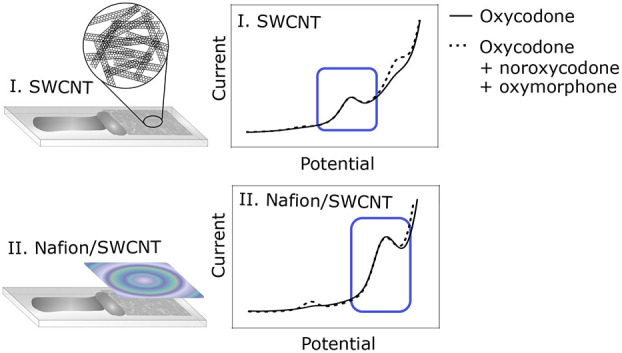
Oxycodone is a strong opioid frequently used as an analgesic. Although proven efficacious in the management of moderate to severe acute pain and cancer pain, use of oxycodone imposes a risk of adverse effects such as addiction, overdose, and death. Fast and accurate determination of oxycodone blood concentration would enable personalized dosing and monitoring of the analgesic as well as quick diagnostics of possible overdose in emergency care. However, in addition to the parent drug, several metabolites are always present in the blood after a dose of oxycodone, and to date, there is no electrochemical data available on any of these metabolites. In this paper, a single-walled carbon nanotube (SWCNT) electrode and a Nafion-coated SWCNT electrode were used, for the first time, to study the electrochemical behavior of oxycodone and its two main metabolites, noroxycodone and oxymorphone. Both electrode types could selectively detect oxycodone in the presence of noroxycodone and oxymorphone. However, we have previously shown that addition of a Nafion coating on top of the SWCNT electrode is essential for direct measurements in complex biological matrices. Thus, the Nafion/SWCNT electrode was further characterized and used for measuring clinically relevant concentrations of oxycodone in buffer solution. The limit of detection for oxycodone with the Nafion/SWCNT sensor was 85 nM, and the linear range was 0.5–10 μM in buffer solution. This study shows that the fabricated Nafion/SWCNT sensor has potential to be applied in clinical concentration measurements.
Oxycodone is a strong opioid widely used as an analgesic. As with all opioids, oxycodone can cause severe adverse effects such as addiction, overdose, and death due to respiratory depression. In 2017, more than 70 000 drug overdose deaths occurred in the Unites States alone, 68% of which involved opioids, including oxycodone.1 The pharmacokinetic profile of oxycodone is affected by several factors such as age, sex, concomitant diseases, and drug–drug interactions.2 In addition, the plasma concentrations of oxycodone leading to sufficient analgesia after surgery are highly individual, the average concentrations ranging between 0.3 and 100 nM,3 and in cases of overdose, the highest concentrations found in blood can be over 10 μM.4 Thus, there is need for a fast and accurate method to assess the blood concentrations of oxycodone to support safe and efficacious pain management and enable rapid diagnostics of opioid overdosing.
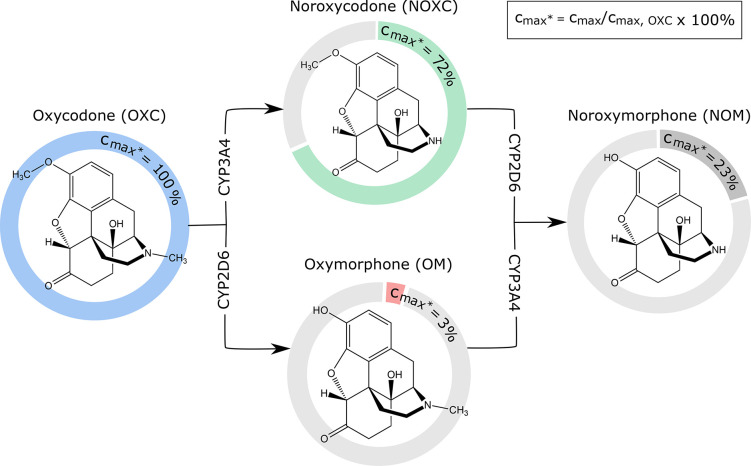
The chemical structures and metabolic pathways of oxycodone and its oxidative metabolites are shown in Figure 1. In addition to the parent drug oxycodone, there are always various metabolites present in the blood after systemic administration. Oxycodone undergoes extensive oxidative metabolism by hepatic cytochrome P 450 (CYP) enzymes.2,5 Oxycodone is mainly oxidized into noroxycodone by CYP3A enzymes and, to a lesser extent, to oxymorphone by CYP2D6. From these two, the major metabolite noroxycodone can reach high blood concentrations but has low affinity to the μ-opioid receptor and thus does not contribute to oxycodone analgesia.6,7 Similarly, oxymorphone has no significant role in the overall opioid effect of oxycodone due to very low plasma concentrations achieved after oxycodone administration.5 However, oxymorphone has higher activity at the μ-opioid receptor than the parent drug, and it is also used as an analgesic by itself.6,7
Figure 1.
Chemical structures and metabolic pathways of oxycodone and its oxidative metabolites. Percentages in the colored diagrams show the peak plasma concentrations (Cmax) (mol/L) of noroxycodone, noroxymorphone, and oxymorphone relative to the peak plasma concentration of oxycodone. These concentrations have been measured in human plasma after a single dose of oxycodone.5 Arrows represent the metabolic pathways leading to oxidation of the molecules by the CYP3A or CYP2D6 enzymes.
Both noroxycodone and oxymorphone are further oxidatively metabolized to noroxymorphone by CYP2D6 and CYP3A, respectively (Figure 1). Noroxymorphone can reach relatively high concentrations in plasma after oral administration of oxycodone but has no analgesic effect due to poor penetrance through the blood–brain barrier.5,8 In addition to the oxidative metabolites, oxycodone has several reductive metabolites. However, the main pharmacologic effect of oxycodone seems to be attributed to the parent drug alone.5
The gold standard method for measuring plasma concentrations of oxycodone and other opioids is high-performance liquid chromatography (HPLC) often coupled with mass spectrometry,3,9,10 a method already used for decades.11 This method provides extreme specificity and low limits of quantification, but the measurements are time consuming and laborious and require skilled laboratory personnel. While point-of-care drug concentration measurements would often aid in clinical decision making, performing HPLC analysis takes up to a few hours. Electrochemical methods have been shown to provide fast response time, high sensitivity, and simple usability in sensor applications. They have also been used to measure opioid concentrations.12−17 However, only a few studies on electrochemical detection of oxycodone have been published,12 and to our knowledge, there are currently no reported studies on the electrochemical behavior of oxycodone together with its main metabolites.
Carbon nanomaterials, including single-walled carbon nanotubes (SWCNT), have been widely used in electrochemical sensor applications due to their high conductivity, biocompatibility, good sensitivity, and fast response time.18 A considerable advantage of the SWCNT networks, specifically, is their compatibility with industrial manufacturing processes, making them a desirable material for large-scale production of, e.g., disposable sensor strips. In addition, SWCNTs can be functionalized or otherwise tuned for specific applications, for example, by selecting appropriate catalysts for the fabrication.19 In our previous studies, we have also shown that the performance of a sensor can be further improved by combining the exceptional qualities of carbon nanomaterials with the selective properties of the ion-exchange membrane Nafion.15,16,20 The Nafion membrane contains nanosized interconnected hydrophilic channels coated with negatively charged sulfonic groups and thus only allows cationic molecules, including opioids, through while practically blocking anions from the electrode surface. This is a particularly advantageous property for electrochemical sensors applied in biological matrices, since many of the interfering molecules, such as ascorbic acid and uric acid, are in anionic form at the physiological pH. Thus, coating the electrode with a Nafion membrane not only increases the selectivity of the electrode but also enables detection of analytes in complex biological matrices.
In this work, we investigated the use of a plain SWCNT electrode as well as a SWCNT electrode coated with a thin Nafion layer for selective detection of oxycodone in the presence of its two metabolites noroxycodone and oxymorphone. These metabolites were selected based on their high relative concentration (noroxycodone), analgesic activity (oxymorphone), and availability. Differential pulse voltammetry (DPV) was selected for the appropriate electrochemical method, since it provides a low signal-to-noise ratio and a response time of just a few minutes. The electrochemical behavior of oxycodone, noroxycodone, and oxymorphone was studied on both plain and Nafion-coated SWCNT electrodes. Due to its better applicability in real clinical samples,15,16 the Nafion/SWCNT electrode was further characterized and applied in measuring clinically relevant concentrations of oxycodone in buffer solution. Both electrode types were then shown to be able to detect oxycodone in the presence of its two main metabolites, while the Nafion coating was seen to improve the sensitivity toward oxycodone. These results show that the SWCNT/Nafion has potential to be applied in further studies for selective detection of oxycodone in clinical concentration measurements.
Materials and Methods
Preparation of Nafion/SWCNT Electrode
The SWCNT networks were synthesized by aerosol chemical vapor deposition (CVD), using the process described in more detail in refs (21) and (22). Briefly, in this thermal high-temperature floating catalyst CVD, iron nanoparticles are first produced in a carbon monoxide atmosphere in a laminar flow reactor. In these conditions, the formed iron acts as a catalyst to decompose the carbon monoxide, leading to nucleation and growth of SWCNTs. The SWCNTs are collected onto a membrane filter, resulting in a sheet of SWCNT network.
A piece of the received SWCNT network was cut from the filter paper and press transferred by hand onto a glass slide (Thermo Scientific, ISO 8037-1) with dimensions of 1 × 2 cm. The glass slide was precleaned by immersing in acetone (AnalaR NOMRAPUR, Merck) and ethanol (99.5 wt %, Altia, Finland). After press transferring, the filter paper was removed and the network densified with a drop of ethanol which was allowed to dry at room temperature. Silver contact pads were painted with conductive silver paint (Electrolube) and allowed to dry for at least 1 h. A piece of conductive copper tape (Ted Pella, Inc.) was placed at the end of the contact pad to enable a robust connection point for the electrode leads.
Finally, the electrode was covered with polytetrafluoroethylene film (PTFE, Saint-Gobain Performance Plastics CHR 2255-2) with a 3 mm hole to isolate the working electrode area and to attach the SWCNT network onto the glass substrate. The film was allowed to adhere to the glass surface overnight. The following day, the electrode was coated with 2.5 wt % Nafion, diluted from 5 wt % Nafion D-520 solution (Alfa Aesar) with 94 wt % ethanol (Altia, Finland). The coating was done with a mechanical dip coater by immersing the electrode into the solution for 5 s and allowing to dry for 30 s before detaching from the holder. The prepared electrode was dried in ambient air overnight before measurements.
Electrochemistry Equipment and Measurement Parameters
All electrochemical measurements were done with a three-electrode system with a CH Instrument (CHI630E) potentiostat. Ag/AgCl (+0.199 V vs standard hydrogen electrode, Radiometer Analytical) was used as a reference and platinum wire as the counter electrode. The potential window was from −0.4 to 1.3 V, pulse amplitude 50 mV, step potential 4 mV and pulse period 0.2 s. Phosphate-buffered saline (PBS 0.01 M, pH 7.4) was used as the electrolyte. All solutions were purged with N2 for at least 10 min prior to the measurements, and deoxygenation was continued throughout the measurements.
The prepared Nafion/SWCNT electrodes were always measured the following day after Nafion coating if not stated otherwise. Before starting the measurements, the electrodes were allowed to swell in PBS for 30 min. Background signals were collected with DPV at least five times or until the stability of the background was satisfactory so that two consecutive backgrounds were overlapping. An additional background with a 5 min accumulation time was measured if an accumulation time was applied in the analyte measurements as well. In the OXC concentration series measurements, to improve background stability the samples were cycled approximately 20 times with DPV in PBS solution. In addition, three consecutive backgrounds with a 5 min accumulation time were recorded to determine the values for the limit of detection (LOD), keeping the electrodes in PBS for 5 min between each measurement. In general, a 5 min accumulation time was used in all measurements unless stated otherwise. All measurements were repeated with at least three electrodes.
Characterization of the SWCNT Network
The physical and chemical structure of the SWCNT network was characterized with transmission electron microscopy (TEM) and X-ray absorption spectroscopy (XAS). The samples for TEM imaging were prepared by press transferring a piece of the SWCNT network on a S147AH Au TEM grid with holey carbon films (Agar Scientific). Analysis was conducted with a double-aberration-corrected electron microscope JEOL 2200FS (JEOL, Japan) with a Gatan 4k × 4k Ultrascan 4000 CCD camera for the digital recording of the high-resolution TEM (HRTEM) images. The microscope was operated at 200 kV with a field-emission electron gun.
For XAS analysis, SWCNT samples were similarly prepared on a highly conductive (<0.005 Ω cm–1) boron-doped Si ⟨100⟩ wafer (Sieger Wafer, Germany). The spectra were recorded at the Stanford Synchrotron Radiation Lightsource (SSRL) according to the protocol described in more detail in ref (17). The X-ray energies used for carbon (C 1s), oxygen (O 1s), and iron (Fe 2p) were from 260 to 350, 520 to 580, and 695 to 735 eV, respectively. Total electron yield (TEY) mode was used for data collection, the drain current being amplified by a Keithley picoammeter. For determining the sheet resistance of the SWCNT network, four-point probe measurements were carried out on a Hewlett-Packard 3458A multimeter attached to a Jandel RM3000 multiheight probe.
Characterization of Nafion/SWCNT Electrodes
The concentration of the Nafion solution to be used for coating was determined by comparing the performance of 2.5% and 5% Nafion. SWCNT electrodes were coated with both concentrations and measured in 5 μM OXC in PBS with DPV. The thickness of the 2.5% Nafion coatings was measured with a contact profilometer (Dektak 6M) from three electrodes. Prior to analysis, the SWCNT/Nafion film was cut along the inner circumference of the PTFE film with a 3 mm biopsy punch (Agar). After this cutting step, the PTFE film was removed, leaving the active area of the electrode intact on the glass substrate for analysis.
In order to optimize the accumulation time, 5 μM oxycodone was measured with the Nafion/SWCNT electrode with 0, 5, 10, and 15 min accumulation times. The stability of the electrode signal was determined by measuring six sequential scans in 5 μM oxycodone. The electrode was kept in PBS for 6.75 min between each scan. The relative standard deviation (RSD) was calculated for the oxycodone signal.
A long-term stability test was conducted by measuring three electrodes in 5 μM oxycodone in PBS at 1, 8, 15, and 22 days after coating. The RSD value was calculated for the average peak currents at each time point. The difference between the average peak currents at each time point with respect to the average peak current at time point 1 was calculated. The electrode-to-electrode reproducibility was also determined by calculating the RSD value for the oxycodone signal from the three electrodes measured at time point 1. All RSD values were calculated from peak current values without background subtraction.
Detection of Oxycodone and Metabolites
Oxycodone hydrochloride powder and noroxycodone hydrochloride powder were purchased from Toronto Research Chemicals, Canada. In addition, oxymorphone hydrochloride was received from Professor Jari Yli-Kauhaluoma, synthesized at the University of Helsinki. The purity of oxymorphone was checked with a mass spectrometer and found to be 77%. The measurements with oxymorphone have been added here as tentative results and are discussed as such, since further studies with pure oxymorphone should be conducted for more detailed analysis.
For the measurements with oxycodone, noroxycodone, and oxymorphone, the analytes were measured first with both plain and Nafion-coated SWCNT electrodes in 10 μM concentration. This was done to determine the oxidizing functional groups in the molecules and to assign them to corresponding oxidation peaks as well as to compare the electrochemical behavior of the analytes on the two electrode types.
The concentration series for oxycodone were measured with 0.5, 1, 2.5, 5, 7.5, and 10 μM with Nafion/SWCNT. The analyte was injected with a pipet into the 50 mL electrochemical cell from a 1 mM stock solution. After each injection, the solution was mixed slightly with the pipet for 30 s, and the measurement was started after a 5 min accumulation time. Four electrodes were measured and kept in PBS between the measurements. The linear range was plotted by taking the average of the peak currents for each electrode at each concentration point with the standard deviations as error bars. The LOD value was calculated with the formula LOD = 3.3 × σ/s, where σ is the standard deviation of three consecutive background currents (μA, at the oxidation potential of oxycodone and without background correction) and s is the sensitivity of the electrode (μA/μM). The value was calculated as the average of four electrodes.
To assess the capability of the electrodes to selectively detect oxycodone in the presence of the metabolites, all analytes were measured in relevant concentration ratios based on the average plasma concentrations given in ref (5) and discussed in the Introduction. The percentages of the metabolites were rounded up slightly and adjusted to a 5 μM oxycodone reference concentration. Thus, 5 μM oxycodone, 3.75 μM noroxycodone, and 250 nM oxymorphone were measured separately with both plain and Nafion-coated SWCNT electrodes. The selectivity of the electrodes was further assessed by measuring 5 μM oxycodone first alone and then 5 μM oxycodone in the presence of 3.75 μM noroxycodone and 250 nM oxymorphone.
Results and Discussion
Characterization of the SWCNT Network
The SWCNT networks from the same batch have been extensively characterized in our previous work by Raman spectroscopy, UV–vis, and X-ray-photoelectron microscopy (XPS) as well as TEM and XAS.17 Briefly, in Raman spectroscopy analysis, the low Id/Ig ratio of 0.102 ± 0.003 confirmed the presence of a low amount of amorphous carbon and a small number of defects. The results also showed radial breathing modes corresponding to SWCNT diameters in the range of 1.2–2.1 nm, whereas a mean diameter of 2.1 nm was found with UV–vis analysis. The XPS survey found 71.7 ± 0.2 atom % carbon, 8.7 ± 0.2 atom % oxygen, and 0.1 ± 0.01 atom % iron as well as 19.5 ± 0.3 atom % Si. From these elements, Si and most of the oxygen are likely due to the partially exposed Si wafer with native oxide.
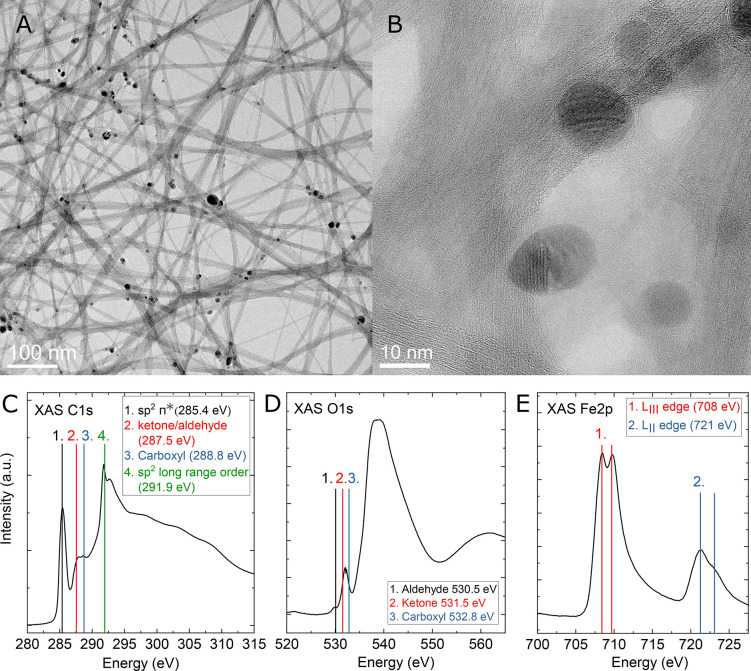
Figure 2A shows a TEM image from the SWCNT networks prepared in this work. In the HRTEM micrograph in Figure 2B, both individual and bundled SWCNTs can be seen as well as typical catalyst particles encapsulated in a few layers of carbon.
Figure 2.
Characterization of the SWCNT network. (A) TEM image and (B) HRTEM image of the SWCNT network. (C) C 1s, (D) O 1s, and (E) Fe 2p XAS spectra of the SWCNT.
The surface chemistry of the SWCNT network was also further studied with XAS and peaks assigned according to an extensive literature survey.23−33Figure 2C, 2D, and 2E show the XAS spectra for the C 1s, O 1s, and Fe 2p of the SWCNT, respectively. The C 1s spectrum indicates highly sp2-bound carbon (sp2 π* at 285.5 eV) with a clear long-range order (exciton at 291.9 eV) and a relatively small oxygen surface loading, consistent with EDS analysis of previous work.17 However, the C 1s spectra also show peaks likely attributed to ketone/aldehyde and carboxyl groups. In Figure 2D, the contributions of C–O bonds and possible oxidized Fe is heavily convoluted by the partially exposed native oxide of Si in the O 1s spectrum. Nevertheless, the spectrum suggests the presence of aldehyde, ketone, and carboxyl functional groups on the SWCNT, as seen in ref (17). The Fe 2p spectrum shown in Figure 2E also closely matches that of previous work, where the iron is expected to be bonded to carbon and oxygen (indicating the presence of a mix of iron carbide34 and iron oxide seen as the higher energy peaks of the Fe 2p LII and LIII spectra) and metallic iron (as the lower energy peaks of the Fe 2p LII and LIII spectra). The results of the characterization from the previous and this work are summarized in Table 1.
Table 1. Summary of Characterization Results of This and Previous Work17.
| Sheet resistance | Raman Id/Ig | UV–vis | XPS | EDS | XAS |
|---|---|---|---|---|---|
| 88 Ω/sq | 0.102 ± 0.003 | mean SWCNT diameter 2.1 nm | C 71.7 ± 0.2 | catalyst particles: C and Fe | highly sp2-bound carbon with clear long-range order |
| O 8.7 ± 0.2 | SWCNT sidewall: C | ketone/aldehydeand carboxyl peaks detected | |||
| Sia 19.5 ± 0.3 | iron particles, iron carbide, and iron oxide | ||||
| Fe 0.1 ± 0.01 | |||||
Most of the detected oxygen and all silicon from the native oxide of the silicon wafer substrate.
Characterization of the Nafion/SWCNT Electrode
The thickness of the 2.5% dip-coated Nafion membrane measured with profilometry was found to be thickest in the center and thinnest near the edges of the PTFE film. The thickness in the center was 980 ± 48 nm and around 200 nm close to the cut edge.
Extensive electrochemical characterization of Nafion/SWCNT electrodes has been provided in ref (16) and the behavior of Nafion studied in ref (20). It has been shown that Nafion selectively lets through and enriches positively charged molecules while effectively blocking molecules with negative charge. In addition, Nafion significantly reduces the matrix effects in biological samples, thus enabling direct detection of analytes in untreated real samples.
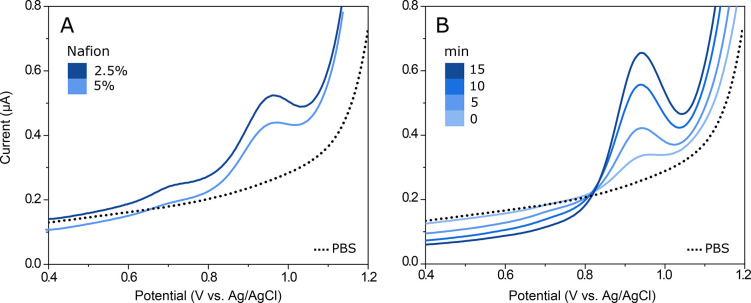
For the oxycodone measurements, the concentration of 2.5% Nafion was selected as the most suitable. With 2.5% Nafion, a higher sensitivity toward oxycodone was found compared to 5% (Figure 3A). A 5 min accumulation time was found to be sufficient for achieving a clear signal for oxycodone without compromising the fast nature of the measurement (Figure 3B).
Figure 3.
Characterization of the Nafion/SWCNT electrode. (A) Nafion concentration. 5 μM oxycodone with SWCNT with 2.5% Nafion and 5% Nafion. (B) Accumulation time. 5 μM oxycodone measured with SWCNT 2.5% Nafion with accumulation times 0, 5, 10, and 15 min.
Electrochemical Behavior of Oxycodone and Metabolites
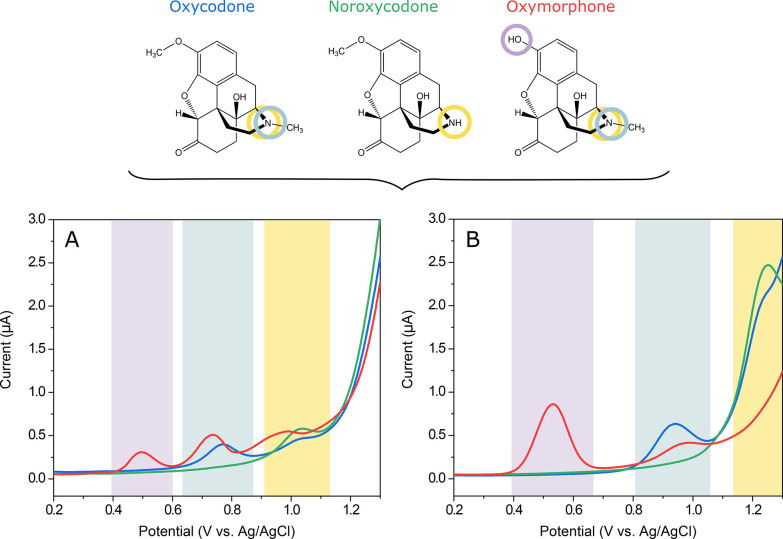
Figure 4 shows the DPV curves for 10 μM oxycodone, noroxycodone, and oxymorphone measured with a plain SWCNT electrode (Figure 4A) and Nafion/SWCNT (Figure 4B). The color bars highlight the oxidation peaks tentatively assigned to two different functional groups, also indicated with corresponding colored circles in the chemical structures of oxycodone and the metabolites. Interestingly, although these analytes only differ from each other by one functional group, both electrode types give different responses to each molecule.
Figure 4.
Suggested electrochemical behavior of oxycodone and metabolites. 10 μM oxycodone (blue), 10 μM noroxycodone (green), and 10 μM oxymorphone (red) measured with (A) a plain SWCNT electrode with no accumulation time and (B) a Nafion/SWCNT electrode with 5 min accumulation time. Color bars highlight the oxidation peaks, tentatively assigned to two different functional groups, also indicated with corresponding colored circles in the chemical structures of oxycodone and the metabolites.
When measured without the Nafion coating, several oxidation peaks can be seen for each analyte. The first peak around 0.5 V is visible for oxymorphone but not for oxycodone or noroxycodone. Since the only functional group that is found in oxymorphone but is lacking from oxycodone and noroxycodone is the phenol, this oxidation peak can most probably be attributed to this group. In fact, we have seen this peak at a lower positive potential in our previous work with morphine,16 and it has also been assigned to a similar phenol group in morphine by Garrido et al.13
Similarly, the second peak at 0.75 V is common to oxycodone and oxymorphone but is not seen for noroxycodone, making the tertiary amine a probable source for this peak. The third peak, on the other hand, is well defined at about 1.0 V for all three molecules, which suggests that it could be due to further oxidation of the secondary amine. It has been shown in several studies that a tertiary amine frequently gives two separate oxidation peaks on carbon-based electrodes.12,16,17,35,36 However, based on these voltammograms, it is also possible that the third peak could be due to oxidation of the hydroxyl group in the amine ring.12 Moreover, Garrido et al.37 also assigned an oxidation peak for codeine at higher potentials for the methoxy group, which is also present in both oxycodone and noroxycodone.
Thus, due to the complex nature of the oxidation processes of oxycodone, it is not possible to make definite conclusions only based on voltammetric measurements alone. To confirm these suggestions for the peak assignments, further experiments involving collecting reaction products should be done.
When Nafion is applied onto the electrode, the current response changes significantly. The peak for the phenol group is clearly enhanced and shifted by about 50 mV to a more positive potential. The other two peaks are similarly shifted but with about 200 mV.
On the basis of this data, it seems that the order of the peaks is preserved also when using Nafion, since the middle peak (highlighted in light turquoise in Figure 4) still remains to be well defined only for oxycodone and oxymorphone and not for noroxycodone.
We have previously seen that with this material combination addition of Nafion either blocks or shifts the oxidation signal from the tertiary amine in codeine-like molecules.16 Although the results shown in Figure 4B are not conclusive, they would suggest that Nafion is indeed shifting the oxidation peaks related to both amine and hydroxyl groups. This might be purely due to a mass transfer effect introduced by the Nafion layer. However, it is also possible that the sulfonic groups of Nafion somehow interact or even react with some of the oxidizing groups in these molecules, thus altering their electrochemical behavior. In pH 7.4, the amine groups in the molecules are protonated and all three molecules are mainly in their cationic form (the pKa values for the amine groups are about 8.8, 9.5, and 8.2 for oxycodone, noroxycodone, and oxymorphone, respectively). Thus, it is likely that these cations interact with the sulfonic groups in Nafion also contributing to the enrichment behavior seen in Figure 3B. However, confirming the exact mechanisms of these interactions would require thorough investigations that are out of the scope of this paper.
Concentration Series for Oxycodone
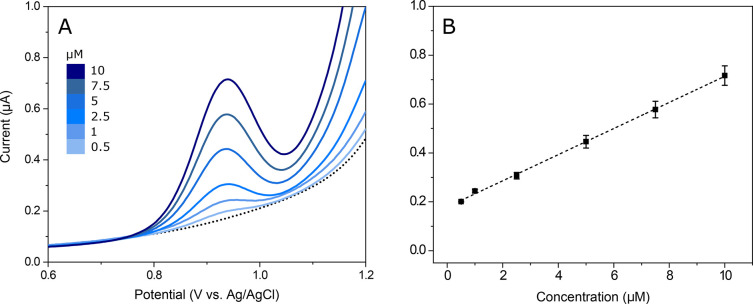
The results from the oxycodone concentration series are shown in Figure 5. In Figure 5A, the average peak currents (n = 4) are plotted against potential, and Figure 5B shows the average peak currents as a function of concentration. The error bars show the standard deviation between electrodes (n = 4). The linear range for oxycodone was 0.5–10 μM (i = 0.053cOXC + 0.179, r2 = 0.999), and the limit of detection was 85 nM.
Figure 5.
Concentration series for oxycodone. (A) Oxycodone with concentrations 0.5, 1, 2.5, 5, 7.5, and 10 μM with an accumulation time of 5 min. (B) Average oxidation peak currents as a function of oxycodone concentration. Error bars show the standard deviations of the peak currents (n = 4).
Stability of the Sensor Structure
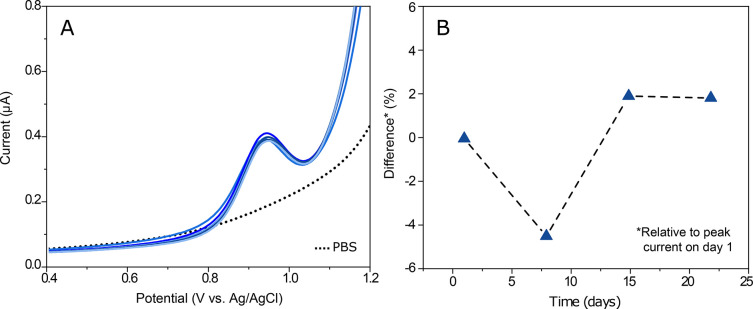
From the signal stability study, the RSD for the 5 μM oxycodone signal was found to be 2.3% (Figure 6A). For the electrode reproducibility, the RSD value for three electrodes at time point 1 was 10%. However, the electrodes seemed to be stabilized over time, since the RSD value was decreased down to 3.8% by day 22 after coating. The long-term stability of the electrodes was also found to be noticeably high, the RSD for the average peak currents between each time point being only 2.6%. Figure 6B shows the differences of the average values in the oxycodone peak current relative to day 1 in percentages as a function of days after coating. These results are quite satisfactory, especially considering the complex behavior of Nafion in aqueous solutions.
Figure 6.
Stability of the sensor. (A) Electrode signal stability; 5 μM oxycodone measured with one SWCNT 2.5% Nafion 6 times in a row. (B) Long-term stability. Three electrodes measured in 5 μM oxycodone after storing for 1, 8, 15, and 22 days after coating. Data shows the differences in the average values in the oxycodone peak current relative to day 1 in percentages as a function of days after coating.
Simultaneous Detection of Oxycodone and Metabolites
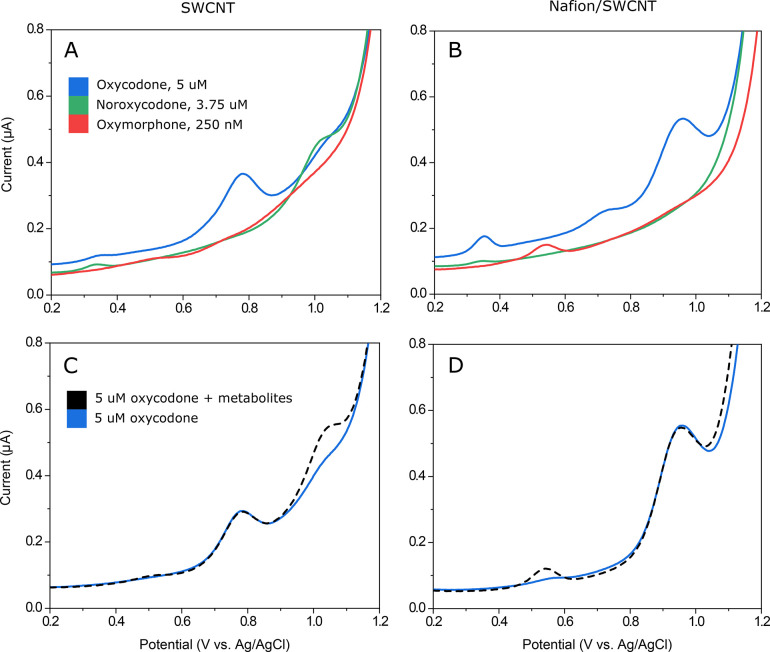
The DPV curves for 5 μM oxycodone, 3.75 μM noroxycodone, and 250 nM oxymorphone are shown in Figure 7 measured separately with an electrode without (Figure 7A) and with Nafion (Figure 7B). On the basis of these measurements, it would seem that both electrode types would be able to selectively detect oxycodone in the presence of its two metabolites (3.75 μM noroxycodone and 250 nM oxymorphone). In fact, this assumption is confirmed in Figure 7C and 7D, where oxycodone is first measured alone and then simultaneously with the two metabolites with plain SWCNT (Figure 7C) and Nafion/SWCNT (Figure 7D).
Figure 7.
Oxycodone and metabolites without and with 2.5% Nafion; 5 μM oxycodone (blue), 3.75 μM noroxycodone (green), and 250 nM oxymorphone (red) without Nafion (A) and with Nafion (B); 5 μM oxycodone (blue) and 5 μM oxycodone in the presence of the two metabolites, 3.75 μM noroxycodone and 250 nM oxymorphone (black dash), without Nafion (C) and with Nafion (D).
As can be seen from Figure 7A and 7B, it could be argued that when applying the electrode in real patient samples, oxycodone could be detected in the presence of the two metabolites even without the Nafion. The clinically relevant concentrations of oxycodone are typically well below 5 μM; for example, Lalovic et al. found the average peak plasma concentration of oxycodone to be around 0.12 μM after a single 15 mg oral dose.5 Thus, in most clinical situations, it is likely that the concentrations of oxycodone metabolites are below the detection limit of the electrode presented in this paper. However, addition of Nafion clearly increases the oxidation signal for oxycodone and thus improves the detection limit of the sensor. In addition, Nafion gives significant advantages when measuring in real samples as it filters out interferents and greatly reduces the matrix effects, enabling direct measurements in unprocessed biological samples.15,16
Conclusions
We developed a disposable, mass-producible Nafion-coated single-walled carbon nanotube sensor and demonstrated, for the first time, selective detection of oxycodone in the presence of its two major metabolites. The electrochemical behavior of oxycodone, noroxycodone, and oxymorphone was compared between a plain and a Nafion-coated SWCNT electrode. The Nafion membrane was seen to significantly affect the oxidation of these three analytes. With the Nafion/SWCNT electrode, a limit of detection of 85 nM and a linear range of 0.5–10 μM were achieved for oxycodone in buffer solution. In addition, both plain and Nafion-coated SWCNT electrodes were found to be able to detect oxycodone in the presence of its two metabolites noroxycodone and oxymorphone. However, the use of the Nafion membrane greatly enhanced the oxidation current for oxycodone, making the Nafion/SWCNT hybrid a preferable choice for detection of oxycodone in real samples. Thus, the Nafion/SWCNT electrode has real potential to be applied in a point-of-care device, aiding healthcare professionals in personalized dosing of oxycodone and other opioids.
Acknowledgments
This work was supported by Business Finland (FEDOC 211637 and FEPOD 2117731 projects), Aalto ELEC Doctoral School, and Orion Research Foundation. Jouko Laitila (Department of Clinical Pharmacology, University of Helsinki) is acknowledged for conducting the HPLC-MS/MS analysis of oxymorphone and Professor Jari Yli-Kauhaluoma’s laboratory, Faculty of Pharmacy, University of Helsinki, for synthesizing oxymorphone hydrochloride. S.S. acknowledges the Instrumentarium Science Foundation and Walter Ahlström Foundation for funding. Use of the Stanford Synchrotron Radiation Lightsource, SLAC National Accelerator Laboratory, is supported by the U.S. Department of Energy, Office of Science, Office of Basic Energy Sciences under Contract No. DE-AC02-76SF00515.
Author Contributions
All authors have given approval to the final version of the manuscript.
The authors declare no competing financial interest.
References
- Scholl L.; Seth P.; Kariisa M.; Wilson N.; Baldwin G. Release E. Drug and Opioid-Involved Overdose Deaths — United States, 2013 – 2017. Centers for Disease Control and Prevention. 2018, 67, 1419–1427. 10.15585/mmwr.mm675152e1. [DOI] [PMC free article] [PubMed] [Google Scholar]
- Smith H. S. Opioid metabolism. Mayo Clin. Proc. 2009, 84, 613–624. 10.4065/84.7.613. [DOI] [PMC free article] [PubMed] [Google Scholar]
- Cajanus K.; Neuvonen M.; Koskela O.; Kaunisto M. A.; Neuvonen P. J.; Niemi M.; Kalso E. Analgesic Plasma Concentrations of Oxycodone After Surgery for Breast Cancer—Which Factors Matter?. Clin. Pharmacol. Ther. 2018, 103, 653–662. 10.1002/cpt.771. [DOI] [PubMed] [Google Scholar]
- Moore K. A.; Ramcharitar V.; Levine B.; Fowler D. Tentative identification of novel oxycodone metabolites in human urine. J. Anal. Toxicol. 2003, 27, 346–352. 10.1093/jat/27.6.346. [DOI] [PubMed] [Google Scholar]
- Lalovic B.; Kharasch E.; Hoffer C.; Risler L.; Liu-Chen L. Y.; Shen D. D. Pharmacokinetics and pharmacodynamics of oral oxycodone in healthy human subjects: Role of circulating active metabolites. Clin. Pharmacol. Ther. 2006, 79, 461–479. 10.1016/j.clpt.2006.01.009. [DOI] [PubMed] [Google Scholar]
- Kinnunen M.; Piirainen P.; Kokki H.; Lammi P.; Kokki M. Updated Clinical Pharmacokinetics and Pharmacodynamics of Oxycodone. Clin. Pharmacokinet. 2019, 58, 705–725. 10.1007/s40262-018-00731-3. [DOI] [PubMed] [Google Scholar]
- Olkkola K.; Kontinen V.; Saari T.; Kalso E. Does the pharmacology of oxycodone justify its increasing use as an analgesic?. Trends Pharmacol. Sci. 2013, 34, 206–214. 10.1016/j.tips.2013.02.001. [DOI] [PubMed] [Google Scholar]
- Lemberg K.; Siiskonen A.; Kontinen V.; Yli-Kauhaluoma J.; Kalso E. Pharmacological characterization of noroxymorphone as a new opioid for spinal analgesia. Anesth. Analg. 2008, 106, 463–470. 10.1213/ane.0b013e3181605a15. [DOI] [PubMed] [Google Scholar]
- Protti M.; Catapano M. C.; Samolsky Dekel B. G.; Rudge J.; Gerra G.; Somaini L.; Mandrioli R.; Mercolini L. Determination of oxycodone and its major metabolites in haematic and urinary matrices: Comparison of traditional and miniaturised sampling approaches. J. Pharm. Biomed. Anal. 2018, 152, 204–214. 10.1016/j.jpba.2018.01.043. [DOI] [PubMed] [Google Scholar]
- Cheremina O.; Bachmakov I.; Neubert A.; Brune K.; Fromm M. F.; Hinz B. Simultaneous determination of oxycodone and its major metabolite, noroxycodone, in human plasma by high- performance liquid chromatography. Biomed. Chromatogr. 2005, 19, 777–782. 10.1002/bmc.516. [DOI] [PubMed] [Google Scholar]
- Schneider J. J.; Triggs E. J.; Bourne D. W.A.; Stephens I. D.; Haviland A. M. Determination of oxycodone in human plasma by high-performance liquid chromatography with electrochemical detection. J. Chromatogr., Biomed. Appl. 1984, 308, 359–362. 10.1016/0378-4347(84)80231-5. [DOI] [PubMed] [Google Scholar]
- Afkhami A.; Gomar F.; Madrakian T. CoFe2O4 nanoparticles modified carbon paste electrode for simultaneous detection of oxycodone and codeine in human plasma and urine. Sens. Actuators, B 2016, 233, 263–271. 10.1016/j.snb.2016.04.067. [DOI] [Google Scholar]
- Garrido J. M. P. J.; Delerue-Matos C.; Borges F.; Macedo T. R. A.; Oliveira-Brett A. M. Voltammetric oxidation of drugs of abuse: I. Morphine and metabolites. Electroanalysis 2004, 16, 1419–1426. 10.1002/elan.200302966. [DOI] [Google Scholar]
- Garrido J. M. P. J.; Delerue-Matos C.; Borges F.; Macedo T. R. A.; Oliveira-Brett A. M. Electrochemical Analysis of Opiates—An Overview. Anal. Lett. 2004, 37, 831. 10.1081/AL-120030282. [DOI] [Google Scholar]
- Mynttinen E.; Wester N.; Lilius T.; Kalso E.; Koskinen J.; Laurila T. Simultaneous electrochemical detection of tramadol and O-desmethyltramadol with Nafion-coated tetrahedral amorphous carbon electrode. Electrochim. Acta 2019, 295, 347–353. 10.1016/j.electacta.2018.10.148. [DOI] [Google Scholar]
- Wester N.; Mynttinen E.; Etula J.; Lilius T.; Kalso E.; Kauppinen E. I.; Laurila T.; Koskinen J. Simultaneous Detection of Morphine and Codeine in the Presence of Ascorbic Acid and Uric Acid and in Human Plasma at Nafion Single-Walled Carbon Nanotube Thin-Film Electrode. ACS Omega. 2019, 4, 17726–17734. 10.1021/acsomega.9b02147. [DOI] [PMC free article] [PubMed] [Google Scholar]
- Wester N.; Mynttinen E.; Etula J.; Lilius T.; Kalso E.; Mikladal B.ør. F.; Zhang Q.; Jiang H.; Sainio S.; Nordlund D.; Kauppinen E. I.; Laurila T.; Koskinen J. Single-walled carbon nanotube network electrode for sensitive detection of fentanyl citrate. ACS Appl. Nano Mater. 2020, 3, 1203. 10.1021/acsanm.9b01951. [DOI] [Google Scholar]
- Laurila T.; Sainio S.; Caro M. Hybrid carbon based nanomaterials for electrochemical detection of biomolecules. Prog. Mater. Sci. 2017, 88, 499–594. 10.1016/j.pmatsci.2017.04.012. [DOI] [Google Scholar]
- Sainio S.; Leppänen E.; Mynttinen E.; Palomäki T.; Wester N.; Etula J.; Isoaho N.; Peltola E.; Koehne J.; Meyyappan M.; Koskinen J.; Laurila T. Integrating Carbon Nanomaterials with Metals for Bio-sensing Applications. Mol. Neurobiol. 2020, 57, 179–190. 10.1007/s12035-019-01767-7. [DOI] [PMC free article] [PubMed] [Google Scholar]
- Leppänen E.; Peltonen A.; Seitsonen J.; Koskinen J.; Laurila T. Effect of thickness and additional elements on the filtering properties of a thin Nafion layer. J. Electroanal. Chem. 2019, 843, 12–21. 10.1016/j.jelechem.2019.05.002. [DOI] [Google Scholar]
- Moisala A.; Nasibulin A. G.; Brown D. P.; Jiang H.; Khriachtchev L.; Kauppinen E. I. Single-walled carbon nanotube synthesis using ferrocene and iron pentacarbonyl in a laminar flow reactor. Chem. Eng. Sci. 2006, 61, 4393–4402. 10.1016/j.ces.2006.02.020. [DOI] [Google Scholar]
- Kaskela A.; Nasibulin A. G.; Timmermans M. Y.; Aitchison B.; Papadimitratos A.; Tian Y.; Zhu Z.; Jiang H.; Brown D. P.; Zakhidov A.; Kauppinen E. I. Aerosol-synthesized SWCNT networks with tunable conductivity and transparency by a dry transfer technique. Nano Lett. 2010, 10, 4349–4355. 10.1021/nl101680s. [DOI] [PubMed] [Google Scholar]
- Nikitin A.; Ogasawara H.; Mann D.; Denecke R.; Zhang Z.; Dai H.; Cho K.; Nilsson A. Hydrogenation of single-walled carbon nanotubes. Phys. Rev. Lett. 2005, 95, 225507. 10.1103/PhysRevLett.95.225507. [DOI] [PubMed] [Google Scholar]
- Tang Y. H.; Sham T. K.; Hu Y. F.; Lee C. S.; Lee S. T. Near-edge X-ray absorption fine structure study of helicity and defects in carbon nanotubes. Chem. Phys. Lett. 2002, 366, 636–641. 10.1016/S0009-2614(02)01620-2. [DOI] [Google Scholar]
- Díaz J.; Anders S.; Cossy-Favre A.; Samant M.; Stöhr J. Enhanced secondary electron yield from oxidized regions on amorphous carbon films studied by x-ray spectromicroscopy. J. Vac. Sci. Technol., A 1999, 17, 2737–2740. 10.1116/1.581938. [DOI] [Google Scholar]
- Solomon D.; Lehmann J.; Kinyangi J.; Liang B.; Heymann K.; Dathe L.; Hanley K.; Wirick S.; Jacobsen C. Carbon (1s) NEXAFS spectroscopy of biogeochemically relevant reference organic compounds. Soil Sci. Soc. Am. J. 2009, 73, 1817–1830. 10.2136/sssaj2008.0228. [DOI] [Google Scholar]
- Dennis R. V.; Schultz B. J.; Jaye C.; Wang X.; Fischer D. A.; Cartwright A. N.; Banerjee S. Near-edge x-ray absorption fine structure spectroscopy study of nitrogen incorporation in chemically reduced graphene oxide. J. Vac. Sci. Technol., B: Nanotechnol. Microelectron.: Mater., Process., Meas., Phenom. 2013, 31, 041204. 10.1116/1.4813058. [DOI] [Google Scholar]
- Miedema P. S.; De Groot F. M. F. The iron L edges: Fe 2p X-ray absorption and electron energy loss spectroscopy. J. Electron Spectrosc. Relat. Phenom. 2013, 187, 32–48. 10.1016/j.elspec.2013.03.005. [DOI] [Google Scholar]
- Crocombette J. P.; Pollak M.; Jollet F.; Thromat N.; Gautier-Soyer M. X-ray-absorption spectroscopy at the Fe L 2, 3 threshold in iron oxides. Phys. Rev. B: Condens. Matter Mater. Phys. 1995, 52, 3143–3150. 10.1103/PhysRevB.52.3143. [DOI] [PubMed] [Google Scholar]
- Ishii I.; Hitchcook A. P. The oscillator strengths for C1s and O1s excitation of some saturated and unsaturated organic alcohols, acids and esters. J. Electron Spectrosc. Relat. Phenom. 1988, 46, 55–84. 10.1016/0368-2048(88)80005-7. [DOI] [Google Scholar]
- Ganguly A.; Sharma S.; Papakonstantinou P.; Hamilton J. Probing the thermal deoxygenation of graphene oxide using high-resolution in situ X-ray-based spectroscopies. J. Phys. Chem. C 2011, 115, 17009–17019. 10.1021/jp203741y. [DOI] [Google Scholar]
- Stöhr J.NEXAFS Spectroscopy. Springer Series in Surface Sciences; Springer, 1992; Vol. 25. [Google Scholar]
- Outka D. A.; Stöhr J.; Madix R. J.; Rotermund H. H.; Hermsmeier B.; Solomon J. NEXAFS studies of complex alcohols and carboxylic acids on the Si(111)(7 × 7) surface. Surf. Sci. 1987, 185, 53–74. 10.1016/S0039-6028(87)80613-1. [DOI] [Google Scholar]
- Furlan A.; Jansson U.; Lu J.; Hultman L.; Magnuson M. Structure and bonding in amorphous iron carbide thin films. J. Phys.: Condens. Matter 2015, 27, 045002. 10.1088/0953-8984/27/4/045002. [DOI] [PubMed] [Google Scholar]
- Garrido J. M. P. J.; Delerue-Matos C.; Borges F.; Macedo T. R. A.; Oliveira-Brett A. M. Voltammetric oxidation of drugs of abuse III. Heroin and metabolites. Electroanalysis 2004, 16, 1497–1502. 10.1002/elan.200302975. [DOI] [Google Scholar]
- Masui B. M.; Sayo H.; Tsuda Y. Anodic oxidation of amines. Part I. Cyclic voltammetry of aliphatic amines at a stationary glassy-carbon electrode. J. Chem. Soc. B 1968, 973–976. 10.1039/j29680000973. [DOI] [Google Scholar]
- Garrido J. M. P. J.; Delerue-Matos C.; Borges F.; Macedo T. R. A.; Oliveira-Brett A. M. Voltammetric oxidation of drugs of abuse: II. Codeine and metabolites. Electroanalysis 2004, 16, 1427–1433. 10.1002/elan.200302967. [DOI] [Google Scholar]


