Abstract
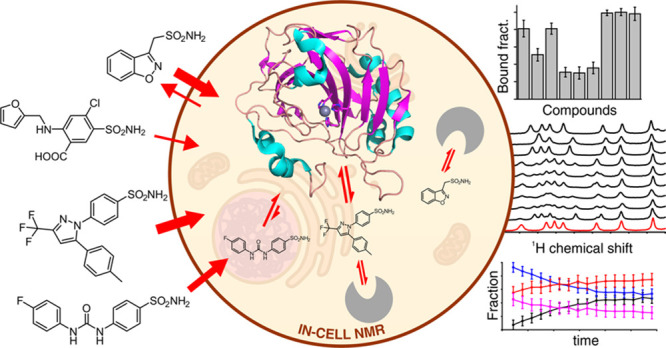
Candidate drugs rationally designed in vitro often fail due to low efficacy in vivo caused by low tissue availability or because of unwanted side effects. To overcome the limitations of in vitro rational drug design, the binding of candidate drugs to their target needs to be evaluated in the cellular context. Here, we applied in-cell NMR to investigate the binding of a set of approved drugs to the isoform II of carbonic anhydrase (CA) in living human cells. Some compounds were originally developed toward other targets and were later found to inhibit CAs. We observed strikingly different dose- and time-dependent binding, wherein some drugs exhibited a more complex behavior than others. Specifically, some compounds were shown to gradually unbind from intracellular CA II, even in the presence of free compound in the external medium, therefore preventing the quantitative formation of a stable protein–ligand complex. Such observations could be correlated to the known off-target binding activity of these compounds, suggesting that this approach could provide information on the pharmacokinetic profiles of lead candidates at the early stages of multitarget drug design.
Introduction
Classical rational drug design approaches aim at maximizing the activity toward a specific target in vitro. However, drug efficacy in vivo can be affected by many factors, such as low tissue availability, binding to off-target biomolecules, or unwanted side effects. Therefore, ideally, the binding to an intracellular target should not only be evaluated in vitro, in isolated conditions, but also directly in the cellular context, where poor cell penetrance or the occurrence of off-target binding can negatively affect the activity of potential drugs toward their main target. Cell-based activity assays provide an indirect measure of the effect of a drug, but may not easily discriminate the molecular origin of the cellular response. Ideally, the interaction of a potential drug with the intracellular target should be monitored directly at atomic resolution.
Among the existing atomic-resolution structural techniques, Nuclear Magnetic Resonance (NMR) spectroscopy stands out for its ability to investigate protein–ligand interactions in solution at physiological temperatures.1−3 Furthermore, in-cell NMR approaches have been developed that allow the atomic-level characterization of proteins and nucleic acids directly in living cells.4−8 In the context of drug development, in-cell NMR has been revealed to be a promising tool, as it can characterize interactions between small molecules and an intracellular target.9−12 Recently, we have employed in-cell NMR to investigate the interaction between multiple ligands and the second isoform of human carbonic anhydrase (CA, EC 4.2.1.1), CA II, in living human cells.13 This approach relies on the perturbation of the protein chemical shifts induced by ligand binding and allows an atomic-level description of the ligand binding site and, simultaneously, the measurement of intracellular dose- and time-dependent binding curves. From the latter data, important physicochemical properties of the ligands can be estimated, such as membrane permeability and apparent binding affinity, which are critical to assess the potency of the drugs toward the specific target.13
Carbonic anhydrases (CAs) are ubiquitous metalloenzymes that catalyze the conversion of CO2 and H2O to HCO3– and H+.14 In humans, 15 isoforms have been identified, all belonging to the α class, which contain a catalytic zinc ion in the active site coordinated by three conserved histidine residues and a water molecule/hydroxide anion in a distorted tetrahedral geometry.15 Although they have a high structural homology, the human isoforms differ in catalytic activity, structural properties of the binding cavity, subcellular localization, and response to exogenous molecules.14−16 The CO2 hydration reaction catalyzed by CAs is involved in many physiological processes, such as transport of CO2 between tissues and lungs during respiration, pH homeostasis, electrolyte transport in various tissues, and several biosynthetic pathways.14 Importantly, CA isoforms have been implicated in several pathological states, such as epilepsy, glaucoma, cardiovascular diseases, and cancer.17 Given the relevance of CAs as pharmacological targets, CA inhibitors have been developed over the course of several decades, some of which are currently administered in the treatment of glaucoma and epilepsy, and as diuretics.14 Current efforts are now focused on the development of CA inhibitors with higher isoform selectivity, which would allow the selective inhibition of a single isoform, thereby reducing the required dose for treatment and the insurgence of adverse effects.16,17 Indeed, a selective inhibitor of CA IX is currently in clinical development as an antitumor agent.18,19
Here, we applied the above in-cell NMR approach to screen, in human cells, the binding to CA II of a set of approved drugs that are known to inhibit human CAs. We focused on a selection of sulfonamide compounds representative of different categories of drugs, including anti-inflammatory drugs originally designed to inhibit non-CA targets, diuretics, and anticonvulsants, which exert their function through inhibition of multiple targets, including CAs, and an anticancer drug currently under clinical trials that was specifically designed to inhibit the tumor-associated isoform CA IX. While the chemical shift perturbation confirmed that all the ligands bound CA II in the active site of the protein, in accordance to the in vitro characterization, we observed strikingly different behaviors from the dose- and time-dependent binding data for each ligand. Specifically, while the binding mode of some ligands could be explained by diffusion-limited, strong binding kinetics, other ligands diverged from such a simplistic model and exhibited a more complex pharmacodynamic behavior, which could be correlated to the presence of off-target binding activity.
Results and Discussion
Properties of the Investigated Drugs
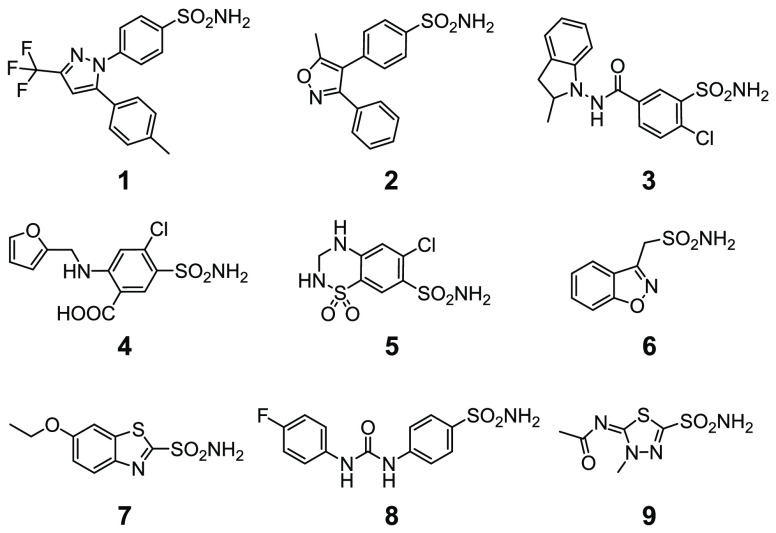
The structures of the investigated drugs and their properties are summarized in Chart 1 and Table 1. Celecoxib 1 and valdecoxib 2 are first- and second-generation COX-2-selective inhibitors, respectively, employed as nonsteroidal anti-inflammatory drugs (valdecoxib was withdrawn from clinical use); indapamide 3 (racemic mixture), furosemide 4, and hydrochlorothiazide 5 are high-ceiling diuretics, which reduce sodium reabsorption in the kidneys by binding to the electroneutral sodium-chloride cotransporter and are employed to treat hypertension, edema, and congestive heart failure. Zonisamide 6 is a widely used antiepileptic drug which binds to voltage-sensitive sodium and calcium channels; ethoxzolamide 7 is a diuretic, also employed to treat glaucoma, that inhibits CAs in proximal renal tubules. SLC-0111 8 is a recently developed CA IX inhibitor currently undergoing phase II-b clinical trials as an anticancer/antimetastatic agent; methazolamide 9 is a potent CA inhibitor employed in the treatment of glaucoma. Compounds 1–6 were not originally designed as CA inhibitors but were shown later to inhibit several pharmacologically relevant CA isoforms with nanomolar affinity.14,20−25 Conversely, compounds 7 and 8 were designed purposefully to inhibit CA activity. Compound 9 is a well-characterized compound, which was previously observed to bind quantitatively CA II in human cells by NMR13 and was included as a reference compound in the current study.
Chart 1. Chemical Structures of the Compounds Analyzed in This Study.
Table 1. Data on the Compounds Analyzed in This Study.
| n | name | MW | main target | used for | KI CA II (nM) |
|---|---|---|---|---|---|
| 1 | Celecoxib | 381.4 | COX-2 | inflammation, pain | 21 |
| 2 | Valdecoxib | 314.4 | COX-2 | inflammation, pain | 43 |
| 3 | Indapamide | 362.8 | Na/Cl cotransporter | hypertension, heart failure | 2520 |
| 4 | Furosemide | 330.7 | Na/K/Cl cotransporter | hypertension, heart failure, edema | 65 |
| 5 | Hydrochlorothiazide | 297.7 | Na/Cl cotransporter | hypertension, heart failure, edema, diabetes insipidus | 290 |
| 6 | Zonisamide | 212.2 | Sodium and T-type calcium channels (putative) | epilepsy, Parkinson’s disease | 35 |
| 7 | Ethoxzolamide | 258.3 | CA | glaucoma, duodenal ulcers | 8 |
| 8 | SLC-0111 | 309.3 | CA | tumor | 960 |
| 9 | Methazolamide | 236.3 | CA | glaucoma | 14 |
Drug Binding Monitored by 1H NMR
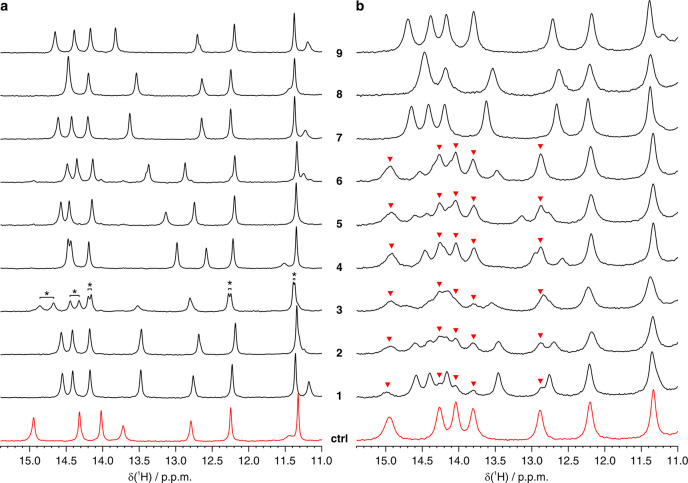
Drug binding to the intracellular protein was investigated by in-cell NMR by analyzing HEK293T cells transiently overexpressing CA II and subsequently treated with each compound at different doses and incubation times. Under our experimental conditions, CA II reaches an average concentration of 150 ± 20 μM in ∼150 μL of cell pellets (see Methods), as previously reported.13 Amino 1H signals arising from three histidine side chains located in the CA II active site, as well as 1H from other aromatic side chains, were clearly identified in the region of the 1D 1H NMR spectrum between 11 and 16 ppm (Figure 1). This spectral region is well-resolved and free from cellular background signals; therefore it can be analyzed without recurring to 15N isotopic labeling that is often necessary to reduce spectral overlap and avoid interference from non-NH background signals. Ligand binding induces changes in the chemical environment of the active site, giving rise to a new set of signals arising from the bound protein (Figure 2). In an aqueous buffer, all of the compounds quantitatively bound CA II when added in a stoichiometric amount, giving rise to distinct patterns of clearly resolved signals (Figure 2a).
Figure 1.
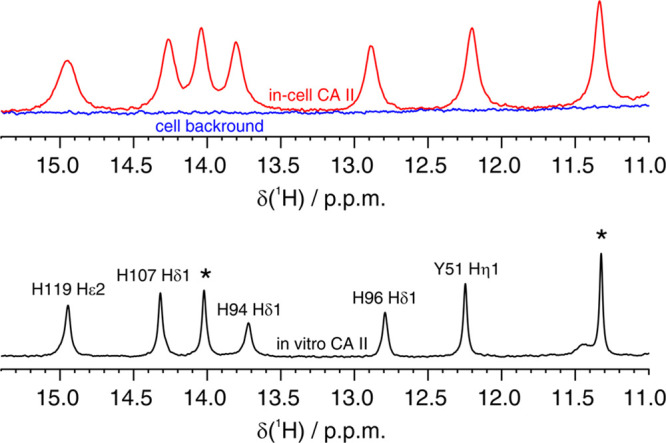
(Top) imino region of the 1D 1H NMR spectrum of CA II in human cells (red) overlaid to the spectrum of the cellular background obtained from cells transfected with empty vector (blue). (Bottom) 1D 1H NMR spectrum of CA II in aqueous buffer (black). Residues for which the unambiguous assignment has been reported previously are labeled with the corresponding residue number and atom type.40,41 H94, H96, and H119 coordinate the zinc ion in the active site. Signals arising from unassigned protons are labeled with an asterisk.
Figure 2.
Imino region of the 1H NMR spectra of CA II (a) in aqueous buffer and (b) in human cells in the absence (red) and in the presence (black) of the compounds investigated in this study. In vitro and in-cell NMR spectra were recorded for 15 and 30 min, respectively. In a, the signals which arise from CA II bound to the two enantiomers of 3 are labeled with an asterisk. In b, signals arising from free CA II are labeled with red arrows.
Fixed-Dose Drug Screening
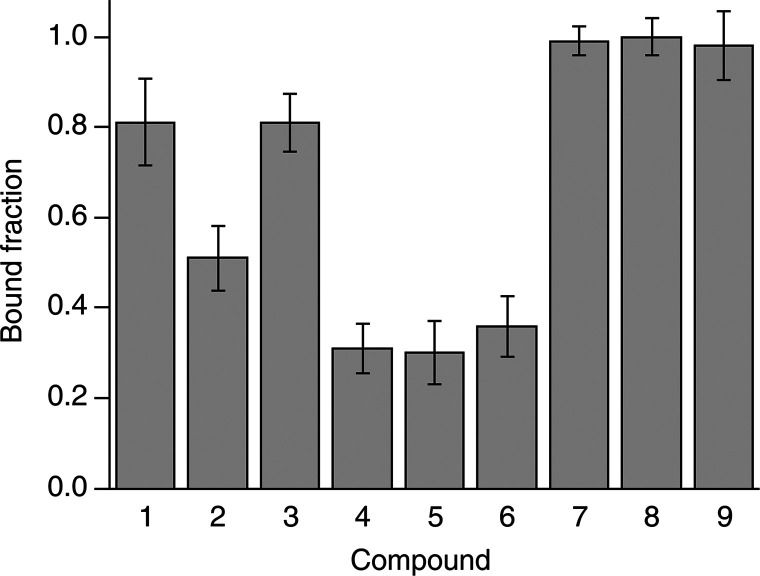
The intracellular binding of each compound was initially assessed by treating CA II-expressing cells with a 100 μM dose of each compound in 20 mL of external medium, therefore in a ∼100:1 molar ratio with respect to the protein (2 × 10⁻⁶ mol of compound vs ∼2 × 10⁻⁸ mol of CA II), followed by 1 h of incubation, removal of the external solution, cell detachment, and NMR analysis. The bound fraction for each compound was obtained as a time average from a 30-min-long in-cell NMR spectrum. Binding to CA II was observed for all compounds, although to varying degrees (Figure 2b). In cells, the chemical shifts of the bound state matched those observed in vitro, indicating that the binding mode of the compounds was essentially unchanged in the cellular setting. Additional line broadening, caused by faster transverse relaxation and magnetic inhomogeneity of the cell sample, resulted in an increased overlap between signals, which was overcome by signal deconvolution (Figure S2, see Methods). The fractions of free and bound intracellular protein could then be quantified by comparing the relative signal intensities of the two species in the in-cell 1H NMR spectra (Figure S2 and Figure 3). The large differences observed in the bound protein fractions at such a high dose treatment could not be explained with the different KI’s reported in vitro (Table 1) and suggested that the incomplete binding could be the consequence of poor drug permeability, as previously observed for other CA inhibitors.13 Notably, the two enantiomers of 3 bound CA II in equal amounts in vitro, resulting in two distinct sets of signals with similar intensities (Figure 2a). A similar pattern was also observed in cells, suggesting that the two enantiomers bound intracellular CA II with similar affinity; however the broader spectral lines and the presence of signals from free CA II prevented a more precise quantification of each enantiomer (Figure 2b).
Figure 3.
Bound fraction of intracellular CA II after incubation with 100 μM of each compound for 1 h, measured as a time average over 30 min. Error bars were obtained from the MCR-ALS global fitting of each dose/time-dependence series (shown in Figure 4) as follows: err = 2 × [lack of fit (%)]/100.
Dose- and Time-Dependent Drug Binding
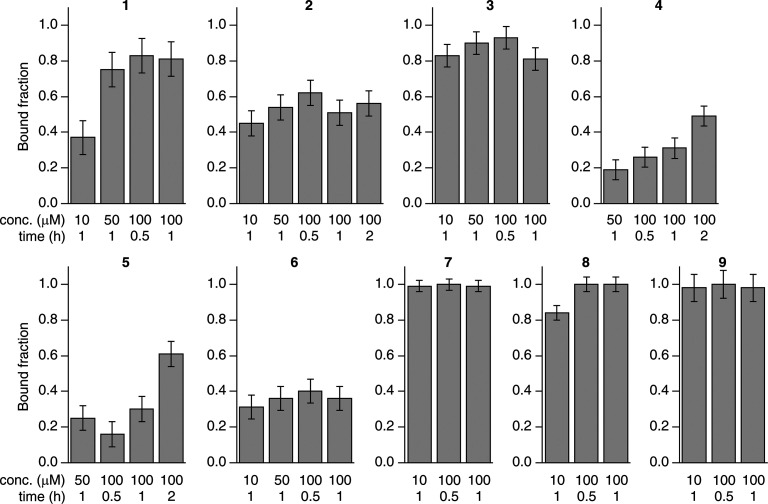
The dose- and time-dependency of binding was assessed by analyzing CA II-expressing cells treated with increasing doses of each compound (ranging from 10 to 100 μM in the external medium) and incubated for increasing times (ranging from 30 min to 2 h). The bound fraction under each condition was obtained from a 30-min-long NMR experiment as above (Figure 4). Compounds 7–9, which bound CA II completely at 100 μM for 1 h, gave essentially the same results both with a shorter incubation time (30 min) and with a much lower dose (10 μM, still a ∼10-fold molar excess with respect to the total CA II), whereas compounds 1–6, which did not bind CA II completely at 100 μM, showed different dose and time dependencies. Specifically, the fraction of CA II bound to 4 and 5 increased linearly as a function of time, consistent with binding kinetics limited by the plasma membrane permeability, irrespective of the binding affinity for CA II. Instead, CA II binding of compounds 1–3 and 6 did not show any dose or time dependency in the 50–100 μM range and reached a plateau at ∼70–80% (1), ∼50–60% (2), ∼80–90% (3), and ∼35–40% (6), indicating that the observed results in that dose range were not dependent on membrane permeability. For compounds 1 and 8, treatment at a 10 μM dose resulted in a decrease of the CA II bound fraction and allowed an estimation of the rates of permeability through the plasma membrane, in addition to those obtained from the time dependency of 4 and 5 at a high dose (Table 2, see Methods), whereas no significant decrease was observed at a 10 μM dose for compounds 2, 3, 6, 7, and 9, indicating a permeability KP × A > 6 × 10⁻⁷ dm3 s–1.
Figure 4.
Dose and time dependence of the binding of each compound to intracellular CA II. Each bar plot shows the fraction of CA II bound to a given compound after incubation at different concentrations and incubation times, measured as a time average over 30 min. Error bars were obtained from the MCR-ALS global fitting as follows: err = 2 × [lack of fit (%)]/100.
Table 2. Permeability Coefficient and Fraction of Bound CA II at Plateau Calculated for Each Compound from the Nonlinear Fitting of the Dose- and Time-Dependent Binding Data.
| n | KP × A (dm3 s–1) | bound CA II at plateau |
|---|---|---|
| 1 | (2.8 ± 0.7) × 10–7 | 78 ± 3% |
| 2 | >6 × 10⁻⁷ | 53 ± 2% |
| 3 | >6 × 10⁻⁷ | 86 ± 5% |
| 4 | (1.6 ± 0.4) × 10–8 | 100% |
| 5 | (1.8 ± 0.2) × 10–8 | 100% |
| 6 | >6 × 10⁻⁷ | 36 ± 5% |
| 7 | >6 × 10⁻⁷ | 100% |
| 8 | (5.4 ± 0.3) × 10–7 | 100% |
| 9 | >6 × 10⁻⁷a | 100% |
Previously measured KP × A = 1.2 × 10⁻⁶ dm3 s–1.13
Unbinding Kinetics by Time-Resolved in-Cell NMR
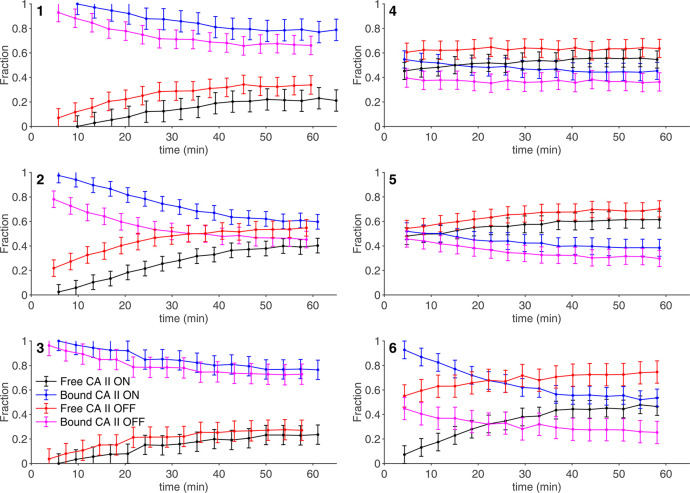
To further investigate the origin of the plateau effect observed in the 50–100 μM dose range, cells treated with 100 μM for 1 h (i.e., the same conditions for which time-averaged data were reported, see Figure 3) were analyzed as a function of time by performing a series of short in-cell NMR experiments over a total experimental time of 1 h (Figure 5, red and magenta curves). Interestingly, the binding of compounds 1–3 and 6 to intracellular CA II exhibited a marked time dependence, decreasing respectively from ∼100% to ∼66% (1), from ∼90% to ∼45% (2), from ∼100% to ∼75% (3), and from ∼50% to ∼30% (6) after 1 h (values at time 0 were extrapolated), whereas compounds 4 and 5 showed a less pronounced time dependence (Figure 5). These values are fully consistent with the measurements averaged over 30 min and indicate that these compounds are gradually released during the acquisition of the NMR spectra, thereby explaining the incomplete binding observed in the averaged data (Figure 3). In order to assess whether the same effect could occur in the cell culture, cells treated for 1 h with compounds 1–3 and 6 in the CO2 incubator were washed to remove the external ligand and further incubated in fresh medium without ligands. Quantitative NMR analysis of lysates from cells collected at increasing times showed that a similar unbinding behavior also occurred in the cell culture, although to a lower extent (Figure S3). The unbinding from CA II was also investigated in samples, initially treated with 100 μM of compound for 1 h, where the compound was reintroduced in the external solution of the cells during the NMR measurement (Figure 5, black and blue curves). Notably, while the unbinding of 1, 3, 4, and 5 was only partially mitigated under those conditions, compounds 2 and 6 showed a marked increase of bound protein at time 0. Therefore, the observed unbinding from CA II could be partially explained with the diffusion of ligand molecules from the cytosol back to the external solution (Figure S3). However, the observation of unbinding even in the presence of an external ligand (Figure 5) indicates that this phenomenon is not driven solely by passive diffusion.
Figure 5.
Time dependence of the intracellular fractions of free (black, red) and bound (blue, magenta) CA II in the NMR spectrometer measured in the absence (red and magenta) and in the presence (black and blue) of 100 μM of external ligand. Error bars were obtained from the MCR-ALS global fitting as follows: err = 2 × [lack of fit (%)]/100.
Drug Classification Based on Binding Behavior
The above results show that the interplay between active compound, intracellular target, plasma membrane, and cellular milieu can generate complex binding behaviors that are not easily described with a simple diffusion model. Nevertheless, the binding data obtained by in-cell NMR allowed a coarse-grained classification of the screened molecules. On the basis of the diffusion properties of the compounds (Table 2) and on the presence or absence of unbinding kinetics (Figure 5), the following classes are obtained: (I) fast-diffusing, stable binding (7, 8, 9); (II) slow-diffusing, stable binding (4, 5); and (III) fast-diffusing, unstable binding (1, 2, 3, 6). Slow-diffusing, unstable binding compounds were not observed, although it is possible that the slow diffusion of 4 and 5 masks the effects of binding instability. Strikingly, all class-I compounds have a mechanism of action that involves strong CA inhibition or were even rationally designed for selective CA inhibition (8), whereas class II and III compounds were not primarily intended for CA inhibition and have known activity toward other targets. This correlation suggests that the intracellular screening performed here could be used as a predictive tool to assess the specificity of a drug toward the desired intracellular target.
Binding of class I and II compounds follows a simple diffusion-limited binding behavior, where at low doses/short times the fraction of bound CA II depends linearly on the permeability of the compounds through the plasma membrane, while at high doses/long times CA II is fully bound to the compounds. In the dose and time ranges investigated, complete binding was only observed for class I. In such a regime, ligand binding is likely not affected by changes in the intracellular binding affinity, due to the intracellular concentration of CA II being in the ∼100s μM range while the KI’s are in the nanomolar to micromolar range.
Class III compounds behave essentially like class I during the cell incubation step, quickly diffusing through the plasma membrane and binding quantitatively to CA II (Figure 4 and Table 2) but are then partially released once the cells are detached for NMR analysis (Figure 5). Notably, while some release was observed prior to cell detachment after the compounds were removed from the cell growth medium (Figure S3), it also occurred when the ligand molecules in excess were kept in the external solution in the NMR tube (Figure 5). In the latter case, a delay in the onset of the unbinding was introduced together with an increase in the final fraction of bound CA II, while the slope of the curves was not affected. Although several scenarios are possible, such behavior may be partially explained by a model in which an additional species competes against CA II for ligand binding. However, this competitor must be introduced in the system after cells are detached for NMR analysis; otherwise it would have already been saturated with ligand molecules during the incubation step. It is possible that a change in membrane protein composition induced by trypsinization affects the turnover and the cellular localization of membrane proteins, including the known targets of class III compounds, namely, the membrane-bound COX-2 (1, 2), the integral membrane protein sodium-chloride cotransporter (3), and voltage-sensitive channels (6). This change would cause the emergence of a pool of competing binding sites that subtracts the ligands from CA II, with a kinetic behavior that can be modulated by the presence of additional ligand molecules in the external solution. However, these results only allow for speculation, as they report specifically on the free and bound fractions of CA II, with no information on the binding of the compounds to other intracellular targets. Furthermore, CA II has to be overexpressed to allow for NMR detection, making it in excess with respect to the competing targets, thus further complicating the interpretation of the results.
Conclusions
The above findings show that the application of in-cell NMR to investigate drug binding to an intracellular pharmacological target could have a relevant role in the drug discovery process. Indeed, this approach could provide early stage information on the pharmacokinetic profiles of lead candidates and allow preclinical investigations already at the drug-design and lead identification stages. Furthermore, small-scale screenings such as the one reported here could predict the specificity of a drug toward the desired target or, as in the case for class III compounds described above, warn against possible multitarget behavior.
Recently, in addition to the classical drug development routes, there has been growing interest in polypharmacological approaches, which aim at exploiting the off-target activities of drugs in combination with the activity toward their original targets for the treatment of complex disease states.26 Due to their involvement in different pathological states, human CA isoforms are ideal targets for multitarget drugs.17 Indeed, drugs such as those investigated here could be employed in novel therapeutic strategies in which CA inhibitors have been shown to be effective, such as against obesity, arthritis, cerebral ischemia, and neuropathic pain,27 by exploiting their multitargeting effect.
Here, intracellular ligand screening by NMR revealed an unpredicted behavior of some of these hybrid drugs, possibly as a consequence of their activity toward multiple targets. In this context, the in-cell NMR approach could have a marked relevance when designing and characterizing multitarget compounds, driving further optimization in the search of a balanced multitargeting efficacy and accelerating the development of next-generation polypharmacological drugs, also beyond the field of CAs. From a methodological standpoint, further advancements will be needed to allow observation of the binding of a compound to multiple intracellular targets simultaneously, without requiring their overexpression. In this respect, NMR bioreactors have proven to be valuable tools to increase both sensitivity and time resolution of the methodology.28,29 In parallel, 19F is being increasingly exploited as a sensitive and background-free probe for cellular NMR studies,11,30,31 hence a ligand-observed in-cell NMR approach could be envisaged that employs 19F-labeled compounds to obtain a more complete picture of their fate inside the cells as a function of time.
Methods
Human Cell Cultures
HEK293T cells (ATCC CRL-3216) were maintained in Dulbecco-modified Eagle medium (DMEM) high glucose (Gibco) supplemented with l-glutamine, antibiotics (penicillin and streptomycin), and 10% fetal bovine serum (FBS, Gibco) in uncoated 75 cm2 plastic flasks and incubated at 37 °C in 5% CO2 in a humidified atmosphere. HEK293T cells were transiently transfected, following a previously reported protocol,32 with the pHLsec33 plasmid containing the full-length human CA II gene (amino acids 1–260, GenBank: NP_000058.1)13 using branched polyethylenimine (PEI). A DNA/PEI ratio of 1:2 (25 μg/flask DNA, 50 μg/flask PEI) was used. Protein expression was carried out in DMEM medium supplemented with 2% FBS, antibiotics, and 10 μM ZnSO4. CA II concentration was calculated as previously reported13 from cells lysed in 1 cell pellet volume, corresponding to the effective concentration in the in-cell NMR samples (mean value ± sd, n = 3), and was measured by SDS-PAGE by comparing serial dilutions with a sample of purified CA II. Compounds 1–9 were purchased from Sigma-Aldrich or TCI Europe and are ≥97% HPLC pure. Cells overexpressing CA II were treated with the compounds 48 hours post-transfection, by dissolving a concentrated DMSO stock solution of each compound (80 mM) directly in 20 mL of expression medium in the cell culture flask. Experiments were performed by treating cells with varying amounts of each compound and incubated for varying amounts of time as specified in the Results section. Control cell samples were incubated for 1 h with pure DMSO (0.125% final concentration). Cell viability remained >95%, as assessed by trypan blue exclusion assay, and was not affected by treatment with any of the compounds in the dose and time ranges employed in the study (data not shown).
In-Cell NMR Sample Preparation
Samples for in-cell NMR were prepared as previously reported.32,34 Transfected cells were detached with trypsin, suspended in DMEM + 10% FBS, washed once with PBS, and resuspended in one pellet volume of NMR medium, consisting of DMEM supplemented with 90 mM glucose, 70 mM HEPES, and 20% D2O. The cell suspension was transferred in a 3 mm Shigemi NMR tube, which was gently spun to sediment the cells. For the unbinding experiments in the presence of the compound in the external solution, cells were prepared following the above protocol and resuspended in one pellet volume NMR medium supplemented with 100 μM of the compound. Cell viability before and after NMR experiments was assessed by trypan blue exclusion assay. After the NMR experiments, the cells were collected, and the supernatant was checked for protein leakage by NMR.
Cell Lysate Sample Preparation
Cultures of HEK293T cells overexpressing CA II were incubated with 100 μM of compound for 1 h. A control cell culture was immediately detached with trypsin, pelleted, and frozen at −20 °C. The remaining cell cultures were washed once with PBS and resuspended in fresh DMEM supplemented with 2% FBS, antibiotics, and 10 μM of ZnSO4, in the absence of the compound. Cells were incubated for varying amounts of time (30 min and 1 and 2 h) and subsequently collected and frozen at −20 °C. Cell lysates were prepared by freeze–thaw cycles in PBS buffer followed by centrifugation to remove the insoluble fraction. The supernatants were supplemented with 10% D2O, placed in a standard 3 mm NMR tube, and analyzed by NMR.
In-Cell NMR Spectra Acquisition and Analysis
In-cell NMR spectra were collected at 310 K either on a 900 MHz Bruker Avance NEO or on a 950 MHz Bruker Avance III spectrometer, both equipped with a 5 mm TCI CryoProbe. 1D 1H NMR spectra were recorded with a WATERGATE experiment using a 3–9–19 binomial pulse train for water suppression (Bruker p3919gp pulse program).35 Time-averaged NMR spectra were recorded with 1024 scans (total experimental time of 28 min). Time-resolved NMR data were collected by recording 16 1H NMR spectra, with the same parameters as above, with 128 scans each (total experimental time of 57 min). The spectra were processed with Bruker Topspin 4.0 by applying zero filling and exponential line broadening (LB = 20 Hz). To retrieve the area under each signal, the region between 11 and 16 ppm of each spectrum was fitted with Fityk36 using a sum of N + 1 pseudo-Voigt functions (Gaussian weight fixed at 0.15), where N equals the number of discernible signals in the region and the additional function accounted for the baseline distortion. Peak areas for each spectrum were normalized by the sum of the N areas. Relative fractions of free and bound CA II were obtained by multivariate curve resolution–alternate least square (MCR-ALS) analysis,37 using the MCR-ALS 2.0 GUI38 in MATLAB according to a previously reported protocol.29 The contribution of each CA II species to the signal intensities was retrieved from 2D arrays (one array per compound) containing the peak areas (rows = experiments, columns = peaks). Error bars for each fitting were obtained as follows: err = 2 × [lack of fit (%)]/100.
Nonlinear curve fitting of the binding data was performed in OriginPro 8 with the previously described dose- and time-dependent binding equation:13
where [Pt] is the total intracellular protein concentration, [LP] is the bound protein concentration, Kd is the dissociation constant, and C is the apparent fraction of ligand-bound CA II at the plateau, which is <1 in the presence of unbinding effects. [Lt.in](t) is the total intracellular ligand concentration defined as
where Lt = Lo + Li + LP are the total moles of ligand (Lo and Li are the extracellular and intracellular ligand, respectively), Vt is the total external volume, Kp is the permeability coefficient, and A is the total area of the membrane.
Expression and Purification of CA2
Recombinant CA II was prepared following an existing protocol.39 Briefly, a 1 L cell culture of E. coli BL21(DE3) Codon Plus Ripl (Stratagene) was transformed with a pCAM plasmid containing the CA II gene, grown overnight at 37 °C in LB, harvested, and resuspended in 1 L of M9 medium. ZnSO4 was added in the culture to a final concentration of 500 μM. After 5 h from induction with 1 mM isopropyl β-d-1-thiogalactopyranoside (IPTG) at 37 °C, the cells were harvested and resuspended in 20 mM Tris buffer, at pH 8 for lysis. The cleared lysate was loaded onto a nickel chelating HisTrap (GE Healthcare) 5 mL column. The protein was eluted with a linear gradient of 20 mM Tris at pH 8 and 500 mM imidazole. Fractions containing pure CA II were collected. Finally, the protein was exchanged in NMR buffer (HEPES 20 mM pH 7.5, supplemented with 10% D2O). The correct metalation of the protein was confirmed by a chemical shift comparison against previously reported spectra.13,28
Acknowledgments
This work has been supported by iNEXT-Discovery, grant agreement no. 871037, funded by the Horizon 2020 research and innovation programme of the European Commission; by Timb,3 grant agreement no. 810856, funded by the Horizon 2020 research and innovation programme of the European Commission; and by Ministero dell’Istruzione, dell’Università e della Ricerca PRIN grants 20177XJCHX and 2017XYBP2R. The authors acknowledge the support of Instruct-ERIC, a Landmark ESFRI project and the use of resources of the CERM/CIRMMP Italy Centre.
Supporting Information Available
The Supporting Information is available free of charge at https://pubs.acs.org/doi/10.1021/acschembio.0c00590.
Figures S1 and S2 (PDF)
The authors declare no competing financial interest.
Supplementary Material
References
- Shuker S. B.; Hajduk P. J.; Meadows R. P.; Fesik S. W. (1996) Discovering high-affinity ligands for proteins: SAR by NMR. Science 274, 1531–1534. 10.1126/science.274.5292.1531. [DOI] [PubMed] [Google Scholar]
- Pellecchia M.; Bertini I.; Cowburn D.; Dalvit C.; Giralt E.; Jahnke W.; James T. L.; Homans S. W.; Kessler H.; Luchinat C.; Meyer B.; Oschkinat H.; Peng J.; Schwalbe H.; Siegal G. (2008) Perspectives on NMR in drug discovery: a technique comes of age. Nat. Rev. Drug Discovery 7, 738–745. 10.1038/nrd2606. [DOI] [PMC free article] [PubMed] [Google Scholar]
- Baggio C.; Cerofolini L.; Fragai M.; Luchinat C.; Pellecchia M. (2018) HTS by NMR for the Identification of Potent and Selective Inhibitors of Metalloenzymes. ACS Med. Chem. Lett. 9, 137–142. 10.1021/acsmedchemlett.7b00483. [DOI] [PMC free article] [PubMed] [Google Scholar]
- Inomata K.; Ohno A.; Tochio H.; Isogai S.; Tenno T.; Nakase I.; Takeuchi T.; Futaki S.; Ito Y.; Hiroaki H.; Shirakawa M. (2009) High-resolution multi-dimensional NMR spectroscopy of proteins in human cells. Nature 458, 106–109. 10.1038/nature07839. [DOI] [PubMed] [Google Scholar]
- Luchinat E.; Banci L. (2017) In-cell NMR: a topical review. IUCrJ 4, 108–118. 10.1107/S2052252516020625. [DOI] [PMC free article] [PubMed] [Google Scholar]
- Dzatko S.; Krafcikova M.; Hänsel-Hertsch R.; Fessl T.; Fiala R.; Loja T.; Krafcik D.; Mergny J.-L.; Foldynova-Trantirkova S.; Trantirek L. (2018) Evaluation of the Stability of DNA i-Motifs in the Nuclei of Living Mammalian Cells. Angew. Chem., Int. Ed. 57, 2165–2169. 10.1002/anie.201712284. [DOI] [PMC free article] [PubMed] [Google Scholar]
- Luchinat E.; Banci L. (2018) In-Cell NMR in Human Cells: Direct Protein Expression Allows Structural Studies of Protein Folding and Maturation. Acc. Chem. Res. 51, 1550–1557. 10.1021/acs.accounts.8b00147. [DOI] [PubMed] [Google Scholar]
- Tanaka T.; Ikeya T.; Kamoshida H.; Suemoto Y.; Mishima M.; Shirakawa M.; Güntert P.; Ito Y. (2019) High-Resolution Protein 3D Structure Determination in Living Eukaryotic Cells. Angew. Chem., Int. Ed. 58, 7284–7288. 10.1002/anie.201900840. [DOI] [PubMed] [Google Scholar]
- DeMott C. M.; Girardin R.; Cobbert J.; Reverdatto S.; Burz D. S.; McDonough K.; Shekhtman A. (2018) Potent Inhibitors of Mycobacterium tuberculosis Growth Identified by Using in-Cell NMR-based Screening. ACS Chem. Biol. 13, 733–741. 10.1021/acschembio.7b00879. [DOI] [PMC free article] [PubMed] [Google Scholar]
- Krafcikova M.; Dzatko S.; Caron C.; Granzhan A.; Fiala R.; Loja T.; Teulade-Fichou M.-P.; Fessl T.; Hänsel-Hertsch R.; Mergny J.-L.; Foldynova-Trantirkova S.; Trantirek L. (2019) Monitoring DNA-Ligand Interactions in Living Human Cells Using NMR Spectroscopy. J. Am. Chem. Soc. 141, 13281–13285. 10.1021/jacs.9b03031. [DOI] [PubMed] [Google Scholar]
- Siegal G.; Selenko P. (2019) Cells, drugs and NMR. J. Magn. Reson. 306, 202–212. 10.1016/j.jmr.2019.07.018. [DOI] [PubMed] [Google Scholar]
- Kang C. (2019) Applications of In-Cell NMR in Structural Biology and Drug Discovery. Int. J. Mol. Sci. 20, 139. 10.3390/ijms20010139. [DOI] [PMC free article] [PubMed] [Google Scholar]
- Luchinat E.; Barbieri L.; Cremonini M.; Nocentini A.; Supuran C. T.; Banci L. (2020) Drug Screening in Human Cells by NMR Spectroscopy Allows the Early Assessment of Drug Potency. Angew. Chem., Int. Ed. 59, 6535–6539. 10.1002/anie.201913436. [DOI] [PMC free article] [PubMed] [Google Scholar]
- Supuran C. T. (2008) Carbonic anhydrases: novel therapeutic applications for inhibitors and activators. Nat. Rev. Drug Discovery 7, 168–181. 10.1038/nrd2467. [DOI] [PubMed] [Google Scholar]
- Supuran C. T. (2016) Structure and function of carbonic anhydrases. Biochem. J. 473, 2023–2032. 10.1042/BCJ20160115. [DOI] [PubMed] [Google Scholar]
- Alterio V.; Di Fiore A.; D’Ambrosio K.; Supuran C. T.; De Simone G. (2012) Multiple binding modes of inhibitors to carbonic anhydrases: how to design specific drugs targeting 15 different isoforms?. Chem. Rev. 112, 4421–4468. 10.1021/cr200176r. [DOI] [PubMed] [Google Scholar]
- Nocentini A.; Supuran C. T. (2019) Advances in the structural annotation of human carbonic anhydrases and impact on future drug discovery. Expert Opin. Drug Discovery 14, 1175–1197. 10.1080/17460441.2019.1651289. [DOI] [PubMed] [Google Scholar]
- A Study of SLC-0111 and Gemcitabine for Metastatic Pancreatic Ductal Cancer in Subjects Positive for CAIX - Full Text View. ClinicalTrials.gov. https://clinicaltrials.gov/ct2/show/NCT03450018 (accessed June 1, 2020). [Google Scholar]
- McDonald P. C.; Chia S.; Bedard P. L.; Chu Q.; Lyle M.; Tang L.; Singh M.; Zhang Z.; Supuran C. T.; Renouf D. J.; Dedhar S. (2020) A Phase 1 Study of SLC-0111, a Novel Inhibitor of Carbonic Anhydrase IX, in Patients With Advanced Solid Tumors. Am. J. Clin. Oncol. 43, 484–490. 10.1097/COC.0000000000000691. [DOI] [PMC free article] [PubMed] [Google Scholar]
- Weber A.; Casini A.; Heine A.; Kuhn D.; Supuran C. T.; Scozzafava A.; Klebe G. (2004) Unexpected nanomolar inhibition of carbonic anhydrase by COX-2-selective celecoxib: new pharmacological opportunities due to related binding site recognition. J. Med. Chem. 47, 550–557. 10.1021/jm030912m. [DOI] [PubMed] [Google Scholar]
- Di Fiore A.; Pedone C.; D’Ambrosio K.; Scozzafava A.; De Simone G.; Supuran C. T. (2006) Carbonic anhydrase inhibitors: Valdecoxib binds to a different active site region of the human isoform II as compared to the structurally related cyclooxygenase II “selective” inhibitor celecoxib. Bioorg. Med. Chem. Lett. 16, 437–442. 10.1016/j.bmcl.2005.09.040. [DOI] [PubMed] [Google Scholar]
- Temperini C.; Cecchi A.; Scozzafava A.; Supuran C. T. (2008) Carbonic anhydrase inhibitors. Interaction of indapamide and related diuretics with 12 mammalian isozymes and X-ray crystallographic studies for the indapamide-isozyme II adduct. Bioorg. Med. Chem. Lett. 18, 2567–2573. 10.1016/j.bmcl.2008.03.051. [DOI] [PubMed] [Google Scholar]
- Temperini C.; Cecchi A.; Scozzafava A.; Supuran C. T. (2009) Carbonic anhydrase inhibitors. Comparison of chlorthalidone and indapamide X-ray crystal structures in adducts with isozyme II: when three water molecules and the keto-enol tautomerism make the difference. J. Med. Chem. 52, 322–328. 10.1021/jm801386n. [DOI] [PubMed] [Google Scholar]
- Temperini C.; Cecchi A.; Scozzafava A.; Supuran C. T. (2008) Carbonic anhydrase inhibitors. Sulfonamide diuretics revisited--old leads for new applications?. Org. Biomol. Chem. 6, 2499–2506. 10.1039/b800767e. [DOI] [PubMed] [Google Scholar]
- De Simone G.; Di Fiore A.; Menchise V.; Pedone C.; Antel J.; Casini A.; Scozzafava A.; Wurl M.; Supuran C. T. (2005) Carbonic anhydrase inhibitors. Zonisamide is an effective inhibitor of the cytosolic isozyme II and mitochondrial isozyme V: solution and X-ray crystallographic studies. Bioorg. Med. Chem. Lett. 15, 2315–2320. 10.1016/j.bmcl.2005.03.032. [DOI] [PubMed] [Google Scholar]
- Moya-García A.; Adeyelu T.; Kruger F. A.; Dawson N. L.; Lees J. G.; Overington J. P.; Orengo C.; Ranea J. A. G. (2017) Structural and Functional View of Polypharmacology. Sci. Rep. 7, 10102. 10.1038/s41598-017-10012-x. [DOI] [PMC free article] [PubMed] [Google Scholar]
- Supuran C. T. (2020) Exploring the multiple binding modes of inhibitors to carbonic anhydrases for novel drug discovery. Expert Opin. Drug Discovery 15, 671–686. 10.1080/17460441.2020.1743676. [DOI] [PubMed] [Google Scholar]
- Cerofolini L.; Giuntini S.; Barbieri L.; Pennestri M.; Codina A.; Fragai M.; Banci L.; Luchinat E.; Ravera E. (2019) Real-Time Insights into Biological Events: In-Cell Processes and Protein-Ligand Interactions. Biophys. J. 116, 239–247. 10.1016/j.bpj.2018.11.3132. [DOI] [PMC free article] [PubMed] [Google Scholar]
- Luchinat E.; Barbieri L.; Campbell T. F.; Banci L. (2020) Real-Time Quantitative In-Cell NMR: Ligand Binding and Protein Oxidation Monitored in Human Cells Using Multivariate Curve Resolution. Anal. Chem. 92, 9997–10006. 10.1021/acs.analchem.0c01677. [DOI] [PMC free article] [PubMed] [Google Scholar]
- Ye Y.; Liu X.; Zhang Z.; Wu Q.; Jiang B.; Jiang L.; Zhang X.; Liu M.; Pielak G. J.; Li C. (2013) 19F NMR spectroscopy as a probe of cytoplasmic viscosity and weak protein interactions in living cells. Chem. - Eur. J. 19, 12705–12710. 10.1002/chem.201301657. [DOI] [PubMed] [Google Scholar]
- Veronesi M.; Giacomina F.; Romeo E.; Castellani B.; Ottonello G.; Lambruschini C.; Garau G.; Scarpelli R.; Bandiera T.; Piomelli D.; Dalvit C. (2016) Fluorine nuclear magnetic resonance-based assay in living mammalian cells. Anal. Biochem. 495, 52–59. 10.1016/j.ab.2015.11.015. [DOI] [PubMed] [Google Scholar]
- Barbieri L.; Luchinat E.; Banci L. (2016) Characterization of proteins by in-cell NMR spectroscopy in cultured mammalian cells. Nat. Protoc. 11, 1101–1111. 10.1038/nprot.2016.061. [DOI] [PubMed] [Google Scholar]
- Aricescu A. R.; Lu W.; Jones E. Y. (2006) A time- and cost-efficient system for high-level protein production in mammalian cells. Acta Crystallogr., Sect. D: Biol. Crystallogr. 62, 1243–1250. 10.1107/S0907444906029799. [DOI] [PubMed] [Google Scholar]
- Banci L.; Barbieri L.; Bertini I.; Luchinat E.; Secci E.; Zhao Y.; Aricescu A. R. (2013) Atomic-resolution monitoring of protein maturation in live human cells by NMR. Nat. Chem. Biol. 9, 297–299. 10.1038/nchembio.1202. [DOI] [PMC free article] [PubMed] [Google Scholar]
- Piotto M.; Saudek V.; Sklenár V. (1992) Gradient-tailored excitation for single-quantum NMR spectroscopy of aqueous solutions. J. Biomol. NMR 2, 661–665. 10.1007/BF02192855. [DOI] [PubMed] [Google Scholar]
- Wojdyr M. (2010) Fityk: a general-purpose peak fitting program. J. Appl. Crystallogr. 43, 1126–1128. 10.1107/S0021889810030499. [DOI] [Google Scholar]
- de Juan A.; Tauler R. (2006) Multivariate Curve Resolution (MCR) from 2000: Progress in Concepts and Applications. Crit. Rev. Anal. Chem. 36, 163–176. 10.1080/10408340600970005. [DOI] [Google Scholar]
- Jaumot J.; de Juan A.; Tauler R. (2015) MCR-ALS GUI 2.0: New features and applications. Chemom. Intell. Lab. Syst. 140, 1–12. 10.1016/j.chemolab.2014.10.003. [DOI] [Google Scholar]
- Cerofolini L.; Giuntini S.; Louka A.; Ravera E.; Fragai M.; Luchinat C. (2017) High-Resolution Solid-State NMR Characterization of Ligand Binding to a Protein Immobilized in a Silica Matrix. J. Phys. Chem. B 121, 8094–8101. 10.1021/acs.jpcb.7b05679. [DOI] [PubMed] [Google Scholar]
- Shimahara H.; Yoshida T.; Shibata Y.; Shimizu M.; Kyogoku Y.; Sakiyama F.; Nakazawa T.; Tate S.; Ohki S.; Kato T.; Moriyama H.; Kishida K.; Tano Y.; Ohkubo T.; Kobayashi Y. (2007) Tautomerism of histidine 64 associated with proton transfer in catalysis of carbonic anhydrase. J. Biol. Chem. 282, 9646–9656. 10.1074/jbc.M609679200. [DOI] [PubMed] [Google Scholar]
- Vasa S. K.; Singh H.; Grohe K.; Linser R. (2019) Assessment of a Large Enzyme-Drug Complex by Proton-Detected Solid-State NMR Spectroscopy without Deuteration. Angew. Chem., Int. Ed. 58, 5758–5762. 10.1002/anie.201811714. [DOI] [PubMed] [Google Scholar]
Associated Data
This section collects any data citations, data availability statements, or supplementary materials included in this article.


