

Abstract
Background
The germline cancer predisposition genes associated with increased risk of each clinical subtype of breast cancer, defined by estrogen receptor (ER), progesterone receptor (PR), and HER2, are not well defined.
Methods
A total of 54 555 invasive breast cancer patients with 56 480 breast tumors were subjected to clinical hereditary cancer multigene panel testing. Heterogeneity for predisposition genes across clinical breast cancer subtypes was assessed by comparing mutation frequencies by gene among tumor subtypes and by association studies between each tumor subtype and reference controls.
Results
Mutations in 15 cancer predisposition genes were detected in 8.6% of patients with ER+/HER2-; 8.9% with ER+/HER2+; 7.7% with ER-/HER2+; and 14.4% of ER-/PR-/HER2- tumors. BRCA1, BRCA2, BARD1, and PALB2 mutations were enriched in ER- and HER2- tumors; RAD51C and RAD51D mutations were enriched in ER- tumors only; TP53 mutations were enriched in HER2+ tumors, and ATM and CHEK2 mutations were enriched in both ER+ and/or HER2+ tumors. All genes were associated with moderate (odds ratio > 2.00) or strong (odds ratio > 5.00) risks of at least one subtype of breast cancer in case-control analyses. Mutations in ATM, BARD1, BRCA1, BRCA2, CHEK2, PALB2, RAD51C, RAD51D, and TP53 had predicted lifetime absolute risks of at least 20.0% for breast cancer.
Conclusions
Germline mutations in hereditary cancer panel genes confer subtype-specific risks of breast cancer. Combined tumor subtype, age at breast cancer diagnosis, and family history of breast and/or ovarian cancer information provides refined categorical estimates of mutation prevalence for women considering genetic testing.
Estrogen receptor (ER), progesterone receptor (PR), and HER2 tumor markers are routinely used for clinical subtype classification for breast cancer and selection of therapeutic strategies (1–3). Approximately 70.0% of breast cancers are ER positive (ER+) tumors, including 10.0–20.0% ER+/HER2+ and 50.0–60.0% ER+/HER2-, whereas 15.0% are ER negative (ER-)/HER2+ tumors and 15.0% are ER-/PR-/HER2- triple-negative breast cancers (TNBC) (4–6).
Next-generation sequencing of breast tumors and germline multigene panel testing of women with breast cancer has revealed molecular heterogeneity for predisposition genes within breast tumor subtypes (7,8). BRCA1 and BRCA2 mutations are found in 11.0% of patients with TNBC (9) and in up to 68.0% of all TNBC patients with predisposition gene mutations (10). This may have implications for treatment with selected forms of chemotherapy (7) or targeted poly ADP ribose polymerase inhibitors (11). Likewise, germline mutations in BARD1, BRIP1, PALB2, RAD51C, RAD51D, and TP53 have been associated with increased risks of TNBC (9,12), and mutations in BARD1, BRCA1, BRIP1, RAD51C, and RAD51D are more frequent in TNBC than other subtypes of breast cancer (10). In addition, germline TP53 mutations have been reported in 1.4% of HER2+ breast cancers (13); CHEK2 c.1100delC mutations have been observed more frequently in women with ER+ tumor subtypes (14,15), and ATM mutations have been observed more frequently in women with other breast cancer subtypes relative to TNBC (10). However, the influence of mutations in individual predisposition genes on all clinical subtypes of breast cancer defined by ER, PR, and HER2 status has not been established (16,17). Such studies may provide insight into breast cancer risk in the population and may have implications for selection of therapy and personalized clinical management. Thus, a better understanding of the germline mutations associated with each subtype is needed.
In this study, we evaluated cancer predisposition genes that have established associations with breast cancer and tested the hypothesis that each gene has heterogeneous associations across clinical breast cancer subtypes defined by ER and HER2 status in a 54 555 breast cancer patients subjected to multigene panel testing in a single testing laboratory.
Methods
Study Population
This study included results from hereditary cancer genetic testing at Ambry Genetics of 54 555 female invasive breast cancer patients (age at diagnosis 18 years and older) of any race or ethnicity from 2012 to 2016 (Supplementary Table 1, available online). Test requisitions were completed by the ordering clinicians. These included information on personal history of cancer; age at diagnosis; cancer pathology; ER, PR, and HER2 status; and family history of cancer. Information was also abstracted from available clinical records, including pedigrees, clinic notes, and pathology reports. The accuracy of the ER, PR, and HER2 status was reported as 99.5%, 98.8%, and 96.3%, respectively (18). Breast tumors were classified by ER and HER2 status (Table 1). Although PR status was available, ER and PR status were rarely discrepant and subgroups defined by ER, PR, and HER2 were too small for informative analyses (Supplementary Table 10, available online). Thus, tumors were categorized as ER+/HER2-, ER-/HER2+, ER+/HER2+, and both ER-/HER2- and ER-/PR-/HER2- TNBC (Table 1). For patients with multiple breast cancers, all analyses were restricted to first breast cancers. Thus, synchronous tumors were included, whereas asynchronous second breast cancers were excluded. Tumors were not stratified by morphology status. The Western Institutional Review Board determined that the study was exempt from review.
Table 1.
Characteristics of study population based on first invasive clinical breast tumor subtypes
| Patient characteristic | Single breast cancer | Multiple* breast cancer | Patients in clinical breast cancer pathology subtypes† |
|||||
|---|---|---|---|---|---|---|---|---|
| ER+/HER2- | ER+/HER2+ | ER-/HER2+ | ER-/HER2- | TNBC | P | | |||
| Patient No. (n = 54 555) | 49 301 | 5254 | 25 567 | 5771 | 2630 | 10 371 | 10 089 | |
| Tumor No. (n= 56 480)‡ | 49 301 | 7179 | 26 620 | 5979 | 2701 | 10 621 | 10 292 | |
| Mean age (SD), y | 49.5 (11.5) | 50.2 (11.1) | 50.9 (11.5) | 46.6 (11.2) | 47.0 (11.1) | 49.7 (11.2) | 49.8 (11.5) | < .001 |
| Race and ethnicity, No. (%) | <.001 | |||||||
| Black | 3981 (8.1) | 411 (7.8) | 1548 (6.1) | 450 (7.8) | 263 (10.0) | 1538 (14.8) | 1497 (14.8) | |
| Non-Hispanic white | 31 375 (63.6) | 3505 (66.7) | 16 780 (65.6) | 3573 (61.9) | 1572 (59.8) | 6074 (58.6) | 5907 (58.5) | |
| Ashkenazi Jews | 2348 (4.8) | 275 (5.2) | 1371 (5.4) | 272 (4.7) | 99 (3.8) | 305 (2.9) | 298 (3.0) | |
| Asian | 2384 (4.8) | 224 (4.3) | 1287 (5.0) | 318 (5.5) | 167 (6.3) | 403 (3.9) | 391 (3.9) | |
| Hispanic | 2978 (6.0) | 196 (3.7) | 1390 (5.4) | 368 (6.4) | 178 (6.8) | 742 (7.2) | 718 (7.1) | |
| Other/unknown | 6235 (12.6) | 643 (12.2) | 3191 (12.5) | 790 (13.7) | 351 (13.3) | 1309 (12.6) | 1278 (12.7) | |
| Personal cancer history, No. (%) | ||||||||
| Breast cancer age at diagnosis, y | <.001 | |||||||
| 18–36 | 6097 (12.4) | 532 (10.1) | 2282 (9.0) | 1112 (19.3) | 488 (18.6) | 1384 (13.3) | 1336 (13.3) | |
| 37–45 | 13 311 (27.1) | 1311 (25.0) | 6664 (26.2) | 1781 (31.0) | 775 (29.5) | 2333 (22.5) | 2248 (22.4) | |
| 46–50 | 9307 (18.9) | 1092 (20.8) | 5110 (20.1) | 977 (17.0) | 457 (17.4) | 1725 (16.6) | 1677 (16.7) | |
| 51–60 | 11 803 (24.0) | 1359 (25.9) | 6009 (23.6) | 1181 (20.5) | 585 (22.3) | 3298 (31.8) | 3230 (32.1) | |
| >60 | 8620 (17.5) | 950 (18.1) | 5411 (21.2) | 703 (12.2) | 318 (12.1) | 1598 (15.4) | 1565 (15.6) | |
| Ovarian cancer | 641 (1.3) | 60 (1.1) | 313 (1.2) | 54 (0.9) | 21 (0.8) | 122 (1.2) | 116 (1.2) | .09 |
| Pancreatic cancer | 115 (0.2) | 9 (0.2) | 41 (0.2) | 4 (0.1) | 4 (0.2) | 26 (0.3) | 25 (0.2) | .06 |
| Colorectal cancer | 539 (1.1) | 74 (1.4) | 300 (1.2) | 48 (0.8) | 25 (1.0) | 98 (0.9) | 95 (0.9) | .06 |
| Endometrial cancer | 685 (1.4) | 99 (1.9) | 343 (1.3) | 69 (1.2) | 23 (0.9) | 132 (1.3) | 130 (1.3) | .21 |
| Family history, first and second degree, No. (%) | ||||||||
| Breast cancer | 29 217 (62.2) | 3173 (63.2) | 16 026 (65.3) | 3245 (59.5) | 1443 (57.5) | 5267 (50.8) | 5125 (54.2) | <.001 |
| Ovarian cancer | 5944 (12.7) | 542 (10.8) | 3223 (13.1) | 648 (11.9) | 315 (12.5) | 1075 (10.4) | 1035 (10.9) | <.001 |
| Pancreatic cancer | 4569 (9.7) | 467 (9.3) | 2461 (10.0) | 517 (9.5) | 220 (8.8) | 846 (8.2) | 821 (8.7) | .002 |
| Colorectal cancer | 10 915 (23.2) | 1206 (24.0) | 5825 (23.7) | 1195 (21.9) | 558 (22.2) | 2151 (20.7) | 2093 (22.1) | <.001 |
| Endometrial cancer | 3337 (7.1) | 361 (7.2) | 1795 (7.3) | 370 (6.8) | 134 (5.3) | 687 (6.6) | 673 (7.1) | <.001 |
| No cancer family history§ | 10 395 (22.1) | 1082 (21.6) | 4910 (20.0) | 1323 (24.2) | 647 (25.8) | 2706 (26.1) | 2630 (27.8) | <.001 |
Includes all patients with multiple breast cancers (synchronous and asynchronous). ER = estrogen receptor; TNBC = triple-negative breast cancer (ER-/PR-/HER2-).
Subtype analysis includes only primary breast tumors and concordant synchronous multiple breast tumors. Excludes discordant synchronous tumors (n = 245); P values refer to statistical significance of heterogeneity across the four ER/HER2-based clinical tumor subtypes.
Includes first primary breast tumors and all synchronous breast tumors (excludes second and asynchronous breast tumors).
No cancer family history of breast, ovarian, pancreatic, colorectal, and uterine and/or endometrial cancers.
The P values presented are the observed nominal values.
Predisposition Gene Mutation Screening
All germline truncating, consensus dinucleotide splice sites (+/−1 or 2), and any known pathogenic missense alterations in 15 genes implicated in breast cancer (ATM, BARD1, BRCA1, BRCA2, BRIP1, CDH1, CHEK2, MSH6, NBN, NF1, PALB2, PTEN, RAD51C, RAD51D, and TP53) that were identified by Ambry Genetics were assessed by a five-tier classification system (8,9,19–21). All mutations identified were submitted to ClinVar (National Center for Biotechnology Information, Bethesda, MD, USA). Reduced penetrance and CHEK2 missense variants were excluded. Large genomic rearrangements were retained for mutation frequency and case-case comparisons but were excluded from case-control comparisons with Genome Aggregation Database (gnomAD) reference data (9,22). Pathogenic mutations in the PASS category of gnomAD exome sequencing results from 123 136 unrelated individuals were used for case-control association studies (9). Analyses were restricted to patients not tested for BRCA1/2 mutations prior to panel testing.
Statistical Analysis
Enrichment of gene-specific mutations in individual subtypes was assessed by pairwise comparisons of subtypes using polytomous regression analysis with adjustment for age at diagnosis and family history of breast and ovarian cancer. Associations between mutations in each gene and individual clinical subtypes were also assessed by comparing frequencies of pathogenic mutations with gnomAD reference control populations weighted for the relative frequency of different races and ethnicities in the cases, using a weighted logistic regression model. Odds ratios (OR) and corresponding 95% confidence intervals (CIs) were estimated. The heterogeneity of predisposition gene mutation frequency between subtypes was assessed using a generalized linear regression test adjusted for age of breast cancer diagnosis. To assess the source of subtype heterogeneity, associations between gene-specific mutations and ER status, HER2 status, and the interaction of ER and HER2 status were evaluated by logistic regression adjusted for age at diagnosis of breast cancer. Lifetime absolute risks of breast cancer subtypes were estimated by combining OR estimates with age-adjusted subtype incidence rates from the SEER (Surveillance, Epidemiology, and End Results Program) registry (https://seer.cancer.gov/) (9). Hormone receptor status (HR), including ER or PR status, was used in place of ER. All analyses were performed with R (version 3.4.2). All statistical tests described above were two-sided, and P values less than .05 were considered statistically significant. When considering mutation frequency by age, patients were divided into groups of younger than 37, 37–45, 46–50, 51–60, and older than 60 years to reflect the criteria used for selection of patients for genetic testing in the National Comprehensive Cancer Network guidelines and to refine selection of women at younger ages of diagnosis.
Results
Study Population Characteristics
The clinical characteristics of the 54 555 invasive breast cancer patients with single primary (n = 49 301) or multiple breast cancers (n = 5254) are described in Table 1 and Supplementary Table 1 (available online). There were 49 301 single primary breast tumors and 7179 tumors from patients with multiple primary breast cancers (3850 synchronous tumors and 3329 first primary tumors from patients with asynchronous breast cancers). The mean (SD) age of first breast cancer diagnosis was 49.5 (11.5) years for patients with a single primary breast tumor and 50.2 (11.1) years for patients with multiple breast tumors. Race and ethnicity distributions, personal cancer history, and family cancer history were similar for single primary and multiple breast cancer patients. Among these, approximately 63.0% reported a family history of breast cancer (first- or second-degree relative), consistent with selection of patients for genetic testing (Table 1). Information on at least one histopathological tumor marker (ER, PR, or HER2) was available for the 56 480 breast tumors from these patients (Table 1). Clinical breast cancer subtypes defined by ER and HER2 yielded 26 620 (58.0%) ER+/HER2; 5979 (13.0%) ER+/HER2+; 2701 (5.9%) ER-/HER2+; and 10 621 (23.1%) ER-/HER2- breast tumors. Of these, 10 292 (22.4%) were assigned to the ER-/PR-/HER2- TNBC clinical subtype (Table 1; Supplementary Table 1, available online). The proportions of clinical subtypes were consistent with SEER18 2010–2015 breast cancer incidence data (ER and PR combined as HR) for women diagnosed younger than age 60 years. Statistically significant heterogeneity (P < .05) among subtypes was observed for mean age at diagnosis, age at diagnosis categories, race and ethnicity, and family history of breast and other cancers (Table 1). In particular, TNBC and/or ER-/HER2- tumors were more frequent in the black population than in other racial or ethnic groups (14.8% vs ≤10.0%; P < .001), and patients with no family history of common epithelial cancers had a lower frequency of ER+/HER2- tumors (P = .02) (Table 1). Among patients with multiple breast cancers, only moderate concordance between the clinical subtypes of the tumors was observed (Krippendorff’s alpha = 0.584) (Supplementary Table 2, available online) (23).
Pathogenic Mutation Prevalence in Breast Tumor Subtypes
Characteristics of mutation carriers and nonmutation carriers are shown in Supplementary Table 1 (available online). Pathogenic mutations in 15 predisposition genes were detected in 10.1% of the tumor cohort (Table 2). The pathogenic mutation prevalence was 8.6% in ER+/HER2-, 8.9% in ER+/HER2+, 7.7% in ER-/HER2+, and 14.4% in the TNBC subtype (Table 2). BRCA2, CHEK2, and ATM were the most frequently mutated genes (>1.0%) for ER+/HER2- and ER+/HER2+ tumors, whereas BRCA1 was the most frequently mutated gene for ER-/HER2+ (1.8%) and TNBC (6.7%) tumors (Table 2). Mutations in BARD1, BRCA1, BRCA2, and PALB2 were most frequently observed for TNBC (Table 2). BRIP1, RAD51C, and RAD51D mutations were also most frequent in TNBC, consistent with recent associations between mutations in these genes and TNBC (9). Similar results were observed when evaluating ER-/HER2- instead of TNBC or when restricting to the non-Hispanic white population (Supplementary Tables 3 and 4, available online). It was also noted that NBN mutations were not associated with moderate or high risks of any subtype of breast cancer, consistent with recent suggestions that NBN mutations are not associated with clinically relevant risks of breast cancer (OR > 2) (8,16).
Table 2.
Frequency of mutations in cancer predisposition genes by clinical pathology tumor subtype
| Gene | Overall |
ER+/HER2- |
ER+/HER2+ |
ER-/HER2+ |
TNBC |
Het* | ||||||||||
|---|---|---|---|---|---|---|---|---|---|---|---|---|---|---|---|---|
| No. tested | No. mutation | Freq (%) | No. tested | No. mutation | Freq (%) | No. tested | No. mutation | Freq (%) | No. tested | No. mutation | Freq (%) | No. tested | No. mutation | Freq (%) | P† | |
| ATM | 33 317 | 357 | 1.1 | 15 882 | 179 | 1.1 | 3507 | 59 | 1.7 | 1586 | 17 | 1.1 | 6117 | 13 | 0.2 | <.001 |
| BARD1 | 31 053 | 97 | 0.3 | 14 778 | 24 | 0.2 | 3280 | 7 | 0.2 | 1480 | 5 | 0.3 | 5670 | 53 | 0.9 | <.001 |
| BRCA1 | 42 989 | 949 | 2.2 | 20 275 | 185 | 0.9 | 4562 | 32 | 0.7 | 2030 | 37 | 1.8 | 7896 | 530 | 6.7 | <.001 |
| BRCA2 | 42 989 | 954 | 2.2 | 20 275 | 424 | 2.1 | 4562 | 76 | 1.7 | 2030 | 26 | 1.3 | 7896 | 212 | 2.7 | <.001 |
| BRIP1 | 31 129 | 96 | 0.3 | 14 825 | 43 | 0.3 | 3285 | 8 | 0.2 | 1484 | 1 | 0.1 | 5680 | 26 | 0.5 | .06 |
| CDH1 | 42 030 | 36 | 0.1 | 19 795 | 22 | 0.1 | 4464 | 2 | 0.0 | 1985 | 1 | 0.1 | 7715 | 4 | 0.1 | .33 |
| CHEK2 | 33 262 | 548 | 1.7 | 15 864 | 305 | 1.9 | 3502 | 81 | 2.3 | 1583 | 17 | 1.1 | 6101 | 23 | 0.4 | <.001 |
| MSH6 | 18 667 | 48 | 0.3 | 9146 | 24 | 0.3 | 1885 | 6 | 0.3 | 851 | 1 | 0.1 | 3233 | 9 | 0.3 | .79 |
| NBN | 31 053 | 81 | 0.3 | 14 778 | 40 | 0.3 | 3280 | 7 | 0.2 | 1480 | 2 | 0.1 | 5670 | 12 | 0.2 | .81 |
| NF1 | 30 501 | 42 | 0.1 | 14 554 | 16 | 0.1 | 3219 | 7 | 0.2 | 1456 | 2 | 0.1 | 5585 | 11 | 0.2 | .37 |
| PALB2 | 35 374 | 362 | 1.0 | 16 844 | 155 | 0.9 | 3733 | 26 | 0.7 | 1667 | 8 | 0.5 | 6501 | 93 | 1.4 | <.001 |
| PTEN | 43 074 | 32 | 0.1 | 20 314 | 17 | 0.1 | 4572 | 2 | 0.0 | 2034 | 2 | 0.1 | 7901 | 3 | 0.0 | .30 |
| RAD51C | 31 129 | 68 | 0.2 | 14 825 | 24 | 0.2 | 3285 | 3 | 0.1 | 1484 | 4 | 0.3 | 5680 | 26 | 0.5 | .001 |
| RAD51D | 30 577 | 29 | 0.1 | 14 601 | 8 | 0.1 | 3224 | 1 | 0.0 | 1460 | 1 | 0.1 | 5595 | 14 | 0.3 | .001 |
| TP53 | 43 173 | 82 | 0.2 | 20 356 | 25 | 0.1 | 4581 | 19 | 0.4 | 2037 | 13 | 0.6 | 7921 | 9 | 0.1 | <.001 |
| Total | 10.1 | 8.6 | 8.9 | 7.7 | 14.4 | |||||||||||
Heterogeneity analysis using generalized linear regression test adjusted for age at diagnosis and race and ethnicity. ER = estrogen receptor; Freq = mutation frequency; Het = heterogeneity; TNBC = triple-negative breast cancer (ER-/PR-/HER2-).
The P values presented are the observed nominal values.
Heterogeneity of Predisposition Gene Mutations Among Breast Tumor Subtypes
ATM, BARD1, BRCA1, BRCA2, CHEK2, PALB2, RAD51C, RAD51D, and TP53 displayed heterogeneity in mutation frequency across the subtypes (Table 2; Supplementary Table 3, available online) overall and in the non-Hispanic white population (Supplementary Table 4, available online). Similar results were obtained for tumors from single breast cancer patients (Supplemental Table 5, available online). Some estimates were based on small numbers of mutations and should be interpreted with caution. ER status contributed to the heterogeneity associated with all of these genes other than TP53; HER2 status contributed to the subtype heterogeneity for ATM, BARD1, BRCA1, BRCA2, CHEK2, PALB2, and TP53; and interactions between both markers contributed to heterogeneity for ATM, BARD1, BRCA1, and CHEK2 (Supplementary Table 6, available online). Next, pairwise subtype comparisons were conducted to assess enrichment of mutations in specific subtypes (Figure 1; Supplementary Table 7, available online). ATM and CHEK2 mutations were statistically significantly enriched in ER+/HER2+, ER+/HER2-, and ER-/HER2+ tumors relative to TNBC (Figure 1). In addition, CHEK2 was enriched in ER+/HER2+ tumors relative to ER-/HER2+. BARD1, BRCA1, PALB2, and RAD51D mutations were statistically significantly enriched more than twofold in TNBC compared with all ER+ or HER2+ tumor subtypes, consistent with established associations with increased risk of TNBC (9). BRCA1 mutations were also 2.8-fold enriched in ER-/HER2+ relative to ER+/HER2+, and RAD51C was also statistically significantly enriched more than twofold in TNBC relative to ER+ tumor subtypes (ER+/HER2- and ER+/HER2+), but not relative to the ER-/HER2+ subtype (Supplementary Table 7, available online). BRCA2 mutations were enriched in TNBC relative to HER2+ subtypes and in ER+/HER2- relative to ER+/HER2+. Finally, TP53 mutations were more common in HER2+ tumors than in HER2- subtypes (Figure 1; Supplementary Tables 6, 7, and 8, available online), consistent with previously reported associations between TP53 somatic mutations and HER2+ tumor etiology (13,24,25).
Figure 1.

Enrichment of gene-specific mutations in breast cancer subtypes. Pairwise comparisons of gene-specific mutations in breast cancer clinical tumor subtypes defined as ER+/HER2+, ER+/HER2-, ER-/HER2+, and triple-negative breast cancer (TNBC) are shown. Only genes with one or more statistically significant odds ratio among the six pairwise comparisons were included.
Gene-Specific Mutations Associated With Increased Risk of Breast Cancer Subtypes
In case-control association analyses to identify predisposition genes for each breast cancer subtype, BRCA1, BRCA2, and PALB2 mutations were associated with all subtypes (Figure 2 and Table 3; Supplementary Table 9, available online). Similarly, TP53 was associated with all subtypes, with greatest effects in ER+/HER2+ and ER-/HER2+ subtypes. ATM was associated with all subtypes except TNBC, whereas CHEK2 was only associated with ER+ subtypes (ER+/HER2+ and ER+/HER2-) (Figure 2 and Table 3; Supplementary Table 9, available online). Among genes with at least five mutations, BARD1, BRCA1, BRCA2, BRIP1, MSH6, NF1, PALB2, RAD51C, RAD51D, and TP53 were all associated with the TNBC subtype (9). In addition, ATM, BRCA1, BRCA2, PALB2, and TP53 were associated with the ER-/HER2+ subtype (Figure 2 and Table 3) in the entire cohort and when restricting to non-Hispanic whites (Supplementary Table 9, available online). Sensitivity analyses incorporating PR status to define tumor subtypes yielded similar associations (Supplementary Table 10, available online). However, CHEK2 mutations were more strongly associated with ER+/PR+/HER2+ (OR = 3.53, 95% CI = 2.72 to 4.56) than ER+/PR-/HER2+ (OR = 2.11, 95% CI = 1.04 to 4.01) (Supplementary Table 10, available online). Furthermore, BRCA1 mutations were more strongly associated with ER+/PR-/HER2- (OR = 10.8, 95% CI = 7.86 to 14.74) than ER+/PR+/HER2- tumors (OR = 2.74, 95% CI = 2.19 to 3.41) (Supplementary Table 10, available online).
Figure 2.
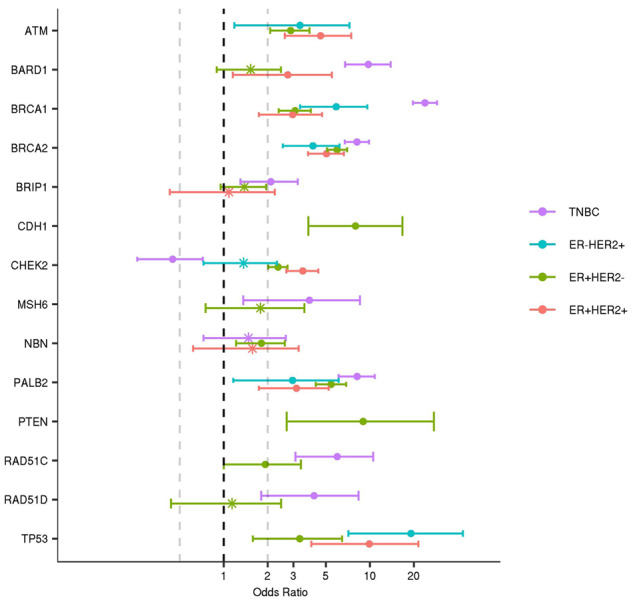
Associations between mutations in cancer predisposition genes and breast cancer subtypes. Semi-log (x-axis) plot of odds ratios estimated by comparing gene-specific mutation frequencies from breast cancer cases in each subtype with Genome Aggregation Database reference controls. Subtypes (ER+HER2+, ER+HER2-; ER-HER2+; and triple-negative breast cancer [TNBC]) were defined by estrogen receptor (ER), progesterone receptor, and HER2 status of tumors and are shown in color. Odds ratio estimates of statistically significant associations (P < .05) are labeled as “*” and nonstatistically significant associations are shown as “•.” 95% confidence intervals are shown as “whiskers.”
Table 3.
Case-control association analysis of mutations and breast cancer clinical pathology subtypes*
| Gene | ER+/HER2- |
ER+/HER2+ |
ER-/HER2+ |
TNBC |
|||||||||||||
|---|---|---|---|---|---|---|---|---|---|---|---|---|---|---|---|---|---|
| No. mut | No. tested | Freq (%) | OR (95% CI) | No. mut | No. tested | Freq (%) | OR (95% CI) | No. mut | No. tested | Freq (%) | OR (95% CI) | No. mut | No.tested | Freq (%) | OR (95% CI) | ||
| ATM | 136 | 13 197 | 1.0 | 2.65 (2.17 to 3.21) | 44 | 2892 | 1.5 | 3.99 (2.88 to 5.40) | 16 | 1321 | 1.2 | 3.21 (1.86 to 5.13) | 11 | 5204 | 0.2 | 0.57 (0.29 to 0.98) | |
| BARD1 | 18 | 12 280 | 0.2 | 1.53 (0.9 to 2.46) | 7 | 2703 | 0.3 | 2.74 (1.15 to 5.49) | 3 | 1229 | 0.2 | 2.60 (0.64 to 6.93) | 44 | 4824 | 0.9 | 9.76 (6.77 to 13.87) | |
| BRCA1 | 134 | 16 935 | 0.8 | 3.66 (2.95 to 4.53) | 24 | 3778 | 0.6 | 3.00 (1.92 to 4.48) | 23 | 1697 | 1.4 | 6.56 (4.14 to 9.88) | 370 | 6723 | 5.5 | 28.62 (24.16 to 34) | |
| BRCA2 | 307 | 16 935 | 1.8 | 5.96 (5.09 to 6.98) | 58 | 3778 | 1.5 | 5.05 (3.77 to 6.64) | 21 | 1697 | 1.2 | 4.08 (2.54 to 6.2) | 164 | 6723 | 2.4 | 8.16 (6.73 to 9.86) | |
| BRIP1 | 35 | 12 322 | 0.3 | 1.38 (0.95 to 1.94) | 6 | 2708 | 0.2 | 1.08 (0.43 to 2.23) | 1 | 1233 | 0.1 | 0.40 (0.02 to 1.76) | 21 | 4832 | 0.4 | 2.09 (1.30 to 3.20) | |
| CDH1 | 20 | 16 537 | 0.1 | 8.51 (4.36 to 17.04) | 2 | 3699 | 0.1 | 3.84 (0.60 to 13.68) | 1 | 1658 | 0.1 | 4.29 (0.24 to 21.26) | 4 | 6569 | 0.1 | 4.46 (1.26 to 12.43) | |
| CHEK2 | 221 | 13 190 | 1.7 | 2.35 (2.02 to 2.73) | 68 | 2889 | 2.4 | 3.48 (2.68 to 4.44) | 12 | 1320 | 0.9 | 1.37 (0.73 to 2.31) | 15 | 5189 | 0.3 | 0.45 (0.26 to 0.72) | |
| MSH6 | 17 | 7605 | 0.2 | 2.25 (1.30 to 3.66) | 5 | 1570 | 0.3 | 3.23 (1.14 to 7.14) | 1 | 722 | 0.1 | 1.41 (0.08 to 6.32) | 7 | 2726 | 0.3 | 2.66 (1.12 to 5.33) | |
| NBN | 32 | 12 280 | 0.3 | 1.81 (1.22 to 2.62) | 6 | 2703 | 0.2 | 1.57 (0.62 to 3.26) | 1 | 1229 | 0.1 | 0.58 (0.03 to 2.59) | 10 | 4824 | 0.2 | 1.48 (0.73 to 2.66) | |
| NF1 | 10 | 12 089 | 0.1 | 2.36 (1.11 to 4.56) | 5 | 2654 | 0.2 | 5.38 (1.85 to 12.5) | 1 | 1205 | 0.1 | 2.35 (0.13 to 10.83) | 10 | 4750 | 0.2 | 5.68 (2.68 to 10.94) | |
| PALB2 | 119 | 14 004 | 0.9 | 5.15 (4.07 to 6.5) | 19 | 3084 | 0.6 | 3.74 (2.25 to 5.86) | 8 | 1390 | 0.6 | 3.49 (1.57 to 6.64) | 73 | 5530 | 1.3 | 7.88 (5.96 to 10.32) | |
| PTEN | 13 | 16 975 | 0.1 | 10.35 (4.32 to 26.55) | 2 | 3786 | 0.1 | 6.76 (1.02 to 26.9) | 2 | 1702 | 0.1 | 14.46 (2.19 to 57.05) | 2 | 6727 | 0.0 | 3.64 (0.55 to 14.31) | |
| RAD51C | 17 | 12 322 | 0.1 | 1.60 (0.92 to 2.61) | 2 | 2708 | 0.1 | 0.87 (0.14 to 2.75) | 3 | 1233 | 0.2 | 2.94 (0.72 to 7.84) | 17 | 4832 | 0.4 | 4.56 (2.61 to 7.50) | |
| RAD51D | 6 | 12 131 | 0.1 | 1.14 (0.43 to 2.46) | 1 | 2659 | 0.0 | 0.86 (0.05 to 3.92) | 1 | 1209 | 0.1 | 1.91 (0.11 to 8.74) | 8 | 4758 | 0.2 | 4.14 (1.80 to 8.35) | |
| TP53 | 16 | 17 004 | 0.1 | 3.45 (1.83 to 6.28) | 12 | 3793 | 0.3 | 11.95 (5.84 to 23.0) | 10 | 1704 | 0.6 | 22.71 (10.45 to 45.49) | 5 | 6746 | 0.1 | 2.95 (1.00 to 7.04) | |
| Total Freq (%) | 7.6 | 8.4 | 7.0 | 12.5 | |||||||||||||
Logistic regression by comparing each gene mutation frequency with Genome Aggregation Database reference controls, weighted by race and ethnicity (large genomic rearrangement variants were excluded). CI = confidence interval; ER = estrogen receptor; Freq = frequency; mut = mutations; OR = odds ratio; TNBC = triple-negative breast cancer (ER-/PR-/HER2-).
Lifetime Risk Estimation for Overall and Individual Subtypes of Breast Cancer
Cancer incidence data from the 2010–2015 SEER registries were used to estimate overall and subtype-specific lifetime absolute risks of breast cancer for non-Hispanic white patients with mutations in high- and moderate-risk breast cancer genes (Figure 3; Supplementary Table 11, available online). Overall lifetime risks of breast cancer of at least 20.0% were estimated for mutations in ATM, BARD1, BRCA1, BRCA2, CHEK2, PALB2, RAD51C, RAD51D, and TP53. In addition, all of the known breast cancer genes had lifetime risks of HR+ disease of greater than 10.0% (Supplementary Table 11, available online).
Figure 3.

Absolute risk estimates for overall and clinical subtypes of breast cancer in non-Hispanic white population. Age-related (x-axis) absolute risk (y-axis) curves for clinical subtypes defined by hormone receptor (HR) and HER2 status (HR+/HER2+, HR+/HER2-; HR-/HER2+; and triple-negative breast cancer [TNBC]) and overall breast cancer (BC) are shown as colored lines for breast cancer patients with gene-specific mutations. Confidence intervals are shown as shadow around the cumulative risk curves.
Gene-Specific Mutation Prevalence by Tumor Subtype and Patient Characteristics
To facilitate better identification of patients carrying germline predisposing mutations, the prevalence of mutations in the 15 genes was estimated in categories stratified by age at diagnosis and family history of breast or ovarian cancer (first- and second-degree relatives) (Table 4). Among patients with ER+/HER2- breast cancer, the prevalence of mutations in the 15 tested genes was only 10.0% or more among those with a substantial family history of breast or ovarian cancers or a personal history of multiple tumors and a breast cancer diagnosis at a young age (Table 4). Importantly, the BRCA1/2 mutation frequency was only in the 2.0–5.0% range unless the diagnosis was at age 37 years or younger (Table 4). Similarly, among patients with ER-/HER2+ disease, only those diagnosed at age 37 years or younger and/or with a substantial family history of breast or ovarian cancer or multiple primaries had more than 10.0% mutation prevalence (Table 4).
Table 4.
Mutation frequency for predisposition genes among breast clinical tumor subtypes based on age at diagnosis, family history of cancer, and multiple breast cancers*
| Family history | Age, y |
||||
|---|---|---|---|---|---|
| <37 | 37–45 | 46–50 | 51–60 | >60 | |
| ER+/HER2- [mutation No. (%)] | |||||
| No FHx of BC and OC | |||||
| BRCA1/2 | 45 (4.4) | 68 (2.5) | 31 (1.8) | 12 (1.0) | 5 (0.6) |
| All genes | 106 (12.0) | 189 (8.1) | 83 (5.6) | 65 (6.4) | 29 (4.5) |
| FHx 1 BC no OC | |||||
| BRCA1/2 | 64 (9.5) | 46 (2.2) | 37 (2.1) | 37 (1.9) | 21 (1.4) |
| All genes | 121 (20.3) | 143 (7.7) | 108 (7.5) | 132 (8.1) | 78 (6.3) |
| FHx ≥2 BC no OC | |||||
| BRCA1/2 | 28 (13.3) | 33 (3.6) | 26 (2.7) | 36 (1.8) | 24 (1.1) |
| All genes | 56 (28.5) | 101 (12.0) | 98 (11.6) | 139 (8.1) | 111 (5.7) |
| FHx of any OC | |||||
| BRCA1/2 | 23 (14.6) | 28 (5.2) | 13 (2.2) | 35 (3.6) | 19 (1.9) |
| All genes | 35 (23.8) | 57 (11.4) | 37 (7.0) | 88 (10.1) | 66 (7.5) |
| Multiple breast cancers | |||||
| BRCA1/2 | 18 (10.8) | 24 (3.2) | 27 (3.3) | 21 (2.0) | 10 (1.1) |
| All genes | 39 (24.7) | 84 (12.1) | 66 (9.5) | 90 (9.6) | 50 (6.9) |
| ER+/HER2+ [mutation No. (%)] | |||||
| No FHx of BC and OC | |||||
| BRCA1/2 | 9 (1.7) | 7 (0.9) | 6 (1.8) | 1 (0.4) | 4 (3.3) |
| All genes | 37 (8.5) | 43 (6.9) | 17 (5.8) | 18 (8.4) | 12 (12.2) |
| FHx 1 BC no OC | |||||
| BRCA1/2 | 11 (3.4) | 15 (2.9) | 3 (0.9) | 7 (1.8) | 4 (1.9) |
| All genes | 47 (17.0) | 47 (10.1) | 23 (8.8) | 26 (7.7) | 10 (5.4) |
| FHx ≥2 BC no OC | |||||
| BRCA1/2 | 5 (6.1) | 2 (0.9) | 6 (3.3) | 5 (1.4) | 2 (0.7) |
| All genes | 14 (17.9) | 17 (8.8) | 22 (12.9) | 27 (9.6) | 13 (5.6) |
| FHx of any OC | |||||
| BRCA1/2 | 1 (1.5) | 4 (2.8) | 2 (1.8) | 8 (4.2) | 4 (3.1) |
| All genes | 4 (6.6) | 13 (9.8) | 8 (8.7) | 14 (8.0) | 8 (7.0) |
| Multiple breast cancers | |||||
| BRCA1/2 | 4 (5.9) | 3 (2.1) | 4 (3.5) | 2 (1.0) | 2 (2.0) |
| All genes | 15 (22.7) | 18 (13.7) | 20 (20.1) | 122 (14.3) | 8 (9.9) |
| ER-/HER2+ [mutation No. (%)] | |||||
| No FHx of BC and OC | |||||
| BRCA1/2 | 6 (2.4) | 7 (2.0) | 4 (5.4) | 1 (1.9) | 0 (0.0) |
| All genes | 26 (11.5) | 16 (5.0) | 6 (9.3) | 1 (1.9) | 1 (5.3) |
| FHx 1 BC no OC | |||||
| BRCA1/2 | 6 (4.4) | 10 (4.3) | 3 (2.0) | 2 (1.5) | 2 (2.2) |
| All genes | 13 (10.2) | 17 (7.9) | 6 (4.8) | 7 (7.5) | 6 (7.4) |
| FHx ≥2 BC no OC | |||||
| BRCA1/2 | 0 (0.0) | 7 (7.9) | 0 (0.0) | 5 (2.9) | 0 (0.0) |
| All genes | 1 (3.3) | 16 (18.5) | 5 (9.9) | 12 (7.7) | 2 (2.4) |
| FHx of any OC | |||||
| BRCA1/2 | 2 (9.1) | 0 (0.0) | 1 (1.8) | 3 (2.7) | 3 (4.4) |
| All genes | 3 (13.1) | 4 (7.8) | 2 (3.8) | 10 (10.3) | 5 (7.7) |
| Multiple breast cancers | |||||
| BRCA1/2 | 4 (13.3) | 5 (6.5) | 1 (1.7) | 1 (2.1) | 0 (0.0) |
| All genes | 8 (27.5) | 8 (10.4) | 4 (7.9) | 3 (7.5) | 3 (8.4) |
| TNBC (ER-/PR-/HER2-) [mutation No. (%)] | |||||
| No FHx of BC and OC | |||||
| BRCA1/2 | 56 (9.5) | 68 (6.9) | 37 (5.3) | 50 (4.0) | 5 (1.3) |
| All genes | 68 (12.0) | 112 (13.0) | 67 (10.8) | 88 (8.1) | 20 (6.3) |
| FHx 1 BC no OC | |||||
| BRCA1/2 | 71 (19.9) | 66 (10.2) | 35 (7.3) | 50 (5.1) | 25 (4.9) |
| All genes | 84 (24.2) | 96 (15.7) | 58 (13.9) | 88 (9.8) | 45 (10.2) |
| FHx ≥2 BC no OC | |||||
| BRCA1/2 | 47 (33.3) | 45 (17.7) | 24 (10.6) | 33 (6.7) | 21 (5.2) |
| All genes | 54 (39.3) | 58 (24.2) | 33 (15.2) | 66 (14.6) | 40 (11.1) |
| FHx of any OC | |||||
| BRCA1/2 | 37 (32.7) | 38 (20.1) | 22 (14.1) | 36 (10.9) | 28 (11.7) |
| All genes | 41 (37.0) | 49 (27.7) | 29 (19.2) | 51 (16.6) | 41 (18.4) |
| Multiple breast cancers | |||||
| BRCA1/2 | 50 (29.6) | 45 (17.4) | 16 (9.2) | 28 (8.8) | 11 (5.3) |
| All genes | 58 (35.1) | 58 (23.5) | 23 (14.5) | 47 (16.3) | 19 (10.2) |
Genes include all 15 genes evaluated in this paper (ATM, BARD1, BRCA1, BRCA2, BRIP1, CDH1, CHEK2, MSH6, NBN, NF1, PALB2, PTEN, RAD51C, RAD51D, and TP53). Multiple breast cancers include patients with two or more breast cancers (both synchronous and asynchronous). FHx = family history; BC = breast cancer; OC = ovarian cancer; ER = estrogen receptor; PR = progesterone receptor; TNBC = triple-negative breast cancer (ER-/PR-/HER2-).
Discussion
In this study, we report on 54 555 invasive breast cancer patients from a cohort assembled by a genetic testing laboratory with tumor pathology information and hereditary cancer genetic testing results. The results allowed evaluation of heterogeneity in associations between specific predisposition genes and breast cancer clinical tumor subtypes. These results will guide subtype-specific breast cancer risk assessment and allow for fine-tuning of clinical management decisions for mutation carriers. Specifically, because BARD1, RAD51C, and RAD51D mutations were associated with more than 20.0% lifetime risk of breast cancer and 4.0–9.0% lifetime risk of TNBC in this study, enhanced breast surveillance may be considered for carriers of mutations in these genes, particularly for races and ethnicities such as Hispanics and blacks with higher prevalence of TNBC. Current National Comprehensive Cancer Network guidelines (https://www.nccn.org/professionals/physician_gls/pdf/genetics_screening.pdf) do not recommend enhanced screening for breast cancer in carriers of mutations in these genes. Further studies are needed to establish whether magnetic resonance imaging screening will be of benefit for this group of women.
In addition, we provide mutation prevalence estimates for each tumor subtype by gene, age of breast cancer diagnosis, and family history of cancer. These estimates may prove useful for a more informed selection of patients for genetic testing when attempting to reduce the burden on genetic services associated with the American Society of Breast Surgeons recommendation to offer germline hereditary cancer multigene panel testing to all breast cancer patients (26). Furthermore, integrating information on risks of different subtypes of breast cancer associated with mutations into risk prediction models along with personal and family history information, polygenic risk scores based on common genetic variants that are currently being offered as part of clinical genetic testing (27,28), and other nongenetic risk factors may yield improved personalized breast cancer risk estimates for patients.
Overall, mutations in known breast cancer predisposition genes were observed in 7.0–9.0% of each subtype except for 14.4% in TNBCs. None of the known predisposition genes were exclusively mutated in one subtype of breast cancer. Although BARD1, BRCA1, BRCA2, BRIP1, MSH6, NF1, PALB2, RAD51C, and RAD51D were all statistically significantly associated with clinically relevant increased risks (OR > 2) of TNBC, mutations in these genes were also found in non-TNBC tumors, although for BARD1, RAD51C, and RAD51D, this was a rare event. In addition, whereas BRCA2-mutated tumors are thought to be predominantly ER+, in this study mutations were associated with increased risk of all four subtypes (Table 3), and 30.0% were found in TNBC. This is somewhat consistent with the findings from Mavaddat et al. suggesting that 16.0% of tumors in BRCA2 mutation carriers from the Consortium of Investigators of Modifiers of BRCA1/2 were TNBC (29). Furthermore, whereas ATM and CHEK2 mutations have been associated with ER+ breast cancer (8), in this study ATM and CHEK2 mutations were enriched in ER+ tumors (Figure 1; Supplementary Tables 6 and 7, available online), and ATM but not CHEK2 was associated with ER-/HER2+ tumors (Table 3). Although the case-control association studies appeared to suggest that ATM (OR = 0.57) and CHEK2 (OR = 0.45) have protective effects for TNBC, this is likely the result of a reduced frequency of these mutations among TNBC cases caused by specific effects on the pathogenesis of ER+ and HER2+ breast cancer.
Predisposition genes have been studied in detail in TNBC and ER+ breast cancer, but limited information is available regarding the influence of mutations on ER-/HER2+ disease (8,16). In this study, BRCA1 and TP53 were associated with high risks of ER-/HER2+ breast cancer; and mutations in ATM, BARD1, BRCA2, and PALB2 were associated with moderate risks of the ER-/HER2+ subtype. Several other genes had too few mutations to allow estimation of risk or enrichment in this clinical subtype relative to others. Interestingly, the high risks of ER+/HER2+ (OR = 12.0) and ER-/HER2+ (OR = 22.7) cancer associated with TP53 mutations suggest an etiological relationship between TP53 and tumors dependent on HER2 signaling.
One of the main limitations of this study is the focus on patients qualifying for clinical genetic testing because of younger age of onset, family history of cancer, or a diagnosis of TNBC [eg, 22.4% TNBC compared with 11.2% TNBC in SEER registry data (30)]. It is not certain that the risks of each subtype of breast cancer associated with mutations in each gene will be maintained when extending these studies to individuals from the general population. Nevertheless, the results should prove useful for further development of personalized risk models. The incomplete collection of tumor pathology data is also a limitation of this study, although quality assessment studies (18) have shown that the data accurately represent the underlying population. In addition, because of the small number of pathogenic mutations in certain genes, it was not possible to fully establish the relevance of all predisposition genes to the individual breast cancer tumor subtypes. Despite these limitations, this study further extends and enhances the clinical relevance of results from clinical genetic testing.
Funding
This study was supported in part by National Institutes of Health (NIH) grants CA176785, CA192393, CA225662, an NIH Specialized Program of Research Excellence in Breast Cancer [CA116201], and the Breast Cancer Research Foundation. The study was sponsored by Ambry Genetics Inc.
Notes
The funders had no role in the design of the study; the collection, analysis, or interpretation of the data, the writing of the manuscript, or the decision to submit the manuscript for publication.
SS, TP, JSD, and HL are employees of Ambry Genetics Incorporated. The authors have no other conflicts of interest to disclose.
Supplementary Material
References
- 1. Howlader N, Altekruse SF, Li CI, et al. US incidence of breast cancer subtypes defined by joint hormone receptor and HER2 status. J Natl Cancer Inst. 2014;106(5):dju055. [DOI] [PMC free article] [PubMed] [Google Scholar]
- 2. Regan MM, Pagani O, Francis PA, et al. Predictive value and clinical utility of centrally assessed ER, PgR, and Ki-67 to select adjuvant endocrine therapy for premenopausal women with hormone receptor-positive, HER2-negative early breast cancer: TEXT and SOFT trials. Breast Cancer Res Treat. 2015;154(2):275–286. [DOI] [PMC free article] [PubMed] [Google Scholar]
- 3. Regan MM, Francis PA, Pagani O, et al. Absolute benefit of adjuvant endocrine therapies for premenopausal women with hormone receptor-positive, human epidermal growth factor receptor 2-negative early breast cancer: TEXT and SOFT trials. J Clin Oncol. 2016;34(19):2221–2231. [DOI] [PMC free article] [PubMed] [Google Scholar]
- 4.Early Breast Cancer Trialists’ Collaborative G. Effects of chemotherapy and hormonal therapy for early breast cancer on recurrence and 15-year survival: an overview of the randomised trials. Lancet. 2005;365(9472):1687–1717. [DOI] [PubMed] [Google Scholar]
- 5. Perez EA, Romond EH, Suman VJ, et al. Trastuzumab plus adjuvant chemotherapy for human epidermal growth factor receptor 2-positive breast cancer: planned joint analysis of overall survival from NSABP B-31 and NCCTG N9831. J Clin Oncol. 2014;32(33):3744–3752. [DOI] [PMC free article] [PubMed] [Google Scholar]
- 6. Gelmon K, Dent R, Mackey JR, et al. Targeting triple-negative breast cancer: optimising therapeutic outcomes. Ann Oncol. 2012;23(9):2223–2234. [DOI] [PubMed] [Google Scholar]
- 7. Bianchini G, Balko JM, Mayer IA, et al. Triple-negative breast cancer: challenges and opportunities of a heterogeneous disease. Nat Rev Clin Oncol. 2016;13(11):674–690. [DOI] [PMC free article] [PubMed] [Google Scholar]
- 8. Couch FJ, Shimelis H, Hu C, et al. Associations between cancer predisposition testing panel genes and breast cancer. JAMA Oncol. 2017;3(9):1190–1196. [DOI] [PMC free article] [PubMed] [Google Scholar]
- 9. Shimelis H, LaDuca H, Hu C, et al. Triple-negative breast cancer risk genes identified by multigene hereditary cancer panel testing. J Natl Cancer Inst. 2018;110(8):855–862. [DOI] [PMC free article] [PubMed] [Google Scholar]
- 10. Buys SS, Sandbach JF, Gammon A, et al. A study of over 35,000 women with breast cancer tested with a 25-gene panel of hereditary cancer genes. Cancer. 2017;123(10):1721–1730. [DOI] [PubMed] [Google Scholar]
- 11. Robson M, Im SA, Senkus E, et al. Olaparib for metastatic breast cancer in patients with a germline BRCA mutation. N Engl J Med. 2017;377(6):523–533. [DOI] [PubMed] [Google Scholar]
- 12. Couch FJ, Hart SN, Sharma P, et al. Inherited mutations in 17 breast cancer susceptibility genes among a large triple-negative breast cancer cohort unselected for family history of breast cancer. J Clin Oncol. 2015;33(4):304–311. [DOI] [PMC free article] [PubMed] [Google Scholar]
- 13. Rath MG, Masciari S, Gelman R, et al. Prevalence of germline TP53 mutations in HER2+ breast cancer patients. Breast Cancer Res Treat. 2013;139(1):193–198. [DOI] [PMC free article] [PubMed] [Google Scholar]
- 14. de Bock GH, Mourits MJE, Schutte M, et al. Association between the CHEK2*1100delC germ line mutation and estrogen receptor status. Int J Gynecol Cancer. 2006;16(s2):552–555. [DOI] [PubMed] [Google Scholar]
- 15. Domagala P, Wokolorczyk D, Cybulski C, et al. Different CHEK2 germline mutations are associated with distinct immunophenotypic molecular subtypes of breast cancer. Breast Cancer Res Treat. 2012;132(3):937–945. [DOI] [PubMed] [Google Scholar]
- 16. Kurian AW, Ward KC, Hamilton AS, et al. Uptake, results, and outcomes of germline multiple-gene sequencing after diagnosis of breast cancer. JAMA Oncol. 2018;4(8):1066–1072. [DOI] [PMC free article] [PubMed] [Google Scholar]
- 17. Lu HM, Li S, Black MH, et al. Association of breast and ovarian cancers with predisposition genes identified by large-scale sequencing. JAMA Oncol. 2019;5(1):51–57. [DOI] [PMC free article] [PubMed] [Google Scholar]
- 18. LaDuca H, McFarland R, Gutierrez S, et al. Quality of clinician-reported cancer history when ordering genetic testing. J Clin Oncol Inform. 2018;2:1–11. doi:10.1200/cci.18.00014. [DOI] [PubMed] [Google Scholar]
- 19. Plon SE, Eccles DM, Easton D, et al. Sequence variant classification and reporting: recommendations for improving the interpretation of cancer susceptibility genetic test results. Hum Mutat. 2008;29(11):1282–1291. [DOI] [PMC free article] [PubMed] [Google Scholar]
- 20. Richards S, Aziz N, Bale S, et al. Standards and guidelines for the interpretation of sequence variants: a joint consensus recommendation of the American College of Medical Genetics and Genomics and the Association for Molecular Pathology. Genet Med. 2015;17(5):405–424. [DOI] [PMC free article] [PubMed] [Google Scholar]
- 21. Pesaran T, Karam R, Huether R, et al. Beyond DNA: an integrated and functional approach for classifying germline variants in breast cancer genes. Int J Breast Cancer. 2016;2016:1–10. [DOI] [PMC free article] [PubMed] [Google Scholar]
- 22. Lek M, Karczewski KJ, Minikel EV, et al. Analysis of protein-coding genetic variation in 60,706 humans. Nature. 2016;536(7616):285–291. [DOI] [PMC free article] [PubMed] [Google Scholar]
- 23. Krippendorff K. Content Analysis: An Introduction to Its Methodology. Thousand Oaks, CA: SAGE; 2004. [Google Scholar]
- 24. Masciari S, Dillon DA, Rath M, et al. Breast cancer phenotype in women with TP53 germline mutations: a Li-Fraumeni syndrome consortium effort. Breast Cancer Res Treat. 2012;133(3):1125–1130. [DOI] [PMC free article] [PubMed] [Google Scholar]
- 25. Melhem-Bertrandt A, Bojadzieva J, Ready KJ, et al. Early onset HER2-positive breast cancer is associated with germline TP53 mutations. Cancer. 2012;118(4):908–913. [DOI] [PMC free article] [PubMed] [Google Scholar]
- 26.The American Society of Breast Surgeons. Consensus Guideline on Genetic Testing for Hereditary Breast Cancer. https://www.breastsurgeons.org/docs/statements/Consensus-Guideline-on-Genetic-Testing-for-Hereditary-Breast-Cancer.pdf. Accessed Feburary 10, 2019. [DOI] [PMC free article] [PubMed]
- 27. Mavaddat N, Michailidou K, Dennis J, et al. Polygenic risk scores for prediction of breast cancer and breast cancer subtypes. Am J Hum Genet. 2019;104(1):21–34. [DOI] [PMC free article] [PubMed] [Google Scholar]
- 28. Kuchenbaecker KB, McGuffog L, Barrowdale D, et al. Evaluation of polygenic risk scores for breast and ovarian cancer risk prediction in BRCA1 and BRCA2 Mutation Carriers. J Natl Cancer Inst. 2017;109(7):djw302. [DOI] [PMC free article] [PubMed] [Google Scholar]
- 29. Mavaddat N, Barrowdale D, Andrulis IL, et al. Pathology of breast and ovarian cancers among BRCA1 and BRCA2 mutation carriers: results from the Consortium of Investigators of Modifiers of BRCA1/2 (CIMBA). Cancer Epidemiol Biomarkers Prev. 2012;21(1):134–147. [DOI] [PMC free article] [PubMed] [Google Scholar]
- 30. Kurian AW, Ward KC, Howlader N, et al. Genetic testing and results in a population-based cohort of breast cancer patients and ovarian cancer patients. J Clin Oncol. 2019;37(15):1305–1315. [DOI] [PMC free article] [PubMed] [Google Scholar]
Associated Data
This section collects any data citations, data availability statements, or supplementary materials included in this article.