

Abstract
Hybrids between biopolymeric materials and low-cost conductive carbon-based materials are interesting materials for applications in electronics, potentially reducing the need for materials that generate environmentally harmful electronic waste. Herein we investigate a scalable ball-milling method to form graphene nanoplatelets (GNPs) by milling graphite flakes with aqueous dispersions of proteins or protein nanofibrils (PNFs). Aqueous GNP dispersions with high concentrations (up to 3.2 mg mL–1) are obtained under appropriate conditions. The PNFs/proteins help to exfoliate graphite and stabilize the resulting GNP dispersions by electrostatic repulsion. PNFs are prepared from hen egg white lysozyme (HEWL) and β-lactoglobulin (BLG). The GNP dispersions can be processed into free-standing films having an electrical conductivity of up to 110 S m–1. Alternatively, the GNP dispersions can be drop-cast on PET substrates, resulting in mechanically flexible films having an electrical conductivity of up to 65 S m–1. The drop-cast films are investigated regarding their thermoelectric properties, having Seebeck coefficients of about 50 μV K–1. By annealing drop-cast films and thus carbonizing residual PNFs, an increase of electrical conductivity, coupled with a modest decrease in Seebeck coefficient, is obtained resulting in materials displaying power factors of up to 4.6 μW m–1 K–2.
Keywords: Graphene nanoplatelets, Protein nanofibrils, Liquid-phase exfoliation, Ball-milling, Thermoelectrics, Energy harvesting
Short abstract
A green method for preparation of graphene nanoplatelets is presented and the thermoelectric properties of the GNP materials are investigated.
Introduction
Graphene sheets are built up from hexagonally (honeycomb) arranged sp2-hybridized carbon atoms. The strong σ-bonded network of carbon atoms gives a high mechanical strength within a single graphene sheet, whereas the delocalized π-electrons contribute to graphene’s high electrical conductivity. Graphite is built up from multiple stacks of graphene sheets, where the intersheet interactions are considerably weaker than the intrasheet interactions. This means that graphene sheets can be peeled off (exfoliated) from graphite under the influence of mechanical forces, as demonstrated in everyday life when the lead of a pencil is drawn against a surface such as paper. When single graphene sheets were first isolated and characterized in 2004,1 adhesive tape was employed to separate the individual graphene sheets. The physical properties of graphene have since been widely investigated regarding a range of applications including as active materials in electronic devices.2 Simultaneously, different methodologies for more scalable graphene production have been developed, including chemical vapor deposition (CVD) growth for high quality graphene,3 exfoliation via graphite oxide derivatives (that requires reduction of graphene oxide in order to regain the conductive properties of graphene),4 and mechanical exfoliation of graphite.5 The graphite oxide route has the drawback of employing hazardous reagents, and it is therefore desirable to develop methodology that employs unmodified graphite as starting material for exfoliation. One important family of such methods is based on liquid-phase exfoliation of graphite.6 In such methods, graphite flakes mixed with liquids are exposed to mechanical forces by means of ultrasonication, shear mixing, or milling. The resulting liquid dispersion of graphene/graphite typically consists of graphene-like particles with a statistical distribution of number of sheets and sizes, a type of material hereafter labeled as graphene nanoplatelets (GNPs). The mixture of different particle sizes makes such dispersions unsuitable for applications requiring high-quality graphene. However, for many applications the mixture of different particle sizes is not critical (e.g., as electrodes, components in electronics and conductive coatings, and composites). Moreover, the liquid GNP dispersions enable efficient processing of GNPs into films by methods such as drop-casting, spin-coating, blade-coating and printing. Various dispersing agents have been investigated including organic solvents, surfactants, or ionic liquids.5,6 For large-scale production, it is moreover desirable to employ aqueous GNP dispersions. However, due to the hydrophobic nature of GNPs such aqueous dispersions are not colloidally stable, and pristine GNPs will agglomerate into large particles and precipitate. It is therefore necessary to employ surfactants in order to electrostatically stabilize aqueous GNP dispersions. Recently, as alternatives to traditional surfactants, various biobased materials including cellulose and nanocellulose,7 nucleotides/DNA,8 peptides,9 and proteins10 including hydrophobins,11,12 as well as silk nanofibrils13 have been used for aqueous exfoliation of graphite by methods employing shear forces and/or ultrasonication, resulting in aqueous GNP dispersions. In addition, proteins and protein-based fibrils have been reported to act as dispersing agents for graphene-related carbon materials such as carbon nanotubes14−16 and graphene oxides.17 So far, protein fibrils based on the amyloid-type structure have not been investigated regarding their capacity to assist exfoliation of graphite. Amyloid fibrils are formed in vivo by self-assembly of monomeric proteins. Amyloid fibrils are associated with a range of diseases such as Alzheimer’s or Parkinson’s disease.18 However, in recent years functional amyloid structures have been discovered in a variety of organisms ranging from bacteria to mammals. Moreover, a wide range of proteins, including nonpathological proteins, have been demonstrated to form amyloid-like fibrils in vitro. Such fibrils typically have diameters of 5–10 nm and lengths in the micrometer range. Hereafter, we designate such materials as protein nanofibrils (PNFs). As PNFs are formed by self-assembly processes (typically a protein is dissolved in mildly acidic water and exposed to heat), they constitute a readily available type of nanomaterial that can be obtained from a range of proteins, including proteins from egg (hen egg white lysozyme (HEWL)), milk (β-lactoglobulin BLG), plants (soybean), and industrial waste streams (whey protein or potato protein).19 PNFs have been widely studied as a functional material in wide range of applications due to the outstanding properties/characteristics of PNFs including high biocompatibility, a defined nano structure, a high aspect ratio, and tunable chemical properties.16,20,21 The prospect of obtaining PNFs from abundant, sustainable, and low-cost protein makes the employment of PNFs in materials science highly attractive. Moreover, hybrids between biopolymeric materials such as PNFs and low-cost conductive carbon-based materials may be developed into materials for applications in electronics, thus potentially reducing the need for employing materials generating environmentally harmful electronic waste.22,23
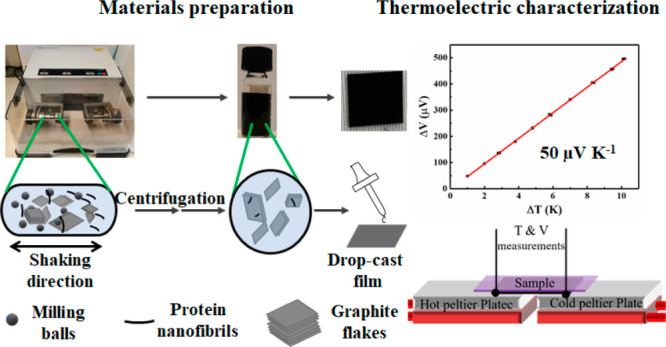
Herein we employ HEWL and BLG as well as PNFs prepared from HEWL and BLG as aqueous dispersing agents when exfoliating graphite by ball-milling. It should be noted that the PNF dispersions consists of a mixture of PNFs and other protein materials such as hydrolyzed peptide fragments. The PNF content is 34% for HEWL PNFs and 49% for BLG PNFs, and the PNF dispersions were not purified before use. Ball-milling is a standard mechanochemical technique that is scalable and commonly employed in industrial settings for large-scale production of materials.24−27 In Figure 1 is shown a schematic drawing illustrating the employed process for exfoliating graphite by PNFs.
Figure 1.

Schematic illustration of exfoliation and film formation process.
Moreover, the properties of the PNF:GNP dispersion can be tuned by removal of excess PNFs by high speed centrifugation, thereby decreasing the PNF:GNPs ratio. The resulting dispersions are still colloidally stable for several days and can be processed into flexible conductive films by drop-casting on PET substrates. We moreover investigate the films as thermoelectric materials.
Materials considered for applications in thermoelectric generators28,29 must be able to sustain a voltage when exposed to a temperature gradient. This feature is described by the Seebeck coefficient, defined as S = ΔV/ΔT. An ideal material for thermoelectrics should have a high electrical conductivity coupled with a low thermal conductivity; however, these properties tend to have a strong positive correlation with materials displaying a high electrical conductivity and a high thermal conductivity, as is the case for graphene.30 One approach to partially decouple the thermoelectric variables is by employing nanocomposites, where two (or more) components are mixed, an approach that has generated many promising results.28 Hybrid materials based on combinations of graphene or GNPs with conductive polymers have been employed in order to fabricate thermoelectric generators.31 However, conductive polymers are currently obtained from the petroleum feedstock and have a relatively high cost. With these aspects in mind it would be desirable if composites could be employed where the polymer component is derived from a low cost and green sustainable source material. From this perspective, it is interesting to investigate PNF:GNP hybrids in thermoelectric applications. However, it should be noted that the electrically insulating character of PNFs makes this is a challenging system to develop.
We find that PNF:GNP hybrids exhibits good mechanical flexibility and thermoelectric properties in room temperature, with a Seebeck coefficient comparable to other graphene-based hybrid materials. The relatively low conductivity of the PNF:GNP hybrids results in a low power factor. However, by thermal treatment the conductivity of the material can be dramatically improved, while the Seebeck coefficient is only moderately reduced. Accordingly, after thermal treatment the resulting material show properties similar to many conductive polymer:graphene (GNP) hybrids.
Experimental Section
Materials
Graphite flakes (product number 332461), HEWL and BLG were purchased from Sigma-Aldrich. All chemicals were used as received without further purification. Ultrapure water (18.2 MΩ cm) was obtained from a Milli-Q water purification system.
Preparation of PNFs
In a typical procedure, protein was dissolved in 25 mM HCl (pH 1.6) at a 10 mg mL–1 concentration, followed by filtration through a 0.2 μm PES filter to remove any possible undissolved impurities. The resulting solution was heated at 80 °C with magnetic stirring for 72 h to prepare HEWL PNFs and for 48 h to prepare BLG PNFs. The PNF conversion yield was investigated by employing Amicon Ultra-15 Centrifugal Filter Units. After centrifugation the liquid containing nonaggregated protein was collected, and the peptide concentration was determined by the UV–vis absorption. The calculated conversion yield is 34% for HEWL PNFs and 49% for BLG PNFs. For exfoliation studies the as prepared PNF dispersions were used without purification.
Exfoliation of GNPs
The GNPs were prepared by a wet ball-milling exfoliation method. First, 100 mg of graphite flakes and 1 mL of a 10 mg mL–1 PNF dispersion were added into a 1.5 mL stainless-steel milling jar, and 20 milling balls (in the optimized procedure) with a diameter of 3 mm each were added. The sample was milled employing a shaker mill (Mixer Mill MM 400, Retsch, Germany) for 1 h at 30 Hz. For optimization of milling parameters, samples were milled for the allotted time, and the frequency and number of milling balls was varied. After milling, the sample was removed from the jar, and the jar was washed by 3 × 1 mL of water. The pooled sample was centrifuged three times at 1 000 rpm for 60 min, in order to get rid of large graphite particles. For samples involving removal of excess PNFs, the PNF:GNP dispersion was centrifuged at 12 000 rpm for another 60 min to remove excess PNFs. The sediment was collected and redispersed in water at a concentration of 10 mg mL–1.
The concentrations of PNF:GNP dispersions (c, mg mL–1) were calculated by combining UV–vis absorption spectroscopy and TGA measurements.32 PNF:GNP dispersions were centrifuged at 1000 rpm for 60 min. The relative mass ratio of GNPs and PNFs in the above PNF:GNP dispersion was 0.422:0.578 as calculated by TGA data (Figure S1a). The extinction coefficient at 660 nm of the above GNP suspension was 6.443 ± 0.009 mL mg–1 m–1 calculated using the calibration plot in Figure S1b.
Preparation of GNP Films
Freestanding GNP films were prepared by vacuum filtration of a GNP dispersion through a 0.2 μm polycarbonate filter membrane (2.5 cm in diameter). The freestanding film was obtained by peeling it off from the polycarbonate filter. For films deposited on polyethylene terephthalate (PET) substrates, the PET was treated with plasma (Diener electronic, 3 min under low vacuum, air as plasma forming gas) to increase the surface hydrophilicity. A 60 μL aliquot of GNP dispersion (10 mg mL–1) was then drop-cast on the PET substrate using a tape mask (1 cm × 1 cm), and the sample was dried on hot plate at 60 °C. For samples to be annealed at high temperatures, the PET substrate was replaced by a quartz glass substrate, and 60 μL of GNP dispersion was drop-cast onto the quartz glass (1 cm × 1 cm). The substrate was dried on a hot plate at 60 °C. The resulting sample was transferred to a tube oven with a vacuum system and programmable temperature. The system was kept at 7 × 10⁻⁴–2 × 10⁻³ Torr, and temperatures were increased at a rate of 5 °C min–1. The sample was first heated from room temperature to 150 °C, and the temperature was then kept constant for 30 min to ensure removal of adsorbed residues on the film surface. The temperature was then raised to 420 °C, and the temperature was then kept constant for 30 min in order to ensure carbonization of PNFs.
Materials Characterization
UV–vis absorption data were obtained using a PerkinElmer Lambda 950 UV–vis spectrometer. Samples were diluted 20 times from the as-prepared concentration. Thermogravimetric analysis (TGA) measurements were recorded on a NETZSCH thermal analysis (STA 449 F1 Jupiter). Zeta potential data was obtained using a Zetasizer Nano ZS90. Samples for zeta potential measurements were diluted 2 times from the as-prepared sample. Atomic force microscopy (AFM) measurements were performed using a Digital Instruments Dimension 3100 atomic force microscope operated in tapping mode, using a cantilever with a nominal spring constant of 40 N m–1. Samples for AFM measurements were diluted 100 times from the as-prepared concentration and were then drop-cast onto silica substrates and left to dry for 1 min. Excess fluid was removed by applying a nitrogen gas flow. Scanning electron microscopy (SEM) images were recorded on a Philips XL30 FEG SEM microscope. The GNP dispersions were drop-cast on substrates, and after 1 min, excess fluid was removed by applying a nitrogen gas flow. All samples for SEM measurements were sputter-coated with a thin layer of Pt under argon in a sputter coater (Leica EM SCD 500). Transmission electron microscopy (TEM) was carried out with a FEI Tecnai G2 TF20 UT instrument operated at 200 kV. Attenuated total reflection-Fourier transform infrared (ATR-FTIR) spectra were recorded on a VERTEX (Bruker, USA) FTIR spectrometer. X-ray diffractometry (XRD) measurements were achieved using a PANalytical X’Pert PRO instrument with monochromatic Cu Kα radiation (λ = 1.5406 Å) and a Ni filter. Raman spectroscopy were recorded using a micro-Raman setup with a 100× objective. The excitation resource is 532 nm from a single-mode solid-state laser (Coherent, Sapphire-SF-532-150) with power of 0.5 mW. A single monochromator (Jobin-Yvon, HR460) equipped with a CCD camera and a 600 grooves/mm grating were applied for spectra recording. The resulting resolution of the system is approximately 5.5 cm–1. For both XRD and Raman spectroscopy measurements, the graphite flakes sample was adhered on a Si substrate by tape. For ATR-FTIR, XRD, and Raman spectroscopy measurements, the GNPs samples were prepared by drop-casting the stock solution on a clean Si substrate and dried in room temperature. The electrical conductivity was determined by measuring sheet resistance with a four-point probe Jandel RM3000 station, and the film thickness was determined on a Dektak 6 M stylus profiler equipped with a 12.5 μm stylus tip from Veeco. Film thickness values were estimated by cutting the film with a scalpel and determining the maximum depth of the profile roughness below the mean line across such a cut.
Thermoelectric Measurements
The Seebeck coefficients of the GNPs films were measured under a custom-built four-probe system, with two K-type thermocouples for measuring temperatures and two copper tapes for measuring Seebeck voltage (V). The setup consists of a Keithley 2001 Multimeter, two Peltier elements with a cooling water system, and thermometers. The Seebeck coefficient was calculated by the slope of the temperature gradient–voltage plot with temperature gradients between 0 and +10 K at room temperature. For the custom-built setup, it is important to make sure the Seebeck coefficient is reliable. The slope method can reduce the various temperature offsets in the measurement and identify the Seebeck coefficient more accurate.33,34 Otherwise, the setup was tested by a series of standard samples of CrN thin film which were measured by an Ulvac-Riko ZEM-3 system with a special setup for thin film measurements in a low-pressure helium atmosphere.35 The values are almost same (128 μV K–1 measured by Ulvac-Riko ZEM-3 system and 133 μV K–1 measured by this custom-built setup at room temperature) meaning that any absolute error is modest. Three measurements for each sample were performed; the error bars in the reported Seebeck coefficient refer to the standard deviation.
Results and Discussion
Exfoliation of GNPs
PNFs were prepared using a procedure where the protein (HEWL or BLG) was heated at 80 °C with stirring in 25 mM HCl. The resulting PNF dispersions consists of a mixture of PNFs and other protein materials including hydrolyzed peptide fragments.36 The HEWL PNF and the BLG PNF dispersions contain 34 and 49% PNFs, respectively. These percentages are typical for PNFs obtained from relatively high molecular weight proteins.36−40 From a practical viewpoint, this is desirable as prepared materials can be used without cumbersome purification procedures, and hence the PNF dispersions were used as prepared without purification. The samples designated as PNFs below accordingly also contain other peptide materials in addition to PNFs. In order to test the capacity of these PNF materials to exfoliate graphite, dried PNFs were ball-milled with graphite, but exfoliation did not occur under the investigated dry conditions. However, by performing ball-milling under wet conditions, graphite could be readily exfoliated in the presence of PNFs. We therefore focused on a methodology in which aqueous dispersions of PNFs were mixed with graphite and ball-milled by employing a shaker mill. During the milling process, concomitant with exfoliation of graphite, PNFs will fragment resulting in a shortening of fibril length. In Figure 2 is shown an AFM image of the as-prepared PNFs (Figure 2a) and an AFM image of a milled sample (Figure 2b). In the image of the as prepared PNFs, the majority of fibrils have lengths over 1 μm. In contrast, for the milled sample, no fibrils with a length longer than 0.5 μm can be observed. In addition, flakelike structures of exfoliated graphite can be observed in Figure 2b.
Figure 2.
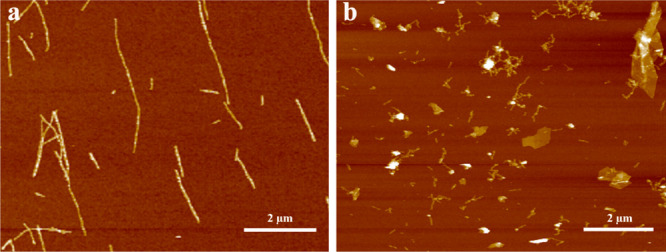
AFM images of HEWL PNFs before (a) and after milling (b).
In order to determine favorable exfoliation conditions, samples with varying amounts of HEWL PNFs were milled with different amounts of graphite. Moreover, the number of grinding balls, grinding time, and shaking frequency may influence the outcome of the milling process.41 All these parameters will be interdependent, and below we present selected data illustrating the influence of each parameter on the exfoliation process. The effect of number of milling balls, reaction time, and shaking frequency was investigated by varying instrumental parameters for milling of 100 mg of graphite flakes and 1 mL of 10 mg mL–1 HEWL PNFs dispersion (at pH 1.6), and results are shown in Figure 3. The concentration of GNPs was characterized by UV–vis absorption spectroscopy. Before analysis, the original 1 mL of liquid dispersion was removed from the milling jar. The remaining contents of the milling jar was then washed with 3 × 1 mL of water. The different fractions were pooled, and the sample was then purified by centrifugation in order to remove larger graphite particles. Data describing the concentration of exfoliated GNPs as a function of milling frequency (employing 20 grinding balls with milling for 1 h) are shown in Figure 3a. An increase in GNP concentration with an increase of milling frequency is observed, as can be expected since shaking at a higher frequency provides more kinetic energy to the grinding balls, with maximum efficiency occurring at 30 Hz. The maximum frequency of 30 Hz is obtainable with the employed shaker mill. Data describing the exfoliation efficiency as a function of milling time (when employing 20 grinding balls with frequency of 30 Hz) are shown in Figure 3c. We observe that GNP concentration increases with an increase of milling time, with a rapid increase during initial stages but with a gradual slowing down. Data describing the concentration of exfoliated GNPs as a function of the number of milling balls (milling at 30 Hz for 1 h) are shown in Figure 3b. Milling with only 1 ball results in a very low GNP concentration; however, with an increasing number of milling balls, the GNP concentration increases. For 5, 10, 15, and 20 milling balls, there is a linear increase in GNP concentration; however, when employing 25 balls, the amount of exfoliated GNPs decreased. For successful exfoliation of graphite, both impact and shear forces are important.27 Shear forces are provided when the graphite is sheared between two objects and is accordingly promoted by the presence of a large number of milling balls. These shear forces will lead to exfoliation of graphite; hence, an increase on exfoliation efficiency can be observed when increasing the number of milling balls from 1 to 20 balls (Figure 3b). In addition, impact forces resulting from collisions between graphite and a milling ball will result in fragmentation of graphene sheets. The combination of these processes will be important, as small-area graphite particles will be more readily exfoliated. The decrease in efficiency between 20 and 25 milling balls is due to the reduction of free volume in the milling jar, leading to less efficient milling.
Figure 3.

Concentration of GNPs dispersion as a function of: milling frequency (milling conditions: 100 mg of graphite, 1 mL of 10 mg mL–1 HEWL PNFs, 20 milling balls, 60 min) (a); number of balls (milling conditions: 100 mg of graphite, 1 mL of 10 mg mL–1 HEWL PNFs, frequency 30 Hz, 60 min) (b) and milling time (milling conditions: 100 mg of graphite, 1 mL of 10 mg mL–1 HEWL PNFs, frequency 30 Hz, 20 milling balls) (c). Error bars are presented as mean standard deviation of three independent samples. Some error bars are too small to be visible.
Data illustrating the effect of changes of PNFs concentration and amount of pristine graphite on the GNP formation are shown in Figure 4. For these experiments, we used 20 milling balls with a milling time of 1 h at 30 Hz. Data for the investigation of the influence of the amount of starting graphite (with a PNF concentration of 10 mg mL–1) on the GNP concentration are shown in Figure 4a. The GNP concentration initially increases with increasing amount of graphite (up to 100 mg of graphite); however, when employing 150 mg of graphite there is a dramatic decrease in GNP concentration. With such a large amount of graphite added, the free volume in the milling jar gets smaller which limits the milling efficiency. Data illustrating the effect of the PNF concentration on GNP formation (employing 100 mg of graphite) are shown in Figure 4b. At low PNF concentration, the exfoliation amount is very small, until reaching a PNF concentration of 5 mg mL–1. The GNP concentration then increases with increasing PNF concentration up to a PNF concentration of 10 mg mL–1.
Figure 4.

Concentration of GNPs dispersion as a function of: pristine graphite mass (milling conditions: 1 mL of 10 mg mL–1 HEWL PNFs, frequency 30 Hz, 20 milling balls, 60 min) (a) and HEWL PNFs mass (milling conditions: 100 mg of graphite, frequency 30 Hz, 20 milling balls, 60 min). Error bars are presented as the mean standard deviation of three independent samples. Some error bars are too small to be visible.
PNFs are amphiphilic materials containing both hydrophobic and hydrophilic domains. The amphiphilic character of proteins will be important during the mechanochemical exfoliation. As aromatic and hydrophobic amino acid residues can favorably interact with newly exposed graphene surfaces, the presence of protein will prevent restacking of graphene sheets. At the same time, the charged amino acid residues of the protein will help to disperse GNPs in water.
In Table 1 are listed the concentrations of GNPs when milling is performed at different pH in the presence of PNFs obtained from HEWL and BLG. For reference, the performance of native HEWL and BLG protein is also investigated. For HEWL and HEWL PNFs, the concentrations of GNPs achieved were 0.98 and 1.76 mg mL–1 at pH 1.6, respectively. At pH 7, graphite was not exfoliated by either HEWL or HEWL PNFs. For BLG and BLG PNFs, the concentrations of GNPs achieved were 3.19 and 2.25 mg mL–1 at pH 7, respectively. However, at pH 1.6 graphite was not exfoliated by BLG PNFs or BLG. Photos of the different samples are shown in Figure S2a.
Table 1. Concentrations of GNPs Dispersions after Milling by Various Proteins and PNFs at Different pHs and the Zeta Potential of Various Protein and PNFs at Different pHs.
| zeta potential (mV) | CGNPs (mg mL–1)a | |
|---|---|---|
| HEWL in pH 1.6 | 27.6 | 0.98 |
| HEWL in pH 7 | 8.4 | 0 |
| HEWL PNFs in pH 1.6 | 43.4 | 1.76 |
| HEWL PNFs in pH 7 | 27.8 | 0 |
| BLG in pH 1.6 | 4.9 | 0 |
| BLG in pH 7 | –31.3 | 3.19 |
| BLG PNFs in pH 1.6 | 25.3 | 0 |
| BLG PNFs in pH 7 | –25.4 | 2.25 |
The concentration of GNPs dispersion after milling by various protein and PNFs under different pH.
The difference in obtained GNP concentrations can be explained due to differences in protein structure between HEWL and BLG. The presence of both acidic and basic amino acid residues means that proteins will have a net charge depending on the pH of the solution. This behavior is described by the isoelectric point, pI.42 At pH = pI there will be no net charge on the protein, whereas at a pH above the pI there will be negative net charge. Conversely, there will be a positive net charge at a pH below the pI. For HEWL and BLG, the pIs are 10.7 and 5.2, respectively. Far from the pI, the proteins will be strongly charged. This means that the protein adsorbed on the GNP surface will help to stabilize GNPs by electrostatic repulsion. This is important as GNPs tend to aggregate in water because of their hydrophobicity. However, amphiphilic proteins or PNFs will interact favorably with an exposed graphitic surface by hydrophobic interactions and may moreover stabilize the colloidal GNP dispersion through electrostatic repulsion.13
The net charge carried by the protein will be important for the graphite exfoliation. At pH 1.6, HEWL and HEWL PNFs are strongly positively charged and are able to successfully exfoliate graphite. However, at pH 7, closer to the pI when the net charge will be lower, HEWL and HEWL PNFs do not produce GNP dispersions. In contrast, BLG and BLG PNFs are highly efficient at exfoliating graphite at pH 7, where the protein will be negatively charged. In contrast, at pH 1.6 where the protein has a positive net charge, exfoliation does not occur. These results are similar to previously reported studies where it has been found that a high degree of charge favors exfoliation and that negative net charges are more favorable than positive charges.10,43 Moreover, when comparing PNFs with the corresponding proteins we observe some interesting differences. In the case of HEWL at pH 1.6, PNFs are more efficient at exfoliating graphite than is HEWL protein. In contrast, BLG at pH 7 is more efficient than are BLG PNFs. However, it should be noted that from a colloidal stability perspective, PNFs display a general advantage over the native protein, as the PNF form under many conditions is thermodynamically more stable than the native protein.37 It has been reported that intrinsically disordered proteins can act as dispersing agents for carbonaceous materials.15 As the PNF dispersion contains other protein materials in addition to PNFs, different peptide fragments may also contribute to the colloidal stability. As shown in Figure S2b, the dispersions of GNPs exfoliated by HEWL PNFs, BLG, and BLG PNFs are stable for at least 1 month, whereas the sample corresponding to HEWL formed a sediment giving a colorless liquid phase. The lower colloidal stability for the samples employing native proteins (compared to that using PNFs) may be related to denaturation of the protein; it has been demonstrated that the presence of hydrophobic surfaces promotes denaturation of proteins,44 which may promote agglomeration of GNPs and proteins.
Characterization of GNPs
The morphology and structure of the GNP dispersions were studied by SEM, FTIR and Raman spectroscopy, and XRD. For analysis by ATR-FTIR, samples were drop-cast onto Si-substrates. Figure 5a shows the FTIR spectra of proteins and PNFs. The peaks at 1643 and 1525 cm–1 correspond to the amide I and II bands.45,46 After milling, the GNP samples still show these two peaks (Figure 5b), which indicates the resulting dispersions contain protein or PNFs. Note that the peaks in the region 1900–2300 cm–1 originate from the substrate (see Figure S3b for the spectrum of the silicon substrate).
Figure 5.

FTIR spectra of various protein and PNFs (a) and GNPs exfoliated by various protein and PNFs (b).
For SEM imaging, samples were drop-cast onto Si-substrates and sputtered with a thin layer of Pt prior to measurements. For reference, we also recorded SEM images of pristine graphite used as the starting material for the exfoliation. As shown in Figure S4, the pristine graphite flakes have a large area built up from tightly packed graphene layers. After exfoliation, the samples are thin and flakelike, which indicates successful exfoliation of graphite to GNPs (Figure 6). In the case of HEWL, objects can be observed which might be the mixture of flakelike GNPs and HEWL (Figure 6a). In Figure 6b–d flakelike structures are readily observed as well as protein materials, matching the results obtained from FTIR spectra of Figure 5b.
Figure 6.

SEM images of GNPs exfoliated by various protein and PNFs: HEWL (a); HEWL PNFs (b); BLG (c); and BLG PNFs (d).
The various samples were also investigated by TEM, and typical images are shown in Figure 7. In all cases, flakelike GNPs can be observed. From such TEM images, the distribution of lateral size of the GNPs was analyzed. Figure S5 shows histograms of the lateral size distribution measured from more than 150 GNP sheets. For the majority (at least 90%) of GNP flakes exfoliated by HEWL, the lateral size is between 100 and 1200 nm, with a few larger size flakes; for GNPs exfoliated by HEWL PNFs, BGL, and BGL PNFs, the distributions are rather similar, with the majority of the flakes having lateral sizes between 100 and 800 nm and with a small number of flakes having larger sizes. However, in the case of BLG and BLG PNFs, there are a larger number of flakes having a size smaller than 200 nm. The thicknesses of GNP flakes exfoliated by the various proteins were estimated from AFM images (see Figures S6 and 2 for typical AFM images). Histograms of the thickness distribution for the various samples are shown in Figure S7. The thicknesses of the majority (at least 90%) of GNPs ranges between 1 and 4 nm for those exfoliated by HEWL, between 1 and 7 nm for those exfoliated by HEWL PNFs, between 3 and 17 nm for those exfoliated by BLG, and between 2 and 12 nm for those exfoliated by BLG PNFs.
Figure 7.

TEM images of GNPs exfoliated by various protein and PNFs: HEWL (a); HEWL PNFs (b); BLG (c); and BLG PNFs (d).
XRD patterns of graphite flakes and GNPs exfoliated by protein and PNFs are shown in Figure 8. Graphite and GNPs exhibit a peak at 2θ = 26.6°, which indicates a basal reflection (002 plane) in graphite crystal originating from the interlayer distance between graphene sheets. It is observed that the diffraction peak 002 of GNPs is broader and weaker than that of graphite, which is due to the breakage of the graphite’s ordered structure; thus, the few-layer structure was achieved during ball-milling process. Graphite exhibits a peak at 2θ = 54.7°, which indicates a long-range order of graphene layers. For the all the GNPs, the peaks at 2θ = 54.7° were absent, which suggests that its sublattices almost completely exclude the long-range order greater than four layers.47,48 The peak at 2θ = 32° of the GNPs exfoliated by BLG PNFs belongs to 200 of NaCl crystal which originates from the NaOH used to neutralize the 25 mM HCl dispersion of BLG PNFs.
Figure 8.
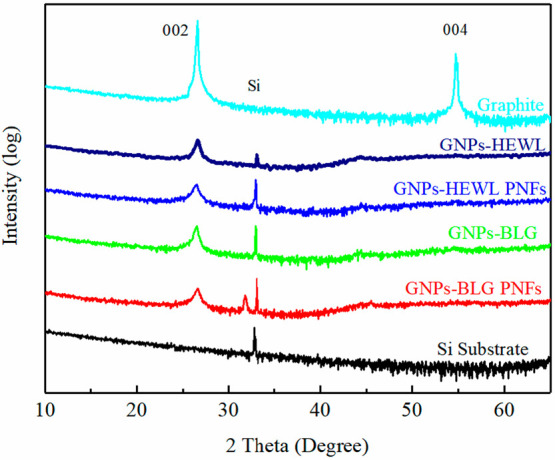
XRD patterns of graphite and GNPs exfoliated by various protein and PNFs.
The structural defects of GNPs exfoliated by protein and PNFs were characterized by Raman spectroscopy.6,49 The spectrum of the graphite flakes used as starting material is shown for comparison. As shown in Figure 9, there are 3 major bands for graphite and GNPs. The D band at ∼1350 cm–1 is due to the first-order phonons and is related to edge effects, and hence is very weak in graphite. The D bands of all the GNPs samples are more intense compared to that of graphite, indicating an increasing amount of defects after exfoliation. The G band at ∼1580 cm–1 is related to the zone center Raman-allowed band. The intensity ratio of the D band to the G band (ID/IG) is related to the concentration of structural defects.49,50 The ID/IG of the Graphite is 0.07. The ID/IG of HEWL exfoliated GNPs is 0.46, which is smaller than that of HEWL PNFs exfoliated GNPs (0.87), BLG exfoliated GNPs (0.93), and BLG PNFs exfoliated GNPs (0.92). It indicates that processing induces defects and that the defects of the GNPs exfoliated by HEWL and HEWL PNFs are less comparing to the ones exfoliated by BLG and BLG PNFs. The D′ band is a defect-related band located at ∼1620 cm–1 that appears as a shoulder on the right side of the G band. The ID/ID′ ratio has been employed to study the type of defect.27,51 The ID/ID′ ratio is dependent on the type of defect as follows: edge defects, ID/ID′ ∼ 3.5; vacancy basal plane point defects, ID/ID′ ∼ 7; and sp3 defects, ID/ID′ ∼ 13. The ID/ID′ ratios of the GNPs in this study are 2–3.3, indicating that only edge defects are present in all protein and PNFs-assisted exfoliation products. The 2D band at ∼2700 cm–1 is due to the second-order phonons, and the shape and position of the 2D band is indicative of the number of layers per layer.5 The 2D band of graphite is located at 2724 cm–1, while the 2D bands of all the GNPs in this study are located at ∼2700 cm–1, which is below 2720 cm–1, indicating that the GNPs exfoliated by protein and PNFs consist of less than 10 layers.27,47
Figure 9.
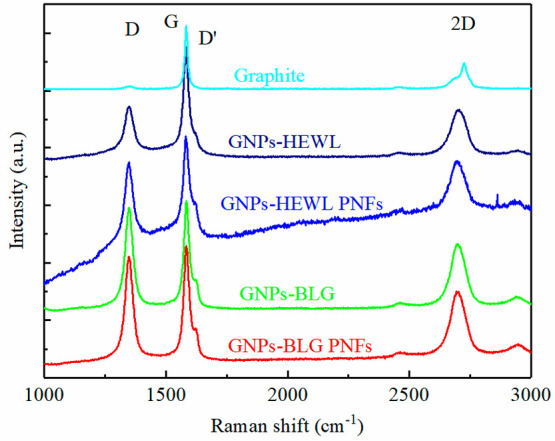
Raman spectrum of graphite and GNPs exfoliated by various protein and PNFs.
In order to investigate if excess PNFs could be removed, the GNP dispersions were centrifuged at high speed (12 krpm). The sediment was collected and redispersed in water at a concentration of 10 mg mL–1. To avoid confusion with the original PNF:GNP dispersions, we label these dispersions where excess PNFs have been removed as GNP inks. SEM images were recorded (see Figure S8), and these show GNP morphologies similar to those of samples before high-speed centrifugation (c.f. Figures 6 and S8). However, after the high-speed centrifugation treatment, the samples contain less protein. The removal of excess protein is also confirmed by FTIR spectroscopy. Figure S3 shows FTIR spectra of different samples. It can be observed that the protein amide I and II band absorptions at ∼1640 and ∼1525 cm–1, readily observable before removal of excess PNFs, are absent in the spectra in the samples after high-speed centrifugation (c.f. Figures 5b and S3a). The removal of excess PNFs lowers the colloidal stability of the samples. Figure S6 shows the photograph of the above-mentioned GNP inks illustrating the long-term stability. For the GNP ink exfoliated by HEWL, sedimentation is observable after standing for 1 day; for the GNP ink exfoliated by BLG, sediments appear after standing after 3 days (visible when turning the vial upside down). The GNP inks exfoliated by HEWL PNFs and BLG PNFs have higher colloidal stability with no signs of sedimentation after 5 days. However, after 7 days all samples show sedimentation. Accordingly, the PNFs exfoliated GNPs show a colloidal stability higher than those exfoliated by protein in the native form. With this point in mind, we focused our studies regarding formation of solid films on the PNF-based materials.
GNP Films
In order to determine the electrical conductivity, the PNF:GNP dispersions were converted into films. The electrical conductivity of the GNPs exfoliated by PNFs were measured on samples drop-cast and dried on a glass substrate, and it was found that the conductivity of the samples containing excess protein was lower than the instrument detection limit. The reason for the low electrical conductivity is the presence of large amount of electrically insulating PNFs in the as-prepared GNP dispersions. We therefore investigated the electrical conductivity of the GNP inks (where excess PNFs had been removed by high-speed centrifugation). Hereafter films are named as “GH” for films prepared from GNP ink exfoliated by HEWL PNFs and as “GB” for films prepared from GNPs ink exfoliated by BLG PNFs. Freestanding GNP-films could be prepared by vacuum filtration of the GNP ink through a polycarbonate filter membrane. After filtration, the resulting GNP film could be peeled off from the membrane resulting in a freestanding film. The electrical conductivities of GH and GB freestanding films are 88 and 110 S m–1, and both films have a thickness of about 14 μm (photographs of the films are shown in Figure S10). However, these freestanding films were brittle and difficult to handle. As an alternative, we also prepared GNP films on substrates by drop-casting (SEM images of the various films are shown in Figure 10). A 60 μL aliquot of GNPs ink was drop-cast on a PET film (1 cm × 1 cm) and dried at 60 °C; photographs of the films are shown in Figure S10. The thicknesses of both GH and GB films are about 3 μm as measured by a Dektak profilometer. The electrical conductivities of the GH and GB films were 29 and 65 S m–1, respectively. The GB film has higher electrical conductivity compared to that of the GH film, which might be due to a smaller content of residual PNFs in GB compared to GH and/or due to differences in morphology. Still, both GH films and GB films have a relatively low conductivity due to the presence of electrically insulating PNFs residues. To increase electrical conductivity of the films, they were annealed at high temperature in order to carbonize protein residues. The GNPs ink (60 μL) was drop-cast on quartz glass (1 cm × 1 cm), followed by annealing under high vacuum at 420 °C for 30 min to carbonize PNFs; these samples were referred to as “GH annealed” for GNPs ink exfoliated by HEWL PNFs and as “GB annealed” for GNPs ink exfoliated by BLG PNFs. The electrical conductivities of the GH annealed and GB annealed films were 1900 and 3250 S m–1, respectively. The SEM images of the surfaces of GH, GB, GH annealed, and GB annealed samples are shown in Figure 10. In all cases, sheetlike structures can be observed, and no dramatic structural changes can be observed after annealing.
Figure 10.

SEM images of the surface of the GNPs composite films exfoliated by PNFs. GH (a); GH annealed (b); GB (c); and GB annealed (d).
The mechanical flexibility and the influence of bending on the resistivity of the films on PET substrates were determined by measuring the resistance normalized to its initial value as functions of the bending radius of GH and GB films, as shown in Figure 11. The GH and GB films show less than 10% difference when the bending radius reach 3.5 mm, indicating that the films are mechanically flexible and can withstand bending without deterioration of electrical properties.
Figure 11.
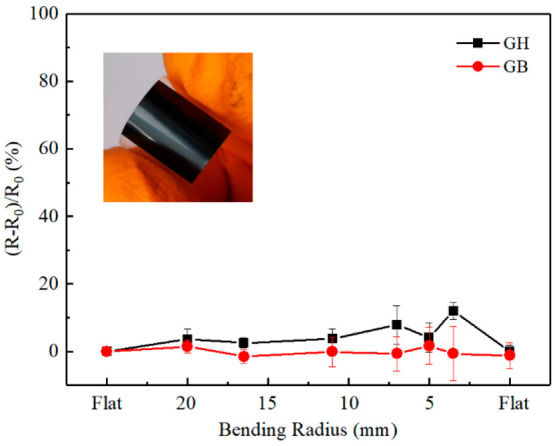
Measured resistance (R) normalized to its initial value (R0) as functions of the bending radius of GH and GB films on PET substrate. Error bars are presented as means standard deviation of three independent samples. Some error bars are too small to be visible. The inset is a photo of a bent film.
Thermoelectric Characterization
To evaluate the performance of thermoelectric materials, a dimensionless figure of merit, defined as S2σT/κ, is commonly used, where S, σ, and κ designates the Seebeck coefficient, electrical conductivity and thermal conductivity, respectively. Due to the difficulty of accurately measuring thermal conductivity, an alternative parameter, the power factor defined as S2σ, is often employed for evaluation of thermoelectric materials.31 We determined the Seebeck coefficient for the different PNF:GNP films. The Seebeck coefficient was determined by means of a custom-built four-probe system, with two K-type thermocouples for measuring temperatures and two copper tapes for measuring voltage (V). A schematic drawing of the setup is shown in Figure S11. The measurements were performed at room temperature, and the temperature differences (ΔT) were controlled between 1 and 10 K. The Seebeck coefficients for the different films were then obtained by the slope of the plot of ΔV versus ΔT (a representative curve of ΔV–ΔT is given in Figure S12). Table 2 is a compilation of data for the Seebeck coefficients, electrical conductivities, and power factors of the different prepared films.
Table 2. Dependence of Seebeck Coefficient, Electrical Conductivity, and Power Factor of the Thermoelectric Films of GNPs Exfoliation by Various PNFs and the GNPs after Annealinga.
| Seebeck coefficient (μV K–1) | electrical conductivity (S m–1) | power factor (μW m–1 K–2) | |
|---|---|---|---|
| GH | 50.9 ± 0.5 | 29.3 ± 5.0 | 0.08 ± 0.01 |
| GB | 49.1 ± 0.4 | 65.0 ± 20.7 | 0.16 ± 0.05 |
| GH annealed | 23.8 ± 1.0 | 1900 ± 100 | 1.1 ± 0.1 |
| GB annealed | 37.6 ± 0.2 | 3250 ± 325 | 4.6 ± 0.4 |
Error bars are presented as mean standard deviation of three independent samples.
All four different GNP films have a positive Seebeck coefficient, indicating that the films are p-type conductors. The Seebeck coefficient of the GH and GB films are about 50 μV K–1, which is comparable to that of graphene-based polymer composites.31,52,53 However, as stated earlier GH and GB show low conductivities due to the presence of PNFs residues. As a result, the power factor S2σ is low for both GH and GB films. The Seebeck coefficients decreased to 23.8 μV K–1 for GH annealed and 37.6 μV K–1 for GB annealed. However, due to the significant increase of the electrical conductivities, the power factor is much larger for the annealed samples; the power factor is 1.1 μW m–1 K–2 for the GH annealed film and 4.6 μW m–1 K–2for the GB annealed film. This is comparable to materials systems such as PEDOT/rGO, PEDOT:PSS/graphene, and PANi/Graphene.52,54,55
Conclusion
In summary, a ball-milling procedure has been developed where graphite is milled with PNFs and under appropriate conditions aqueous dispersions with a high concentration (up to 3.2 mg mL–1) of GNPs are obtained. The PNFs help to exfoliate graphite and stabilize the resulting GNP dispersions by electrostatic repulsion. Excess PNFs can, if desired, be removed by centrifugation in order to achieve conductive GNPs ink that can be processed into mechanically flexible conductive films. Films formed from the GNP inks were evaluated as thermoelectric materials and have Seebeck coefficients of about 50 μV K–1. However, the presence of residual PNFs leads to a low conductivity and hence a low power factor. After an annealing treatment, the conductivity of the films increases with a concomitant relatively small decrease of the Seebeck coefficient, and accordingly, the power factor increases up to a value of 4.6 μW/m K2. We demonstrate that simple milling of graphite and PNFs generates materials that can readily be processed into active materials for thermoelectrics. Considering the many degrees of freedom for further materials optimization of PNF:GNP materials, the presented research may enable future fabrication of low-cost thermoelectric devices based on materials from sustainable sources.
Acknowledgments
L.W. and B. X. acknowledge financial support from the China Scholarship Council. N.S. acknowledges support from Formas under project 2019-00679. N.S. and L.W. acknowledge discussions and support within the COST action CA18112 Mechanochemistry for Sustainable Industry, supported by COST (European Cooperation in Science and Technology). P.E. and B.X. acknowledge support from the Knut and Alice Wallenberg Foundation through the Wallenberg Academy Fellows program, the Swedish Energy Agency under project 46519-1, and the Swedish Government Strategic Research Area in Materials Science on Functional Materials at Linköping University (Faculty Grant SFO-Mat-LiU No. 2009 00971). We acknowledge Ivan Ivanov for assistance with Raman measurements.
Supporting Information Available
The Supporting Information is available free of charge at https://pubs.acs.org/doi/10.1021/acssuschemeng.0c05048.
Calibration of GNPs concentration by UV–vis absorbance spectra, TGA curve, GNPs lateral size and thickness distribution, AFM of GNPs, photographs of GNPs dispersion and GNPs films, FT-IR spectra of the GNPs, SEM of the pristine graphite and GNPs, schematic drawing of the custom-built setup and a ΔV versus ΔT curve (PDF)
The authors declare no competing financial interest.
Supplementary Material
References
- Novoselov K. S.; Geim A. K.; Morozov S. V.; Jiang D.; Zhang Y.; Dubonos S. V.; Grigorieva I. V.; Firsov A. A. Electric field effect in atomically thin carbon films. Science 2004, 306, 666–669. 10.1126/science.1102896. [DOI] [PubMed] [Google Scholar]
- Wang B.; Ruan T.; Chen Y.; Jin F.; Peng L.; Zhou Y.; Wang D.; Dou S. Graphene-based composites for electrochemical energy storage. Energy Storage Mater. 2020, 24, 22–51. 10.1016/j.ensm.2019.08.004. [DOI] [Google Scholar]
- Dugerjav O.; Duvjir G.; Tapaszto L.; Hwang C. Growth of Graphene on the Cu(110) Surface. J. Phys. Chem. C 2020, 124, 12106–12111. 10.1021/acs.jpcc.9b10296. [DOI] [Google Scholar]
- Stankovich S.; Dikin D. A.; Piner R. D.; Kohlhaas K. A.; Kleinhammes A.; Jia Y.; Wu Y.; Nguyen S. T.; Ruoff R. S. Synthesis of graphene-based nanosheets via chemical reduction of exfoliated graphite oxide. Carbon 2007, 45, 1558–1565. 10.1016/j.carbon.2007.02.034. [DOI] [Google Scholar]
- Paton K. R.; Varrla E.; Backes C.; Smith R. J.; Khan U.; O’Neill A.; Boland C.; Lotya M.; Istrate O. M.; King P.; Higgins T.; Barwich S.; May P.; Puczkarski P.; Ahmed I.; Moebius M.; Pettersson H.; Long E.; Coelho J.; O’Brien S. E.; McGuire E. K.; Sanchez B. M.; Duesberg G. S.; McEvoy N.; Pennycook T. J.; Downing C.; Crossley A.; Nicolosi V.; Coleman J. N. Scalable production of large quantities of defect-free few-layer graphene by shear exfoliation in liquids. Nat. Mater. 2014, 13, 624–630. 10.1038/nmat3944. [DOI] [PubMed] [Google Scholar]
- Backes C.; Abdelkader A. M.; Alonso C.; Andrieux-Ledier A.; Arenal R.; Azpeitia J.; Balakrishnan N.; Banszerus L.; Barjon J.; Bartali R.; Bellani S.; Berger C.; Berger R.; Ortega M. M. B.; Bernard C.; Beton P. H.; Beyer A.; Bianco A.; Bøggild P.; Bonaccorso F.; Barin G. B.; Botas C.; Bueno R. A.; Carriazo D.; Castellanos-Gomez A.; Christian M.; Ciesielski A.; Ciuk T.; Cole M. T.; Coleman J.; Coletti C.; Crema L.; Cun H.; Dasler D.; De Fazio D.; Díez N.; Drieschner S.; Duesberg G. S.; Fasel R.; Feng X.; Fina A.; Forti S.; Galiotis C.; Garberoglio G.; García J. M.; Garrido J. A.; Gibertini M.; Gölzhäuser A.; Gómez J.; Greber T.; Hauke F.; Hemmi A.; Hernandez-Rodriguez I.; Hirsch A.; Hodge S. A.; Huttel Y.; Jepsen P. U.; Jimenez I.; Kaiser U.; Kaplas T.; Kim H.; Kis A.; Papagelis K.; Kostarelos K.; Krajewska A.; Lee K.; Li C.; Lipsanen H.; Liscio A.; Lohe M. R.; Loiseau A.; Lombardi L.; Francisca López M.; Martin O.; Martín C.; Martínez L.; Martin-Gago J. A.; Ignacio Martínez J.; Marzari N.; Mayoral Á.; McManus J.; Melucci M.; Méndez J.; Merino C.; Merino P.; Meyer A. P.; Miniussi E.; Miseikis V.; Mishra N.; Morandi V.; Munuera C.; Muñoz R.; Nolan H.; Ortolani L.; Ott A. K.; Palacio I.; Palermo V.; Parthenios J.; Pasternak I.; Patane A.; Prato M.; Prevost H.; Prudkovskiy V.; Pugno N.; Rojo T.; Rossi A.; Ruffieux P.; Samorì P.; Schué L.; Setijadi E.; Seyller T.; Speranza G.; Stampfer C.; Stenger I.; Strupinski W.; Svirko Y.; Taioli S.; Teo K. B. K.; Testi M.; Tomarchio F.; Tortello M.; Treossi E.; Turchanin A.; Vazquez E.; Villaro E.; Whelan P. R.; Xia Z.; Yakimova R.; Yang S.; Yazdi G. R.; Yim C.; Yoon D.; Zhang X.; Zhuang X.; Colombo L.; Ferrari A. C.; Garcia-Hernandez M. Production and processing of graphene and related materials. 2D Mater. 2020, 7, 022001 10.1088/2053-1583/ab1e0a. [DOI] [Google Scholar]
- Ferreira E. S.; da Silva D. S.; Burgo T. A. L.; Batista B. C.; Galembeck F. Graphite exfoliation in cellulose solutions. Nanoscale 2017, 9, 10219–10226. 10.1039/C7NR02365K. [DOI] [PubMed] [Google Scholar]
- Ayan-Varela M.; Paredes J. I.; Guardia L.; Villar-Rodil S.; Munuera J. M.; Diaz-Gonzalez M.; Fernandez-Sanchez C.; Martinez-Alonso A.; Tascon J. M. Achieving extremely concentrated aqueous dispersions of graphene flakes and catalytically efficient graphene-metal nanoparticle hybrids with flavin mononucleotide as a high-performance stabilizer. ACS Appl. Mater. Interfaces 2015, 7, 10293–10307. 10.1021/acsami.5b00910. [DOI] [PubMed] [Google Scholar]
- Cao M.; Wang N.; Wang L.; Zhang Y.; Chen Y.; Xie Z.; Li Z.; Pambou E.; Li R.; Chen C.; Pan F.; Xu H.; Penny J.; Webster J. R. P.; Lu J. R. Direct exfoliation of graphite into graphene in aqueous solutions of amphiphilic peptides. J. Mater. Chem. B 2016, 4, 152–161. 10.1039/C5TB02065D. [DOI] [PubMed] [Google Scholar]
- Pattammattel A.; Kumar C. V. Kitchen Chemistry 101: Multigram Production of High Quality Biographene in a Blender with Edible Proteins. Adv. Funct. Mater. 2015, 25, 7088–7098. 10.1002/adfm.201503247. [DOI] [Google Scholar]
- Laaksonen P.; Kainlauri M.; Laaksonen T.; Shchepetov A.; Jiang H.; Ahopelto J.; Linder M. B. Interfacial Engineering by Proteins: Exfoliation and Functionalization of Graphene by Hydrophobins. Angew. Chem., Int. Ed. 2010, 49, 4946–4949. 10.1002/anie.201001806. [DOI] [PubMed] [Google Scholar]
- Tao J.; Wang Y.; Xiao Y.; Yao P.; Chen C.; Zhang D.; Pang W.; Yang H.; Sun D.; Wang Z.; Liu J. One-step exfoliation and functionalization of graphene by hydrophobin for high performance water molecular sensing. Carbon 2017, 116, 695–702. 10.1016/j.carbon.2017.02.052. [DOI] [Google Scholar]
- Zhuo H.; Zhang X.; Wang L.; Lu Q.; Kaplan D. L. Sonication Exfoliation of Defect-Free Graphene in Aqueous Silk Nanofiber Solutions. ACS Sustainable Chem. Eng. 2018, 6, 12261–12267. 10.1021/acssuschemeng.8b02644. [DOI] [Google Scholar]
- Li C.; Bolisetty S.; Chaitanya K.; Adamcik J.; Mezzenga R. Tunable carbon nanotube/protein core-shell nanoparticles with NIR- and enzymatic-responsive cytotoxicity. Adv. Mater. 2013, 25, 1010–1015. 10.1002/adma.201203382. [DOI] [PubMed] [Google Scholar]
- Chaudhary H.; Fernandes R. M. F.; Gowda V.; Claessens M.; Furo I.; Lendel C. Intrinsically disordered protein as carbon nanotube dispersant: How dynamic interactions lead to excellent colloidal stability. J. Colloid Interface Sci. 2019, 556, 172–179. 10.1016/j.jcis.2019.08.050. [DOI] [PubMed] [Google Scholar]
- Li C.; Mezzenga R. The interplay between carbon nanomaterials and amyloid fibrils in bio-nanotechnology. Nanoscale 2013, 5, 6207–6218. 10.1039/c3nr01644g. [DOI] [PubMed] [Google Scholar]
- Li C.; Adamcik J.; Mezzenga R. Biodegradable nanocomposites of amyloid fibrils and graphene with shape-memory and enzyme-sensing properties. Nat. Nanotechnol. 2012, 7, 421–427. 10.1038/nnano.2012.62. [DOI] [PubMed] [Google Scholar]
- Iadanza M. G.; Jackson M. P.; Hewitt E. W.; Ranson N. A.; Radford S. E. A new era for understanding amyloid structures and disease. Nat. Rev. Mol. Cell Biol. 2018, 19, 755–773. 10.1038/s41580-018-0060-8. [DOI] [PMC free article] [PubMed] [Google Scholar]
- Josefsson L.; Ye X.; Brett C. J.; Meijer J.; Olsson C.; Sjögren A.; Sundlöf J.; Davydok A.; Langton M.; Emmer Å.; Lendel C. Potato Protein Nanofibrils Produced from a Starch Industry Sidestream. ACS Sustainable Chem. Eng. 2020, 8, 1058–1067. 10.1021/acssuschemeng.9b05865. [DOI] [Google Scholar]
- Knowles T. P.; Mezzenga R. Amyloid Fibrils as Building Blocks for Natural and Artificial Functional Materials. Adv. Mater. 2016, 28, 6546–6561. 10.1002/adma.201505961. [DOI] [PubMed] [Google Scholar]
- Solin N.; Inganäs O. Protein Nanofibrils Balance Colours in Organic White-Light-Emitting Diodes. Isr. J. Chem. 2012, 52, 529–539. 10.1002/ijch.201100113. [DOI] [Google Scholar]
- Tansel B. From electronic consumer products to e-wastes: Global outlook, waste quantities, recycling challenges. Environ. Int. 2017, 98, 35–45. 10.1016/j.envint.2016.10.002. [DOI] [PubMed] [Google Scholar]
- Kumar A.; Holuszko M.; Espinosa D. C. R. E-waste: An overview on generation, collection, legislation and recycling practices. Resour. Conserv. Recycl. 2017, 122, 32–42. 10.1016/j.resconrec.2017.01.018. [DOI] [Google Scholar]
- James S. L.; Adams C. J.; Bolm C.; Braga D.; Collier P.; Friscic T.; Grepioni F.; Harris K. D.; Hyett G.; Jones W.; Krebs A.; Mack J.; Maini L.; Orpen A. G.; Parkin I. P.; Shearouse W. C.; Steed J. W.; Waddell D. C. Mechanochemistry: opportunities for new and cleaner synthesis. Chem. Soc. Rev. 2012, 41, 413–447. 10.1039/C1CS15171A. [DOI] [PubMed] [Google Scholar]
- Boldyreva E. Mechanochemistry of inorganic and organic systems: what is similar, what is different?. Chem. Soc. Rev. 2013, 42, 7719–7738. 10.1039/c3cs60052a. [DOI] [PubMed] [Google Scholar]
- Do J. L.; Friscic T. Mechanochemistry: A Force of Synthesis. ACS Cent. Sci. 2017, 3, 13–19. 10.1021/acscentsci.6b00277. [DOI] [PMC free article] [PubMed] [Google Scholar]
- Buzaglo M.; Bar I. P.; Varenik M.; Shunak L.; Pevzner S.; Regev O. Graphite-to-Graphene: Total Conversion. Adv. Mater. 2017, 29, 1603528. 10.1002/adma.201603528. [DOI] [PubMed] [Google Scholar]
- Beretta D.; Neophytou N.; Hodges J. M.; Kanatzidis M. G.; Narducci D.; Martin- Gonzalez M.; Beekman M.; Balke B.; Cerretti G.; Tremel W.; et al. Thermoelectrics: From history, a window to the future. Mater. Sci. Eng., R 2019, 138, 100501. 10.1016/j.mser.2018.09.001. [DOI] [Google Scholar]
- Du Y.; Xu J.; Paul B.; Eklund P. Flexible thermoelectric materials and devices. Appl. Mater. Today 2018, 12, 366–388. 10.1016/j.apmt.2018.07.004. [DOI] [Google Scholar]
- Bonaccorso F.; Colombo L.; Yu G.; Stoller M.; Tozzini V.; Ferrari A. C.; Ruoff R. S.; Pellegrini V. Graphene, related two-dimensional crystals, and hybrid systems for energy conversion and storage. Science 2015, 347, 1246501. 10.1126/science.1246501. [DOI] [PubMed] [Google Scholar]
- Zhang Y.; Heo Y. J.; Park M.; Park S. J. Recent Advances in Organic Thermoelectric Materials: Principle Mechanisms and Emerging Carbon-Based Green Energy Materials. Polymers 2019, 11, 167. 10.3390/polym11010167. [DOI] [PMC free article] [PubMed] [Google Scholar]
- Yu Z.; Shi Z.; Xu H.; Ma X.; Tian M.; Yin J. Green chemistry: Co-assembly of tannin-assisted exfoliated low-defect graphene and epoxy natural rubber latex to form soft and elastic nacre-like film with good electrical conductivity. Carbon 2017, 114, 649–660. 10.1016/j.carbon.2016.12.049. [DOI] [Google Scholar]
- Wei T.-R.; Guan M.; Yu J.; Zhu T.; Chen L.; Shi X. How to Measure Thermoelectric Properties Reliably. Joule 2018, 2, 2183–2188. 10.1016/j.joule.2018.10.020. [DOI] [Google Scholar]
- Liu Y.; Fu C.; Xie H.; Zhao X.; Zhu T. Reliable measurements of the Seebeck coefficient on a commercial system. J. Mater. Res. 2015, 30, 2670–2677. 10.1557/jmr.2015.218. [DOI] [Google Scholar]
- Gharavi M. A.; Kerdsongpanya S.; Schmidt S.; Eriksson F.; Nong N. V.; Lu J.; Balke B.; Fournier D.; Belliard L.; le Febvrier A.; Pallier C.; Eklund P. Microstructure and thermoelectric properties of CrN and CrN/Cr2N thin films. J. Phys. D: Appl. Phys. 2018, 51, 355302. 10.1088/1361-6463/aad2ef. [DOI] [Google Scholar]
- Cao Y.; Mezzenga R. Food protein amyloid fibrils: Origin, structure, formation, characterization, applications and health implications. Adv. Colloid Interface Sci. 2019, 269, 334–356. 10.1016/j.cis.2019.05.002. [DOI] [PubMed] [Google Scholar]
- Knowles T. P.; Vendruscolo M.; Dobson C. M. The amyloid state and its association with protein misfolding diseases. Nat. Rev. Mol. Cell Biol. 2014, 15, 384–396. 10.1038/nrm3810. [DOI] [PubMed] [Google Scholar]
- Mantovani R. A.; de Figueiredo Furtado G.; Netto F. M.; Cunha R. L. Assessing the potential of whey protein fibril as emulsifier. J. Food Eng. 2018, 223, 99–108. 10.1016/j.jfoodeng.2017.12.006. [DOI] [Google Scholar]
- Veerman C.; Ruis H.; Sagis L. M. C.; van der Linden E. Effect of electrostatic interactions on the percolation concentration of fibrillar β-lactoglobulin gels. Biomacromolecules 2002, 3, 869–873. 10.1021/bm025533+. [DOI] [PubMed] [Google Scholar]
- Mishra R.; Sorgjerd K.; Nystrom S.; Nordigarden A.; Yu Y. C.; Hammarstrom P. Lysozyme amyloidogenesis is accelerated by specific nicking and fragmentation but decelerated by intact protein binding and conversion. J. Mol. Biol. 2007, 366, 1029–1044. 10.1016/j.jmb.2006.11.084. [DOI] [PubMed] [Google Scholar]
- Howard J. L.; Cao Q.; Browne D. L. Mechanochemistry as an emerging tool for molecular synthesis: what can it offer?. Chem. Sci. 2018, 9, 3080–3094. 10.1039/C7SC05371A. [DOI] [PMC free article] [PubMed] [Google Scholar]
- Salis A.; Bostrom M.; Medda L.; Cugia F.; Barse B.; Parsons D. F.; Ninham B. W.; Monduzzi M. Measurements and theoretical interpretation of points of zero charge/potential of BSA protein. Langmuir 2011, 27, 11597–11604. 10.1021/la2024605. [DOI] [PubMed] [Google Scholar]
- Joseph D.; Tyagi N.; Ghimire A.; Geckeler K. E. A direct route towards preparing pH-sensitive graphene nanosheets with anti-cancer activity. RSC Adv. 2014, 4, 4085–4093. 10.1039/C3RA45984E. [DOI] [Google Scholar]
- Sluzky V.; Tamada J. A.; Klibanov A. M.; Langer R. Kinetics of insulin aggregation in aqueous solutions upon agitation in the presence of hydrophobic surfaces. Proc. Natl. Acad. Sci. U. S. A. 1991, 88, 9377–9381. 10.1073/pnas.88.21.9377. [DOI] [PMC free article] [PubMed] [Google Scholar]
- Bhattacharjee C.; Saha S.; Biswas A.; Kundu M.; Ghosh L.; Das K. P. Structural changes of beta-lactoglobulin during thermal unfolding and refolding--an FT-IR and circular dichroism study. Protein J. 2005, 24, 27–35. 10.1007/s10930-004-0603-z. [DOI] [PubMed] [Google Scholar]
- Zhang B.; Tao H.; Niu X.; Li S.; Chen H. Q. Lysozyme distribution, structural identification, and in vitro release of starch-based microgel-lysozyme complexes. Food Chem. 2017, 227, 137–141. 10.1016/j.foodchem.2017.01.073. [DOI] [PubMed] [Google Scholar]
- Shih C. J.; Vijayaraghavan A.; Krishnan R.; Sharma R.; Han J. H.; Ham M. H.; Jin Z.; Lin S.; Paulus G. L.; Reuel N. F.; Wang Q. H.; Blankschtein D.; Strano M. S. Bi- and trilayer graphene solutions. Nat. Nanotechnol. 2011, 6, 439–445. 10.1038/nnano.2011.94. [DOI] [PubMed] [Google Scholar]
- Wang S.; Yi M.; Shen Z. The effect of surfactants and their concentration on the liquid exfoliation of graphene. RSC Adv. 2016, 6, 56705–56710. 10.1039/C6RA10933K. [DOI] [Google Scholar]
- Dresselhaus M. S.; Jorio A.; Souza Filho A. G.; Saito R. Defect characterization in graphene and carbon nanotubes using Raman spectroscopy. Philos. Trans. R. Soc., A 2010, 368, 5355–5377. 10.1098/rsta.2010.0213. [DOI] [PubMed] [Google Scholar]
- Lotya M.; King P. J.; Khan U.; De S.; Coleman J. N. High-concentration, surfactant-stabilized graphene dispersions. ACS Nano 2010, 4, 3155–3162. 10.1021/nn1005304. [DOI] [PubMed] [Google Scholar]
- Eckmann A.; Felten A.; Mishchenko A.; Britnell L.; Krupke R.; Novoselov K. S.; Casiraghi C. Probing the nature of defects in graphene by Raman spectroscopy. Nano Lett. 2012, 12, 3925–3930. 10.1021/nl300901a. [DOI] [PubMed] [Google Scholar]
- Lu Y.; Song Y.; Wang F. Thermoelectric properties of graphene nanosheets-modified polyaniline hybrid nanocomposites by an in situ chemical polymerization. Mater. Chem. Phys. 2013, 138, 238–244. 10.1016/j.matchemphys.2012.11.052. [DOI] [Google Scholar]
- Zong P.-a.; Liang J.; Zhang P.; Wan C.; Wang Y.; Koumoto K. Graphene-Based Thermoelectrics. ACS Appl. Energy Mater. 2020, 3, 2224–2239. 10.1021/acsaem.9b02187. [DOI] [Google Scholar]
- Du Y.; Shen S. Z.; Yang W.; Donelson R.; Cai K.; Casey P. S. Simultaneous increase in conductivity and Seebeck coefficient in a polyaniline/graphene nanosheets thermoelectric nanocomposite. Synth. Met. 2012, 161, 2688–2692. 10.1016/j.synthmet.2011.09.044. [DOI] [Google Scholar]
- Zuev Y. M.; Chang W.; Kim P. Thermoelectric and magnetothermoelectric transport measurements of graphene. Phys. Rev. Lett. 2009, 102, 096807 10.1103/PhysRevLett.102.096807. [DOI] [PubMed] [Google Scholar]
Associated Data
This section collects any data citations, data availability statements, or supplementary materials included in this article.