Summary
Innate lymphoid cells (ILCs) rapidly undergo expansion in population size and functional maturation in response to cytokines that signal infection, tissue damage or changes in physiology. Optimal ILC responses are shaped, in part, by the microbiota but the mechanisms remain unclear. We report that short-chain fatty acids (SCFAs), produced by the commensal microbiota from dietary fibers, support optimal expansion of ILCs, including ILC1, ILC2 and ILC3 in the intestines through their G-protein-coupled receptors (GPCRs). While this function is primarily important for intestinal ILC populations, it can also boost ILC responses in other tissues depending on host condition. ILCs express multiple GPCRs that detect SCFAs. Interestingly, we found that the expression of SCFA receptors, such as Ffar2 and Ffar3, by ILCs is induced by SCFAs. GPCR triggering by SCFAs co-stimulates the activation of Phosphoinositide 3-kinase (PI3K), Stat3, Stat5, and mammalian target of rapamycin (mTOR), which is important for ILC proliferation. While Ffar2 signaling promotes ILC2 proliferation, SCFAs can suppress ILC2 proliferation through a non-Ffar2-mediated mechanism. In conclusion, our findings indicate that SCFAs, as the major mediator of healthy microbiota and nutritional status, function to maintain optimal numbers of ILCs in peripheral tissues during infection and inflammatory responses.
Keywords: Dietary fiber, Short-chain fatty acids, Microbial metabolites, Innate lymphoid cells, G-protein-coupled receptor
Introduction
The commensal microbiota plays profound roles in shaping the immune systems. Innate lymphoid cells (ILCs) are classified into group 1 (NK cells and non-NK ILC1), 2 (ILC2) and 3 (ILC3) based on their development and functional characteristics 1. ILC1 express T-bet as the master transcription factor and produce IFNγ. ILC2 express GATA3 and produce IL-5, IL-9 and IL-13. ILC3 express RORγt and include natural cytotoxicity receptor (NCR)+ and NCR-CCR6+ ILC3 subsets 2, 3. Lymphoid tissue-inducer (LTi) cells, inducing the formation of secondary lymphoid tissues during fetal development, also belong to the ILC3 group. ILC3 subsets express IL-22, IL-17A/F, and GM-CSF as the major effector cytokines. Additionally, ILCs that express IL-10 for regulatory functions have been identified 4, 5, 6. Considerable levels of transdifferentiation between ILC1 and ILC3, as well as ILC2 and ILC3 have been observed7. In line with their effector cytokine patterns, ILC1, ILC2, and ILC3 provide innate immunity against intracellular pathogens, helminths, and extracellular pathogens respectively. ILCs also regulate tissue remodeling/repair, adaptive immunity, and fat lipolysis in ILC subset-specific manners. ILCs, particularly ILC3, are required to maintain optimal symbiotic relationship with the microbiota 1, 7, 8, 9, 10, 11.Deficiencies in ILCs cause dysbiosis and microbial tissue invasion 12, 13. On the other hand, germ-free mice that lack the commensal microbiota have defective ILC functions 3, 14, 15.
The functions of microbiota in regulating ILCs is mediated, in part, through various cell types including epithelial cells, macrophages and dendritic cells. These cells sense and activate ILCs by producing cytokines 16. Important cytokines for ILC differentiation include IL-7 for generation of all non-NK ILCs; IL-1β and IL-23 for ILC3; Thymic Stromal Lymphopoietin (TSLP), IL-33 and IL-25 for ILC2. The development of ILCs, such as T-bet-expressing ILC1, is regulated by the microbiota 15. Microbiota can either increase or decrease ILC2 through distinct mediators such as TSLP and Type I/II IFNs 17, 18. Microbiota induces the expression of IL-1β and IL-23 which, in turn, activate ILC3 cells 16, 19, 20, 21, 22, 23.
A mounting body of evidence indicates that ILCs are regulated by the metabolites produced by the commensal microbiota. Thus far, activation of Aryl Hydrocarbon Receptor (AHR) has been identified as a regulator of ILC3 21, 24. AHR triggering promotes NCR+ ILC3 and LTi cells. For example, tryptophan metabolites, such as indole-3-acetate, can activate ILC3 23. However, the functions of other microbial metabolites and their host receptors in regulating the ILC compartment remain largely unknown 25, 26. In the intestine, the most abundant microbial metabolites are short-chain fatty acids (SCFAs). SCFAs are mainly produced from dietary fiber (DFs) by microbial fermentation 27. Major SCFAs include acetate (C2), propionate (C3), and butyrate (C4). The combined luminal concentration of major SCFAs peaks in the proximal colon (~100 mmol/Kg in humans), but SCFAs are also present in the distal colon (~80 mmol/Kg) and small intestine (SI, ~10 mmol/Kg) at significant levels 28. SCFAs are also absorbed into the blood circulation. In mice, SCFAs are present at ~0.13 (C2), 0.015 (C3), and 0.15 (C4) μmol/ml in the peripheral blood 29. SCFAs promote IL-10 production by T cells and macrophages and support antibody production in the intestine in steady state but also boost the function of effector CD4+ and CD8+ T, and B cells in systemic sites during infection 29, 30, 31, 32, 33,34, 35. Recently, several groups reported that SCFAs can regulate the activity of ILC2 and ILC3 36, 37, 38. However, the results are somewhat contradictory and limited to particular ILC subsets and tissue sites, warranting further studies to gain broad insights.
We investigated the function of DF metabolites and their receptors in regulating ILCs in mucosal and systemic tissue sites. We report that SCFA triggering of GPCRs provide key signals to expand tissue populations of ILC1, ILC2 and ILC3. GPCR signaling synergizes with cytokine receptor signaling to expand ILC populations in the intestines. This establishes SCFAs as key mediators of nutritional and microbial status in shaping the peripheral ILC system.
Results
Dietary fiber administration expands intestinal T-bet+ and T-bet− ILC3 populations
Soluble DFs, such as pectin and inulin, serve as prebiotics to increase SCFA levels in the intestine and the blood via microbial fermentation 39, 40. These DFs boost immunity against enteric bacterial pathogens such as Citrobacter rodentium (C. rodentium) in mice 29, 32. Because ILCs, particularly ILC3 subsets, play key roles in fighting C. rodentium, we examined the numbers of ILC3 in immunocompetent C57BL/6 mice fed low DF diet (LFD, 0% soluble DF) vs. high DF (HFD, 15% soluble DF), which respectively produce low and high levels of SCFAs in the intestine and blood 29 but maintains comparable water content in feces (Fig.Sla). Considerable decreases in the expression of RegIIIb, IL22, IL17a and Ffar2 (also called Gpr43) were detected in colon tissues of LFD-fed mice compared to HFD mice (Fig.S1b). Significant differences in the number or frequency of T-bet− and T-bet– ILC3 cells were observed in both the SI and large intestine (LI) but not in the mesenteric lymph node (MLN) and spleen (Fig.1a; S1c-e).
Figure 1. Soluble dietary fibers increase the numbers of ILC3 in the small and large intestines.
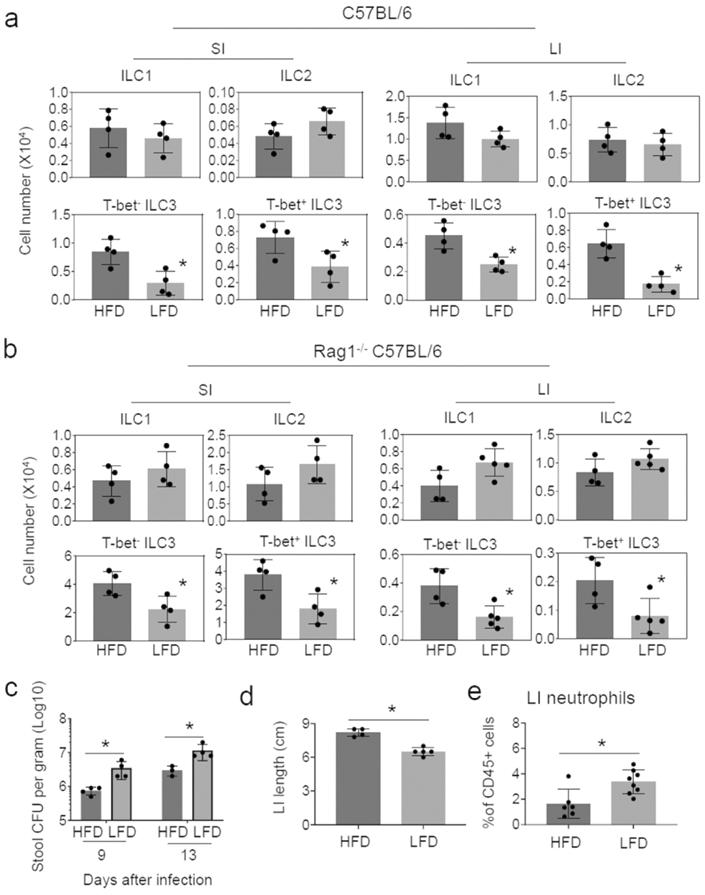
(a) Effects of DFs on ILCs in WT C57BL/6 mice. (b) Effects of DFs on ILCs in Rag1−/− C57BL/6 mice. (c) Fecal C. rodentium burden. (d) Colon length. (e) Neutrophil numbers in colonic lamina propria cells. Mice were fed LFD or HFD for 3 weeks and infected with C. rodentium. Two weeks later, ILC numbers in various tissues were examined. Pooled data obtained from at least 2 different experiments (n=4-5) are shown. Significant differences (p<0.05) between groups. Error bars are SEM.
Because of the largely positive effect of DFs on ILC3 in immunocompetent WT mice, we performed a similar experiment with Rag1−/− mice, which lack T and B cells. Soluble DFs increased both T-bet+ and T-bet− ILC3 subsets in SI and LI (Fig.1b, S2a-c). While the importance is unclear, moderate increases in ILC1 numbers in the spleen by LFD feeding was also observed. A clear positive effect of DFs on decreasing the enteric pathogen burden and inflammatory responses, based on colon length and neutrophil infiltration, was observed (Fig.1c-e). Overall, DFs positively regulated intestinal ILC3 populations and improved intestinal immunity to C. rodentium infection.
ILCs express SCFA-sensing receptors
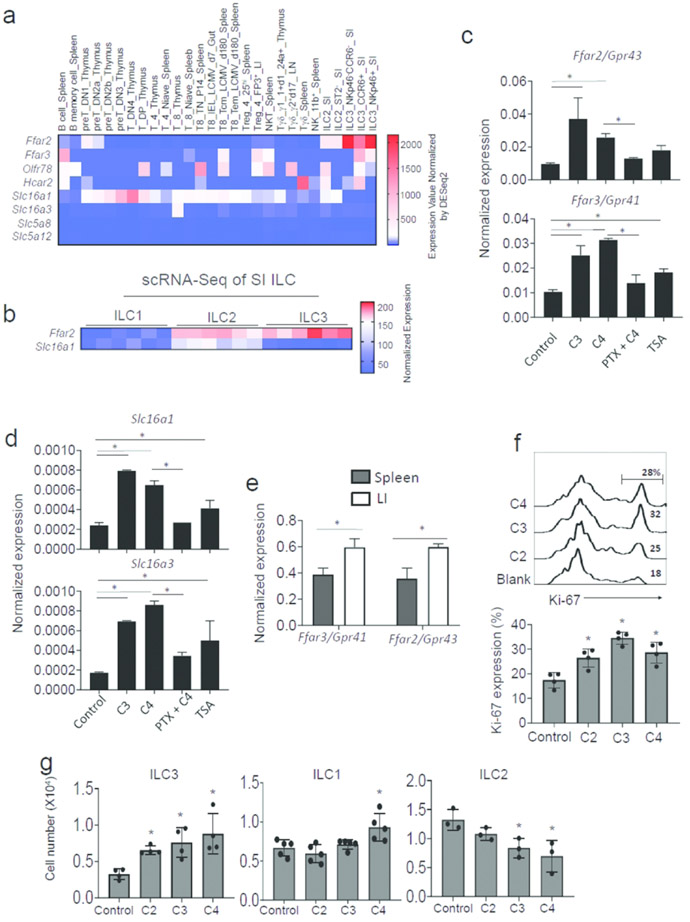
Because GPCRs, such Ffar2, Ffar3, Olfr78 and Gpr109a, mediate the functions of SCFAs in regulating cell functions 41, 42, 43, we examined the expression of these receptors in ILCs. RNA expression data retrieved from the publicly available Immgen microarray data (contributed by the Colona Lab at University of Washington) indicate that ILC3 subsets variably express the SCFA receptors (Fig.2a). The expression of Ffar2 was highest on ILC3 populations in the intestine. Most ILC3 subsets that express CCR6 or NKp46 expressed Ffar2. Single cell RNA-seq data retrieved from the data contributed by Gury-BenAri et al.15 also show that ILC2 and ILC1, isolated from the small intestine, expressed Ffar2 (Fig.2b). Moreover, mRNAs for solute transporters that transport SCFAs into cells, such as Slc16a1 and Slc16a3, were expressed at moderate to low levels in ILC subsets (Fig.2a,b). Among ILCs, ILC2 expressed Slc16a1 at the highest level (Fig.2b). It is feasible that certain tissue factors in the intestine may induce the expression of SCFA receptors on intestinal ILCs. We examined the possibility that SCFAs themselves induce the expression of Ffar2 and Ffar3. We found that C3 and C4 induce Ffar2 and Ffar3 at the mRNA level in vitro on flow cytometry-sorted spleen ILCs (Fig. 2c). This induction was largely blocked by pertussis toxin (PTX), which blocks the function of the heterotrimeric G proteins by inducing ADP-ribosylation of the Gαi subunit44. A class I/II HDAC inhibitor, Trichostatin A (TSA), has moderate positive effects but this did not reach statistically significant levels. Similar patterns of the induction and suppression of SCFA transporters in ILCs were observed (Fig. 2d). These results indicate that ILCs express SCFA receptors and transporters, which is boosted by SCFAs. In vivo, Ffar2 and Ffar3 were more highly expressed in intestinal than splenic ILCs at mRNA level (Fig.2e). Moreover, SCFAs increased Ki-67 expression and increased numbers of ILCs in culture (Fig.2f, S3a). However, no significant effect of SCFAs on ILC survival was observed (Fig.S3b). While all major SCFAs increased the proliferation of splenic ILC3 from Rag1−/− mice, only C4 had a small positive effect on the proliferation of splenic ILC1, and SCFAs, in general, had a negative effect on the expansion of lung ILC2 in vitro (Fig.2g). These results indicate that SCFAs have proliferative effects on ILCs in vitro, but this appears to be dependent on ILC subsets and/or culture conditions.
Figure 2. SCFAs positively promote the expression of G-protein-coupled SCFA receptors in ILCs and regulate ILC proliferation.
(a) Expression of SCFA receptors and SCFA transporters at mRNA level by ILCs vs. other lymphocytes. Data for NK, ILC2 and NKp46+/−CCR6+/− ILC3 subsets are shown. Microarray data available in the ImmGen database were plotted. (b) Expression of Ffar2 and Slc16a1 by Lin−CD127+RORgt−NKp46+ ILC1, Lin-CD127+RORgt−KLRG+ ILC2, and Lin−CD127+RORgt+ ILC3 of SI origin. The scRNA-seq data were retrieved from the data contributed by Gury-BenAri et al. 15. (c) Impact of SCFAs on the expression of Ffar2 and Ffar3 at mRNA level by ILCs. (d) Impact of SCFAs on the expression of Slc16a1 and Slc16a3 by ILCs. For panel c and d, Rag1−/− spleen Lin− CD90+ CD127+ cells were flow cytometry-sorted and cultured with IL-7, IL-23 and IL-1β for 3 days with or without PTX pretreatment. C2, C3, and TSA were added to culture on day 2. qRT-PCR was performed. (e) Comparison of spleen and intestinal ILCs for expression of Ffar2 and Ffar3. Lin− CD90+ CD127+ cells were flow cytometry-sorted, and mRNA expression for Ffar2 and Ffar3 genes was detected by qRT-PCR. (f) Effect of SCFAs on Ki-67 expression in ILCs cultured in the aforementioned ILC induction condition for 4 days. Sorted Lin−CD127+CD90+ cells from the spleen of Rag1−/− mice were cultured. (g) Effects of SCFAs on proliferation of ILC3, ILC1 and ILC2 in vitro. Spleen total ILCs (for ILC1 and ILC3) or lung mononuclear cells (for ILC2) from Rag1−/− mice were cultured in the presence of SCFAs (10 mM for C2, 0.5 mM for C3, and 0.01 mM for C4) in ILC1 (IL-7 and IL-15), ILC2 (IL-7 and IL-33) or ILC3 (IL-7, IL-23 and IL-1β) culture condition. Pooled data obtained from at least 2 different experiments (n=3-4) are shown. *Significant differences (p<0.05) between groups.
SCFAs boost cytokine signaling and mTOR pathways in ILCs
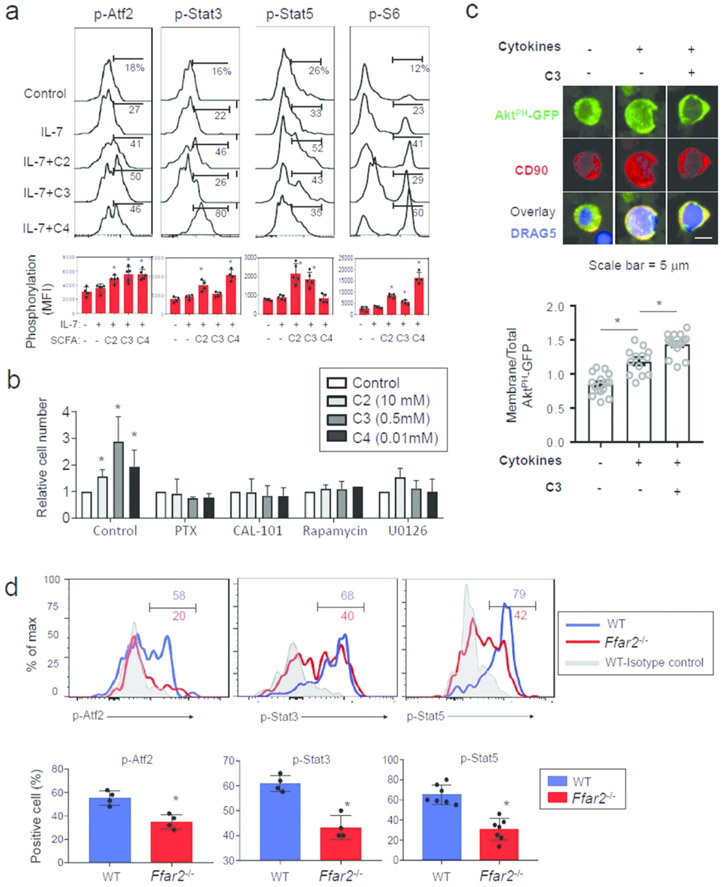
Activation of ribosomal S6 protein (rS6), Stat5, and Stat3 by ILC-activating cytokines plays important roles in supporting ILC proliferation and effector function, and the activation of Ffar2 and Ffar3 induces Atf2 phosphorylation 45, 46. SCFAs induced or enhanced phosphorylation of these molecules in cultured ILCs in collaboration with IL-7 (Fig.3a). We next, examined the roles of Gαi, PI3K, mTOR and MEK1/2 in the SCFA-mediated ILC proliferation utilizing small molecule inhibitors (Fig.3b). The inhibitors for Gαi, PI3K, mTOR and MEK1/2, while did not increase cell death, suppressed SCFA-induced ILC proliferation (Fig.3b, S3c). SCFAs boosted cytoplasmic membrane-associated (3,4,5)-trisphosphate (PIP3) /PI3K activity induced by cytokines (IL-7, IL-1β and IL-23), which was detected by an imaging assay utilizing a GFP-fused pleckstrin homology (PH) domain of AKT (Fig.3c). We observed that Atf2 phosphorylation, which is downstream of ERK1/2 activation following Ffar2 or Ffar3 triggering 46, was induced in WT but not Ffar1−/− intestinal ILC3 (Fig.3d). Similarly, the activation of Stat3 and Stat5 was diminished in intestinal ILC3 of Ffar2−/− mice compared to WT mice. Thus, Ffar2 signaling boosts cytokine signaling and mTOR activity, necessary to support ILC proliferation 47.
Figure 3. Direct effects of SCFAs on ILCs.
(a) Activation of signaling molecules (Arf2, Stat3, Stat5 and rS6) in ILCs. Rag1−/− colonic LP cells were cultured for 4h with IL-7 and SCFAs, and phosphorylation of indicated molecules in Lin− CD127+ CD90+ ILCs was assessed. (b) Effects of small molecule inhibitors of Gαi, PI3K, mTOR and MEK1/2 on SCFA-mediated ILC proliferation. Rag1−/− spleen cells were cultured in an ILC3 condition (IL-7, IL-23 and IL-1β) for 4 days with the inhibitors, and numbers of Lin− CD90+ CD127+ ILCs were determined by flow cytometry. (c) Detection of membrane PIP3 in ILCs by expressing GFP-PHAkt. CD90+ ILCs were enriched with magnetic sorting and were transfected with a plasmid expressing GFP-PHAkt and activated for 16h with cytokines (IL-7, IL-1β and IL-23) and TSA (20 nM) followed by paraformaldehyde fixation and staining with anti-CD90 and DRAQ5 for confocal microscopy. (d) Ffar2-dependent phosphorylation of Atf2, Stat3, and Stat5 in ILCs. LI LP ILC3, isolated from WT and Ffar2−/− mice, were stained for phosphorylation of the molecules. Pooled data obtained from at least 3 different experiments (n=4-6) are shown. *Significant differences (p<0.05) between groups.
Ffar2 enhances the tissue population capacity of ILC1, ILC2 and ILC3
The positive effect of SCFAs on ILC proliferation in a GPCR-dependent manner and Ffar2 expression by ILCs imply a potential role for Ffar2 in supporting ILC populations in vivo. To determine this possibility, we co-transferred CD45.1+ WT and CD45.2+ WT or Ffar2−/− ILCs at 1:1 ratio into ILC/T/B-deficient Rag2−/−IL2Rγ−/− mice (Fig.4a). After 4-5 weeks, the relative frequencies of CD45.1+ and CD45.2+ ILCs in various tissues were examined. As expected, there was no difference between WT and WT ILCs in populating various tissues (Fig.S4a,b). Ffar2−/− ILC3 were significantly less efficient in populating SI and LI compared to their WT counterparts (Fig.4b,c; S4c). Interestingly, Ffar2−/− ILC1 and ILC2 were also less efficient in populating the intestines compared to their WT counterparts. However, no significant difference between WT and Ffar2−/− ILCs in populating the spleen and MLN was observed (Fig.4d; S4c). Thus, Ffar2 supports the tissue population of ILC1, ILC2 and ILC3 in the intestines.
Figure 4. Ffar2 is required for effective population of ILCs in a lymphopenic condition.
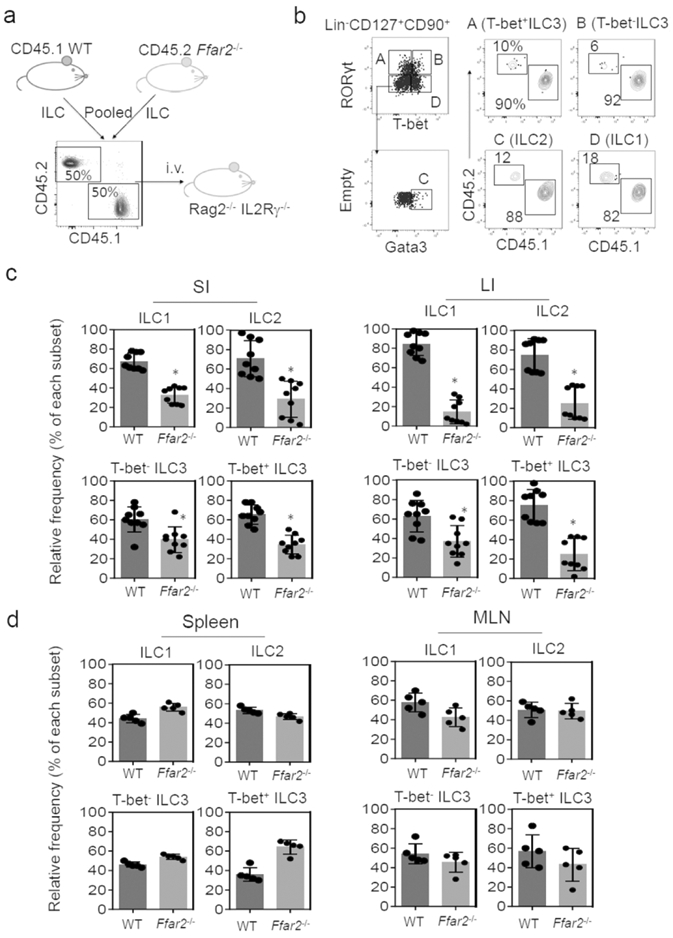
(a) CD45.1 WT and CD45.2 Lin−CD127+ cells, isolated from the spleen, were co-transferred into Rag2−/−IL2Rγ−/− mice. Mice were euthanized ~4 weeks later, and ILC subsets were examined. (b) Representative data showing relative frequencies of WT versus Ffar2−/− colon LP ILCs. (c) Relative frequency of WT versus Ffar2−/− ILCs in the intestines. (d) Relative frequency of WT versus Ffar2−/− ILCs in the secondary lymphoid tissues. Representative and pooled data obtained from two experiments are shown. *Significant differences (p<0.05, n=5-9) from WT.
Defective expansion of Ffar2−/− ILC populations during infection
We, next, examined the size of ILC tissue populations in WT versus Ffar2−/− mice in the steady state and during infection by C. rodentium. It has been previously determined that Ffar2−/− mice are less effective in mounting immune responses to C. rodentium 46. The ILC numbers in various tissues of WT and Ffar2−/− mice were not significantly different in the steady state (Fig. 5). However, C. rodentium infection expanded ILC1 and ILC3 populations in the SI of WT, but not Ffar2−/−, mice (Fig.5a, S5a). Also, Ffar2−/− mice were defective in ILC expansion in the colon (Fig.5b). C. rodentium primarily resides on the intestinal epithelial surface in immunocompetent mice but invades secondary lymphoid tissues in immunocompromised or Ffar2−/− mice 37, 46, 48. Interestingly, we observed a defect in ILC expansion also in the spleen and MLN of Ffar2−/− mice, which was not detected without infection (Fig.5c,d; S5b). To rule out the potential influence of strain or colony-specific microbial differences, we performed the same experiment on co-housed WT versus Ffar2−/− mice. Despite minor differences from non-cohoused experiments, cohoused WT and Ffar2−/− mice maintained overall strain-specific differences in susceptibility to C. rodentium as well as ILC populations (S6a-c). Overall, these results indicate that major ILC subsets are regulated by Ffar2 during C. rodentium infection.
Figure 5. Ffar2 is required for normal expansion of ILC1 and ILC3 in both the intestine and systemic tissues following enteric bacterial infection.
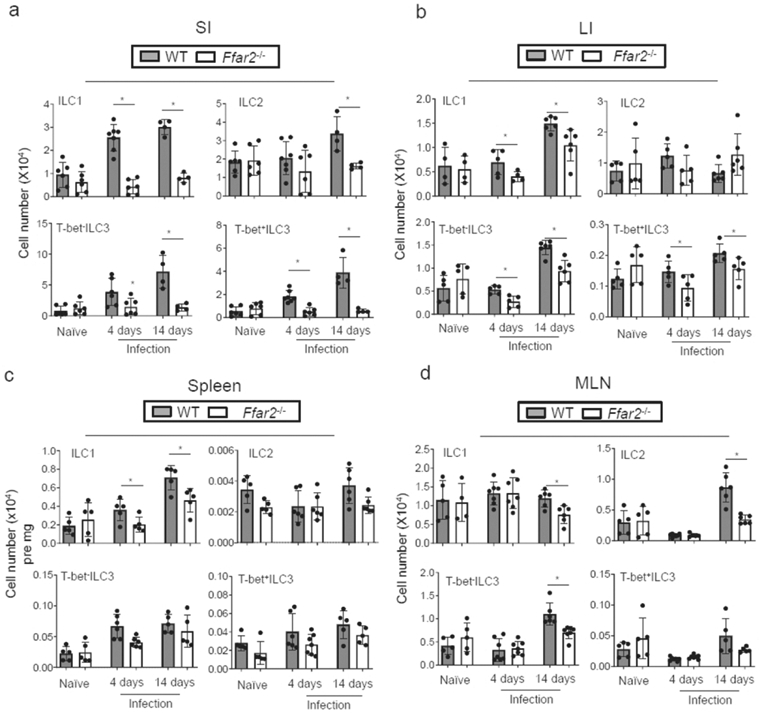
Numbers of ILCs in the intestines (a,b) and lymphoid tissues (c,d) of WT and Ffar2−/− mice in non-infected mice or at 4 and 14 days after infection with C. rodentium. Pooled data obtained from at least 3 different experiments (n=5-10) are shown. *Significant differences (p<0.05) from WT.
SCFAs fail to expand Ffar2−/− ILC populations
To determine the effect of SCFAs in vivo, we fed WT and Ffar2−/− mice with LFD (to create a low SCFA condition) with or without SCFA feeding in drinking water (to create low and high SCFA conditions). This method has been tested to be effective in regulating SCFA levels 29, 32. We infected these mice with C. rodentium, and ILC populations were assessed in various tissues. SCFA feeding increased the resistance of WT but not Ffar2−/− mice (S7a,b) as reported previously 29, 32. On LFD without SCFA feeding, there were small differences in numbers of ILC3 subsets between WT and Ffar2−/− mice mainly in the SI (Fig.6a). With SCFA feeding, however, there were greater differences in numbers of ILC1 (SI, LI, MLN, and spleen), ILC2 (spleen and MLN), and ILC3 (SI, LI, spleen and MLN) between WT and Ffar2−/− mice (Fig.6a-d, S7c).
Figure 6. SCFAs fail to expand Ffar2-deficient ILC1 and ILC3.
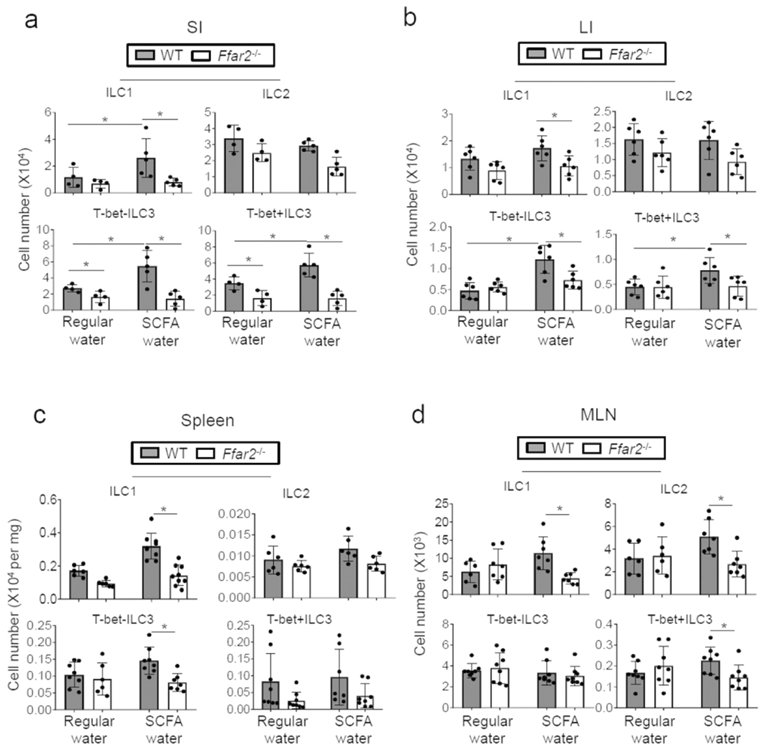
WT and Ffar2−/− mice were fed low-fiber diet (no soluble fiber, 10% cellulose) from the beginning and then on SCFAs (C2 at 70, C3 at 30, and C4 at 20 mM) in drinking water from the third week and then infected with C. rodentium 7 days later. At 14 days post infection, ILC numbers in indicated tissues were determined. Pooled (a-d) data obtained from 2 experiments are shown. *Significant differences (p<0.05, n=4-7) from WT.
We, further, assessed the function of Ffar2 in potentiating the ILC effector function during C. rodentium infection with a cell transfer approach (Fig.7a; S8). WT and Ffar2−/− spleen ILCs were separately transferred into Rag2−/−IL2Rγ−/− mice, and the host mice were infected by C. rodentium. Compared to the WT ILC-transferred mice, Ffar2−/− ILC-transferred mice were more susceptible to C. rodentium infection based on body weight change, pathogen burden, and neutrophil infiltration (Fig.7b). The numbers of donor-derived ILC3 in the intestines were significantly smaller in the mice transferred with Ffar2−/− ILCs (Fig.7c; S8). Also smaller were the numbers of intestinal ILC1 and ILC2.
Figure 7. ILC-expressed Ffar2 is necessary for normal intestinal ILC immunity.
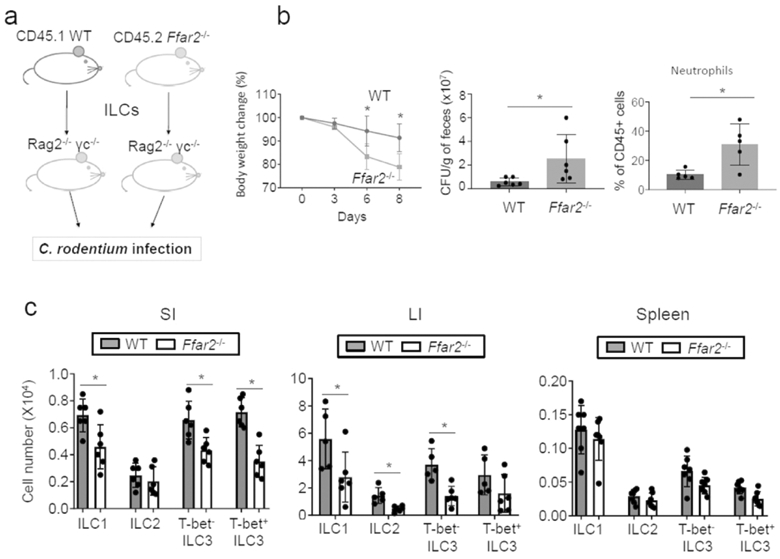
(a) WT and Ffar2−/− ILCs (~200,000 Lin− CD127+ cells per mouse), isolated from spleen, were separately transferred into Rag2−/−IL2Rγ−/− mice. Four weeks later, mice were infected with C. rodentium and the mice were sacrificed 8 days later. (b) Weight change, pathogen burden and neutrophil numbers among colonic LP cells. (c) Numbers of ILCs in the intestines and lymphoid tissues of WT and Ffar2−/− mice. Pooled data obtained from 2 experiments are shown. *Significant differences (p<0.05, n=6) from WT.
In addition to Ffar2, we examined the role of Ffar3/Gpr41 in regulating ILCs (Fig.8). As reported previously 46, Ffar2−/− mice were more susceptible to C. rodentium infection, based on weight loss and pathogen burden (Fig.8a-c), and had decreased numbers of most ILC subsets in SI, T-bet+ ILC3 in LI, and T-bet+ and T-bet− ILC3 in the spleen (Fig.8d, S9). However, the ILC deficiency in Ffar3−/− mice was less severe compared to that of Ffar2−/− mice.
Figure 8. ILC responses to enteric bacterial infection in Ffar3−/− mice.
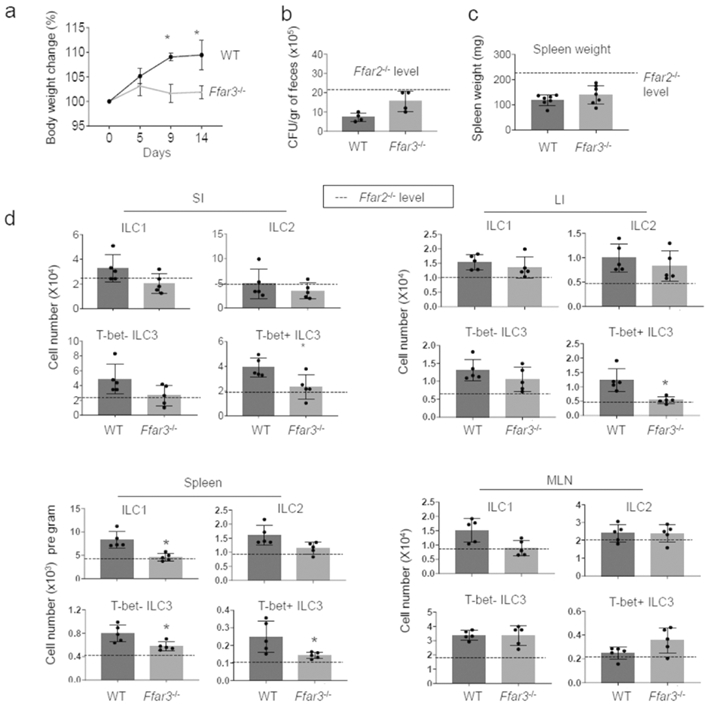
WT and Ffar3−/− mice were infected with C. rodentium and numbers of ILC subsets were determined. (a-c) Body weight change, pathogen burden, and spleen weight following the bacterial infection were examined. (d) Numbers of indicated ILCs in the intestine, spleen and MLN were examined by flow cytometry. Pooled data obtained from at least 3 different experiments (n=4-7) are shown. *Significant differences (p<0.05) from WT.
Differential roles of Ffar2 and SCFAs in regulating ILC2 response to IL-33
Regulation of ILC2 proliferation by SCFAs in vitro was different from other subsets. To better investigate the impact of Ffar2 versus SCFAs on ILC2 responses in vivo, we employed an IL-33 injection model (Fig.9a) 49. Repeated injection of IL-33 decreased ILC2P numbers in the bone marrow (BM) but increased ILC2 numbers in mucosal tissues (Fig.9b,c). The decrease of BM ILC2P following IL-33 administration is in line with the emigration of ILC2 from the bone marrow 50, which is apparently not affected by Ffar2 deficiency (Fig.9b, Sl0a). In contrast, Ffar2 deficiency decreased the peripheral expansion of the ILC2 population in the SI, LI, and lung (Fig.9c,d, S10b). However, no significant effect of Ffar2 deficiency on ILC2 in MLN and spleen was observed. We also performed a SCFA water-feeding experiment on WT and Ffar2 −/− mice with the IL-33 administration (Fig.9d, S10c). SCFA administration suppressed the IL-33-induced ILC2 response in not only WT, but also Ffar2−/− mice. These results establish a positive role of Ffar2, but also surprisingly a negative role of SCFAs, mediated through a Ffar2-independent mechanism, in regulating the ILC2 response.
Figure 9. ILC2 responses to IL-33 in Ffar2−/− mice with or without regulation of SCFA levels.
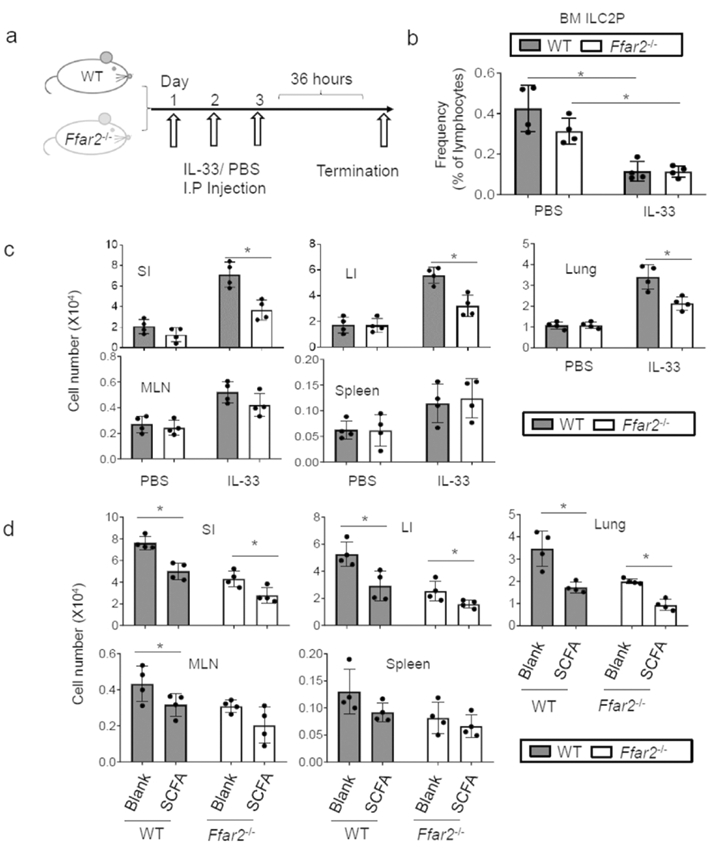
(a) WT and Ffar2−/− mice were injected i.p. with IL-33 (500 ng per injection) or PBS control for three consecutive days, and ILC numbers in indicated tissues were examined 36h later. (b) Frequency of ILC2P in the bone marrow (BM). (c) Combined data showing ILC numbers in indicated tissues. (d) Impact of SCFAs on the ILC2 response to IL-33 in WT versus Ffar2−/− mice. For panel e, mice were fed LFD for 2 weeks and then fed SCFA water for 1 week prior to IL-33 injection (3 times). The data were obtained from 2 independent experiments using total 4 mice each group. *Significant differences (p<0.05) from WT.
Discussion
We investigated the roles of SCFAs and their receptors in regulating peripheral ILCs. We found that the DF microbial metabolites both induce and activate SCFA-sensing GPCRs, such as Ffar2 and Ffar3 on ILCs. Activation of these GPCRs generally signals the expansion of the peripheral ILC populations for effective effector functions. This process is important for optimal activity of peripheral ILCs, particularly ILC3, in the intestine and possibly other organs during active immune responses. We also provide evidence that the functions of SCFAs and Ffar2 can be different from each other in regulating ILC2.
SCFAs can regulate immune cell functions in several different ways. SCFAs activate GPCRs such as Ffar2, Ffar3, Gpr109a and Olfr78 41, 43, 51. SCFAs inhibit HDACs, which regulate protein acetylation and gene expression 32, 52. SCFAs are metabolized in cells to produce acetyl-CoA and ATP 29, 53. The regulatory effects of SCFAs on ILCs are likely to be mediated by combinations of these pathways. We observed that ILC3 numbers in mice were increased when animals were fed soluble DF (pectin and inulin). These DF-containing diets produce different levels of SCFAs in the colon 29, 32. SCFAs are also produced in the small intestine at relatively lower but significant concentrations 54. This explains the regulation of SI ILCs by SCFA feeding or Ffar2 signaling. SCFAs are absorbed and transported to the blood circulation at ~400 and 80 μM in portal and peripheral veins respectively in humans 28, 29. It remains unknown if the systemic levels of SCFAs can effectively regulate ILCs. All major SCFAs, such as C2, C3 and C4, can promote ILC3 proliferation. However, SCFAs suppress ILC2 proliferation. For ILC1, only C4 was able to increase ILC1 production. Thus, SCFAs variably regulate the proliferation of ILC subsets. It is also considered that SCFA levels may be altered during infection.
ILCs variably express SCFA receptors at the mRNA level. Of these, the most highly expressed is Ffar2, which is more highly expressed in intestinal ILCs compared to spleen ILCs. This indicates that certain gut tissue factors induce the SCFA receptors on ILCs. We found that SCFAs, themselves, can induce the expression of Ffar2 and Ffar3. This raises a question about the mechanism of the induction. Because the induction of SCFA receptors by SCFAs was largely suppressed by PTX, it appears that Ffar2 triggering by SCFAs, with potential assistance from other stimulation, induces the expression of SCFA receptors. Intestinal ILC3 and ILC2 expressed Ffar2 at levels higher than that of ILC1, which is in line with the relatively small effect of SCFAs on ILC1 proliferation.
Ffar2 triggering activates the function of heterotrimeric G proteins, composed of Gαi and Gβγ subunits. Gβγ protein triggers the downstream signaling pathways, including PLCβ and PI3K 55, 56. Importantly, the function of SCFAs in expanding ILC numbers was inhibited by PTX. This indicates that GPCR signaling is a major signal that drives the induction of SCFA receptors and activation of ILCs. In line with this, SCFAs can increase the activation of key signaling molecules such as ERK/Atf2, Stat3, Stat5, and mTOR. Activation of Stat3 and Stat5 occurs downstream of general and ILC subset-specific activating cytokines 57. Co-stimulation of the cytokine signaling pathways appears to be a major mechanism for the positive function of Ffar2. Moreover, enhanced activity of mTOR along with the aforementioned signaling pathways by GPCR signaling can support the metabolic activity required for ILC proliferation and population expansion 47.
Our results, together with the recent findings of others 37, 38, 58, indicate that SCFAs regulate most ILC subsets, which is apparently mediated by multiple mechanisms. We provided evidence that Ffar2 affects all major ILC subsets. The numbers of intestinal ILC1, ILC2 and ILC3 in Ffar2−/− mice in the steady state were not significantly different from those of WT mice. However, upon C. rodentium infection, there was a clear defect in ILC expansion in Ffar2−/− mice. This is somewhat different from Chun et al38 in that the defect in the colonic ILC3 compartment in Ffar2−/− mice was detectable even at steady state without infection. They also found that SCFAs and GPR43 agonism increased the numbers of ILC3 in the colon in the steady state. Potential microbial differences across animal facilities may be a reason for the heterogenous sensitivity of ILC3 to Ffar2 signaling at steady state. The positive effect of Ffar2 on ILC3, observed in our study, is in line with their report on the positive role of Ffar2 in proliferation of CCR6+ ILC3. Another group reported that IL-22 secretion by ILC3 is promoted by acetate potentially via up-regulation of the expression of IL-1β receptor in a C. difficile infection model59. Our results additionally indicate that GPR43 can also support ILC2 expansion in the colon in response to cytokine stimulation 38. Our competitive population data for WT versus Ffar2−/− ILCs in ILC/T/B-deficient Rag2−/−IL2rγ−/− mice indicate that steady state numbers of intestinal ILCs are also regulated by Ffar2. ILC expansion in a lymphopenic condition is driven by IL-7 60 and, therefore, Ffar2 appears to promote the IL-7-mediated ILC expansion.
Ffar3 also has a positive effect on ILC populations in the intestines and other tissues, but the effect of Ffar3 appears to be considerably weaker than that of Ffar2. This is explained, in part, by the relatively low expression of Ffar3 by ILCs.
The in vivo effects of DFs and SCFAs during C. rodentium infection largely mirror that of Ffar2 in regulating the ILC3 subsets in the intestine. However, the effects of SCFAs and GPCR triggering on ILCs are not the same. Ffar2 positively regulates the size of most ILC populations in both the intestine and lymphoid tissues, whereas DFs and SCFAs primarily affect intestinal ILC3. SCFAs also increase intestinal ILC1 numbers. While ILC2 expansion in response to IL-33 was boosted by Ffar2 signaling, it was suppressed by SCFAs. Indeed, these results are in line with the recent report that SCFAs suppress an ILC2 response in airway inflammation 37, 61. The HDAC inhibition activity of SCFAs, which is independent of the GPCR signaling, has been proposed to mediate the suppression of ILC2 61. Among ILC subsets, the ILC2 subset had highest expression of Slc16a1, which transports SCFAs into cells. This suggests that ILC2 may absorb SCFAs more effectively, leading to heightened intracellular functions of SCFAs, such as HDAC inhibition. In terms of the negative role of SCFAs, it has been documented that SCFAs can suppress ILC3 in Peyer’s patches 36. We reason that the differential regulation of ILCs in different tissues by SCFAs is likely due to 1) Differential roles of GPCRs versus other mechanisms such as HDAC inhibition in regulating ILC proliferation; 2) Differential GPCR expression among ILC subsets; 3) Distinct responses of ILCs depending on their maturation status or tissue environment. These issues should be studied in depth in the future.
Another potentially important regulation of ILCs by SCFAs and their receptors may be mediated indirectly through other cell types. Indeed, antigen presenting cells and tissue cells can be regulated by SCFAs and this can, in turn, regulate other immune cells 34, 46, 62, 63. This is supported, in part, by the ILC regulation by SCFAs in Ffar2 or Ffar3-deficient mice. Moreover, microbial changes occur during infection, including C. rodentium infection 64, and this has the potential to change ILC responses via SCFA-dependent and independent pathways. However, it appears that C. rodentium infection does not alter SCFA levels 65.
The defect of ILCs in the small intestine of Ffar2−/− mice is interesting. As mentioned, there are still significant levels of luminal SCFAs in the small intestine54 to regulate ILCs, particularly in the ileum. Other microbial metabolites/products may antagonize or modulate the effect of SCFAs. These include retinoic acid, bile acid metabolites, tryptophan metabolites, amino acids, and pattern recognition receptor (PRR) ligands, which all have the potential to modulate the SCFA-GPCR signalling effects on ILCs. Differential presence of these factors in different segments of the intestine can contribute to the heterogeneous effects of SCFAs and their receptors on ILCs in the small versus large intestine.
In conclusion, our findings establish an important role of SCFAs in regulating the ILC responses (Fig.S11). This regulation is mediated by the functions of SCFAs in inducing the expression and triggering of SCFA-sensing GPCRs on ILCs, but other direct and indirect mechanisms may also play significant roles. This function is particularly important for ILC3, but other subsets such as ILC1 and ILC2 are also regulated depending on tissue sites and host conditions in a subset-dependent manner.
Materials and Methods
Animals, diets and infection
Animal protocols were approved by the Animal Care and Use Committee at University of Michigan. C57BL/6, CD45.1, Rag1−/−, and Rag2−/−IL2Rg−/− mice were originally from the Jackson Laboratory and housed at University of Michigan. Ffar2−/− and Ffar3−/− mice on the C57BL/6 background were described previously 46. All mice were housed in a specific pathogen-free condition. When indicated, mice were fed on AIN 93-based diet containing low or high content soluble dietary fibers (LFD for 0% pectin and inulin; HFD for 7.5% of pectin and 7.5% inulin) 29. When indicated, mice were fed SCFAs in drinking water (Sodium Acetate/C2 at 70 mM, Sodium Propionate/C3 at 30 mM, and Sodium Butyrate/C4 at 20 mM, pH 7.4, Sigma-Aldrich). For the co-housed mouse experiment, WT and Ffar2−/− mice were co-housed from 2 weeks before infection and until termination. When indicated, mice were infected with C. rodentium (DBS100, ~1010 CFU/mouse) via oral gavage and monitored for weight change, stool consistency, and C. rodentium load as previously described 46.
IL-33–induced in vivo response of ILC2
For IL-33–induced inflammation 49, carrier-free recombinant mouse IL-33 (500 ng/mouse; BioLegend), or PBS was injected i.p into mice on days 1, 2, and 3. Mice were sacrificed and tissues were collected 36 h later.
Cell isolation and culture
Preparation of bone marrow cells, spleen and intestinal cells for flow cytometry or cell isolation were previous described 66. Total ILCs were sorted from the spleen of Rag1−/−, WT and Ffar2−/− mice by a BD Melody sorter (BD Biosciences) or sequential magnetic sorting (Lineage depletion and positive selection of CD127+ cells). For in vitro culture, Rag1−/− spleen or lung mononuclear cells or sorted Lin−CD127+ cells were cultured in complete RPMI-1640 medium supplemented with 10% FBS. For isolation of lung mononuclear cells, lung tissues from Rag1−/− mice were digested with 0.5 mg/mL collagenase IV and isolated by density-cut in 40/80% Percoll gradient. For ILC culture, IL-7 and IL-15 for ILC1; IL-7 and IL-33 for ILC2; IL-7, IL-1β and IL-23 for ILC3 were used at 20 ng/ml. When indicated, SCFAs at 10 (C2), 0.5 (C3), or 0.01 (C4) mM were added to culture. TSA was added at 20 nM when indicated. For pertussis toxin (PTX) treatment, cells were pre-incubated with PTX (0.5 μg/ml) for 30 min and were further cultured with SCFAs and cytokines. Inhibitors used for the cultures were U0126 (1 μM), rapamycin (25 nM), and CAL 101 (200 nM) from Cayman Chemical.
Flow cytometry
For ILC detection by flow cytometry, cells were stained with various antibodies to antigens. Lineage cocktail antibodies include CD3ε/145-2C11, CD5/53-7.3, CD8α/53-6.7, CD19/6D5, B220/RA3-6B2, CD11b/M1/70, CD11c/N418, Ter119/Ter-119, F4/80/BM8, Gr-1/RB6-8C5, TCRβ/H57-597, TCRγδ/GL3, CD49b/DX5, FcεR1α/MAR-1, NK1.1/PK136, and CD25/3C7. Antibodies to CD45.2/104. CD45.1/A20, CD90.2/53-2.1, CD127/A7R34, Sca-1/D7, KLRG-1/2F1, α4β7/DATK32, Flt3/A2F10, c-kit/2B8, and/or NKp46/29A1.4 were used to differentiate ILC subsets and their donor origin. The cells were fixed and further stained with antibodies for intracellular antigens (T-bet/eBio-4B10, GATA-3/TWAJ, and RORγt/AFKJS-9). Most of the antibodies were from BioLegend or eBioscience unless indicated otherwise. ILC1 was identified by CD45+Lin−CD127+CD90+RORγt−Tbet+ phenotype. ILC2 was identified by CD45+Lin− CD127+CD90+RORγt-Tbet−GATA3+. ILC3 was identified as CD45+Lin−CD127+CD90+RORγt+Tbet+− cells. A 12-color NovoCyte Flow Cytometer (ACEA Biosciences) was used, and the data were analyzed by FlowJo (BD Biosciences).
For phosphorylation of Aft2 and Stat3/5, primary or cultured cells were fixed with 4% formaldehyde and permeabilized with ice-cold graded methanol (100→90%) at −20°C overnight. Cells were stained with Rabbit mAb to phospho-ATF-2 (ATF2T71-G3), phospho-Stat3 (Tyr705) (4/P-STAT3), and phospho-Stat5 (Tyr694) (C11C5) (Cell Signaling Technology), and then further stained with PE-labeled anti-rabbit IgG antibody (BioLegend). For phosphorylation of rS6 (pS235/236), cells were fixed and permeabilized by BD Phosflow™ Lyse/Fix Buffer/Permeabilization Kits (BD Biosciences) according to the manufacturer’s instruction. Cells were washed and stained with Alexa Fluor® 647 anti-mouse-S6 (D57.2.2E). Nuclear Ki-67 was stained with an antibody (16A8, BioLegend) after surface antigen staining for ILCs and then fixation in cold ethanol (70%). For intracellular staining of cytokines, such as IL-5, IL-9, IL-17, and IFN-γ, cells were activated with phorbol myristate acetate (PMA) and ionomycin or IL-23 in the presence of monensin for 4h and the cells were fixed in 1% paraformaldehyde and permeabilized with saponin buffer followed by staining with antibodies to the cytokines (BioLegend). For cell survival or gating for live cells, cells were stained with Ghost dye Violet 450 (Tonbo Biosciences) together with antibodies to surface antigens.
ILC transfer into Rag2−/− IL2Rg−/− mice
Spleen Lin− cells were isolated from the spleen of CD45.1+WT, CD45.2+WT or CD45.2+ Ffar2−/− mice by magnetic depletion using antibodies to CD19, CD3, CD11b, Gr-1, and CD11c (Miltenyi Biotec) and further sorted by a BD Melody sorter to isolate Lin−CD127+CD90+ ILCs. These cells were injected separately or co-injected at 1:1 ratio i.v. into Rag2−/−IL2rg−/− mice (~0.1 million cells per mouse). The co-transferred mice were sacrificed 3-4 weeks later and ILC1/2/3 subsets in various organs were examined. The Rag2−/−IL2rγ−/− mice, separately transferred with WT or Ffar2−/− ILCs and rested for 3-4 weeks, were infected with C. rodentium and sacrificed 8 days later.
RNA expression
Total RNA from indicated cells were isolated using the RNeasy micro Kit (Qiagen) and reverse-transcribed with Sensiscript RT Kit (Qiagen). Gene expression was analyzed by qRT-PCR with SYBR™ Green PCR Master Mix (ThermoFisher). Oligonucleotide primers used were β-actin-F (AGAAGAGCTACGAGCTGCCTGAC) and β-actin-R (TACTCCTGCTTGCTGATCCACAT); Slc16a3-F (GAGGTGCTCATGGCTATC) and Slc16a3-R (GCTCCACCTCCCTCGAG); Slc16a1-F (GGATTTGCCTTTGGTTGGCTC) and Slc16a1-R (GACATCGGTGCTGGCCTCG). Primers for other genes were described previously 46. The data were normalized by β-actin or Glyceraldehyde 3-phosphate dehydrogenase (GAPDH) levels. Publicly available microarray (ImmGen) and RNA-seq data (GEO GSE85154)15 for ILCs were analyzed for indicated genes.
Confocal microscopy of PI3K activation
Membrane PIP3, an enzymatic product of PI3K, was detected by GFP-PHAkt expression. CD90+ cells, enriched with magnetic sorting (anti-CD90-PE and anti-PE beads from Miltenyi Biotec) from Rag1−/− spleen cells, were transfected with a plasmid expressing GFP-PHAkt with a Nucleofector (AMAXA). The transfected cells were cultured for 16h with cytokines (IL-7, IL-1β and IL-23) and TSA (20 nM) first, and then further stimulated with C3 (0.5 mM) for 1 h followed by paraformaldehyde fixation and staining with anti-CD90-PE and DRAQ5 (DNA/nucleus). The cells were spun onto Cell-Tak coated slides, mounted and imaged on the Nikon confocal microscope with the 60× oil objective. ImageJ software was used to quantify total cellular versus membrane GFP signals.
Statistical analysis
Student’s t-test (paired 2-tailed unless indicated otherwise) was used to determine the significance of differences between two groups for most data. For analysis of 3 or more groups, one-way ANOVA was performed. p values < or = 0.05 were considered significant. Error bars are standard error of the mean (SEM) in all Figures.
Supplementary Material
Acknowledgements:
The authors thank Y. Lee and B. Rana for general assistance. This study was supported, in part, from grants from NIH (R01AI121302, R01AI074745, and 1R01AI080769) and Kenneth and Judy Betz Professorship to CHK.
Footnotes
Disclosure: The authors declare no conflict of interest.
References
- 1.Vivier E et al. Innate Lymphoid Cells: 10 Years On. Cell 174, 1054–1066 (2018). [DOI] [PubMed] [Google Scholar]
- 2.Klose CS et al. A T-bet gradient controls the fate and function of CCR6-RORgammat+ innate lymphoid cells. Nature 494, 261–265 (2013). [DOI] [PubMed] [Google Scholar]
- 3.Satoh-Takayama N et al. Microbial flora drives interleukin 22 production in intestinal NKp46+ cells that provide innate mucosal immune defense. Immunity 29, 958–970 (2008). [DOI] [PubMed] [Google Scholar]
- 4.Bando JK et al. ILC2s are the predominant source of intestinal ILC-derived IL-10. The Journal of experimental medicine 217 (2020). [DOI] [PMC free article] [PubMed] [Google Scholar]
- 5.Wang S et al. Regulatory Innate Lymphoid Cells Control Innate Intestinal Inflammation. Cell 171, 201–216 e218 (2017). [DOI] [PubMed] [Google Scholar]
- 6.Seehus CR et al. Alternative activation generates IL-10 producing type 2 innate lymphoid cells. Nature communications 8, 1900 (2017). [DOI] [PMC free article] [PubMed] [Google Scholar]
- 7.Colonna M Innate Lymphoid Cells: Diversity, Plasticity, and Unique Functions in Immunity. Immunity 48, 1104–1117 (2018). [DOI] [PMC free article] [PubMed] [Google Scholar]
- 8.Eberl G Development and evolution of RORgammat+ cells in a microbe's world. Immunol Rev 245, 177–188 (2012). [DOI] [PubMed] [Google Scholar]
- 9.Britanova L & Diefenbach A Interplay of innate lymphoid cells and the microbiota. Immunol Rev 279, 36–51 (2017). [DOI] [PubMed] [Google Scholar]
- 10.Cherrier DE, Serafini N & Di Santo JP Innate Lymphoid Cell Development: A T Cell Perspective. Immunity 48, 1091–1103 (2018). [DOI] [PubMed] [Google Scholar]
- 11.Kotas ME & Locksley RM Why Innate Lymphoid Cells? Immunity 48, 1081–1090 (2018). [DOI] [PMC free article] [PubMed] [Google Scholar]
- 12.Sonnenberg GF et al. Innate lymphoid cells promote anatomical containment of lymphoid-resident commensal bacteria. Science 336, 1321–1325 (2012). [DOI] [PMC free article] [PubMed] [Google Scholar]
- 13.Kobayashi T et al. Homeostatic Control of Sebaceous Glands by Innate Lymphoid Cells Regulates Commensal Bacteria Equilibrium. Cell 176, 982–997 e916 (2019). [DOI] [PMC free article] [PubMed] [Google Scholar]
- 14.Ganal SC et al. Priming of natural killer cells by nonmucosal mononuclear phagocytes requires instructive signals from commensal microbiota. Immunity 37, 171–186 (2012). [DOI] [PubMed] [Google Scholar]
- 15.Gury-BenAri M et al. The Spectrum and Regulatory Landscape of Intestinal Innate Lymphoid Cells Are Shaped by the Microbiome. Cell 166, 1231–1246 e1213 (2016). [DOI] [PubMed] [Google Scholar]
- 16.Mortha A et al. Microbiota-dependent crosstalk between macrophages and ILC3 promotes intestinal homeostasis. Science 343, 1249288 (2014). [DOI] [PMC free article] [PubMed] [Google Scholar]
- 17.Mosconi I et al. Intestinal bacteria induce TSLP to promote mutualistic T-cell responses. Mucosal Immunol 6, 1157–1167 (2013). [DOI] [PubMed] [Google Scholar]
- 18.Duerr CU et al. Type I interferon restricts type 2 immunopathology through the regulation of group 2 innate lymphoid cells. Nat Immunol 17, 65–75 (2016). [DOI] [PMC free article] [PubMed] [Google Scholar]
- 19.Atarashi K et al. Th17 Cell Induction by Adhesion of Microbes to Intestinal Epithelial Cells. Cell 163, 367–380 (2015). [DOI] [PMC free article] [PubMed] [Google Scholar]
- 20.Sano T et al. An IL-23R/IL-22 Circuit Regulates Epithelial Serum Amyloid A to Promote Local Effector Th17 Responses. Cell 163, 381–393 (2015). [DOI] [PMC free article] [PubMed] [Google Scholar]
- 21.Qiu J et al. The aryl hydrocarbon receptor regulates gut immunity through modulation of innate lymphoid cells. Immunity 36, 92–104 (2012). [DOI] [PMC free article] [PubMed] [Google Scholar]
- 22.Kiss EA et al. Natural aryl hydrocarbon receptor ligands control organogenesis of intestinal lymphoid follicles. Science 334, 1561–1565 (2011). [DOI] [PubMed] [Google Scholar]
- 23.Zelante T et al. Tryptophan catabolites from microbiota engage aryl hydrocarbon receptor and balance mucosal reactivity via interleukin-22. Immunity 39, 372–385 (2013). [DOI] [PubMed] [Google Scholar]
- 24.Lee JS et al. AHR drives the development of gut ILC22 cells and postnatal lymphoid tissues via pathways dependent on and independent of Notch. Nat Immunol 13, 144–151 (2011). [DOI] [PMC free article] [PubMed] [Google Scholar]
- 25.Koh A, De Vadder F, Kovatcheva-Datchary P & Backhed F From Dietary Fiber to Host Physiology: Short-Chain Fatty Acids as Key Bacterial Metabolites. Cell 165, 1332–1345 (2016). [DOI] [PubMed] [Google Scholar]
- 26.Kim CH Immune regulation by microbiome metabolites. Immunology 154, 220–229 (2018). [DOI] [PMC free article] [PubMed] [Google Scholar]
- 27.Kumar V, Sinha AK, Makkar HP, de Boeck G & Becker K Dietary roles of non-starch polysaccharides in human nutrition: a review. Crit Rev Food Sci Nutr 52, 899–935 (2012). [DOI] [PubMed] [Google Scholar]
- 28.Cummings JH, Pomare EW, Branch WJ, Naylor CP & Macfarlane GT Short chain fatty acids in human large intestine, portal, hepatic and venous blood. Gut 28, 1221–1227 (1987). [DOI] [PMC free article] [PubMed] [Google Scholar]
- 29.Kim M, Qie Y, Park J & Kim CH Gut Microbial Metabolites Fuel Host Antibody Responses. Cell host & microbe 20, 202–214 (2016). [DOI] [PMC free article] [PubMed] [Google Scholar]
- 30.Furusawa Y et al. Commensal microbe-derived butyrate induces the differentiation of colonic regulatory T cells. Nature (2013). [DOI] [PubMed] [Google Scholar]
- 31.Smith PM et al. The microbial metabolites, short-chain fatty acids, regulate colonic Treg cell homeostasis. Science 341, 569–573 (2013). [DOI] [PMC free article] [PubMed] [Google Scholar]
- 32.Park J et al. Short-chain fatty acids induce both effector and regulatory T cells by suppression of histone deacetylases and regulation of the mTOR–S6K pathway. Mucosal immunology 8, 80–93 (2015). [DOI] [PMC free article] [PubMed] [Google Scholar]
- 33.Arpaia N et al. Metabolites produced by commensal bacteria promote peripheral regulatory T-cell generation. Nature 504, 451–455 (2013). [DOI] [PMC free article] [PubMed] [Google Scholar]
- 34.Trompette A et al. Dietary Fiber Confers Protection against Flu by Shaping Ly6c(−) Patrolling Monocyte Hematopoiesis and CD8(+) T Cell Metabolism. Immunity 48, 992–1005 e1008 (2018). [DOI] [PubMed] [Google Scholar]
- 35.Balmer ML et al. Memory CD8(+) T Cells Require Increased Concentrations of Acetate Induced by Stress for Optimal Function. Immunity 44, 1312–1324 (2016). [DOI] [PubMed] [Google Scholar]
- 36.Kim SH, Cho BH, Kiyono H & Jang YS Microbiota-derived butyrate suppresses group 3 innate lymphoid cells in terminal ileal Peyer's patches. Sci Rep 7, 3980 (2017). [DOI] [PMC free article] [PubMed] [Google Scholar]
- 37.Lewis G et al. Dietary Fiber-Induced Microbial Short Chain Fatty Acids Suppress ILC2-Dependent Airway Inflammation. Front Immunol 10, 2051 (2019). [DOI] [PMC free article] [PubMed] [Google Scholar]
- 38.Chun E et al. Metabolite-Sensing Receptor Ffar2 Regulates Colonic Group 3 Innate Lymphoid Cells and Gut Immunity. Immunity (2019). [DOI] [PMC free article] [PubMed] [Google Scholar]
- 39.Ruppin H, Bar-Meir S, Soergel K, Wood C & Schmitt M Jr Absorption of short-chain fatty acids by the colon. Gastroenterology 78, 1500–1507 (1980). [PubMed] [Google Scholar]
- 40.Macfarlane S & Macfarlane GT Regulation of short-chain fatty acid production. The Proceedings of the Nutrition Society 62, 67–72 (2003). [DOI] [PubMed] [Google Scholar]
- 41.Le Poul E et al. Functional characterization of human receptors for short chain fatty acids and their role in polymorphonuclear cell activation. The Journal of biological chemistry 278, 25481–25489 (2003). [DOI] [PubMed] [Google Scholar]
- 42.Pluznick J A novel SCFA receptor, the microbiota, and blood pressure regulation. Gut microbes 5, 202–207 (2014). [DOI] [PMC free article] [PubMed] [Google Scholar]
- 43.Thangaraju M et al. GPR109A is a G-protein-coupled receptor for the bacterial fermentation product butyrate and functions as a tumor suppressor in colon. Cancer research 69, 2826–2832 (2009). [DOI] [PMC free article] [PubMed] [Google Scholar]
- 44.Hoshino S et al. Identification of sites for alkylation by N-ethylmaleimide and pertussis toxin-catalyzed ADP-ribosylation on GTP-binding proteins. FEBS letters 276, 227–231 (1990). [DOI] [PubMed] [Google Scholar]
- 45.Stabile H et al. JAK/STAT signaling in regulation of innate lymphoid cells: The gods before the guardians. Immunol Rev 286, 148–159 (2018). [DOI] [PMC free article] [PubMed] [Google Scholar]
- 46.Kim MH, Kang SG, Park JH, Yanagisawa M & Kim CH Short-chain fatty acids activate GPR41 and GPR43 on intestinal epithelial cells to promote inflammatory responses in mice. Gastroenterology 145, 396–406 e391-310 (2013). [DOI] [PubMed] [Google Scholar]
- 47.Di Luccia B, Gilfillan S, Cella M, Colonna M & Huang SC ILC3s integrate glycolysis and mitochondrial production of reactive oxygen species to fulfill activation demands. The Journal of experimental medicine 216, 2231–2241 (2019). [DOI] [PMC free article] [PubMed] [Google Scholar]
- 48.Collins JW et al. Citrobacter rodentium: infection, inflammation and the microbiota. Nature reviews. Microbiology 12, 612–623 (2014). [DOI] [PubMed] [Google Scholar]
- 49.Neill DR et al. Nuocytes represent a new innate effector leukocyte that mediates type-2 immunity. Nature 464, 1367–1370 (2010). [DOI] [PMC free article] [PubMed] [Google Scholar]
- 50.Stier MT et al. IL-33 promotes the egress of group 2 innate lymphoid cells from the bone marrow. The Journal of experimental medicine 215, 263–281 (2018). [DOI] [PMC free article] [PubMed] [Google Scholar]
- 51.Pluznick JL et al. Olfactory receptor responding to gut microbiota-derived signals plays a role in renin secretion and blood pressure regulation. Proceedings of the National Academy of Sciences of the United States of America 110, 4410–4415 (2013). [DOI] [PMC free article] [PubMed] [Google Scholar]
- 52.Johnstone RW Histone-deacetylase inhibitors: novel drugs for the treatment of cancer. Nat Rev Drug Discov 1, 287–299 (2002). [DOI] [PubMed] [Google Scholar]
- 53.Schonfeld P & Wojtczak L Short- and medium-chain fatty acids in energy metabolism: the cellular perspective. Journal of lipid research 57, 943–954 (2016). [DOI] [PMC free article] [PubMed] [Google Scholar]
- 54.Cummings J, Pomare E, Branch W, Naylor C & Macfarlane G Short chain fatty acids in human large intestine, portal, hepatic and venous blood. Gut 28, 1221–1227 (1987). [DOI] [PMC free article] [PubMed] [Google Scholar]
- 55.Li Z et al. Roles of PLC-beta2 and -beta3 and PI3Kgamma in chemoattractant-mediated signal transduction. Science 287, 1046–1049 (2000). [DOI] [PubMed] [Google Scholar]
- 56.Hirsch E et al. Central role for G protein-coupled phosphoinositide 3-kinase gamma in inflammation. Science 287, 1049–1053 (2000). [DOI] [PubMed] [Google Scholar]
- 57.Lin JX et al. The role of shared receptor motifs and common Stat proteins in the generation of cytokine pleiotropy and redundancy by IL-2, IL-4, IL-7, IL-13, and IL-15. Immunity 2, 331–339 (1995). [DOI] [PubMed] [Google Scholar]
- 58.Theiler A et al. Butyrate ameliorates allergic airway inflammation by limiting eosinophil trafficking and survival. J Allergy Clin Immunol 144, 764–776 (2019). [DOI] [PubMed] [Google Scholar]
- 59.Fachi JL et al. Acetate coordinates neutrophil and ILC3 responses against C. difficile through FFAR2. The Journal of experimental medicine 217 (2020). [DOI] [PMC free article] [PubMed] [Google Scholar]
- 60.Martin CE et al. Interleukin-7 Availability Is Maintained by a Hematopoietic Cytokine Sink Comprising Innate Lymphoid Cells and T Cells. Immunity 47, 171–182 e174 (2017). [DOI] [PubMed] [Google Scholar]
- 61.Thio CL, Chi PY, Lai AC & Chang YJ Regulation of type 2 innate lymphoid cell-dependent airway hyperreactivity by butyrate. J Allergy Clin Immunol 142, 1867–1883 e1812 (2018). [DOI] [PubMed] [Google Scholar]
- 62.Singh N et al. Activation of Gpr109a, receptor for niacin and the commensal metabolite butyrate, suppresses colonic inflammation and carcinogenesis. Immunity 40, 128–139 (2014). [DOI] [PMC free article] [PubMed] [Google Scholar]
- 63.Berndt BE et al. Butyrate increases IL-23 production by stimulated dendritic cells. American journal of physiology. Gastrointestinal and liver physiology 303, G1384–1392 (2012). [DOI] [PMC free article] [PubMed] [Google Scholar]
- 64.Lupp C et al. Host-mediated inflammation disrupts the intestinal microbiota and promotes the overgrowth of Enterobacteriaceae. Cell host & microbe 2, 204 (2007). [DOI] [PubMed] [Google Scholar]
- 65.Osbelt L et al. Variations in microbiota composition of laboratory mice influence Citrobacter rodentium infection via variable short-chain fatty acid production. PLoS pathogens 16, e1008448 (2020). [DOI] [PMC free article] [PubMed] [Google Scholar]
- 66.Kim MH, Taparowsky EJ & Kim CH Retinoic Acid Differentially Regulates the Migration of Innate Lymphoid Cell Subsets to the Gut. Immunity 43, 107–119 (2015). [DOI] [PMC free article] [PubMed] [Google Scholar]
Associated Data
This section collects any data citations, data availability statements, or supplementary materials included in this article.


