

Abstract
In the adult brain, multiple cell types are known to produce factors that regulate blood-brain barrier properties, including astrocytes. Yet several recent studies disputed a role for mature astrocytes at the blood-brain barrier. To determine if astrocytes contribute a non-redundant and necessary function in maintaining the adult blood-brain barrier, we used a mouse model of tamoxifen-inducible astrocyte ablation. In adult mice, tamoxifen induction caused sparse apoptotic astrocyte cell death within 2 hours. Indicative of BBB damage, leakage of the small molecule Cadaverine and the large plasma protein fibrinogen into the brain parenchyma indicative of BBB damage was detected as early as astrocyte ablation was present. Vessels within and close to regions of astrocyte loss had lower expression of the tight junction protein zonula occludens-1 while endothelial glucose transporter 1 expression was undisturbed. Cadaverine leakage persisted for several weeks suggesting a lack of barrier repair. This is consistent with the finding that ablated astrocytes were not replaced. Adjacent astrocytes responded with partial non-proliferative astrogliosis, characterized by morphological changes and delayed phosphorylation of STAT3, which restricted dye leakage to the brain and vessel surface areas lacking coverage by astrocytes one month after ablation. In conclusion, astrocytes are necessary to maintain blood-brain barrier integrity in the adult brain. Blood-brain barrier-regulating factors secreted by other cell types, such as pericytes, are not sufficient to compensate for astrocyte loss.
Keywords: glial scar, astrogliosis, tight junctions, contact inhibition, gliovascular unit
Graphical Abstract
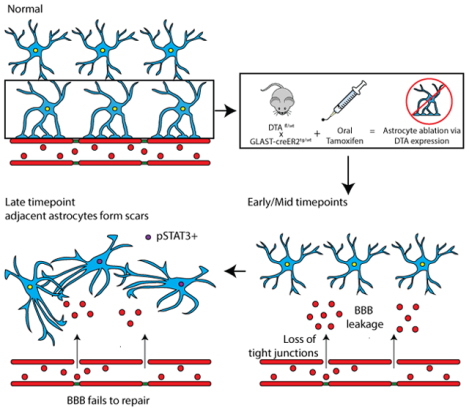
Mature astrocytes are necessary for maintenance of endothelial tight junctions in the adult brain. Ablated astrocytes are not replaced by proliferation or process extension of neighboring astrocytes, resulting in long-term blood-brain barrier damage.
1. Introduction
A role for astrocytes in maintaining the blood-brain barrier (BBB) in the adult healthy brain is widely assumed, but little direct experimental evidence supports this conclusion. In fact, several recent studies ablating astrocytes suggest that astrocytes are not required to maintain BBB integrity (Kubotera et al., 2019; Schreiner et al., 2015; Tsai et al., 2012). The conclusion that astrocytes are involved in BBB initiation and maintenance is based on early work that transplanted glial progenitor cells into the developing main body cavity and the anterior chamber of the eye, which both normally lack a BBB. As a result of this transplantation, permeable vessels acquired BBB properties and dyes such as trypan blue and Evans blue could no longer pass this barrier (Janzer & Raff, 1987; Stewart & Wiley, 1981). Evidence for an astrocyte-secreted factor responsible for initiating barrier-like properties in endothelial cells was obtained in culture studies using primary bovine brain endothelial cells in conjunction with primary postnatal astrocytes or their conditioned media. Under these conditions, endothelial cells that lose their BBB properties when cultured alone start to express higher levels of tight junction proteins, and enhanced trans-endothelial electrical resistance (TEER) can be measured suggesting a physically tighter barrier (Rubin et al., 1991; Tao-Cheng, Nagy, & Brightman, 1987; Wolburg et al., 1994). These results were reproduced in human brain microvascular endothelial cells (HBMECs) using conditioned media from human astrocytes (Siddharthan, Kim, Liu, & Kim, 2007) or induced pluripotent stem cell-derived astrocytes (Canfield et al., 2017). From this data, a key role for astrocytes in initiating and maintaining the BBB via secreted factors, among them sonic hedgehog (Shh) and glial derived neurotrophic factor (Igarashi et al., 1999; Xia et al., 2013) was deduced. Yet astrocytes cultured from neonates rapidly divide and reflect a more progenitor-like phenotype, which is vastly different from the mature, quiescent astrocytes populating the adult brain. In 2010, Armulik and Daneman challenged the notion that BBB formation during development relies on astrocytes, arguing that the BBB is already established before glial progenitor cells differentiate into astrocytes and astrocyte endfeet are formed along vessels. Instead, this study established a role for pericytes in initiating BBB formation because the barrier was found to be abnormal in PDGFRb-deficient mice, which present with reduced pericyte coverage along cerebral vessels. Given the developmentally dysfunctional vessels and BBB, this study was not able to dissect a potential role for mature astrocytes in BBB maintenance upstream of pericytes in the adult brain (Armulik et al., 2010; Daneman, Zhou, Kebede, & Barres, 2010).
Many factors secreted by cultured astrocytes that were reported to modulate the BBB in vitro, including Sonic hedgehog (Shh), glial-derived neurotrophic factor and angiopoietin, are not present in mature astrocytes in the uninjured brain according to several astrocyte-specific transcriptome and proteome datasets (Anderson et al., 2016; Sharma et al., 2015; Y. Zhang et al., 2014). This holds true even after enriching for astrocyte endfeet transcripts (Boulay et al., 2017). A study carefully assessing Shh protein and mRNA expression patterns determined that Shh is present in very few astrocytes and the majority of Shh protein in the adult uninjured cortex is made by neurons (Sirko et al., 2013). Other factors including Fibroblast growth factor 2 (FGF2) and vascular endothelial growth factor A are expressed at low or, in the case of angiotensinogen, high levels. Many of these molecules are modulated in expression during development and after injury and their role for BBB function has mostly been explored in the context of pathology (Argaw et al., 2012; Huang et al., 2012; Lee et al., 2003; Min et al., 2015; Z. G. Zhang, Zhang, Croll, & Chopp, 2002; Z. G. Zhang et al., 2000; Zheng et al., 2009) or in genetic models that did not distinguish developmental or cell type-specific effects in vivo (Kakinuma et al., 1998; Reuss, Dono, & Unsicker, 2003; Wosik et al., 2007) to assess the role of mature astrocytes in BBB maintenance.
Thus, whether astrocytes have a necessary and non-redundant role in maintenance of the BBB in the healthy adult brain is still unresolved as the above-mentioned astrocyte ablation studies used readouts that only represent massive damage to the BBB (also see discussion). To overcome these limitations, we genetically ablated astrocytes in the adult brain and employed sensitive readouts to test for BBB integrity. Here, we demonstrate that astrocytes perform necessary and non-redundant roles for maintenance and repair of the BBB.
2. Methods
2.1. Mice
To enable inducible genetic astrocyte-specific ablation Gt(ROSA)26Sortm1(DTA)Jpmb/J mice (Jackson Labs stock #006331) were crossed with Tg(Slc1a3-cre/ERT)1Nat (Nathans, 2010) (Jackson Labs stock #012586). We will refer to Gt(ROSA)26Sortm1(DTA)Jpmb/J mice expressing one diphtheria toxin A (DTA) allele as DTAfl/wt mice and to Tg(Slc1a3-cre/ERT)1Nat expressing the transgene heterozygously as Glast-CreERTtg/wt mice.
Mice were initially purchased from The Jackson Laboratory and were then bred in-house. All animal procedures were approved and carried out according to the guidelines of the Institutional Animal Care and Use Committee of Virginia Polytechnic Institute and State University (Virginia Tech) and were performed in compliance with the National Institute of Health’s Guide for the Care and Use of Laboratory Animals.
2.2. Experimental Design
8–12 week old mice of both sexes were used for experiments. Sex is specified in Table 1. Diphtheria Toxin fragment A (DTA) interferes with protein synthesis, inducing apoptotic cell death in those cells that express it (Ivanova, Signore et al. 2005). DTAfl/wt (fl: floxed allele, encoding loxP sites; wt: wildtype allele) mice express DTA under the Rosa26 promoter behind a stop cassette flanked by loxP sites, which interferes with DTA expression until the stop cassette is removed by Cre recombinase. Cre recombinase is fused with an estrogen receptor and expressed behind the Glast promoter and as part of a complex in Glast-CreERTtg/wt mice (tg: allele carries transgene; wt: wildtype allele). This restricts expression to astrocytes and enables timed relocalization of the CreERT protein complex to the nucleus for excision of the stop cassette only after Tamoxifen (TX) administration (Fig. 1a). Glast-CreERT is expressed and causes Cre-mediated recombination in a limited number of astrocytes in the forebrain of adult mice (Mori et al., 2006; Srinivasan et al., 2016).
Table 1.
Sex and genotype of mice used in experiments.
| Figure 1 | Panel | Animal # | Sex | Experimental Group | Timepoint | Total n |
| c | 0046 | M | DTAfl/wt//Glast-CreERTtg/wt + Tamoxifen | 1 dpa | ||
| d | 4520 | F | DTAwt/wt//Glast-CreERTtg/wt + Tamoxifen | 3 dpa | ||
| 309 | F | DTAfl/wt//Glast-CreERTtg/wt + Tamoxifen | 6 hpa | |||
| 305 | M | DTAfl/wt//Glast-CreERTtg/wt + Tamoxifen | 11 dpa | |||
| 4624 | M | DTAfl/wt//Glast-CreERTtg/wt + Tamoxifen | 28 dpa | |||
| e | 4864 | F | DTAfl/wt//Glast-CreERTwt/wt + Tamoxifen | 28 dpa | ||
| 315 | M | DTAfl/wt//Glast-CreERTtg/wt + Tamoxifen | 11 dpa | |||
| f | 528 | F | DTwt/wt//Glast-CreERtg/wt + Tamoxifen | 6 hpa | n=15 (control) | |
| 532 | F | DTAwt/wt//Glast-CreERTtg/wt + Tamoxifen | 6 hpa | |||
| 319 | F | DTAwt/wt//Glast-CreERTtg/wt + Tamoxifen | 6 hpa | |||
| 4902 | M | DTAwt/wt//Glast-CreERTtg/wt + Tamoxifen | 1 dpa | |||
| 292 | F | DTAfl/wt//Glast-CreERTwt/wt + Tamoxifen | 1 dpa | |||
| 526 | F | DTAwt/wt//Glast-CreERTtg/wt + Tamoxifen | 1 dpa | |||
| 0043 | F | DTAfl/wt//Glast-CreERTwt/wt + Tamoxifen | 1 dpa | |||
| 4287 | F | DTAfl/wt//Glast-CreERTwt/wt + Tamoxifen | 1 dpa | |||
| 4520 | F | DTAfl/wt//Glast-CreERTwt/wt + Tamoxifen | 3 dpa | |||
| 3358 | M | DTAfl/wt//Glast-CreERTwt/wt + Tamoxifen | 3 dpa | |||
| 313 | M | DTAwt/wt//Glast-CreERTtg/wt + Tamoxifen | 11 dpa | |||
| 4864 | M | DTAfl/wt//Glast-CreERTwt/wt + Tamoxifen | 28 dpa | |||
| 4862 | M | DTAfl/wt//Glast-CreERTwt/wt + Tamoxifen | 28 dpa | |||
| 219 | F | DTAwt/wt//Glast-CreERTwt/wt + Tamoxifen | 28 dpa | |||
| 4995 | F | DTAfl/wt//Glast-CreERTwt/wt + Tamoxifen | 28 dpa | |||
| 893 | F | DTAfl/wt//Glast-CreERTtg/wt + Tamoxifen | 2 hpa | n=3 (2 hpa) | ||
| 895 | M | DTAfl/wt//Glast-CreERTtg/wt + Tamoxifen | 2 hpa | |||
| 892 | M | DTAfl/wt//Glast-CreERTtg/wt + Tamoxifen | 2 hpa | |||
| 309 | F | DTAfl/wt//Glast-CreERTtg/wt + Tamoxifen | 6 hpa | n=3 (6 hpa) | ||
| 868 | M | DTAfl/wt//Glast-CreERTtg/wt + Tamoxifen | 6 hpa | |||
| 723 | F | DTAfl/wt//Glast-CreERTtg/wt + Tamoxifen | 6 hpa | |||
| 4901 | M | DTAfl/wt//Glast-CreERTtg/wt + Tamoxifen | 1 dpa | n=4 (1 dpa) | ||
| 294 | F | DTAfl/wt//Glast-CreERTtg/wt + Tamoxifen | 1 dpa | |||
| 3497 | F | DTAfl/wt//Glast-CreERTtg/wt + Tamoxifen | 1 dpa | |||
| 4221 | F | DTAfl/wt//Glast-CreERTtg/wt + Tamoxifen | 1 dpa | |||
| 4519 | M | DTAfl/wt//Glast-CreERTtg/wt + Tamoxifen | 3 dpa | n=4 (3 dpa) | ||
| 4523 | M | DTAfl/wt//Glast-CreERTtg/wt + Tamoxifen | 3 dpa | |||
| 3351 | M | DTAfl/wt//Glast-CreERTtg/wt + Tamoxifen | 3 dpa | |||
| 2279 | M | DTAfl/wt//Glast-CreERTtg/wt + Tamoxifen | 3 dpa | |||
| 538 | M | DTAfl/wt//Glast-CreERTtg/wt + Tamoxifen | 5 dpa | n=4 (5 dpa) | ||
| 317 | M | DTAfl/wt//Glast-CreERTtg/wt + Tamoxifen | 5 dpa | |||
| 535 | F | DTAfl/wt//Glast-CreERTtg/wt + Tamoxifen | 5 dpa | |||
| 536 | F | DTAfl/wt//Glast-CreERTtg/wt + Tamoxifen | 5 dpa | |||
| 310 | M | DTAfl/wt//Glast-CreERTtg/wt + Tamoxifen | 11 dpa | n=4 (11 dpa) | ||
| 305 | M | DTAfl/wt//Glast-CreERTtg/wt + Tamoxifen | 11 dpa | |||
| 529 | M | DTAfl/wt//Glast-CreERTtg/wt + Tamoxifen | 11 dpa | |||
| 314 | F | DTAfl/wt//Glast-CreERTtg/wt + Tamoxifen | 11 dpa | |||
| 4624 | M | DTAfl/wt//Glast-CreERTtg/wt + Tamoxifen | 28 dpa | n=5 (28 dpa) | ||
| 4631 | F | DTAfl/wt//Glast-CreERTtg/wt + Tamoxifen | 28 dpa | |||
| 220 | F | DTAfl/wt//Glast-CreERTtg/wt + Tamoxifen | 28 dpa | |||
| 291 | F | DTAfl/wt//Glast-CreERTtg/wt + Tamoxifen | 28 dpa | |||
| 4836 | M | DTAfl/wt//Glast-CreERTtg/wt + Tamoxifen | 28 dpa | |||
| Figure 2 | a | 4518 | F | DTAfl/wt//Glast-CreERTwt/wt + Tamoxifen | 3 dpa | |
| 309 | F | DTAfl/wt//Glast-CreERTtg/wt + Tamoxifen | 6 hpa | |||
| 314 | F | DTAfl/wt//Glast-CreERTtg/wt + Tamoxifen | 11 dpa | |||
| 4631 | F | DTAfl/wt//Glast-CreERTtg/wt + Tamoxifen | 28 dpa | |||
| b | 319 | F | DTAwt/wt//Glast-CreERTtg/wt + Tamoxifen | 6 hpa | n=16 (control) | |
| 528 | F | DTAwt/wt//Glast-CreERTtg/wt + Tamoxifen | 6 hpa | |||
| 532 | F | DTAwt/wt//Glast-CreERTtg/wt + Tamoxifen | 6 hpa | |||
| 4902 | M | DTAfl/wt//Glast-CreERTwt/wt + Tamoxifen | 1 dpa | |||
| 292 | F | DTAfl/wt//Glast-CreERTwt/wt + Tamoxifen | 1 dpa | |||
| A8032 | M | DTAfl/wt//Glast-CreERTwt/wt + Tamoxifen | 3 dpa | |||
| 4518 | F | DTAfl/wt//Glast-CreERTwt/wt + Tamoxifen | 3 dpa | |||
| 4520 | F | DTAwt/wt//Glast-CreERTtg/wt + Tamoxifen | 3 dpa | |||
| 537 | M | DTAfl/wt//Glast-CreERTwt/wt + Tamoxifen | 5 dpa | |||
| 4862 | M | DTAfl/wt//Glast-CreERTwt/wt + Tamoxifen | 28 dpa | |||
| 219 | F | DTAwt/wt//Glast-CreERTwt/wt + Tamoxifen | 28 dpa | |||
| 4629 | F | DTAfl/wt//Glast-CreERTwt/wt + Tamoxifen | 28 dpa | |||
| 272 | F | DTAfl/wt//Glast-CreERTwt/wt + Tamoxifen | 28 dpa | |||
| 273 | F | DTAfl/wt//Glast-CreERTwt/wt + Tamoxifen | 28 dpa | |||
| 4864 | M | DTAfl/wt//Glast-CreERTwt/wt + Tamoxifen | 28 dpa | |||
| 4995 | F | DTAfl/wt//Glast-CreERTwt/wt + Tamoxifen | 28 dpa | |||
| 893 | F | DTAfl/wt//Glast-CreERTtg/wt + Tamoxifen | 2 hpa | n=3 (2 hpa) | ||
| 895 | M | DTAfl/wt//Glast-CreERTtg/wt + Tamoxifen | 2 hpa | |||
| 892 | M | DTAfl/wt//Glast-CreERTtg/wt + Tamoxifen | 2 hpa | |||
| 309 | F | DTAfl/wt//Glast-CreERTtg/wt + Tamoxifen | 6 hpa | n=3 (6 hpa) | ||
| 723 | F | DTAfl/wt//Glast-CreERTtg/wt + Tamoxifen | 6 hpa | |||
| 868 | M | DTAfl/wt//Glast-CreERTtg/wt + Tamoxifen | 6 hpa | |||
| 4901 | M | DTAfl/wt//Glast-CreERTtg/wt + Tamoxifen | 1 dpa | n=3 (1 dpa) | ||
| 293 | F | DTAfl/wt//Glast-CreERTtg/wt + Tamoxifen | 1 dpa | |||
| 294 | F | DTAfl/wt//Glast-CreERTtg/wt + Tamoxifen | 1 dpa | |||
| 4519 | M | DTAfl/wt//Glast-CreERTtg/wt + Tamoxifen | 3 dpa | n=3 (3 dpa) | ||
| 4523 | M | DTAfl/wt//Glast-CreERTtg/wt + Tamoxifen | 3 dpa | |||
| A8033 | M | DTAfl/wt//Glast-CreERTtg/wt + Tamoxifen | 3 dpa | |||
| 536 | F | DTAfl/wt//Glast-CreERTtg/wt + Tamoxifen | 5 dpa | n=3 (5 dpa) | ||
| 535 | F | DTAfl/wt//Glast-CreERTtg/wt + Tamoxifen | 5 dpa | |||
| 317 | M | DTAfl/wt//Glast-CreERTtg/wt + Tamoxifen | 5 dpa | |||
| 314 | F | DTAfl/wt//Glast-CreERTtg/wt + Tamoxifen | 11 dpa | n=4 (11 dpa) | ||
| 305 | M | DTAfl/wt//Glast-CreERTtg/wt + Tamoxifen | 11 dpa | |||
| 311 | F | DTAfl/wt//Glast-CreERTtg/wt + Tamoxifen | 11 dpa | |||
| 310 | M | DTAfl/wt//Glast-CreERTtg/wt + Tamoxifen | 11 dpa | |||
| 4631 | F | DTAfl/wt//Glast-CreERTtg/wt + Tamoxifen | 28 dpa | n=5 (28 dpa) | ||
| 4624 | M | DTAfl/wt//Glast-CreERTtg/wt + Tamoxifen | 28 dpa | |||
| 4836 | M | DTAfl/wt//Glast-CreERTtg/wt + Tamoxifen | 28 dpa | |||
| 291 | F | DTAfl/wt//Glast-CreERTtg/wt + Tamoxifen | 28 dpa | |||
| 220 | F | DTAfl/wt//Glast-CreERTtg/wt + Tamoxifen | 28 dpa | |||
| c | 4518 | F | DTAfl/wt//Glast-CreERTwt/wt + Tamoxifen | 3 dpa | ||
| 294 | F | DTAfl/wt//Glast-CreERTtg/wt + Tamoxifen | 1 dpa | |||
| d | A8644 | M | DTAfl/wt//Glast-CreERTwt/wt + Tamoxifen | 5 dpa | ||
| A8851 | M | DTAfl/wt//Glast-CreERTtg/wt + Tamoxifen | 5 dpa | |||
| A9077 | F | DTAfl/wt//Glast-CreERTtg/wt + Tamoxifen | 28 dpa | |||
| Figure 3 | a | 3367 | F | DTAfl/wt//Glast-CreERTwt/wt + Tamoxifen | 3 dpa | |
| 314 | F | DTAfl/wt//Glast-CreERTtg/wt + Tamoxifen | 11 dpa | |||
| b,c | 3367 | F | DTAfl/wt//Glast-CreERTwt/wt + Tamoxifen | 3 dpa | n=3 (control) | |
| 4902 | M | DTAwt/wt//Glast-CreERTtg/wt + Tamoxifen | 1 dpa | |||
| 4518 | F | DTAfl/wt//Glast-CreERTwt/wt + Tamoxifen | 3 dpa | |||
| 868 | M | DTAfl/wt//Glast-CreERTtg/wt + Tamoxifen | 6 hpa | n=3 (6 hpa) | ||
| 723 | F | DTAfl/wt//Glast-CreERTtg/wt + Tamoxifen | 6 hpa | |||
| 309 | F | DTAfl/wt//Glast-CreERTtg/wt + Tamoxifen | 6 hpa | |||
| 305 | M | DTAfl/wt//Glast-CreERTtg/wt + Tamoxifen | 11 dpa | n=3 (11 dpa) | ||
| 314 | F | DTAfl/wt//Glast-CreERTtg/wt + Tamoxifen | 11 dpa | |||
| 301 | F | DTAfl/wt//Glast-CreERTtg/wt + Tamoxifen | 11 dpa | |||
| 220 | F | DTAfl/wt//Glast-CreERTtg/wt + Tamoxifen | 28 dpa | n=3 (28 dpa) | ||
| 4836 | M | DTAfl/wt//Glast-CreERTtg/wt + Tamoxifen | 28 dpa | |||
| 271 | F | DTAfl/wt//Glast-CreERTtg/wt + Tamoxifen | 28 dpa | |||
| d | 3367 | F | DTAfl/wt//Glast-CreERTwt/wt + Tamoxifen | 3 dpa | ||
| 314 | F | DTAfl/wt//Glast-CreERTtg/wt + Tamoxifen | 11 dpa | |||
| e | 528 | F | DTAwt/wt//Glast-CreERTtg/wt + Tamoxifen | 6 hpa | n=3 (control) | |
| 534 | M | DTAfl/wt//Glast-CreERTwt/wt + Tamoxifen | 11 dpa | |||
| 3367 | F | DTAfl/wt//Glast-CreERTwt/wt + Tamoxifen | 3 dpa | |||
| 309 | F | DTAfl/wt//Glast-CreERTtg/wt + Tamoxifen | 6 hpa | n=3 (6 hpa) | ||
| 868 | M | DTAfl/wt//Glast-CreERTtg/wt + Tamoxifen | 6 hpa | |||
| 723 | F | DTAfl/wt//Glast-CreERTtg/wt + Tamoxifen | 6 hpa | |||
| 305 | M | DTAfl/wt//Glast-CreERTtg/wt + Tamoxifen | 11 dpa | n=3 (11 dpa) | ||
| 310 | F | DTAfl/wt//Glast-CreERTtg/wt + Tamoxifen | 11 dpa | |||
| 314 | F | DTAfl/wt//Glast-CreERTtg/wt + Tamoxifen | 11 dpa | |||
| 217 | M | DTAfl/wt//Glast-CreERTtg/wt + Tamoxifen | 28 dpa | n=3 (28 dpa) | ||
| 4836 | M | DTAfl/wt//Glast-CreERTtg/wt + Tamoxifen | 28 dpa | |||
| 4631 | F | DTAfl/wt//Glast-CreERTtg/wt + Tamoxifen | 28 dpa | |||
| Figure 4 | a | 4224 | M | DTAfl/wt//Glast-CreERTwt/wt + Tamoxifen | 3 dpa | |
| 294 | F | DTAfl/wt//Glast-CreERTtg/wt + Tamoxifen | 1 dpa | |||
| 314 | F | DTAfl/wt//Glast-CreERTtg/wt + Tamoxifen | 11 dpa | |||
| 4863 | M | DTAfl/wt//Glast-CreERTtg/wt + Tamoxifen | 28 dpa | |||
| b | 4862 | M | DTAfl/wt//Glast-CreERTwt/wt + Tamoxifen | 28 dpa | ||
| 4624 | M | DTAfl/wt//Glast-CreERTtg/wt + Tamoxifen | 28 dpa | |||
| c | 4228 | M | DTAfl/wt//Glast-CreERTwt/wt + Tamoxifen | 1 dpa | n=3 (control) | |
| 4518 | F | DTAfl/wt//Glast-CreERTwt/wt + Tamoxifen | 3 dpa | |||
| 3360 | F | DTAfl/wt//Glast-CreERTwt/wt + Tamoxifen | 3 dpa | |||
| 723 | F | DTAfl/wt//Glast-CreERTtg/wt + Tamoxifen | 6 hpa | n=3 (6 hpa) | ||
| 868 | F | DTAfl/wt//Glast-CreERTtg/wt + Tamoxifen | 6 hpa | |||
| 309 | M | DTAfl/wt//Glast-CreERTtg/wt + Tamoxifen | 6 hpa | |||
| 305 | M | DTAfl/wt//Glast-CreERTtg/wt + Tamoxifen | 11 dpa | n=3 (11 dpal) | ||
| 315 | M | DTAfl/wt//Glast-CreERTtg/wt + Tamoxifen | 11 dpa | |||
| 310 | M | DTAfl/wt//Glast-CreERTtg/wt + Tamoxifen | 11 dpa | |||
| 4624 | M | DTAfl/wt//Glast-CreERTtg/wt + Tamoxifen | 28 dpa | n=3 (28 dpa) | ||
| A8403 | F | DTAfl/wt//Glast-CreERTtg/wt + Tamoxifen | 28 dpa | |||
| A8406 | M | DTAfl/wt//Glast-CreERTtg/wt + Tamoxifen | 28 dpa | |||
| Figure 5 | a | 4287 | F | DTAfl/wt//Glast-CreERTwt/wt + Tamoxifen | 1 dpa | |
| 293 | M | DTAfl/wt//Glast-CreERTtg/wt + Tamoxifen | 1 dpa | |||
| 314 | F | DTAfl/wt//Glast-CreERTtg/wt + Tamoxifen | 11 dpa | |||
| 4631 | F | DTAfl/wt//Glast-CreERTtg/wt + Tamoxifen | 28 dpa | |||
| b-d,f,h | 4287 | F | DTAfl/wt//Glast-CreERTwt/wt + Tamoxifen | 1 dpa | n=3 (control) | |
| 301 | F | DTAfl/wt//Glast-CreERTwt/wt + Tamoxifen | 11 dpa | |||
| 219 | F | DTAwt/wt//Glast-CreERTwt/wt + Tamoxifen | 28 dpa | |||
| 293 | M | DTAfl/wt//Glast-CreERTtg/wt + Tamoxifen | 1 dpa | n=3 (1 dpa) | ||
| 4221 | F | DTAfl/wt//Glast-CreERTtg/wt + Tamoxifen | 1 dpa | |||
| 4901 | M | DTAfl/wt//Glast-CreERTtg/wt + Tamoxifen | 1 dpa | |||
| 271 | F | DTAfl/wt//Glast-CreERTtg/wt + Tamoxifen | 11 dpa | n=3 (11 dpa) | ||
| 310 | M | DTAfl/wt//Glast-CreERTtg/wt + Tamoxifen | 11 dpa | |||
| 314 | F | DTAfl/wt//Glast-CreERTtg/wt + Tamoxifen | 11 dpa | |||
| 291 | F | DTAfl/wt//Glast-CreERTtg/wt + Tamoxifen | 28 dpa | n= 3 (28 dpa) | ||
| 4631 | F | DTAfl/wt//Glast-CreERTtg/wt + Tamoxifen | 28 dpa | |||
| 4865 | M | DTAfl/wt//Glast-CreERTtg/wt + Tamoxifen | 28 dpa | |||
| Figure 6 | a | A9181 | M | DTAfl/wt//Glast-CreERTwt/wt + Tamoxifen | 28 dpa | n=22 (28 dpa) control |
| A9182 | M | DTAfl/wt//Glast-CreERTwt/wt + Tamoxifen | 28 dpa | |||
| A8410 | M | DTAfl/wt//Glast-CreERTwt/wt + Tamoxifen | 28 dpa | |||
| A8405 | M | DTAfl/wt//Glast-CreERTwt/wt + Tamoxifen | 28 dpa | |||
| A8404 | M | DTAfl/wt//Glast-CreERTwt/wt + Tamoxifen | 28 dpa | |||
| A8862 | M | DTAfl/wt//Glast-CreERTwt/wt + Tamoxifen | 28 dpa | |||
| A8860 | M | DTAfl/wt//Glast-CreERTwt/wt + Tamoxifen | 28 dpa | |||
| A8854 | M | DTAfl/wt//Glast-CreERTwt/wt + Tamoxifen | 28 dpa | |||
| A8857 | F | DTAfl/wt//Glast-CreERTwt/wt + Tamoxifen | 28 dpa | |||
| A9120 | F | DTAfl/wt//Glast-CreERTwt/wt + Tamoxifen | 28 dpa | |||
| A9121 | F | DTAfl/wt//Glast-CreERTwt/wt + Tamoxifen | 28 dpa | |||
| A9122 | F | DTAfl/wt//Glast-CreERTwt/wt + Tamoxifen | 28 dpa | |||
| A9115 | F | DTAfl/wt//Glast-CreERTwt/wt + Tamoxifen | 28 dpa | |||
| A9116 | F | DTAfl/wt//Glast-CreERTwt/wt + Tamoxifen | 28 dpa | |||
| A9117 | F | DTAfl/wt//Glast-CreERTwt/wt + Tamoxifen | 28 dpa | |||
| 4629 | F | DTAfl/wt//Glast-CreERTwt/wt + Tamoxifen | 28 dpa | |||
| 218 | F | DTAfl/wt//Glast-CreERTwt/wt + Tamoxifen | 28 dpa | |||
| 219 | F | DTAwt/wt//Glast-CreERTwt/wt + Tamoxifen | 28 dpa | |||
| 4995 | F | DTAwt/wt//Glast-CreERTwt/wt + Tamoxifen | 28 dpa | |||
| 4633 | M | DTAwt/wt//Glast-CreERTwt/wt + Tamoxifen | 28 dpa | |||
| 4862 | M | DTAfl/wt//Glast-CreERTwt/wt + Tamoxifen | 28 dpa | |||
| 4864 | M | DTAfl/wt//Glast-CreERTwt/wt + Tamoxifen | 28 dpa | |||
| A8406 | M | DTAfl/wt//Glast-CreERTtg/wt + Tamoxifen | 28 dpa | n= 18 (28 dpa) experimental | ||
| A8403 | F | DTAfl/wt//Glast-CreERTtg/wt + Tamoxifen | 28 dpa | |||
| A8407 | M | DTAfl/wt//Glast-CreERTtg/wt + Tamoxifen | 28 dpa | |||
| A8856 | M | DTAfl/wt//Glast-CreERTtg/wt + Tamoxifen | 28 dpa | |||
| A8859 | M | DTAfl/wt//Glast-CreERTtg/wt + Tamoxifen | 28 dpa | |||
| A9077 | M | DTAfl/wt//Glast-CreERTtg/wt + Tamoxifen | 28 dpa | |||
| A8858 | M | DTAfl/wt//Glast-CreERTtg/wt + Tamoxifen | 28 dpa | |||
| A9179 | F | DTAfl/wt//Glast-CreERTtg/wt + Tamoxifen | 28 dpa | |||
| A9183 | F | DTAfl/wt//Glast-CreERTtg/wt + Tamoxifen | 28 dpa | |||
| A9118 | F | DTAfl/wt//Glast-CreERTtg/wt + Tamoxifen | 28 dpa | |||
| A9119 | F | DTAfl/wt//Glast-CreERTtg/wt + Tamoxifen | 28 dpa | |||
| 4836 | M | DTAfl/wt//Glast-CreERTtg/wt + Tamoxifen | 28 dpa | |||
| 4624 | M | DTAfl/wt//Glast-CreERTtg/wt + Tamoxifen | 28 dpa | |||
| 4865 | M | DTAfl/wt//Glast-CreERTtg/wt + Tamoxifen | 28 dpa | |||
| 4863 | M | DTAfl/wt//Glast-CreERTtg/wt + Tamoxifen | 28 dpa | |||
| 4631 | F | DTAfl/wt//Glast-CreERTtg/wt + Tamoxifen | 28 dpa | |||
| 220 | F | DTAfl/wt//Glast-CreERTtg/wt + Tamoxifen | 28 dpa | |||
| 217 | M | DTAfl/wt//Glast-CreERTtg/wt + Tamoxifen | 28 dpa | |||
| b-d | A9181 | M | DTAfl/wt//Glast-CreERTwt/wt + Tamoxifen | 28 dpa | n= 12 (28 dpa) control | |
| A9182 | M | DTAfl/wt//Glast-CreERTwt/wt + Tamoxifen | 28 dpa | |||
| A8410 | M | DTAfl/wt//Glast-CreERTwt/wt + Tamoxifen | 28 dpa | |||
| A8405 | M | DTAfl/wt//Glast-CreERTwt/wt + Tamoxifen | 28 dpa | |||
| A8404 | M | DTAfl/wt//Glast-CreERTwt/wt + Tamoxifen | 28 dpa | |||
| A8862 | M | DTAfl/wt//Glast-CreERTwt/wt + Tamoxifen | 28 dpa | |||
| A8860 | M | DTAfl/wt//Glast-CreERTwt/wt + Tamoxifen | 28 dpa | |||
| A8854 | M | DTAfl/wt//Glast-CreERTwt/wt + Tamoxifen | 28 dpa | |||
| A8857 | F | DTAfl/wt//Glast-CreERTwt/wt + Tamoxifen | 28 dpa | |||
| A9120 | F | DTAfl/wt//Glast-CreERTwt/wt + Tamoxifen | 28 dpa | |||
| A9121 | F | DTAfl/wt//Glast-CreERTwt/wt + Tamoxifen | 28 dpa | |||
| A9122 | F | DTAfl/wt//Glast-CreERTwt/wt + Tamoxifen | 28 dpa | |||
| A8856 | M | DTAfl/wt//Glast-CreERTtg/wt + Tamoxifen | 28 dpa | n=8 (28 dpa) experimental | ||
| A8859 | M | DTAfl/wt//Glast-CreERTtg/wt + Tamoxifen | 28 dpa | |||
| A9077 | M | DTAfl/wt//Glast-CreERTtg/wt + Tamoxifen | 28 dpa | |||
| A8858 | M | DTAfl/wt//Glast-CreERTtg/wt + Tamoxifen | 28 dpa | |||
| A9179 | F | DTAfl/wt//Glast-CreERTtg/wt + Tamoxifen | 28 dpa | |||
| A9183 | F | DTAfl/wt//Glast-CreERTtg/wt + Tamoxifen | 28 dpa | |||
| A9118 | F | DTAfl/wt//Glast-CreERTtg/wt + Tamoxifen | 28 dpa | |||
| A9119 | F | DTAfl/wt//Glast-CreERTtg/wt + Tamoxifen | 28 dpa | |||
| Supp. Fig. 1 | a-d | 4864 | M | DTAfl/wt//Glast-CreERTwt/wt + Tamoxifen | 28 dpa | |
| 314 | F | DTAfl/wt//Glast-CreERTtg/wt + Tamoxifen | 11 dpa | |||
| Supp.Fig. 2 | a | 381 | M | DTAfl/wt//Glast-CreERTtg/wt, Naïve | N/A | |
| 382 | F | DTAfl/wt//Glast-CreERTtg/wt , Naïve | N/A | |||
| 4525 | M | DTAfl/wt//Glast-CreERTtg/wt + Oil | 3 dpa | |||
| b,c | 4862 | M | DTAfl/wt//Glast-CreERTwt/wt + Tamoxifen | 28 dpa | ||
| 4864 | M | DTAfl/wt//Glast-CreERTwt/wt + Tamoxifen | 28 dpa | |||
| 305 | M | DTAfl/wt//Glast-CreERTtg/wt + Tamoxifen | 11 dpa | |||
| d | 4862 | M | DTAfl/wt//Glast-CreERTwt/wt + Tamoxifen | 28 dpa | ||
| 305 | M | DTAfl/wt//Glast-CreERTtg/wt + Tamoxifen | 11 dpa | |||
| Supp.Fig. 3 | a | 292 | F | DTAfl/wt//Glast-CreERTwt/wt + Tamoxifen | 1 dpa | |
| 892 | M | DTAfl/wt//Glast-CreERTtg/wt + Tamoxifen | 2 hpa | |||
| 4624 | M | DTAfl/wt//Glast-CreERTtg/wt + Tamoxifen | 28 dpa | |||
| b | 382 | F | DTAfl/wt//Glast-CreERTtg/wt, Naïve | |||
| c | 292 | F | DTAfl/wt//Glast-CreERTwt/wt + Tamoxifen | 1 dpa | ||
| 868 | F | DTAfl/wt//Glast-CreERTtg/wt + Tamoxifen | 6 hpa | |||
| 305 | F | DTAfl/wt//Glast-CreERTtg/wt + Tamoxifen | 11 dpa | |||
| 220 | F | DTAfl/wt//Glast-CreERTtg/wt + Tamoxifen | 28 dpa | |||
| d | 868 | F | DTAfl/wt//Glast-CreERTtg/wt + Tamoxifen | 6 hpa | n=3 (6 hpa) | |
| 723 | M | DTAfl/wt//Glast-CreERTtg/wt + Tamoxifen | 6 hpa | |||
| 309 | M | DTAfl/wt//Glast-CreERTtg/wt + Tamoxifen | 6 hpa | |||
| 305 | M | DTAfl/wt//Glast-CreERTtg/wt + Tamoxifen | 11 dpa | n=3 (11 dpa) | ||
| 314 | F | DTAfl/wt//Glast-CreERTtg/wt + Tamoxifen | 11 dpa | |||
| 310 | M | DTAfl/wt//Glast-CreERTtg/wt + Tamoxifen | 11 dpa | |||
| 220 | F | DTAfl/wt//Glast-CreERTtg/wt + Tamoxifen | 28 dpa | n= 3 (28 dpa) | ||
| 217 | M | DTAfl/wt//Glast-CreERTtg/wt + Tamoxifen | 28 dpa | |||
| 4631 | F | DTAfl/wt//Glast-CreERTtg/wt + Tamoxifen | 28 dpa | |||
| Supp. Fig. 4 | a | 4902 | M | DTAwt/wt//Glast-CreERTtg/wt + Tamoxifen | 1 dpa | |
| 4519 | M | DTAfl/wt//Glast-CreERTtg/wt + Tamoxifen | 3 dpa | |||
| Supp. Fig. 5 | 4225 | M | DTAwt/wt//Glast-CreERTtg/wt + Tamoxifen | 1 dpa | ||
| 4223 | F | DTAfl/wt//Glast-CreERTtg/wt + Tamoxifen | 1 dpa | |||
| 4519 | M | DTAfl/wt//Glast-CreERTtg/wt + Tamoxifen | 3 dpa | |||
| 314 | F | DTAfl/wt//Glast-CreERTtg/wt + Tamoxifen | 11 dpa | |||
| 4863 | M | DTAfl/wt//Glast-CreERTtg/wt + Tamoxifen | 28 dpa | |||
| Supp.Fig. 6 | a | 2794 | M | DTAwt/wt//Glast-CreERTtg/wt + Tamoxifen | 3 dpa | |
| b | 537 | M | DTAfl/wt//Glast-CreERTwt/wt + Tamoxifen | 5 dpa | ||
| 4519 | M | DTAfl/wt//Glast-CreERTtg/wt + Tamoxifen | 3 dpa | |||
| 305 | M | DTAfl/wt//Glast-CreERTtg/wt + Tamoxifen | 11 dpa | |||
| 4631 | F | DTAfl/wt//Glast-CreERTtg/wt + Tamoxifen | 28 dpa | |||
| Supp.Fig. 7 | c | 2794 | M | DTAwt/wt//Glast-CreERTtg/wt + Tamoxifen | 3 dpa | |
| 4287 | F | DTAfl/wt//Glast-CreERTtg/wt + Tamoxifen | 1 dpa | |||
| 2799 | M | DTAfl/wt//Glast-CreERTtg/wt + Tamoxifen | 3 dpa | |||
| 535 | F | DTAfl/wt//Glast-CreERTtg/wt + Tamoxifen | 5 dpa | |||
| In-text (Results Section 3.7) | Ki67 | 897 | M | DTAfl/wt//Glast-CreERTwt/wt + Tamoxifen | 2 hpa | n=10 (control) |
| 0043 | F | DTAfl/wt//Glast-CreERTwt/wt + Tamoxifen | 1 dpa | |||
| 4224 | M | DTAfl/wt//Glast-CreERTwt/wt + Tamoxifen | 3 dpa | |||
| 4225 | M | DTAfl/fl//Glast-CreERTwt/wt + Tamoxifen | 1 dpa | |||
| 4233 | M | DTAfl/wt//Glast-CreERTwt/wt + Tamoxifen | 1 dpa | |||
| 4287 | M | DTAfl/wt//Glast-CreERTwt/wt + Tamoxifen | 1 dpa | |||
| 2794 | M | DTAwt/wt//Glast-CreERTtg/wt + Tamoxifen | 3 dpa | |||
| 3359 | M | DTAwt/wt//Glast-CreERTtg/wt + Tamoxifen | 3 dpa | |||
| 3360 | F | DTAwt/wt//Glast-CreERTtg/wt + Tamoxifen | 3 dpa | |||
| 4864 | M | DTAfl/wt//Glast-CreERTwt/wt + Tamoxifen | 28 dpa | |||
| 893 | F | DTAfl/wt//Glast-CreERTtg/wt + Tamoxifen | 2 hpa | n=3 (2 hpa) | ||
| 895 | M | DTAfl/wt//Glast-CreERTtg/wt + Tamoxifen | 2 hpa | |||
| 892 | M | DTAfl/wt//Glast-CreERTtg/wt + Tamoxifen | 2 hpa | |||
| 309 | F | DTAfl/wt//Glast-CreERTtg/wt + Tamoxifen | 6 hpa | n=3 (6 hpa) | ||
| 868 | M | DTAfl/wt//Glast-CreERTtg/wt + Tamoxifen | 6 hpa | |||
| 723 | F | DTAfl/wt//Glast-CreERTtg/wt + Tamoxifen | 6 hpa | |||
| 0046 | M | DTAfl/wt//Glast-CreERTtg/wt + Tamoxifen | 1 dpa | n=3 (1 dpa) | ||
| 3497 | F | DTAfl/wt//Glast-CreERTtg/wt + Tamoxifen | 1 dpa | |||
| 4221 | F | DTAfl/wt//Glast-CreERTtg/wt + Tamoxifen | 1 dpa | |||
| 4223 | F | DTAfl/wt//Glast-CreERTtg/wt + Tamoxifen | 1 dpa | |||
| 2799 | M | DTAfl/wt//Glast-CreERTtg/wt + Tamoxifen | 3 dpa | n=5 (3 dpa) | ||
| 3352 | M | DTAfl/wt//Glast-CreERTtg/wt + Tamoxifen | 3 dpa | |||
| 3357 | F | DTAfl/wt//Glast-CreERTtg/wt + Tamoxifen | 3 dpa | |||
| 3365 | F | DTAfl/wt//Glast-CreERTtg/wt + Tamoxifen | 3 dpa | |||
| 4519 | M | DTAfl/wt//Glast-CreERTtg/wt + Tamoxifen | 3 dpa | |||
| 535 | F | DTAfl/wt//Glast-CreERTtg/wt + Tamoxifen | 5 dpa | n=3 (5 dpa) | ||
| 536 | M | DTAfl/wt//Glast-CreERTtg/wt + Tamoxifen | 5 dpa | |||
| 538 | M | DTAfl/wt//Glast-CreERTtg/wt + Tamoxifen | 5 dpa | |||
| 305 | M | DTAfl/wt//Glast-CreERTtg/wt + Tamoxifen | 11 dpa | n=3 (11 dpa) | ||
| 310 | M | DTAfl/wt//Glast-CreERTtg/wt + Tamoxifen | 11 dpa | |||
| 314 | F | DTAfl/wt//Glast-CreERTtg/wt + Tamoxifen | 11 dpa | |||
| 4624 | M | DTAfl/wt//Glast-CreERTtg/wt + Tamoxifen | 28 dpa | n=4 (28 dpa) | ||
| 4631 | F | DTAfl/wt//Glast-CreERTtg/wt + Tamoxifen | 28 dpa | |||
| 4836 | M | DTAfl/wt//Glast-CreERTtg/wt + Tamoxifen | 28 dpa | |||
| 4865 | M | DTAfl/wt//Glast-CreERTtg/wt + Tamoxifen | 28 dpa | |||
| BrdU | 897 | M | DTAfl/wt//Glast-CreERTwt/wt + Tamoxifen | 2 hpa | n=9 (control) | |
| 319 | F | DTAwt/wt//Glast-CreERTtg/wt + Tamoxifen | 6 hpa | |||
| 4224 | M | DTAfl/wt//Glast-CreERTwt/wt + Tamoxifen | 3 dpa | |||
| 4225 | M | DTAfl/fl//Glast-CreERTwt/wt + Tamoxifen | 1 dpa | |||
| 4287 | F | DTAfl/wt//Glast-CreERTwt/wt + Tamoxifen | 1 dpa | |||
| 2794 | M | DTAwt/wt//Glast-CreERTtg/wt + Tamoxifen | 3 dpa | |||
| 3359 | M | DTAwt/wt//Glast-CreERTtg/wt + Tamoxifen | 3 dpa | |||
| 3360 | F | DTAwt/wt//Glast-CreERTtg/wt + Tamoxifen | 3 dpa | |||
| 537 | M | DTAfl/wt//Glast-CreERTwt/wt + Tamoxifen | 5 dpa | |||
| 893 | F | DTAfl/wt//Glast-CreERTtg/wt + Tamoxifen | 2 hpa | n=3 (2 hpa) | ||
| 895 | M | DTAfl/wt//Glast-CreERTtg/wt + Tamoxifen | 2 hpa | |||
| 892 | M | DTAfl/wt//Glast-CreERTtg/wt + Tamoxifen | 2 hpa | |||
| 309 | F | DTAfl/wt//Glast-CreERTtg/wt + Tamoxifen | 6 hpa | n=3 (6 hpa) | ||
| 868 | M | DTAfl/wt//Glast-CreERTtg/wt + Tamoxifen | 6 hpa | |||
| 723 | F | DTAfl/wt//Glast-CreERTtg/wt + Tamoxifen | 6 hpa | |||
| 0046 | M | DTAfl/wt//Glast-CreERTtg/wt + Tamoxifen | 1 dpa | n=3 (1 dpa) | ||
| 3497 | F | DTAfl/wt//Glast-CreERTtg/wt + Tamoxifen | 1 dpa | |||
| 4221 | F | DTAfl/wt//Glast-CreERTtg/wt + Tamoxifen | 1 dpa | |||
| 4223 | F | DTAfl/wt//Glast-CreERTtg/wt + Tamoxifen | 1 dpa | |||
| 2799 | M | DTAfl/wt//Glast-CreERTtg/wt + Tamoxifen | 3 dpa | n=5 (3 dpa) | ||
| 3352 | M | DTAfl/wt//Glast-CreERTtg/wt + Tamoxifen | 3 dpa | |||
| 3357 | F | DTAfl/wt//Glast-CreERTtg/wt + Tamoxifen | 3 dpa | |||
| 3365 | F | DTAfl/wt//Glast-CreERTtg/wt + Tamoxifen | 3 dpa | |||
| 4519 | M | DTAfl/wt//Glast-CreERTtg/wt + Tamoxifen | 3 dpa | |||
| 535 | F | DTAfl/wt//Glast-CreERTtg/wt + Tamoxifen | 5 dpa | n=3 (5 dpa) | ||
| 536 | F | DTAfl/wt//Glast-CreERTtg/wt + Tamoxifen | 5 dpa | |||
| 538 | M | DTAfl/wt//Glast-CreERTtg/wt + Tamoxifen | 5 dpa | |||
| Supp. Fig. 8 | a | 4228 | M | DTAfl/wt//Glast-CreERTtg/wt + Tamoxifen | 1 dpa | |
| 868 | M | DTAfl/wt//Glast-CreERTtg/wt + Tamoxifen | 6 hpa | |||
| 305 | M | DTAfl/wt//Glast-CreERTtg/wt + Tamoxifen | 11 dpa | |||
| 4863 | M | DTAfl/wt//Glast-CreERTtg/wt + Tamoxifen | 28 dpa |
Figure 1.
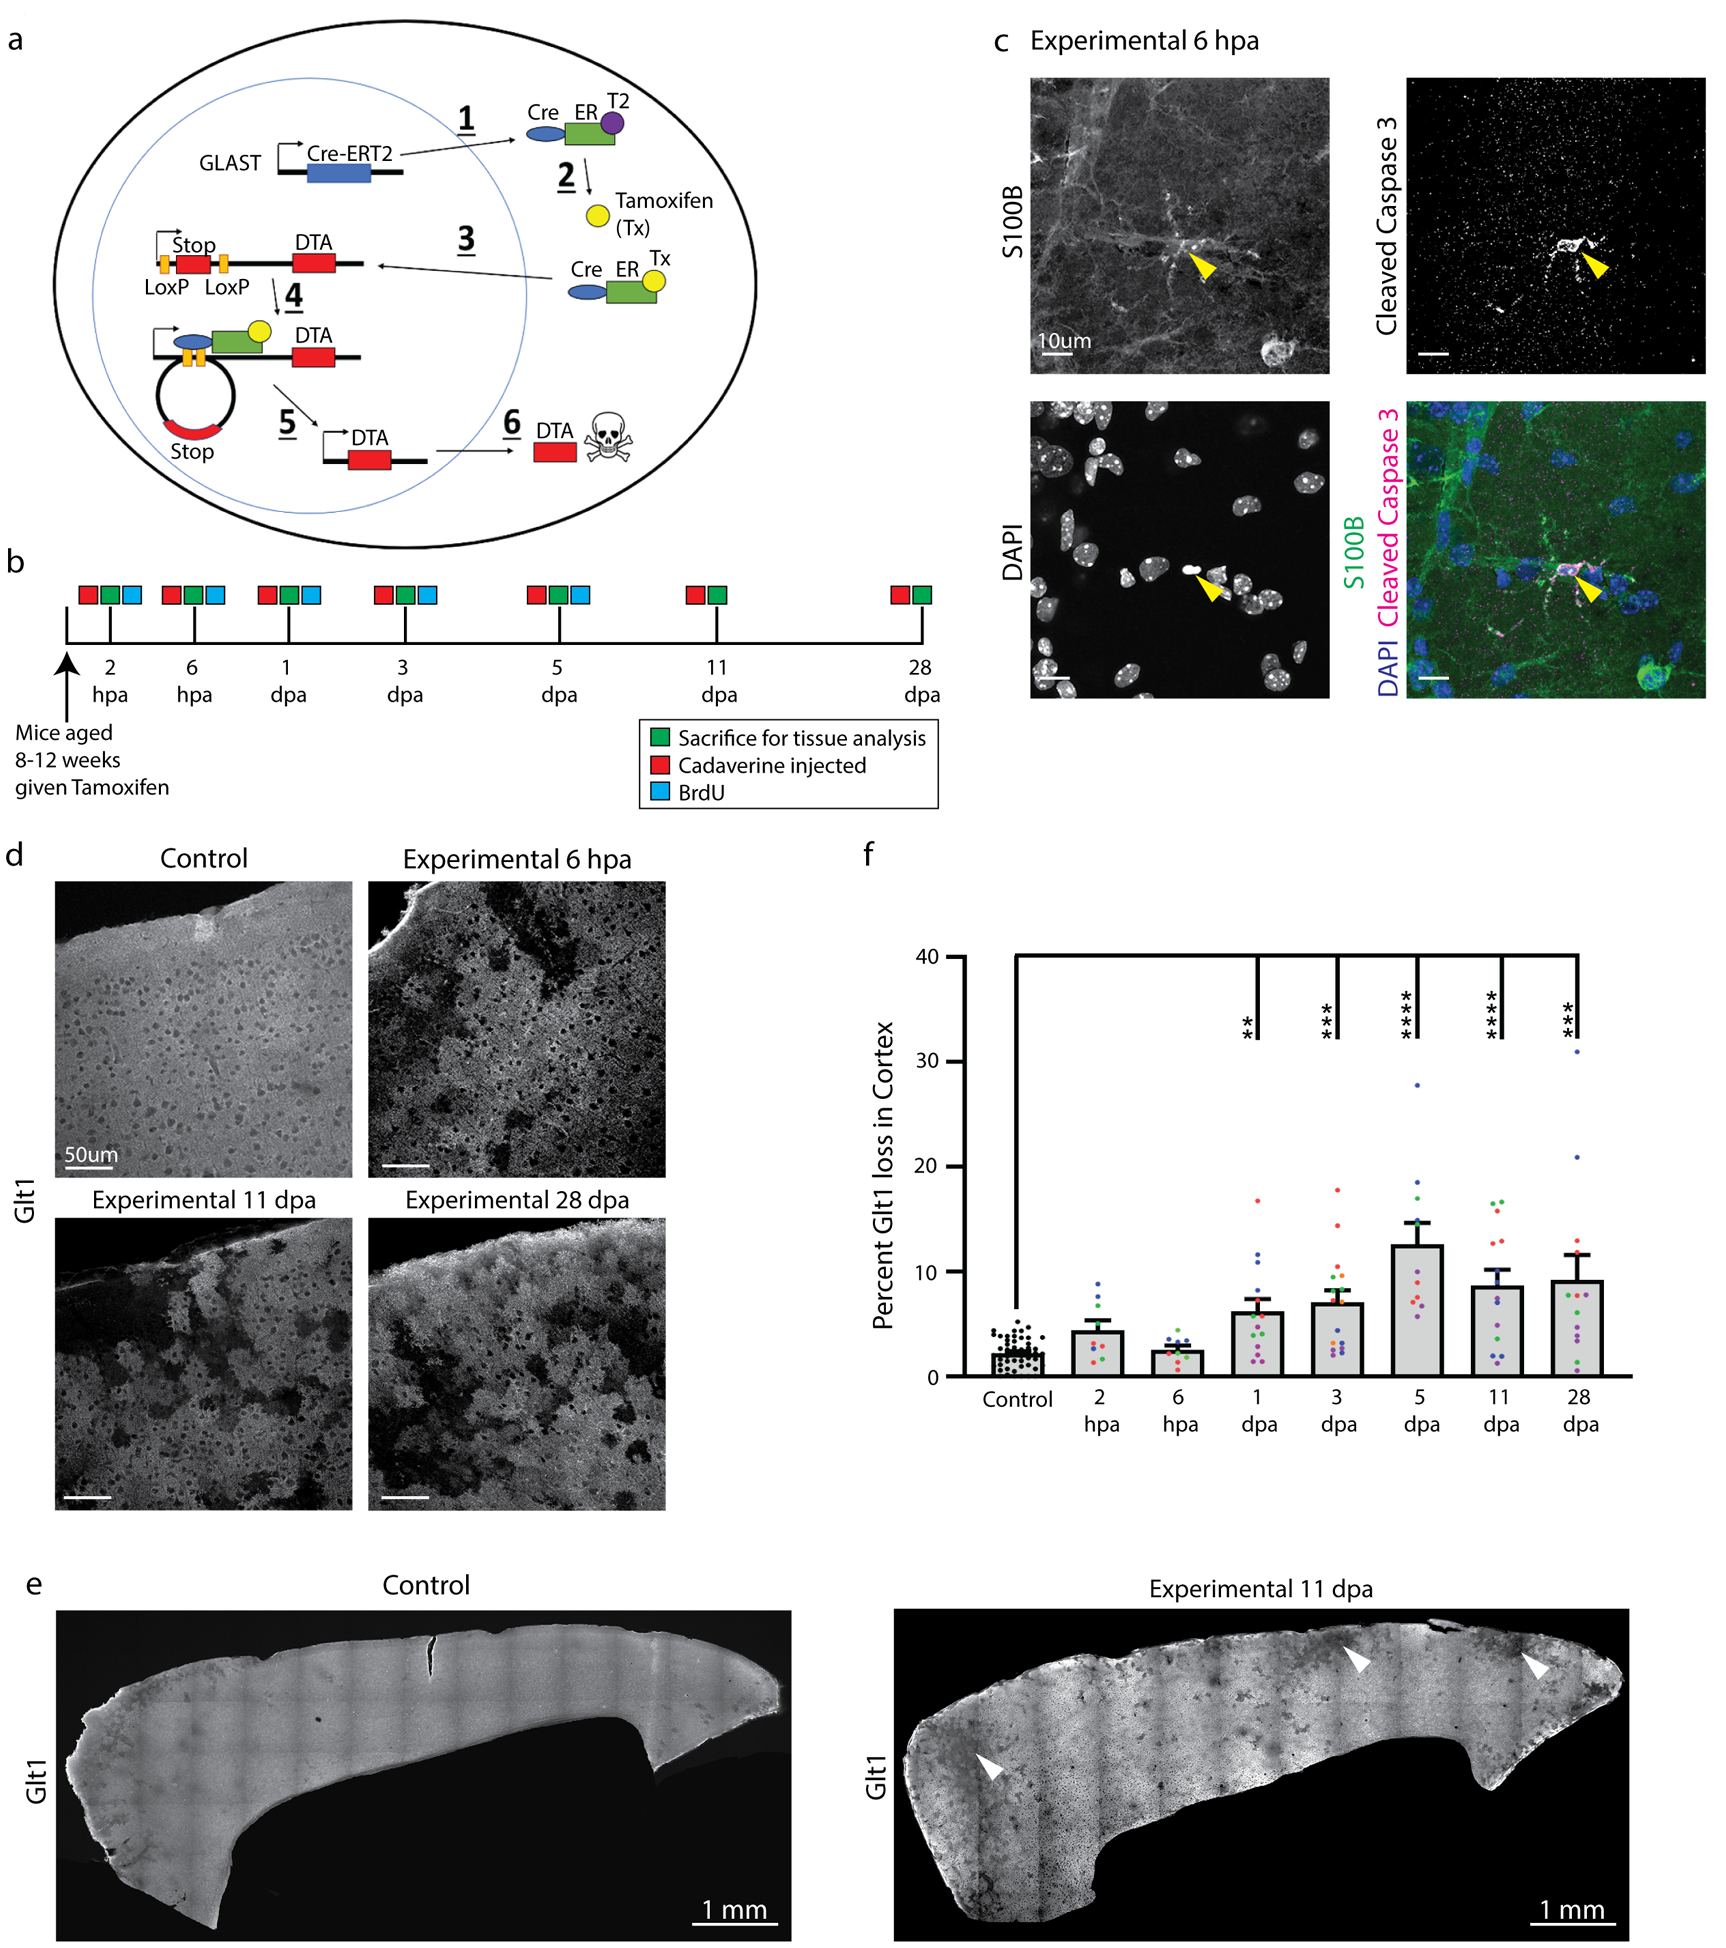
Astrocyte ablation occurred within hours after Tamoxifen administration. a. Astrocytes were ablated in mice using a cre-inducible system expressing diptheria toxin fragment fragment a (DTA) after a stop cassette flanked by loxP sites: 1) Cre recombinase coupled to an estrogen receptor was expressed behind the astrocyte glutamate transporter GLAST. 2) Tamoxifen was administered and binded to this estrogen receptor, enabling 3) translocation of cre into the nucleus where 4) recombination at LoxP sites excised the stop sequence in front of DTA and 5) enabled DTA transcription and translation. 6) DTA halted protein translation and led to apoptotic cell death. b. Mice were sacrificed at multiple timepoints between 2 hours and 28 days after tamoxifen administration to determine the timeline and extent of astrocyte ablation. Some animals were also injected with Cadaverine and/or BrdU. c. Some astrocytes in DTAfl/wt//Glast-CreERTtg/wt mice colocalized with the apoptotic marker cleaved caspase 3 shortly after tamoxifen administration (arrowhead). d. Loss of the astrocyte marker Glt1 indicating cell ablation occurred only in DTAfl/wt//Glast-CreERTtg/wt mice several hours after tamoxifen administration and continued up to 28 days later, while no Glt1 loss was detected at any timepoint in DTAfl/wt//Glast-CreERTwt/wt or DTAwt/wt//Glast-CreERTtg/wt mice given tamoxifen. e. The percentage of Glt1-negative areas were quantified in the cortical gray matter per slice across all timepoints. Slices from the same animal were plotted in the same color. (Control: 2.201 ± 0.198, n= 51; 2 hpa: 4.426 ± 0.9110, n= 9; 6 hpa: 2.540 ± 0.4053, n= 9; 1 dpa: 6.190 ± 1.183, n= 14; 3 dpa: 7.051 ± 1.157, n= 16; 5 dpa: 12.620 ± 2.026, n= 11; 11 dpa: 8.687 ± 1.485, n= 14; 9.219 ± 2.360, n= 13) Dunn’s Multiple comparisons test. (Control vs. 1 dpa, p= 0.0044; Control vs. 3 dpa, p= 0.0002; Control vs. 5 dpa, p < 0.0001; Control vs. 11 dpa, p < 0.0001; Control vs. 28 dpa, p= 0.0004). f. Glt1 loss indicative of astrocyte ablation occurred across the cortex in DTAfl/wt//Glast-CreERTtg/wt mice after tamoxifen administration (arrowheads). DTAfl/wt//Glast-CreERTwt/wt or DTAwt/wt//Glast-CreERTtg/wt mice showed only a few “Glt1-low regions” along blood vessels. In these stitched images, the frontal cortex is on the left side.
Experimental mice had the following genotype: DTAfl/wt//Glast-CreERTtg/w, and received a single dose of Tamoxifen. Controls were as follows: 1. Some DTAfl/wt//Glast-CreERTtg/wt mice received carrier solution only, which lacked tamoxifen. 2. Mice lacking either the DTA or the Glast-CreERT allele (DTAfl/wt//Glast-CreERTwt/wt or DTAwt/wt//Glast-CreERTtg/wt) received Tamoxifen. 3. Naive DTAfl/wt//Glast-CreERTtg/wt mice received no treatment. No differences between control groups were detected and controls were hence pooled for analysis.
54 experimental (DTAfl/wt//Glast-CreERTtg/wt) and 76 control mice (DTAfl/wt//Glast-CreERwt/wt or DTAwt/wt//Glast-CreERTtg/wt) received a single dose of Tamoxifen at 8–12 weeks of age. Mice were injected with a lethal dose of Ketamine (100 mg/kg) /Xylazine (10 mg/kg) followed by transcardial perfusion for subsequent histology at 2 and 6 hours post ablation (hpa) as well as 1, 3, 5, 11 and 28 days post ablation (dpa) (Fig. 1b). Some mice were injected retro-orbitally with Cadaverine to assess blood-brain barrier integrity.
2.3. Tamoxifen administration
Tamoxifen (Sigma, cat #T6548) was dissolved at 40 mg/mL in a mixture of 10% 200-proof ethanol and 90% Corn oil (Sigma, cat #C2867) for 2 h while shaking at 37°C. The tamoxifen solution was administered via oral gavage at 330 mg/kg once.
2.4. Cadaverine/Dextran administration
To assess blood-brain barrier function Cadaverine conjugated to Alexa Fluor A555 (950 Da,1 mg; Invitrogen, Catalog #A30677) was injected into the retro-orbital sinus of each mouse. Cadaverine (1 mg) was dissolved in 300 uL of sterile saline. Each mouse was injected with a volume of 100 uL (0.33 mg). Some mice were injected retro-orbitally with a 10 kDa dextran coonjugated to Alexa Fluor 555 (5 mg, Invitrogen, Catalog #D34679) also at a volume of 100 uL (0.33 mg). Mice were perfused transcardially with Phospho-Buffered Saline (PBS) followed by 4% paraformaldehyde (PFA) 30 minutes after Cadaverine or dextran injection.
2.5. BrdU administration
For the assessment of astrocyte proliferation, intraperitoneal injections of BrdU/saline (50μg/g body weight) were administered to experimental and control mice twice daily for 5 days, starting on the day of Tx administration. Mice were sacrificed at 2 hpa, 6 hpa, 1 dpa, 3 dpa, or 5 dpa. For the 28 dpa timepoint, mice were injected with BrdU twice daily starting from 14 dpa up to 28 dpa.
2.6. Histology
Brains were collected after transcardial perfusion and post-fixed in 4% PFA overnight. Sagittal slices were cut at 50 μm thickness using a vibratome (Campden 5100mz). Immunohistochemistry used the primary antibodies (listed in Table 2) in PBS with 10% goat serum 0.5% Triton X-100 at 4°C overnight. Slices were washed in PBS and incubated in secondary antibody (listed in Table 2) solution of PBS with 10% goat serum and 0.5% Triton X-100 for 1–2 h at room temperature. 4,6-diamidino-2-phenylindole (DAPI) was included in the secondary antibody solution as needed. Slices were washed in PBS three times for ten minutes each and then mounted onto glass microscope slides with Aqua Poly/Mount (Polysciences, catalog #18606).
Table 2.
Antibodies used in experiments.
| Primary Antibodies | ||||||
|---|---|---|---|---|---|---|
| Name | Manufacturer | Catalog # | RRID | Species Raised in | Monoclonal/Polyclonal | Concentration |
| S100β | Sigma Aldrich | S2532 | AB_477499 | Mouse | Monoclonal | 1 : 1000 |
| Glt1 | Millipore | AB1783 | AB_90949 | Guinea pig | Polyclonal | 1 : 1000 |
| GFAP | Millipore | AB5541 | AB_177521 | Chicken | Polyclonal | 1 : 1000 |
| Ki67 | Thermo Fisher | RM-9106-S1 | AB_149792 | Rabbit | Monoclonal | 1 : 1000 |
| BrdU | Abcam | ab6326 | AB_305426 | Rat | Monoclonal | 1 : 500 |
| Cleaved Caspase 3 | Cell Signaling Technology | 9661 | AB_2341188 | Rabbit | Polyclonal | 1 : 1000 |
| Sox-9 | Millipore | AB5535 | AB_2239761 | Rabbit | Polyclonal | 1 : 1000 |
| Fibrinogen | Agilent | A008002 | AB_578481 | Rabbit | Polyclonal | 1 : 500 |
| ZO-1 | Abcam | ab96587 | AB-18.0006 | Rabbit | Polyclonal | 1 : 100 |
| pSTAT3 | Cell Signaling Technology | #9145S | AB_2491009 | Rabbit | Monoclonal | 1:100 |
| Iba1 | Wako | #09–19741 | AB_839504 | Rabbit | Polyclonal | 1:1000 |
| Aquaporin-4 (AQ4) | Sigma Aldrich | A5971 | AB_258270 | Rabbit | Polyclonal | 1:400 |
| Secondary Antibodies | ||||||
| Name | Manufacturer | Catalog # | RRID | Species Raised in | Monoclonal/Polyclonal | Concentration |
| Chicken Alexa-488 | Jackson Immuno Research | 703-546-155 | AB_2340376 | Donkey | Polyclonal | 1 : 1000 |
| Rabbit Alexa-488 | Jackson Immuno Research | 111-546-144 | AB_2338057 | Donkey | Polyclonal | 1 : 1000 |
| Mouse Alexa-488 | Jackson Immuno Research | 115-546-003 | AB_2338859 | Goat | Polyclonal | 1 : 1000 |
| Rat Alexa-488 | Jackson Immuno Research | 112-546-003 | AB_2338364 | Goat | Polyclonal | 1 : 1000 |
| Guinea pig Alexa-647 | Jackson Immuno Research | 106-606-003 | AB_2337449 | Goat | Polyclonal | 1 : 1000 |
| Dyes | ||||||
| Name | Manufacturer | Catalog # | RRID | Species Raised in | Monoclonal/Polyclonal | Concentration |
| DAPI | ThermoFisher | D1306 | AB_2629482 | N /A | N /A | 1 : 1000 |
| Alexa-555 Cadaverine | ThermoFisher | A30677 | N/A | N/A | N/A | 0.33mg/mouse |
| Alexa-555 Dextran, 10,000 MW | ThermoFisher | D34679 | N/A | N/A | N/A | 0.33mg/mouse |
| NeuroTrace 500/525 Green Fluorescence Nissl | ThermoFisher |
N21480 |
N/A | N/A | N/A | 1:100 |
For immunohistochemistry against BrdU, antigen retrieval was performed using 1x citrate buffer (pH 6.0,Thermo Fisher, Catalog #005000) at 95°C for 20 minutes followed by incubation in primary antibody solution overnight at 4°C. This was followed by one 10 minute wash in 0.5% Triton X/ PBS and two 10 minute washes in PBS. Slices were mounted on glass slides, covered with Aqua Poly/Mount and a glass coverslip. Slices stained for phosphorylated Stat-3 underwent antigen retrieval in 10 mM Tris-HCl, 1 mM EDTA at pH 9.0 at 90°C for 20 minutes. Slices were washed in PBS for 1 hour before incubating in primary antibody solution overnight at 4°C.
For tight junction (ZO-1) staining, slices were subjected to antigen retrieval using 100 mg pepsin in 10mM hydrochloric acid (HCl) for 20 minutes at 37°C. Next, slices were washed twice in PBST (PBS with 150 uL L−1 Tween-20) and then incubated in 3% H2O2 for 10 minutes. Finally, slices were washed 3 times in PBS for ten minutes each and then incubated in primary antibody solution for a minimum of 48 hours at 4°C.
For Nissl staining, slices were washed in PBS for 10 minutes following initial primary and secondary incubation steps. Slices were then washed in PBS with 0.5% Triton X/PBS for 10 minutes, followed by an additional 10 minute wash. Slices were then incubated in a solution of PBS diluted at 1:100 with NeuroTrace 500/525 green fluorescent Nissl stain (Invitrogen, Catalog #N21480) for 20 minutes, followed by another 10 minute wash in 0.5% Triton X/PBS. Finally, slices were washed twice for 10 minutes each in PBS and mounted.
Images of mice were taken using a Nikon A1R confocal microscope with Nikon 4x, 10x or 20x air objectives or Nikon Apo 40x/1.30 and 60x/1.40 oil immersion objectives.
2.7. Data Analysis
2.7.1. Quantification of astrocyte loss
Astrocyte loss was assessed in the cortical gray matter of experimental and control mice using immunohistochemistry against the astrocytic glutamate transporter Glt1, which is expressed in the fine processes in all astrocytes. Large image scans were taken of the cortex and/or hippocampus using a 20x objective and 2x line averaging at a single step position. Images were stitched together using optimal path stitching with 5% overlap. Line averaging was crucial to reduce grid lines where images overlap. Three to five sagittal slices per animal and 3 mice per group were imaged for quantification. In the figures that show entire cortex scans, the frontal cortex is situated on the left side. Areas that lacked Glt1 labeling were identified after binarization of the image using set thresholding parameters in ImageJ. The binarized image was then processed using the “fill holes” feature to consolidate Glt1 loss areas into discrete shapes. Finally, Glt1 loss regions were found by setting consistent size and circularity parameters that excluded spaces covered by blood vessels and neurons from being recognized as “Glt1-free”. (Suppl. Fig. 1). Glt1 loss was calculated as a percentage of the total cortex area in each slice and was plotted with each data point representing one slice. Data points of slices from the same animal were plotted using the same color, different colors represent data points from different mice.
2.7.2. Quantification of Cadaverine leakage
Cadaverine is coupled to the fluorescent dye Alexa Fluor 550 (A550) and is excluded from the brain parenchyma by the functional BBB. BBB leakiness permits the dye to cross into the brain, where neurons take it up. Large image scans of the cortex were taken using a 10x objective and images were stitched together using optimal path stitching with 5% overlap. Five slices were imaged per animal. Cadaverine+ regions were included in quantification upon meeting the following criteria: 1) Cadaverine cells were brighter than the background, 2) were clustered in close proximity to each other, and 3) each drawn region of interest (ROI) consisted of at least 10 Cadaverine+ cells. Cadaverine leakage area was calculated as a percentage of the total cortex area in each slice and was plotted by slice.
2.7.3. Quantification of astrocyte process length and volume
To determine if astrocytes adjacent to ablated neighbors respond by changing their morphology, we employed the Simple Neurite Tracer (Longair, Baker, & Armstrong, 2011) in Fiji/ImageJ in order to create a 3D representation of an astrocyte and its processes. Total process length and volume of GFAP+ astrocyte processes were measured and compared, and Sholl analysis was employed to determine astrocyte process complexity. Early (1 dpa), middle (11 dpa) and late (28 dpa) timepoints were examined in three mice per timepoint. Sample size for each group was n=15 astrocytes. Five astrocytes were located across at least three different slices for each animal, and these three slices were chosen to represent different areas of the cortex. GFAP expression was used to analyze astrocytes and their major process length and thickness, and Glt-1 was used to confirm loss areas in the experimental mice.
2.7.4. Polarity quantification
To investigate the polarity of the astrocytes adjacent to areas of loss, we first identified the relevant area of loss and drew a line between the two ends of this loss (Line 1). From the center of Line 1, Line 2 (the bisector) was drawn through the center of the soma of the astrocyte and extended to the end of the longest process in that direction. Next, Line 3 was drawn perpendicular to Line 2, and it also went through the center of the soma of the astrocyte and extended to the end of the longest process in that direction. Line 2 and Line 3 served to divide the astrocyte into quadrants, with the more proximal quadrants being the ones directly adjacent to the relevant loss area while the distal quadrants were the ones further removed from the loss.
Additional lines were added to enclose the quadrants, which were all centered at the astrocyte soma. The area of the two proximal quadrants and the area of the two distal quadrants was determined. The ratio of the distal area to the proximal area was then calculated, in order to provide information about the polarity of the astrocyte in relation to the relevant area of loss. The ratio of width (Line 3) to length (Line 2) was also calculated, in order to provide further polarity information.
For control astrocytes that lacked any relevant area of loss to draw Line 1, a random number generator between 1 and 360 was used to determine the angle at which Line 1 would be drawn. From there, the same protocol from above was followed in order to divide the control astrocytes into four quadrants. The ratio of the proximal area to the distal area and the ratio of width to length was calculated for these astrocytes as well.
2.7.5. Quantification of astrocyte proliferation
Astrocyte proliferation was quantified using immunohistochemistry against the cell cycle protein Ki67 across all timepoints or BrdU labeling at 2 hpa, 6 hpa, 1 dpa, 3 dpa, and 5 dpa. To quantify the number of Ki67+ astrocytes, 1 confocal image was taken in 3–5 different slices per animal, 3 mice per group. To quantify the number of BrdU+ astrocytes, 1 confocal image was taken in 3–5 different slices per animal, 3 mice per group. For experimental mice, images were taken in areas adjacent to Glt1 loss. For control mice, one image each was taken in the frontal, medial, and lateral regions of cortex. Regions surrounding large penetrating arteries were avoided in both groups because Glt1 expression levels are sometimes reduced in directly adjacent astrocytes, even in controls. Confocal images had a z-step size of 1μm. Stacks spanned the entire slice and were quantified step-by-step using the cell counter tool in ImageJ. Cells that co-labeled for S100β, DAPI and Ki67 or S100β, DAPI and BrdU were considered proliferating astrocytes.
2.7.6. Quantification of ZO-1 expression
Expression of the tight junction protein ZO-1 was quantified in ImageJ. ZO-1 images were binarized based on intensity and size and resulting masks were overlaid onto corresponding images of the marker CD31 that labels endothelial cells. A line was drawn along the CD31+ blood vessels, and the generated plot profile represented ZO-1-positive pixels as “1”, and pixels lacking ZO-1 as “0”. The plot profile data was used to calculate the percent of pixels in the drawn line that lacked ZO-1. Using the known pixel dimensions, this measurement could be converted into length of ZO-1 coverage in micrometers and was reported per animal as percent of vessel lacking ZO-1. 3–5 confocal images were taken in 3–5 different slices, 3 mice per group. Images were plotted for each group. The experimental mice were examined along early (6 hpa), middle (11 dpa) and late (28 dpa) timepoints. Images for experimental mice were taken in regions lacking Glt1. For the same ZO-1 images, fluorescence intensity was also measured and plotted per image.
2.7.7. Quantification of GLUT1 expression
We measured fluorescence intensity of the protein Glucose Transporter 1 (GLUT1) expression in blood vessels within regions of astrocyte ablation. Mean fluorescence intensity of GLUT1 was measured using ImageJ. As above, Glt1 was used to confirm regions of astrocyte ablation. Images for experimental mice were taken in areas lacking Glt1. 3 confocal images were taken in 3–5 different slices, 3 mice per group, and individual mice were plotted. The experimental mice were examined along early (6 hpa), middle (11 dpa) and late (28 dpa) timepoints.
2.7.8. Quantification of Sox9+ cells per mm3
The number of Sox9+ cells present in astrocyte ablation regions lacking Glt1 was quantified using the Image J cell counter in combination with the voxel counter plugin. To calculate the volume of the region lacking astrocytes, the Glt1 channel was thresholded to exclude Glt+ regions. Consistent size and circularity parameters were used during this thresholding step to exclude blood vessels and neurons that also lack Glt1. A region of interest (ROI) was then drawn around the resulting Glt1-negative region and run through the voxel counter plugin, giving the total volume of this region in μm3, which was converted to mm3. The cell counter was then used to count Sox9+ cells only within the ROI drawn around this Glt-negative region. The number of cells was divided by the total volume to give Sox9+ cells/mm3. For controls, no thresholding was performed and volume and cell counts were acquired for the entire image. 3–5 confocal images were taken in 3–5 different slices, 3 mice per group, and individual images were plotted. The experimental mice were examined along early (6 hpa), middle (11 dpa) and late (28 dpa) timepoints.
2.7.9. Quantification of AQ4 expression
AQ4 expression in astrocyte ablation regions was quantified by measuring the average grayscale value of AQ4 in regions lacking Glt1. In the same image, we also measured the average grayscale value of AQP4 in the surrounding Glt-positive regions as a comparison. These measurements were repeated for each image, with 3–5 confocal images taken in 3–5 different slices and 3 mice per group. Values obtained from each image were plotted. As above, early (6 hpa), middle (11 dpa), and late (28 dpa) timepoints were examined.
2.8. Behavioral tests
2.8.1. Rotarod performance test
The rotarod test was used to assess motor coordination and balance of mice immediately before and at 5, 11, and 28 days after tamoxifen administration. In this test, mice naturally walk forward to avoid falling off the rotating cylinder. The cylinder began at a slow rotational speed of 4 rotations per minute (rpm) and gradually accelerated over the course of 5 minutes to a maximum rpm of 40. When the mice fell, they landed on a platform that stopped a timer, and this latency to fall was recorded in seconds. Mice were allowed a practice run to acclimate to the cylinder. Mice that fell off the cylinder within ten seconds of placement due to failure to properly attach to the cylinder were allowed to restart. If a mouse almost fell, only to cling onto the cylinder and ride it for the remainder of the test, this was considered a “fall”.
2.8.2. Open field test
The open field test was used to assess general locomotion of mice immediately before and at 5, 11, and 28 days after tamoxifen administration. Mice were habituated to the testing room and lighting conditions for 30 minutes prior to testing. Mice were placed in a 40 cm × 40 cm square box and their movement was automatically tracked using a video camera connected to AnyMaze 6.1 computer software. Each open field session lasted 5 minutes, and the box surface was disinfected between each mouse. Total distance travelled was measured in meters. The box surface was divided in the computer program into two zones: a center zone of 28 cm × 28 cm and an outer perimeter zone. The time spent in each zone was measured.
2.9. Statistics
Statistics were calculated and graphed using GraphPad Prism 8 (GraphPad Software). Statistics not reported in text or in figure legends can be found in Table 3. Data groups were considered significantly different at p≤0.05. Data were tested for Gaussian distribution using the Kolmogorov–Smirnov (KS) normality test. Statistical tests were chosen accordingly and are specified in the results section or figure legends. Data values are reported as mean with standard error of the mean (SEM). Scatter plots reflect individual values and bar graphs reflect the mean with SEM. In graphs with slices plotted, slices from the same animal were plotted as dots of the same color, and different colors represent data points from different mice. Statistical significance is indicated with *p≤0.05, **p≤ 0.01, ***p≤ 0.001, **** p≤ 0.0001.
Table 3.
Statistics and significance test results
| Figure 1e | Kruskal-Wallis test, significant difference for genotype of animals given tamoxifen and post-administration timepoint (p< 0.001). N is sample number. | |||||
| Dunn’s multiple comparisons test | Mean rank diff. | Significant? | Summary | Adjusted P value | ||
| Control vs. 2 hpa | −27.54 | No | ns | 0.3851 | ||
| Control vs. 6 hpa | −6.536 | No | ns | >0.9999 | ||
| Control vs. 1 dpa | −40.98 | Yes | ** | 0.0044 | ||
| Control vs. 3 dpa | −47.23 | Yes | *** | 0.0002 | ||
| Control vs. 5 dpa | −74.43 | Yes | **** | <0.0001 | ||
| Control vs. 11 dpa | −52.05 | Yes | **** | <0.0001 | ||
| Control vs. 28 dpa | −49.98 | Yes | *** | 0.0004 | ||
| Test details | Mean 1 | SEM 1 | Mean 2 | SEM 2 | N1 | N2 |
| Control vs. 2 hpa | 2.201 | 0.1989 | 4.426 | 0.9110 | 51 | 9 |
| Control vs. 6 hpa | 2.201 | 0.1989 | 2.540 | 0.4053 | 51 | 9 |
| Control vs. 1 dpa | 2.201 | 0.1989 | 6.190 | 1.183 | 51 | 14 |
| Control vs. 3 dpa | 2.201 | 0.1989 | 7.051 | 1.157 | 51 | 16 |
| Control vs. 5 dpa | 2.201 | 0.1989 | 12.620 | 2.026 | 51 | 11 |
| Control vs. 11 dpa | 2.201 | 0.1989 | 8.687 | 1.485 | 51 | 14 |
| Control vs. 28 dpa | 2.201 | 0.1989 | 9.219 | 2.360 | 51 | 13 |
| Figure 2b | One-way ANOVA, significant difference for genotype and post-administration timepoint (p<0.0001). N is sample number. | |||||
| Tukey’s multiple comparisons test | Mean Diff | Significant | Summary | Adjusted p value | ||
| Control vs. 2 hpa | −1.188 | No | Ns | 0.9996 | ||
| Control vs. 6 hpa | −3.659 | No | Ns | 0.6368 | ||
| Control vs. 1 dpa | −7.703 | Yes | ** | 0.0019 | ||
| Control vs. 3 dpa | −12.13 | Yes | **** | <0.0001 | ||
| Control vs. 5 dpa | −16.84 | Yes | **** | <0.0001 | ||
| Control vs. 11 dpa | −16.28 | Yes | **** | <0.0001 | ||
| Control vs. 28 dpa | −6.489 | No | Ns | 0.0759 | ||
| 11 dpa vs. 28 dpa | 9.791 | Yes | ** | 0.0034 | ||
| Test Details | Mean 1 | SEM 1 | Mean 2 | SEM 2 | N1 | N2 |
| Control vs. 2 hpa | 0.1322 | 0.08273 | 1.321 | 0.6469 | 48 | 9 |
| Control vs. 6 hpa | 0.1322 | 0.08273 | 3.792 | 0.9597 | 48 | 12 |
| Control vs. 1 dpa | 0.1322 | 0.08273 | 7.835 | 1.395 | 48 | 15 |
| Control vs. 3 dpa | 0.1322 | 0.08273 | 12.26 | 2.724 | 48 | 13 |
| Control vs. 5 dpa | 0.1322 | 0.08273 | 16.97 | 3.001 | 48 | 12 |
| Control vs. 11 dpa | 0.1322 | 0.08273 | 16.41 | 2.466 | 48 | 19 |
| Control vs. 28 dpa | 0.1322 | 0.08273 | 6.621 | 1.799 | 48 | 10 |
| 11 dpa vs. 28 dpa | 16.41 | 2.466 | 6.621 | 1.799 | 19 | 10 |
| Figure 3b | Kruskal-Wallis test, significant difference for genotype and post-administration timepoint (p<0.0001) | |||||
| Dunn’s multiple comparisons test | Mean rank diff. | Significant? | Summary | Adjusted P value | ||
| Control vs. 6 hpa | −2.450 | No | ns | >0.999 | ||
| Control vs. 11 dpa | −15.98 | Yes | ** | 0.0011 | ||
| Control vs. 28 dpa | −19.39 | Yes | *** | 0.0004 | ||
| 6 hpa vs. 11 dpa | −13.53 | No | Ns | 0.0863 | ||
| 6 hpa vs. 28 dpa | −16.94 | Yes | * | 0.0285 | ||
| 11 dpa vs. 28 dpa | −3.416 | No | Ns | >0.9999 | ||
| Test Details | Mean 1 | SEM 1 | Mean 2 | SEM 2 | N1 | N2 |
| Control vs. 6 hpa | 2.963 | 0.7270 | 6.731 | 4.021 | 12 | 5 |
| Control vs. 11 dpa | 2.963 | 0.7270 | 28.12 | 3.536 | 12 | 11 |
| Control vs. 28 dpa | 2.963 | 0.7270 | 35.35 | 4.207 | 12 | 7 |
| 6 hpa vs. 11 dpa | 6.731 | 4.021 | 28.12 | 3.536 | 5 | 11 |
| 6 hpa vs. 28 dpa | 6.731 | 4.021 | 35.35 | 4.207 | 5 | 7 |
| 11 dpa vs. 28 dpa | 28.12 | 3.536 | 35.35 | 4.207 | 11 | 7 |
| Figure 3c | Kruskal-Wallis test, significant difference for genotype and post-administration timepoint (p=0.0004) | |||||
| Dunn’s multiple comparisons test | Mean rank diff. | Significant? | Summary | Adjusted P value | ||
| Control vs. 6 hpa | 0.6727 | No | Ns | >0.9999 | ||
| Control vs. 11 dpa | 12.82 | Yes | * | 0.0152 | ||
| Control vs. 28 dpa | 17.13 | Yes | ** | 0.0022 | ||
| 6 hpa vs. 11 dpa | 12.15 | No | Ns | 0.1425 | ||
| 6 hpa vs. 28 dpa | 16.46 | Yes | * | 0.0286 | ||
| 11 dpa vs. 28 dpa | 4.312 | No | Ns | >0.9999 | ||
| Test Details | Mean 1 | SEM 1 | Mean 2 | SEM 2 | N1 | N2 |
| Control vs. 6 hpa | 1109 | 129 | 1001 | 187 | 11 | 5 |
| Control vs. 11 dpa | 1109 | 129 | 457.4 | 55.81 | 11 | 11 |
| Control vs. 28 dpa | 1109 | 129 | 351.9 | 90.11 | 11 | 7 |
| 6 hpa vs. 11 dpa | 1001 | 187 | 457.4 | 55.81 | 5 | 11 |
| 6 hpa vs. 28 dpa | 1001 | 187 | 351.9 | 90.11 | 5 | 7 |
| 11 dpa vs. 28 dpa | 457.4 | 55.81 | 351.9 | 90.11 | 11 | 7 |
| Fig 3e | One-way ANOVA, no significant difference for genotype and post-administration timepoint (p=0.9960) | |||||
| Dunnett’s multiple comparisons test | Mean Diff | Significant? | Summary | Adjusted P value | ||
| Control vs. 6 hpa | −11.85 | No | Ns | 0.9996 | ||
| Control vs. 11dpa | −31.08 | No | Ns | 0.9946 | ||
| Control vs. 28 dpa | −33.26 | No | Ns | 0.9934 | ||
| Test Details | Mean 1 | SEM 1 | Mean 2 | SEM 2 | N1 | N2 |
| Control vs. 6 hpa | 423.4 | 171.7 | 435.2 | 106.5 | 3 | 3 |
| Control vs. 11dpa | 423.4 | 171.7 | 454.5 | 29.52 | 3 | 3 |
| Control vs. 28 dpa | 423.4 | 171.7 | 456.7 | 101.3 | 3 | 3 |
| Fig 4c | Kruskal-Wallis test, significant difference for genotype and post-administration timepoint (p= 0.0001) |
|||||
| Dunn’s multiple comparisons test | Mean rank diff. | Significant? | Summary | Adjusted p-value | ||
| Control vs. 6 hpa | 18.35 | Yes | ** | 0.0076 | ||
| Control vs. 11 dpa | 23.74 | Yes | *** | 0.0007 | ||
| Control vs. 28 dpa | 22.92 | Yes | *** | 0.0003 | ||
| 6 hpa vs. 11 dpa | 5.386 | No | ns | >0.9999 | ||
| 6 hpa vs. 28 dpa | 4.571 | No | ns | >0.9999 | ||
| 11 dpa vs. 28 dpa | −0.8143 | No | ns | >0.9999 | ||
| Test details | Mean 1 | SEM 1 | Mean 2 | SEM 2 | N1 | N2 |
| Control vs. 6 hpa | 21302 | 3399 | 5524 | 1526 | 11 | 14 |
| Control vs. 11 dpa | 21302 | 3399 | 3138 | 1478 | 11 | 10 |
| Control vs. 28 dpa | 21302 | 3399 | 3424 | 1142 | 11 | 14 |
| 6 hpa vs. 11 dpa | 5524 | 1526 | 3138 | 1478 | 14 | 10 |
| 6 hpa vs. 28 dpa | 5524 | 1526 | 3424 | 1142 | 14 | 14 |
| 11 dpa vs. 28 dpa | 3138 | 1478 | 3424 | 1142 | 10 | 14 |
| Figure 5b | One-Way ANOVA, significant difference for post-administration timepoint (p= 0.0273), N is sample number. | |||||
| Tukey’s multiple comparisons test | Significant? | Summary | Adjusted P value | |||
| 1 dpa vs. 11 dpa | No | ns | 0.6083 | |||
| 1 dpa vs. 28 dpa | Yes | * | 0.0228 | |||
| 11 dpa vs. 28 dpa | No | ns | 0.1810 | |||
| Test details | Mean 1 | Mean 2 | Mean Diff. | SE of diff. | N1 | N2 |
| 1 dpa vs. 11 dpa | 815.9 | 938.8 | −122.9 | 128.5 | 15 | 15 |
| 1 dpa vs. 28 dpa | 815.9 | 1171 | −354.6 | 128.5 | 15 | 15 |
| 11 dpa vs. 28 dpa | 938.8 | 1171 | −231.7 | 128.5 | 15 | 15 |
| Figure 5c | One-Way ANOVA, significant difference for post-administration timepoint (p= 0.0013), N is sample number. | |||||
| Tukey’s multiple comparisons test | Significant? | Summary | Adjusted P value | |||
| 1 dpa vs. 11 dpa | No | ns | 0.6446 | |||
| 1 dpa vs. 28 dpa | Yes | * | 0.0204 | |||
| 11 dpa vs. 28 dpa | No | ns | 0.1499 | |||
| Test details | Mean 1 | Mean 2 | Mean Diff. | SE of diff. | N1 | N2 |
| 1 dpa vs. 11 dpa | 514.2 | 790.2 | −316.2 | 352.2 | 15 | 15 |
| 1 dpa vs. 28 dpa | 514.2 | 1223 | −987.0 | 352.2 | 15 | 15 |
| 11 dpa vs. 28 dpa | 790.2 | 1223 | −670.8 | 352.2 | 15 | 15 |
| Figure 5d | Two-way ANOVA significance, significant difference for post-administration timepoint (p < 0.0001) and intersection distance (p<0.0001). N is sample number. | |||||
| Uncorrected Fisher’s LSD test | Predicted Mean Diff. | Significant? | Summary | Adjusted P value | ||
| Intersection distance 1 | ||||||
| 1 dpa vs. 11 dpa | −0.2 | No | ns | 0.9341 | ||
| 1 dpa vs. 28 dpa | −0.5333 | No | ns | 0.8256 | ||
| 11 dpa vs. 28 dpa | −0.3333 | No | ns | 0.8904 | ||
| Intersection distance 2 | Predicted Mean Diff. | Significant? | Summary | Adjusted P value | ||
| 1 dpa vs. 11 dpa | −2.733 | No | ns | 0.2588 | ||
| 1 dpa vs. 28 dpa | −0.4667 | No | ns | 0.8471 | ||
| 11 dpa vs. 28 dpa | 2.267 | No | ns | 0.349 | ||
| Intersection distance 3 | Predicted Mean Diff. | Significant? | Summary | Adjusted P value | ||
| 1 dpa vs. 11 dpa | 0.6667 | No | ns | 0.7829 | ||
| 1 dpa vs. 28 dpa | 0.8667 | No | ns | 0.7202 | ||
| 11 dpa vs. 28 dpa | 0.2 | No | ns | 0.9341 | ||
| Intersection distance 4 | Predicted Mean Diff. | Significant? | Summary | Adjusted P value | ||
| 1 dpa vs. 11 dpa | −2.533 | No | ns | 0.2953 | ||
| 1 dpa vs. 28 dpa | 0.2667 | No | ns | 0.9122 | ||
| 11 dpa vs. 28 dpa | 2.8 | No | ns | 0.2474 | ||
| Intersection distance 5 | Predicted Mean Diff. | Significant? | Summary | Adjusted P value | ||
| 1 dpa vs. 11 dpa | −2.667 | No | ns | 0.2706 | ||
| 1 dpa vs. 28 dpa | 0.6667 | No | ns | 0.7829 | ||
| 11 dpa vs. 28 dpa | 3.333 | No | ns | 0.1686 | ||
| Intersection distance 6 | Predicted Mean Diff. | Significant? | Summary | Adjusted P value | ||
| 1 dpa vs. 11 dpa | −0.5333 | No | ns | 0.8256 | ||
| 1 dpa vs. 28 dpa | −0.8 | No | ns | 0.7409 | ||
| 11 dpa vs. 28 dpa | −0.2667 | No | ns | 0.9122 | ||
| Intersection distance 7 | Predicted Mean Diff. | Significant? | Summary | Adjusted P value | ||
| 1 dpa vs. 11 dpa | −2.933 | No | ns | 0.2256 | ||
| 1 dpa vs. 28 dpa | −5.467 | Yes | * | 0.0241 | ||
| 11 dpa vs. 28 dpa | −2.533 | No | ns | 0.2953 | ||
| Intersection distance 8 | Predicted Mean Diff. | Significant? | Summary | Adjusted P value | ||
| 1 dpa vs. 11 dpa | 0 | No | ns | >0.9999 | ||
| 1 dpa vs. 28 dpa | −5.667 | Yes | * | 0.0194 | ||
| 11 dpa vs. 28 dpa | −5.667 | Yes | * | 0.0194 | ||
| Intersection distance 9 | Predicted Mean Diff. | Significant? | Summary | Adjusted P value | ||
| 1 dpa vs. 11 dpa | −2.067 | No | ns | 0.3932 | ||
| 1 dpa vs. 28 dpa | −7.2 | Yes | ** | 0.003 | ||
| 11 dpa vs. 28 dpa | −5.133 | Yes | * | 0.0341 | ||
| Intersection distance 10 | Predicted Mean Diff. | Significant? | Summary | Adjusted P value | ||
| 1 dpa vs. 11 dpa | −1.6 | No | ns | 0.5085 | ||
| 1 dpa vs. 28 dpa | −6.2 | Yes | * | 0.0106 | ||
| 11 dpa vs. 28 dpa | −4.6 | No | ns | 0.0576 | ||
| Intersection distance 11 | Predicted Mean Diff. | Significant? | Summary | Adjusted P value | ||
| 1 dpa vs. 11 dpa | −0.8 | No | ns | 0.7409 | ||
| 1 dpa vs. 28 dpa | −6.267 | Yes | ** | 0.0098 | ||
| 11 dpa vs. 28 dpa | −5.467 | Yes | * | 0.0241 | ||
| Intersection distance 12 | Predicted Mean Diff. | Significant? | Summary | Adjusted P value | ||
| 1 dpa vs. 11 dpa | −0.06667 | No | ns | 0.978 | ||
| 1 dpa vs. 28 dpa | −5.533 | Yes | * | 0.0224 | ||
| 11 dpa vs. 28 dpa | −5.467 | Yes | * | 0.0241 | ||
| Intersection distance 13 | Predicted Mean Diff. | Significant? | Summary | Adjusted P value | ||
| 1 dpa vs. 11 dpa | −0.3857 | No | ns | 0.8755 | ||
| 1 dpa vs. 28 dpa | −5.452 | Yes | * | 0.0271 | ||
| 11 dpa vs. 28 dpa | −5.067 | Yes | * | 0.0365 | ||
| Intersection distance 14 | Predicted Mean Diff. | Significant? | Summary | Adjusted P value | ||
| 1 dpa vs. 11 dpa | −0.3333 | No | ns | 0.8904 | ||
| 1 dpa vs. 28 dpa | −3.8 | No | ns | 0.1166 | ||
| 11 dpa vs. 28 dpa | −3.467 | No | ns | 0.1522 | ||
| Intersection distance 15 | Predicted Mean Diff. | Significant? | Summary | Adjusted P value | ||
| 1 dpa vs. 11 dpa | −0.06667 | No | ns | 0.978 | ||
| 1 dpa vs. 28 dpa | −1.6 | No | ns | 0.5085 | ||
| 11 dpa vs. 28 dpa | −1.533 | No | ns | 0.5263 | ||
| Intersection distance 16 | Predicted Mean Diff. | Significant? | Summary | Adjusted P value | ||
| 1 dpa vs. 11 dpa | 0 | No | ns | >0.9999 | ||
| 1 dpa vs. 28 dpa | −0.9333 | No | ns | 0.6997 | ||
| 11 dpa vs. 28 dpa | −0.9333 | No | ns | 0.6997 | ||
| Intersection distance 17 | Predicted Mean Diff. | Significant? | Summary | Adjusted P value | ||
| 1 dpa vs. 11 dpa | 0 | No | ns | >0.9999 | ||
| 1 dpa vs. 28 dpa | −0.3333 | No | ns | 0.8904 | ||
| 11 dpa vs. 28 dpa | −0.3333 | No | ns | 0.8904 | ||
| Intersection distance 18 | Predicted Mean Diff. | Significant? | Summary | Adjusted P value | ||
| 1 dpa vs. 11 dpa | 0 | No | ns | >0.9999 | ||
| 1 dpa vs. 28 dpa | −0.2 | No | ns | 0.9341 | ||
| 11 dpa vs. 28 dpa | −0.2 | No | ns | 0.9341 | ||
| Test Details | Mean 1 | SEM 1 | Mean 2 | SEM 2 | N1 | N2 |
| Intersection distance 1 | ||||||
| 1 dpa vs. 11 dpa | 2.2000 | 0.1745 | 2.4000 | 0.2894 | 15 | 15 |
| 1 dpa vs. 28 dpa | 2.2000 | 0.1745 | 2.7333 | 0.4414 | 15 | 15 |
| 11 dpa vs. 28 dpa | 2.4000 | 0.2894 | 2.7333 | 0.4414 | 15 | 15 |
| Intersection distance 2 | Mean 1 | SEM 1 | Mean 2 | SEM 2 | N1 | N2 |
| 1 dpa vs. 11 dpa | 6.3333 | 0.7411 | 9.0667 | 1.0257 | 15 | 15 |
| 1 dpa vs. 28 dpa | 6.3333 | 0.7411 | 6.800 | 0.8519 | 15 | 15 |
| 11 dpa vs. 28 dpa | 9.0667 | 1.0257 | 6.800 | 0.8519 | 15 | 15 |
| Intersection distance 3 | Mean 1 | SEM 1 | Mean 2 | SEM 2 | N1 | N2 |
| 1 dpa vs. 11 dpa | 12.8000 | 1.8752 | 12.1333 | 0.9354 | 15 | 15 |
| 1 dpa vs. 28 dpa | 12.8000 | 1.8752 | 11.9333 | 1.5568 | 15 | 15 |
| 11 dpa vs. 28 dpa | 12.1333 | 0.9354 | 11.9333 | 1.5568 | 15 | 15 |
| Intersection distance 4 | Mean 1 | SEM 1 | Mean 2 | SEM 2 | N1 | N2 |
| 1 dpa vs. 11 dpa | 16.7333 | 1.8605 | 19.2667 | 1.4879 | 15 | 15 |
| 1 dpa vs. 28 dpa | 16.7333 | 1.8605 | 16.4667 | 2.2988 | 15 | 15 |
| 11 dpa vs. 28 dpa | 19.2667 | 1.4879 | 16.4667 | 2.2988 | 15 | 15 |
| Intersection distance 5 | Mean 1 | SEM 1 | Mean 2 | SEM 2 | N1 | N2 |
| 1 dpa vs. 11 dpa | 21.1333 | 1.9417 | 23.8000 | 2.0775 | 15 | 15 |
| 1 dpa vs. 28 dpa | 21.1333 | 1.9417 | 20.4667 | 2.6147 | 15 | 15 |
| 11 dpa vs. 28 dpa | 23.8000 | 2.0775 | 20.4667 | 2.6147 | 15 | 15 |
| Intersection distance 6 | Mean 1 | SEM 1 | Mean 2 | SEM 2 | N1 | N2 |
| 1 dpa vs. 11 dpa | 22.0667 | 2.2980 | 22.6000 | 2.5219 | 15 | 15 |
| 1 dpa vs. 28 dpa | 22.0667 | 2.2980 | 22.8667 | 3.5144 | 15 | 15 |
| 11 dpa vs. 28 dpa | 22.6000 | 2.5219 | 22.8667 | 3.5144 | 15 | 15 |
| Intersection distance 7 | Mean 1 | SEM 1 | Mean 2 | SEM 2 | N1 | N2 |
| 1 dpa vs. 11 dpa | 18.9333 | 2.5699 | 21.8667 | 2.5799 | 15 | 15 |
| 1 dpa vs. 28 dpa | 18.9333 | 2.5699 | 24.4000 | 3.7299 | 15 | 15 |
| 11 dpa vs. 28 dpa | 21.8667 | 2.5799 | 24.4000 | 3.7299 | 15 | 15 |
| Intersection distance 8 | Mean 1 | SEM 1 | Mean 2 | SEM 2 | N1 | N2 |
| 1 dpa vs. 11 dpa | 14.4000 | 2.3559 | 14.4000 | 1.9019 | 15 | 15 |
| 1 dpa vs. 28 dpa | 14.4000 | 2.3559 | 20.0667 | 3.2870 | 15 | 15 |
| 11 dpa vs. 28 dpa | 14.4000 | 1.9019 | 20.0667 | 3.2870 | 15 | 15 |
| Intersection distance 9 | Mean 1 | SEM 1 | Mean 2 | SEM 2 | N1 | N2 |
| 1 dpa vs. 11 dpa | 7.8000 | 1.5681 | 9.8667 | 1.7206 | 15 | 15 |
| 1 dpa vs. 28 dpa | 7.8000 | 1.5681 | 15.0000 | 2.4708 | 15 | 15 |
| 11 dpa vs. 28 dpa | 9.8667 | 1.7206 | 15.0000 | 2.4708 | 15 | 15 |
| Intersection distance 10 | Mean 1 | SEM 1 | Mean 2 | SEM 2 | N1 | N2 |
| 1 dpa vs. 11 dpa | 4.4667 | 1.4305 | 6.0667 | 1.3504 | 15 | 15 |
| 1 dpa vs. 28 dpa | 4.4667 | 1.4305 | 10.6667 | 2.6034 | 15 | 15 |
| 11 dpa vs. 28 dpa | 6.0667 | 1.3504 | 10.6667 | 2.6034 | 15 | 15 |
| Intersection distance 11 | Mean 1 | SEM 1 | Mean 2 | SEM 2 | N1 | N2 |
| 1 dpa vs. 11 dpa | 2.3333 | 1.1819 | 3.1333 | 1.2223 | 15 | 15 |
| 1 dpa vs. 28 dpa | 2.3333 | 1.1819 | 8.6000 | 2.3620 | 15 | 15 |
| 11 dpa vs. 28 dpa | 3.1333 | 1.2223 | 8.6000 | 2.3620 | 15 | 15 |
| Intersection distance 12 | Mean 1 | SEM 1 | Mean 2 | SEM 2 | N1 | N2 |
| 1 dpa vs. 11 dpa | 1.0000 | 0.4781 | 1.0667 | 0.5297 | 15 | 15 |
| 1 dpa vs. 28 dpa | 1.0000 | 0.4781 | 6.5333 | 2.3822 | 15 | 15 |
| 11 dpa vs. 28 dpa | 1.0667 | 0.5297 | 6.5333 | 2.3822 | 15 | 15 |
| Intersection distance 13 | Mean 1 | SEM 1 | Mean 2 | SEM 2 | N1 | N2 |
| 1 dpa vs. 11 dpa | 0.2143 | 0.1547 | 0.6000 | 0.3754 | 15 | 15 |
| 1 dpa vs. 28 dpa | 0.2143 | 0.1547 | 5.6667 | 2.7372 | 15 | 15 |
| 11 dpa vs. 28 dpa | 0.6000 | 0.3754 | 5.6667 | 2.7372 | 15 | 15 |
| Intersection distance 14 | Mean 1 | SEM 1 | Mean 2 | SEM 2 | N1 | N2 |
| 1 dpa vs. 11 dpa | 0.0000 | 0.0000 | 0.3333 | 0.3333 | 15 | 15 |
| 1 dpa vs. 28 dpa | 0.0000 | 0.0000 | 3.8000 | 2.2215 | 15 | 15 |
| 11 dpa vs. 28 dpa | 0.3333 | 0.3333 | 3.8000 | 2.2215 | 15 | 15 |
| Intersection distance 15 | Mean 1 | SEM 1 | Mean 2 | SEM 2 | N1 | N2 |
| 1 dpa vs. 11 dpa | 0.0000 | 0.0000 | 0.0667 | 0.0667 | 15 | 15 |
| 1 dpa vs. 28 dpa | 0.0000 | 0.0000 | 1.6000 | 1.2024 | 15 | 15 |
| 11 dpa vs. 28 dpa | 0.0667 | 0.0667 | 1.6000 | 1.2024 | 15 | 15 |
| Intersection distance 16 | Mean 1 | SEM 1 | Mean 2 | SEM 2 | N1 | N2 |
| 1 dpa vs. 11 dpa | 0.0000 | 0.0000 | 0.0000 | 0.0000 | 15 | 15 |
| 1 dpa vs. 28 dpa | 0.0000 | 0.0000 | 0.9333 | 0.5206 | 15 | 15 |
| 11 dpa vs. 28 dpa | 0.0000 | 0.0000 | 0.9333 | 0.5206 | 15 | 15 |
| Intersection distance 17 | Mean 1 | SEM 1 | Mean 2 | SEM 2 | N1 | N2 |
| 1 dpa vs. 11 dpa | 0.0000 | 0.0000 | 0.0000 | 0.0000 | 15 | 15 |
| 1 dpa vs. 28 dpa | 0.0000 | 0.0000 | 0.3330 | 0.1869 | 15 | 15 |
| 11 dpa vs. 28 dpa | 0.0000 | 0.0000 | 0.3330 | 0.1869 | 15 | 15 |
| Intersection distance 18 | Mean 1 | SEM 1 | Mean 2 | SEM 2 | N1 | N2 |
| 1 dpa vs. 11 dpa | 0.0000 | 0.0000 | 0.0000 | 0.0000 | 15 | 15 |
| 1 dpa vs. 28 dpa | 0.0000 | 0.0000 | 0.2000 | 0.1447 | 15 | 15 |
| 11 dpa vs. 28 dpa | 0.0000 | 0.0000 | 0.2000 | 0.1447 | 15 | 15 |
| Figure 5f | One-way ANOVA, no significant difference for genotype and post-administration timepoint (p=0.1382) | |||||
| Tukey’s Multiple Comparisons test | Mean Diff | Significant? | Summary | Adjusted P value | ||
| Control vs. 1 dpa | 0.1601 | No | ns | 0.2119 | ||
| Control vs. 11 dpa | 0.1576 | No | ns | 0.3058 | ||
| Control vs. 28 dpa | 0.1199 | No | ns | 0.4944 | ||
| 1 dpa vs. 11 dpa | −0.002496 | No | ns | >0.9999 | ||
| 1 dpa vs. 28 dpa | −0.04018 | No | ns | 0.9758 | ||
| 11 dpa vs. 28 dpa | −0.03768 | No | ns | 0.9836 | ||
| Test Details | Mean 1 | SEM 1 | Mean 2 | SEM 2 | N1 | N2 |
| Control vs. 1 dpa | 1.005 | 0.0429 | 0.8447 | 0.06033 | 17 | 8 |
| Control vs. 11 dpa | 1.005 | 0.0429 | 0.8472 | 0.0732 | 17 | 6 |
| Control vs. 28 dpa | 1.005 | 0.0429 | 0.8849 | 0.08895 | 17 | 7 |
| 1 dpa vs. 11 dpa | 0.8447 | 0.06033 | 0.8472 | 0.0732 | 8 | 6 |
| 1 dpa vs. 28 dpa | 0.8447 | 0.06033 | 0.8849 | 0.08895 | 8 | 7 |
| 11 dpa vs. 28 dpa | 0.8472 | 0.0732 | 0.8849 | 0.08895 | 6 | 7 |
| Figure 5g | One-way ANOVA, no significant difference for genotype and post-administration timepoint (p=0.1896) | |||||
| Tukey’s Multiple Comparisons test | Mean Diff | Significant? | Summary | Adjusted P value | ||
| Control vs. 1 dpa | 0.2294 | No | ns | 0.1712 | ||
| Control vs. 11 dpa | −0.007537 | No | ns | >0.9999 | ||
| Control vs. 28 dpa | 0.09268 | No | ns | 0.8479 | ||
| 1 dpa vs. 11 dpa | −0.2369 | No | ns | 0.3253 | ||
| 1 dpa vs. 28 dpa | −0.1367 | No | ns | 0.7272 | ||
| 11 dpa vs. 28 dpa | 0.1002 | No | ns | 0.8926 | ||
| Test Details | Mean 1 | SEM 1 | Mean 2 | SEM 2 | N1 | N2 |
| Control vs. 1 dpa | 1.002 | 0.06148 | 0.7728 | 0.09323 | 17 | 8 |
| Control vs. 11 dpa | 1.002 | 0.06148 | 1.01 | 0.1398 | 17 | 6 |
| Control vs. 28 dpa | 1.002 | 0.06148 | 0.9095 | 0.04635 | 17 | 7 |
| 1 dpa vs. 11 dpa | 0.7728 | 0.09323 | 1.01 | 0.1398 | 8 | 6 |
| 1 dpa vs. 28 dpa | 0.7728 | 0.09323 | 0.9095 | 0.04635 | 8 | 7 |
| 11 dpa vs. 28 dpa | 1.01 | 0.1398 | 0.9095 | 0.04635 | 6 | 7 |
| Figure 6a | Two-way ANOVA, significant difference for post administration timepoint and genotype (p<0.0001) | |||||
| Sidak’s multiple comparisons test | Mean Diff | Significant? | Summary | Adjusted p-value | ||
| Day 0 Exp.l vs. Control | 0.000 | No | ns | >0.9999 | ||
| Day 1 Exp.l vs. Control | −1.723 | No | ns | 0.9620 | ||
| Day 2 Exp. vs. Control | −1.493 | No | ns | 0.9885 | ||
| Day 3 Exp. vs. Control | −0.2706 | No | ns | >0.9999 | ||
| Day 5 Exp. vs. Control | 5.276 | Yes | ** | 0.0027 | ||
| Day 8 Exp. vs. Control | 8.096 | Yes | **** | <0.0001 | ||
| Day 11 Exp. vs. Control | 7.411 | Yes | **** | <0.0001 | ||
| Day 14 Exp. vs. Control | 5.183 | Yes | ** | 0.0034 | ||
| Day 17 Exp. vs. Control | 4.672 | Yes | * | 0.0128 | ||
| Day 20 Exp. vs. Control | 3.895 | No | ns | 0.0749 | ||
| Day 23 Exp. vs. Control | 2.483 | No | ns | 0.6567 | ||
| Day 25 Exp. vs. Control | 2.605 | No | ns | 0.5849 | ||
| Day 28 Exp. vs. Control | 3.073 | No | ns | 0.3257 | ||
| Test Details | Mean 1 | SEM 1 | Mean 2 | SEM 2 | N1 | N2 |
| Day 0 Exp.l vs. Control | 0 | 0 | 0 | 0 | 18 | 22 |
| Day 1 Exp.l vs. Control | −0.087 | 0.381 | −1.810 | 05.570 | 18 | 22 |
| Day 2 Exp. vs. Control | −0.464 | 0.636 | −1.956 | 0.525 | 18 | 22 |
| Day 3 Exp. vs. Control | −1.413 | 0.760 | −1.684 | 0.664 | 18 | 22 |
| Day 5 Exp. vs. Control | −5.294 | 1.659 | −0.019 | 0.641 | 18 | 22 |
| Day 8 Exp. vs. Control | −7.249 | 2.037 | 0.847 | 0.804 | 18 | 22 |
| Day 11 Exp. vs. Control | −7.249 | 1.586 | 0.162 | 0.701 | 18 | 22 |
| Day 14 Exp. vs. Control | −4.384 | 1.102 | 0.799 | 1.006 | 18 | 22 |
| Day 17 Exp. vs. Control | −3.219 | 1.175 | 1.453 | 0.800 | 18 | 22 |
| Day 20 Exp. vs. Control | −1.375 | 1.382 | 2.520 | 0.781 | 18 | 22 |
| Day 23 Exp. vs. Control | 1.377 | 1.482 | 3.861 | 0.791 | 18 | 22 |
| Day 25 Exp. vs. Control | 1.706 | 1.506 | 4.311 | 0.830 | 18 | 22 |
| Day 23 Exp. vs. Control | 3.511 | 1.480 | 6.583 | 0.723 | 18 | 22 |
| Figure 6b | Two-way ANOVA, significant difference for post administration timepoint (p=0.0004) but no significant difference for genotype (p= 0.1591) | |||||
| Sidak’s multiple comparisons test | Mean Diff | Significant? | Summary | Adjusted p-value | ||
| Day 0 Exp. vs. Control | 8.458 | No | ns | 0.9889 | ||
| Day 5 Exp. vs. Control | 35.83 | No | ns | 0.6843 | ||
| Day 11 Exp. vs. Control | 67.54 | No | ns | 0.0811 | ||
| Day 28 Exp. vs. Control | −9.667 | No | ns | 0.9934 | ||
| Test Details | Mean 1 | SEM 1 | Mean 2 | SEM 2 | N1 | N2 |
| Day 0 Exp. vs. Control | 198.125 | 16.269 | 206.583 | 11.209 | 8 | 12 |
| Day 5 Exp. vs. Control | 143.325 | 24.356 | 179.083 | 17.257 | 8 | 12 |
| Day 11 Exp. vs. Control | 107.125 | 21.278 | 174.667 | 14.552 | 8 | 12 |
| Day 28 Exp. vs. Control | 188.5 | 25.297 | 178.833 | 7.987 | 8 | 12 |
| Figure 6c | Two-way ANOVA, significant difference for post administration timepoint and genotype (p<0.0001) | |||||
| Sidak’s multiple comparisons test | Mean Diff | Significant? | Summary | Adjusted p-value | ||
| Day 0 Exp. vs. Control | 0.08775 | No | ns | 0.9996 | ||
| Day 5 Exp. vs. Control | 1.934 | Yes | ** | 0.0022 | ||
| Day 11 Exp. vs. Control | 0.5916 | No | ns | 0.6194 | ||
| Day 28 Exp. vs. Control | 0.3590 | No | ns | 0.9095 | ||
| Test Details | Mean 1 | SEM 1 | Mean 2 | SEM 2 | N1 | N2 |
| Day 0 Exp. vs. Control | 4.696 | 0.335 | 4.784 | 0.359 | 8 | 12 |
| Day 5 Exp. vs. Control | 1.567 | 0.344 | 3.501 | 0.283 | 8 | 12 |
| Day 11 Exp. vs. Control | 2.027 | 0.399 | 2.619 | 0.206 | 8 | 12 |
| Day 28 Exp. vs. Control | 1.960 | 0.320 | 2.319 | 0.339 | 8 | 12 |
| Figure 6d, center zone | Two-way ANOVA, significant difference for post administration timepoint and genotype (p=0.0218) | |||||
| Sidak’s multiple comparisons test | Mean Diff | Significant? | Summary | Adjusted p-value | ||
| Day 0 Exp. vs. Control | −4.163 | No | ns | 0.9889 | ||
| Day 5 Exp. vs. Control | 55.33 | Yes | * | 0.0173 | ||
| Day 11 Exp. vs. Control | 14.33 | No | ns | 0.9487 | ||
| Day 28 Exp. vs. Control | 1.248 | No | ns | >0.9999 | ||
| Test Details | Mean 1 | SEM 1 | Mean 2 | SEM 2 | N1 | N2 |
| Day 0 Exp. vs. Control | 62.638 | 8.458 | 58.475 | 4.727 | 8 | 12 |
| Day 5 Exp. vs. Control | 19.138 | 6.065 | 74.467 | 15.177 | 8 | 12 |
| Day 11 Exp. vs. Control | 40.600 | 18.881 | 54.925 | 10.912 | 8 | 12 |
| Day 28 Exp. vs. Control | 40.725 | 15.703 | 41.973 | 9.636 | 8 | 12 |
| Figure 6f, perimeter zone | Two-way ANOVA, significant difference for post administration timepoint and genotype (p=0.0384) | |||||
| Sidak’s multiple comparisons test | Mean Diff | Significant? | Summary | Adjusted p-value | ||
| Day 0 Exp. vs. Control | 4.371 | No | ns | 0.9866 | ||
| Day 5 Exp. vs. Control | −54.49 | Yes | * | 0.0189 | ||
| Day 11 Exp. vs. Control | −14.33 | No | ns | 0.9487 | ||
| Day 28 Exp. vs. Control | 0.2250 | No | ns | >0.9999 | ||
| Test Details | Mean 1 | SEM 1 | Mean 2 | SEM 2 | N1 | N2 |
| Day 0 Exp. vs. Control | 237.363 | 8.458 | 241.733 | 4.680 | 8 | 12 |
| Day 5 Exp. vs. Control | 280.025 | 5.837 | 225.533 | 15.177 | 8 | 12 |
| Day 11 Exp. vs. Control | 259.400 | 18.881 | 245.075 | 10.912 | 8 | 12 |
| Day 28 Exp. vs. Control | 259.275 | 15.703 | 259.500 | 8.919 | 8 | 12 |
| Suppl. Figure 3c | Two-way ANOVA, significant difference for inside or outside ablation region (p<0.0001) and post-administration timepoint (p=0.0002) | |||||
| Tukey’s Multiple Comparisons test | Mean Diff | Significant? | Summary | Adjusted P value | ||
| 6 hpa in ablation region vs. outside ablation region | −461 | Yes | **** | <0.0001 | ||
| 11 dpa in ablation region vs. outside ablation region | −565.5 | Yes | **** | <0.0001 | ||
| 28 dpa in ablation region vs. outside ablation region | −533.1 | Yes | **** | <0.0001 | ||
| Test Details | Mean 1 | SEM 1 | Mean 2 | SEM 2 | N1 | N2 |
| 6 hpa in ablation region vs. outside ablation region | 159.998 | 23.087 | 621.048 | 47.375 | 13 | 13 |
| 11 dpa in ablation region vs. outside ablation region | 232.135 | 16.893 | 797.588 | 52.553 | 11 | 11 |
| 28 dpa in ablation region vs. outside ablation region | 333.264 | 27.403 | 866.386 | 85.946 | 13 | 13 |
3. Results
3.1. Astrocyte ablation occurs within hours after Tamoxifen administration
To determine if astrocytes are necessary for blood-brain barrier (BBB) maintenance, we genetically ablated a small number of astrocytes in adult mice using a conditional and inducible approach. Mice expressing the diphtheria toxin subunit A (DTA) behind a stop cassette flanked by loxP sites were bred with mice expressing CreERT behind the promoter of the astrocytic glutamate transporter Glast. This restricted expression of CreERT to astrocytes and enabled induction of astrocyte ablation in adult mice upon administration of Tamoxifen, which causes translocation of the Cre recombinase to the nucleus. There, Cre recombinase excised the stop cassette enabling expression of DTA (Fig. 1a). We chose Glast-CreERT specifically because of its limited recombination efficiency in the adult forebrain (Mori et al., 2006), which allowed for sparse astrocyte ablation and confirmed that no astrocyte ablation took place in experimental DTAfl/wt//Glast-CreERTtg/wt mice in the absence of Tamoxifen administration (Suppl. Fig. 2a).
We first determined the time course of astrocyte ablation by harvesting brain tissue 2h, 6h, 24h, 3d, 5d, 11d and 28d after a single dose of Tamoxifen (Tx) or carrier solution (10% ethanol in corn oil) (Fig. 1b). At 6 hpa and 1 dpa, we observed overlap between the astrocyte marker S100β and the apoptosis marker cleaved caspase 3, suggesting that astrocytes underwent apoptosis at these timepoints (Fig. 1c). The nuclei in these astrocytes were pyknotic and highly condensed, an additional indication that these cells were undergoing apoptosis. We did not find any cleaved caspase 3-positive cells at later timepoints (3 dpa, 5 dpa, 11 dpa, 28 dpa), suggesting that by those timepoints, the recombined astrocytes had died.
We confirmed astrocyte loss across all timepoints using the astrocyte membrane-associated protein glutamate transporter 1 (Glt1). Tissues from control mice were characterized by a mostly even and continuous Glt1 staining pattern (Fig. 1d,f). After tamoxifen administration DTAfl/wt//Glast-CreERTtg/wt mice had disrupted Glt1 staining patterns in distinct regions resembling single astrocyte domains or groups of astrocytes throughout the cortical gray matter (Fig. 1d,f) and other brain regions, including the hippocampus, striatum and cerebellum (Suppl. Fig. 2b–d).
Areas lacking Glt1 were also characterized by lack of expression of other astrocyte proteins including S100β, Sox9 and reduced expression of Aquaporin4 (AQ4) (Suppl. Fig. 3a,c). While we observed very few Glt-lacking regions in controls, these regions still contained S100β+ astrocytes (Suppl. 3b.) Astrocyte ablation occurred, in single domains, as early as 2 hours post ablation (hpa, refers to administration of Tx) (Fig. 1d,f). At this timepoint we did not detect cleaved caspase-3 possibly due to the small number of apoptotic astrocytes at this early timepoint.
Quantification of Glt1-negative area size was not sensitive enough to detect significant differences between control and experimental mice at 2 hpa and 6 hpa (Fig. 1e), even though small areas with missing astrocytes were clearly present, even at these early timepoints. Cortical area size lacking Glt1 increased at 1 dpa and was maximal at approximately 12% at 5 dpa. At 11 and 28 dpa, areas without Glt1 appeared slightly reduced in size when compared to 5 dpa, but this difference was not statistically significant. The full dataset for percent loss of Glt1, including statistics for all timepoints, can be found in Table 3.
In conclusion, astrocyte ablation was initiated in DTAfl/wt//Glast-CreERTtg/wt mice within hours after Tx administration and peaked at 5 dpa. Approximately 12% of the cortical surface area lacked Glt1 coverage.
3.2. Astrocyte ablation triggers early and sustained blood-brain barrier dysfunction
It is unclear if pericytes are sufficient to maintain the adult BBB or if astrocytes are indeed necessary, possibly upstream of pericytes, to maintain BBB function in vivo. To determine whether genetic ablation of astrocytes in the adult mouse brain interferes with BBB integrity, we used the small fluorescently labeled molecule Cadaverine (<1kDa). We chose Cadaverine as opposed to larger molecular size tracers as a starting point to detect even small disturbances in BBB function. A recent study reported Cadaverine leakage into the brain parenchyma to be indicative of impaired tight junctions even in the absence of leakage of larger plasma proteins (~70kDa) or Dextran-coupled fluorescent tracers (10kDa) (Yanagida et al., 2017).
Cadaverine leakage was observed as early as 2 hpa and was typically associated with areas of astrocyte ablation (Fig. 2a) suggesting that BBB integrity was affected very quickly once astrocytes become dysfunctional as a result of DTA expression, which inhibits protein synthesis ultimately leading to cell death. Cadaverine was injected 30 minutes before mice were euthanized, thus leakage of the tracer represents the dysfunction of the barrier at this particular time point.
Figure 2.
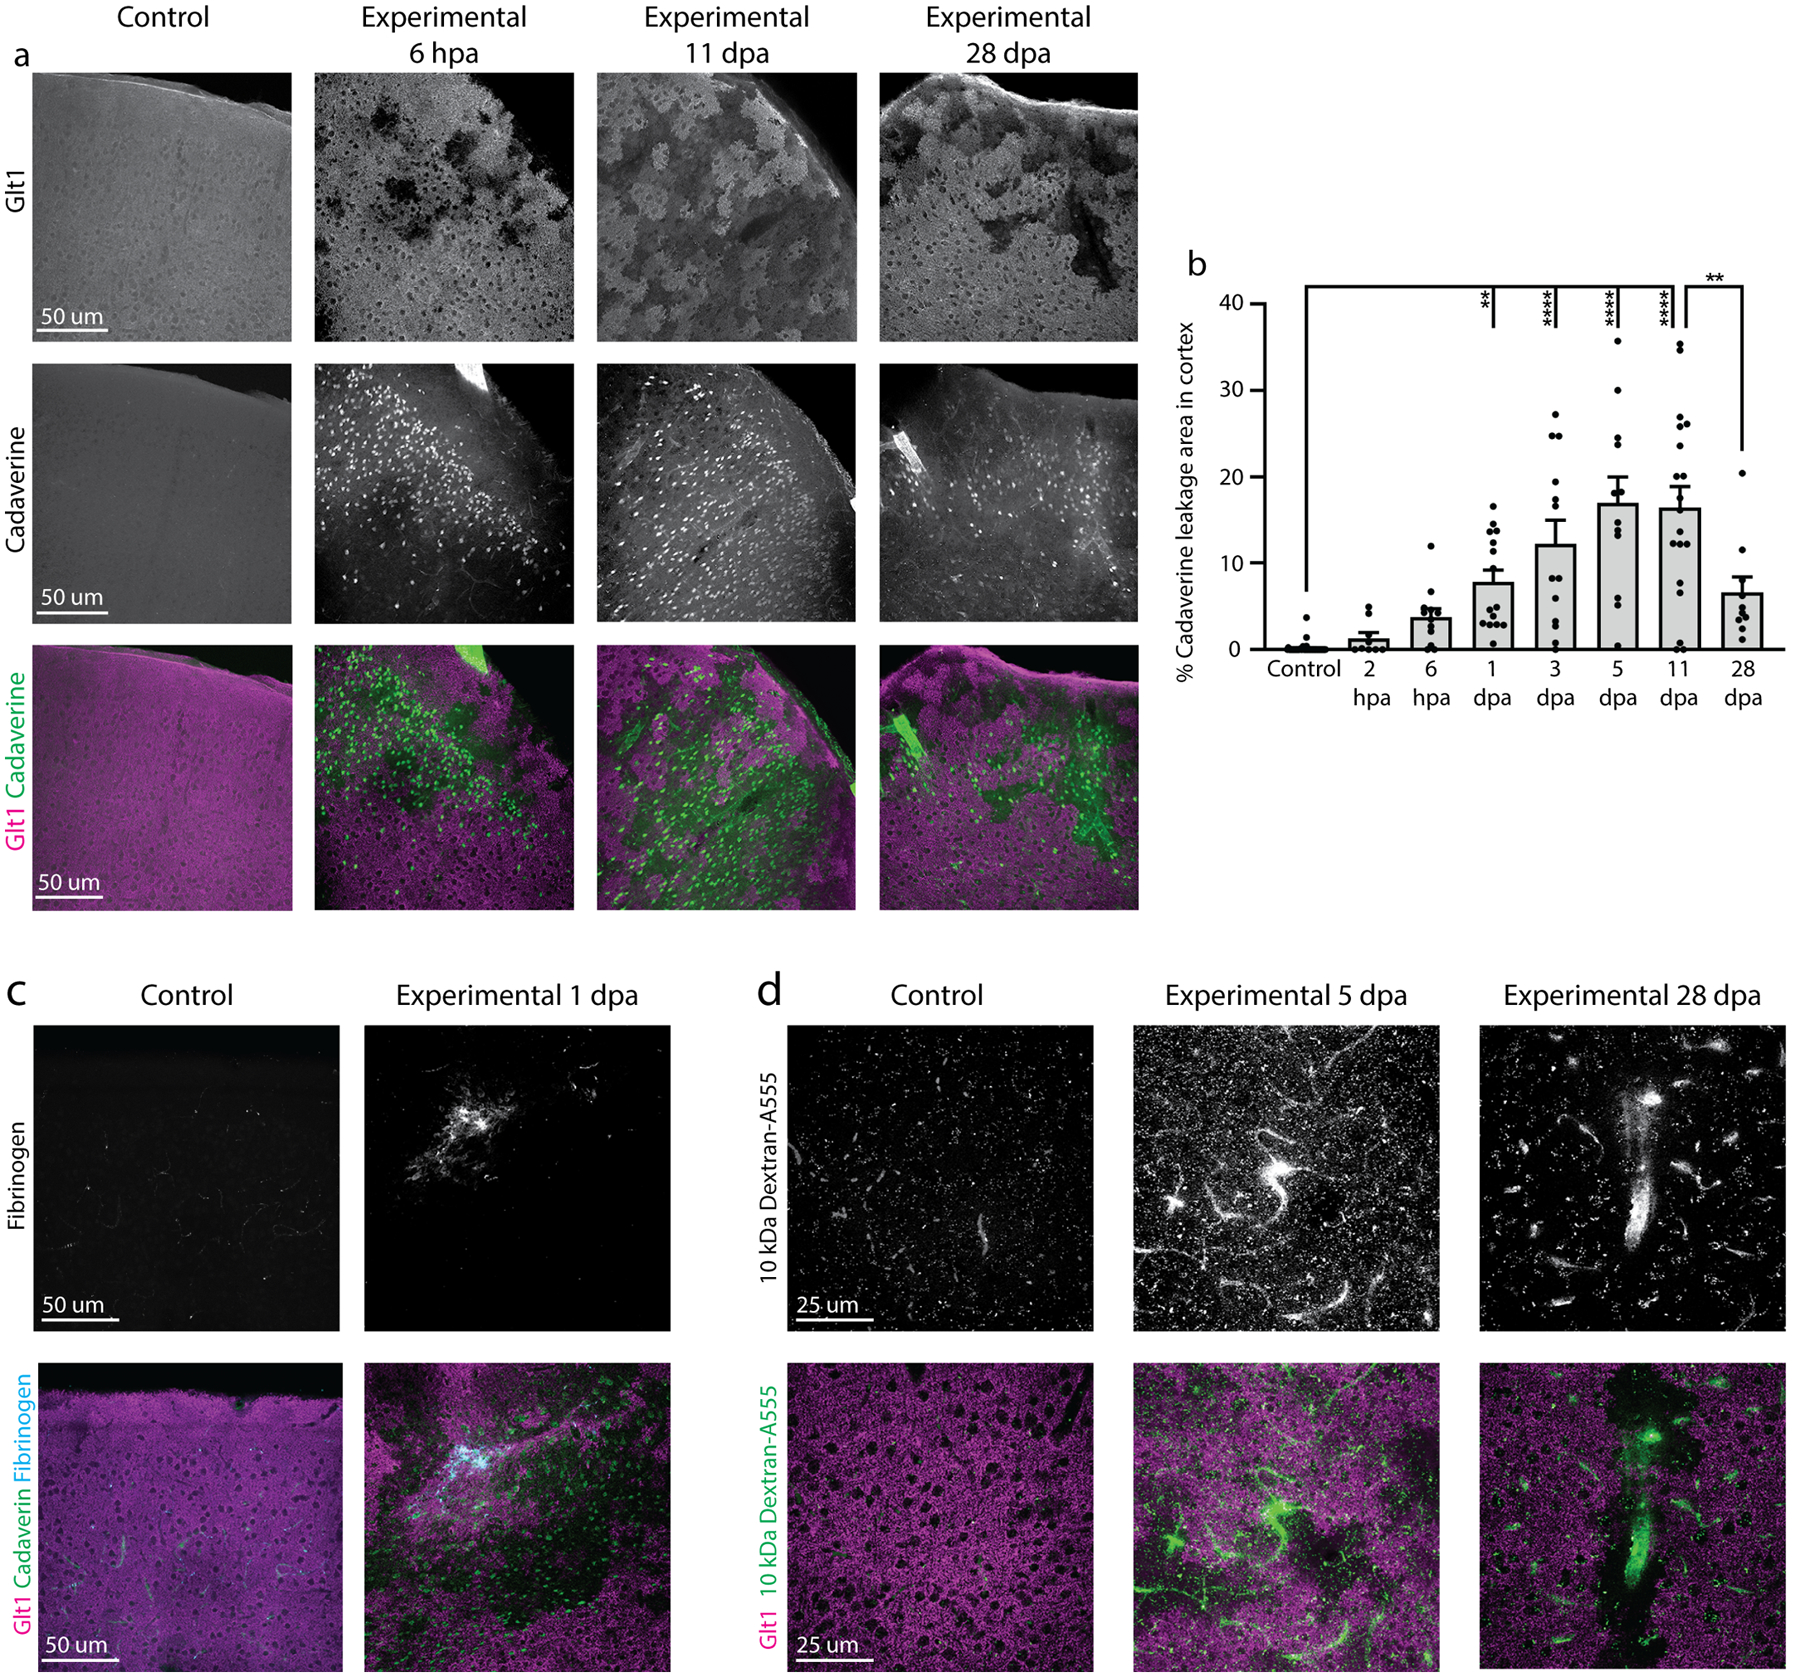
Astrocyte ablation induced BBB dysfunction. a. Leakage of the BBB tracer dye Cadaverine in cortex was observed around regions of astrocyte cell death indicated by lack of Glt1 expression. Cadaverine leakage occurred as early as 2 hpa and was still present at 28 dpa. Control mice showed minimal leakage of dye. b. Cadaverine leakage occurred across cortex in experimental mice and was quantified as percent leakage area out of entire cortex area and plotted by slice. (Control: 0.1322 ± 0.08273, n= 48; 2 hpa: 1.321 ± 0.6469, n= 9; 6 hpa: 3.792 ± 0.9597, n= 12; 1 dpa: 7.835 ± 1.395, n= 15; 3 dpa: 12.26 ± 2.724, n= 13; 5 dpa: 16.97 ± 3.001, n= 12; 11 dpa: 16.41 ± 2.466, n= 11; 28 dpa: 6.621 ± 1.799, n= 10). Tukey’s multiple comparisons test. (Control vs. 1 dpa, p= 0.0019; Control vs. 3 dpa, p< 0.0001; Control vs. 5 dpa, p < 0.0001; Control vs. 11 dpa, p <0.0001; Control vs. 28 dpa, p = 0.0759; 11 dpa vs. 28 dpa, p= 0.0034) c. Some vessels labeled positive for fibrinogen deposition and were surrounded by Glt1 loss and Cadaverine leakage. d. Leakage of dextran (10 kDa) was also observed in cortex in regions of Glt1 loss at middle and late timepoints.
As an approximation of the extent of BBB dysfunction after astrocyte ablation, we quantified the percentage of cortical area covered by cells that took up Cadaverine in large image scans (Fig. 2b, Suppl. Fig. 4a). At 6 hpa about 5% of the cortical gray matter was covered by Cadaverine+ cells. This area fraction tripled by 5–11dpa. While Cadaverine spread throughout the tissue appeared diffuse at early timepoints after ablation (6 hpa, 1 dpa) it was found to be more restricted to areas of ablation one month after ablation (28 dpa) signified by a significantly reduced area covered by Cadaverine+ cells (see Table 3 for data and statistics). We also occasionally found some Cadaverine leakage, albeit at much smaller extent, in control mice.
We next sought to determine if greater Cadaverine leakage correlated with greater Glt1 loss by plotting these values from all experimental and control mice. The r value of 0.71 (two-tailed Pearson’s correlation test) reflects a moderate correlation but suggests that Cadaverine leakage is not necessarily larger in mice with larger Glt1 loss regions. This might be due to the small size of the dye, which might easily diffuse within the tissue. We also used a similar approach injecting a 10 kDa dextran conjugated to Alexa-555. This tracer also leaked into the brain parenchyma in and around areas of astrocyte ablation up to 28 dpa (Fig. 2d).
To further determine the extent and severity of BBB dysfunction after astrocyte ablation, we stained for the large molecular size blood plasma protein fibrinogen (~340 kDa). Fibrinogen accumulates outside of blood vessels and acts as part of the coagulation cascade that stops bleeding, and is indicative of damage to blood vessels resulting in entrance of larger blood-borne molecules and erythrocytes. While not as widespread as Cadaverine leakage, we observed several regions with fibrinogen deposition in the cortex as early as 1 dpa (Fig. 2c). In the 14 experimental mice examined for fibrinogen, 7 of the 80 slices examined showed fibrinogen deposition. These regions were consistently surrounded by large zones depleted of Glt1+ astrocytes and Cadaverine leakage. However, most areas with Glt1 loss and Cadaverine leakage lacked fibrinogen deposits. Across the cortex, we observed leakage of the 10 kDa Dextran more frequently than fibrinogen deposition, but less frequently than Cadaverine leakage. Likewise, Cadaverine leakage occurred diffusely across the cortex, while dextran and fibrinogen were often closely associated with blood vessels.
Taken together, these findings suggest that astrocyte ablation interferes with BBB integrity, that larger areas of loss result in more extensive damage to the BBB, allowing entrance of molecules as large as fibrinogen into the brain, and that BBB integrity is disturbed for at least 4 weeks post ablation.
3.3. Astrocyte ablation interferes with tight junction function but does not affect expression of endothelial glucose transporter Glut1.
We next asked whether Cadaverine and fibrinogen leakage occurred due to dysfunctional tight junctions in astrocyte-ablated areas. We examined the tight junction protein zonula occludens-1 (ZO-1) using immunohistochemistry at 6 hpa, 11 dpa and 28 dpa. In control mice, we observed continuous labeling of ZO-1 that overlapped with the endothelial cell marker CD31 (Fig. 3a). We observed mostly intact ZO-1 labeling in ablation regions at 6 hpa. These areas did not show Cadaverine leakage. In contrast, the few areas that had disrupted ZO-1 labeling also presented with Cadaverine leakage (Fig. 3a). We observed frequent ZO-1 disruption and reduced expression at 11 dpa and 28 dpa, and some vessels lacked ZO-1 almost completely (Fig. 3a, yellow arrowhead). Quantifications for ZO-1 intensity and continuity along CD31 vessels at 6 hpa, when we observed only a few missing astrocytes domains, showed no changes from controls (Fig. 3b–c). At 11 dpa and 28 dpa, the percentage of CD31 vessels lacking ZO-1 labeling was increased and ZO-1 signal intensity was decreased. Data and statistics for ZO-1 intensity and continuity of signal can be found in Table 3.
Figure 3.
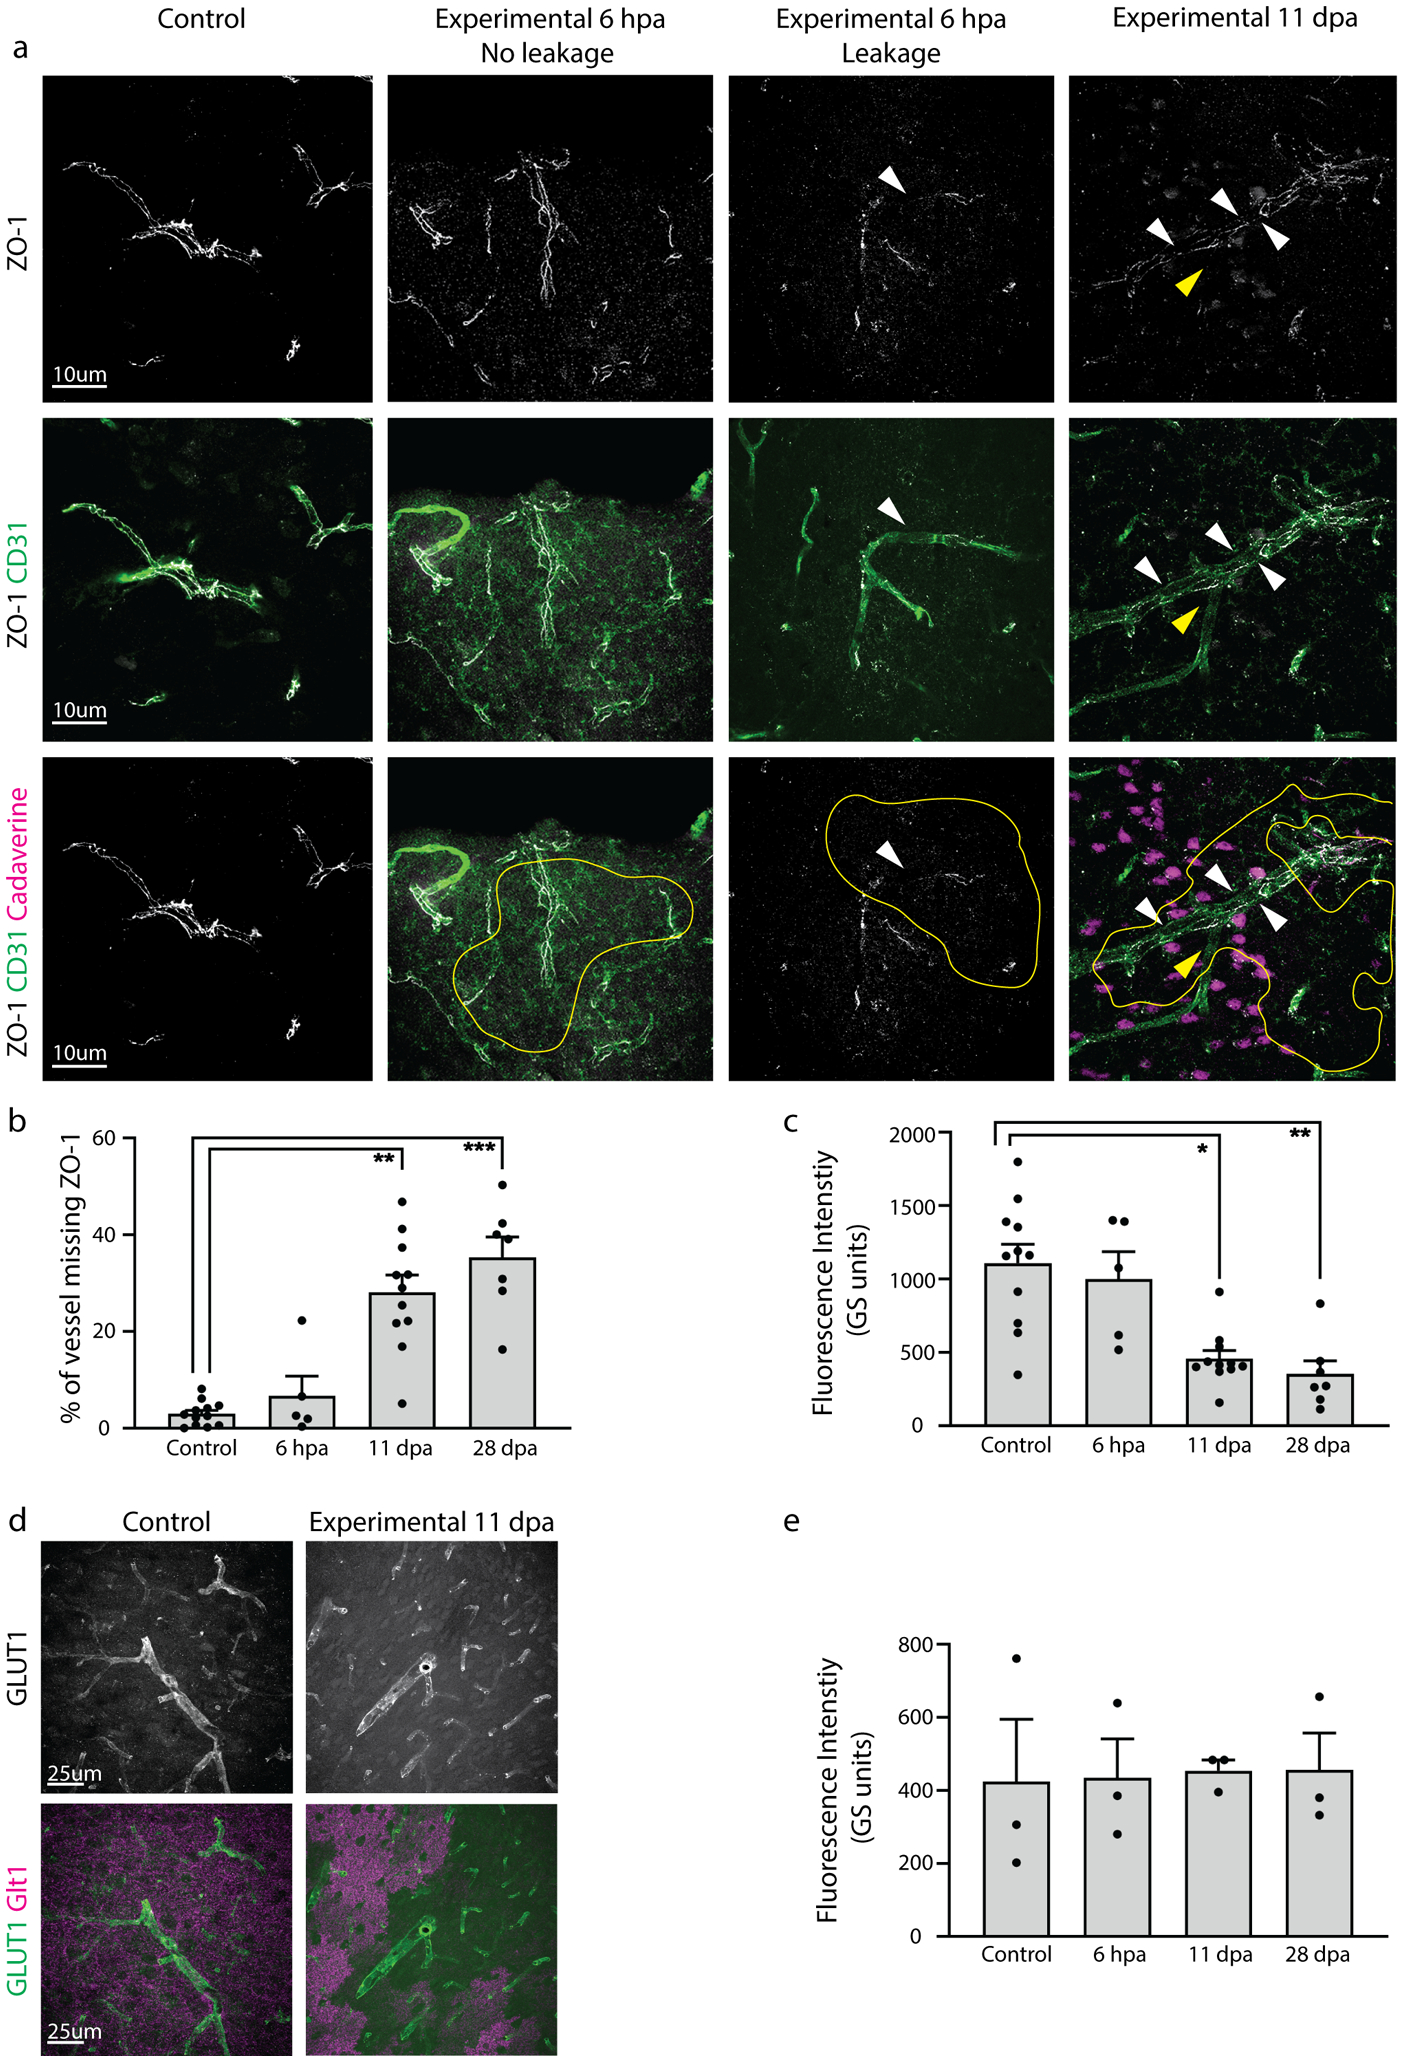
Astrocyte ablation of cells adjacent to blood vessels reduced expression of proteins in endothelial cells responsible for maintenance of the BBB. a. Astrocyte ablation of cells next to blood vessels resulted in reduced and discontinuous vessel labeling for the tight junction protein ZO-1 (white arrowheads). ZO-1 expression was examined within Glt-1-lacking areas (circled in yellow). At 6 hpa, few vessels within Glt1-lacking areas showed disrupted ZO-1 labeling, and those that did also presented with Cadaverine leakage. At 11 dpa, some vessels in regions of ablation completely lacked ZO-1 (yellow arrowhead) and showed Cadaverine leakage. b. Continuity of ZO-1 labeling in vessels was quantified by binarizing ZO-1 signal and drawing a line along ZO-1 signal, using CD31 as a guide. (Control: 2.963 ± 0.7270, n= 12; 6 hpa: 6.731 ± 4.021, n= 5; 11 dpa: 28.12 ± 3.536, n= 11; 28 dpa: 35.35 ± 4.207, n= 7). Dunn’s multiple comparisons test. (Control vs. 6 hpa, p > 0.9999; Control vs. 11 dpa, p= 0.0011; Control vs. 28 dpa, p= 0.0004; 6 hpa vs. 28 dpa, p= 0.0285). c. Average fluorescence intensity was quantified for ZO-1 intensity profile measurements of lines drawn along ZO-1 labeling. (Control: 1109 ± 129, n= 11; 11 dpa: 457.4 ± 55.81, n= 11; 28 dpa: 351.9 ± 90.11, n= 7). Dunn’s multiple comparisons test. (Control vs. 6 hpa, p> 0.9999; Control vs. 11 dpa, p= 0.0152; Control vs. 28 dpa, p= 0.0022; 6 hpa vs. 28 dpa, p= 0.0286). d. Endothelial glucose transporter GLUT1 expression was unchanged between groups. e. Quantification of average fluorescence intensity of GLUT1 showed no changes in vessels adjacent to Glt1-lacking areas. (Control: 423.4 ± 171.7, n= 3; 6 hpa: 435.2 ± 106.5, n= 3; 11 dpa: 454.5 ± 29.52, n= 3; 28 dpa: 456.7 ± 101.3, n= 3). Dunnett’s multiple comparisons test. (Control vs. 6 hpa, p = 0.9996; Control vs. 11 dpa, p= 0.9946; Control vs. 28 dpa, p= 0.9934).
Increased permeability due to BBB dysfunction can occur through several mechanisms beyond loosening of physical tightness of the junctions, including dysregulation of proteins that govern its metabolic barrier properties. The endothelial glucose transporter Glut1 is responsible for over 90% of all glucose transport into the brain, and is thus often used as a readout for metabolic barrier function (Boado & Pardridge, 1993; Pardridge, Boado, & Farrell, 1990). We labeled blood vessels with the glucose transporter Glut1 to determine if glucose transporter levels were affected by astrocyte ablation. We found no changes in Glut1 expression pattern at 6 hpa, 11 dpa or 28 dpa (Fig. 3d). Quantification of average fluorescence intensity of Glut1 in vessels adjacent to astrocyte ablation regions revealed no differences among groups (Fig. 3e).
Together, this suggests that astrocyte ablation interferes with specific aspects of barrier function such as expression and/or localization of tight junction proteins.
3.4. Astrocytes adjacent to ablated areas respond with molecular changes characteristic for glial scar formation
In response to injury and disease, astrocytes undergo context-dependent molecular and morphological changes in a process called astrogliosis. In the event of a focal traumatic brain or spinal cord injury, astrocytes can form glial scars to seal off injured areas and protect from further damage. Here, we asked if astrocyte loss and opening of the BBB is sufficient to induce a scar-forming response in astrocytes adjacent to ablated regions. We first tested for the phosphorylation of the cytokine and growth factor signal transducer and activator of transcription 3 (pSTAT3), which is essential for scar formation (Herrmann et al., 2008). The promoter for glial fibrillary acidic protein (GFAP) is a downstream target of STAT3 (Ito et al., 2016). GFAP is typically upregulated after injury and is intensely increased in scar-forming astrocytes.
While we found GFAP+ astrocytes adjacent to regions of astrocyte ablation and Cadaverine leakage at 1 dpa, 3 dpa, and 5 dpa, at these timepoints none labeled for pSTAT3. Several pockets of pSTAT3+ /GFAP+ astrocytes were detected at 11 dpa. By 28 dpa, pSTAT3+ /GFAP+ astrocytes were more numerous and appeared to surround areas of ablation (Fig. 4a). These astrocytes had increased GFAP levels when compared to those at earlier timepoints. These regions were observed across the cortex and were found in all experimental mice at 28 dpa (n=3).
Figure 4.
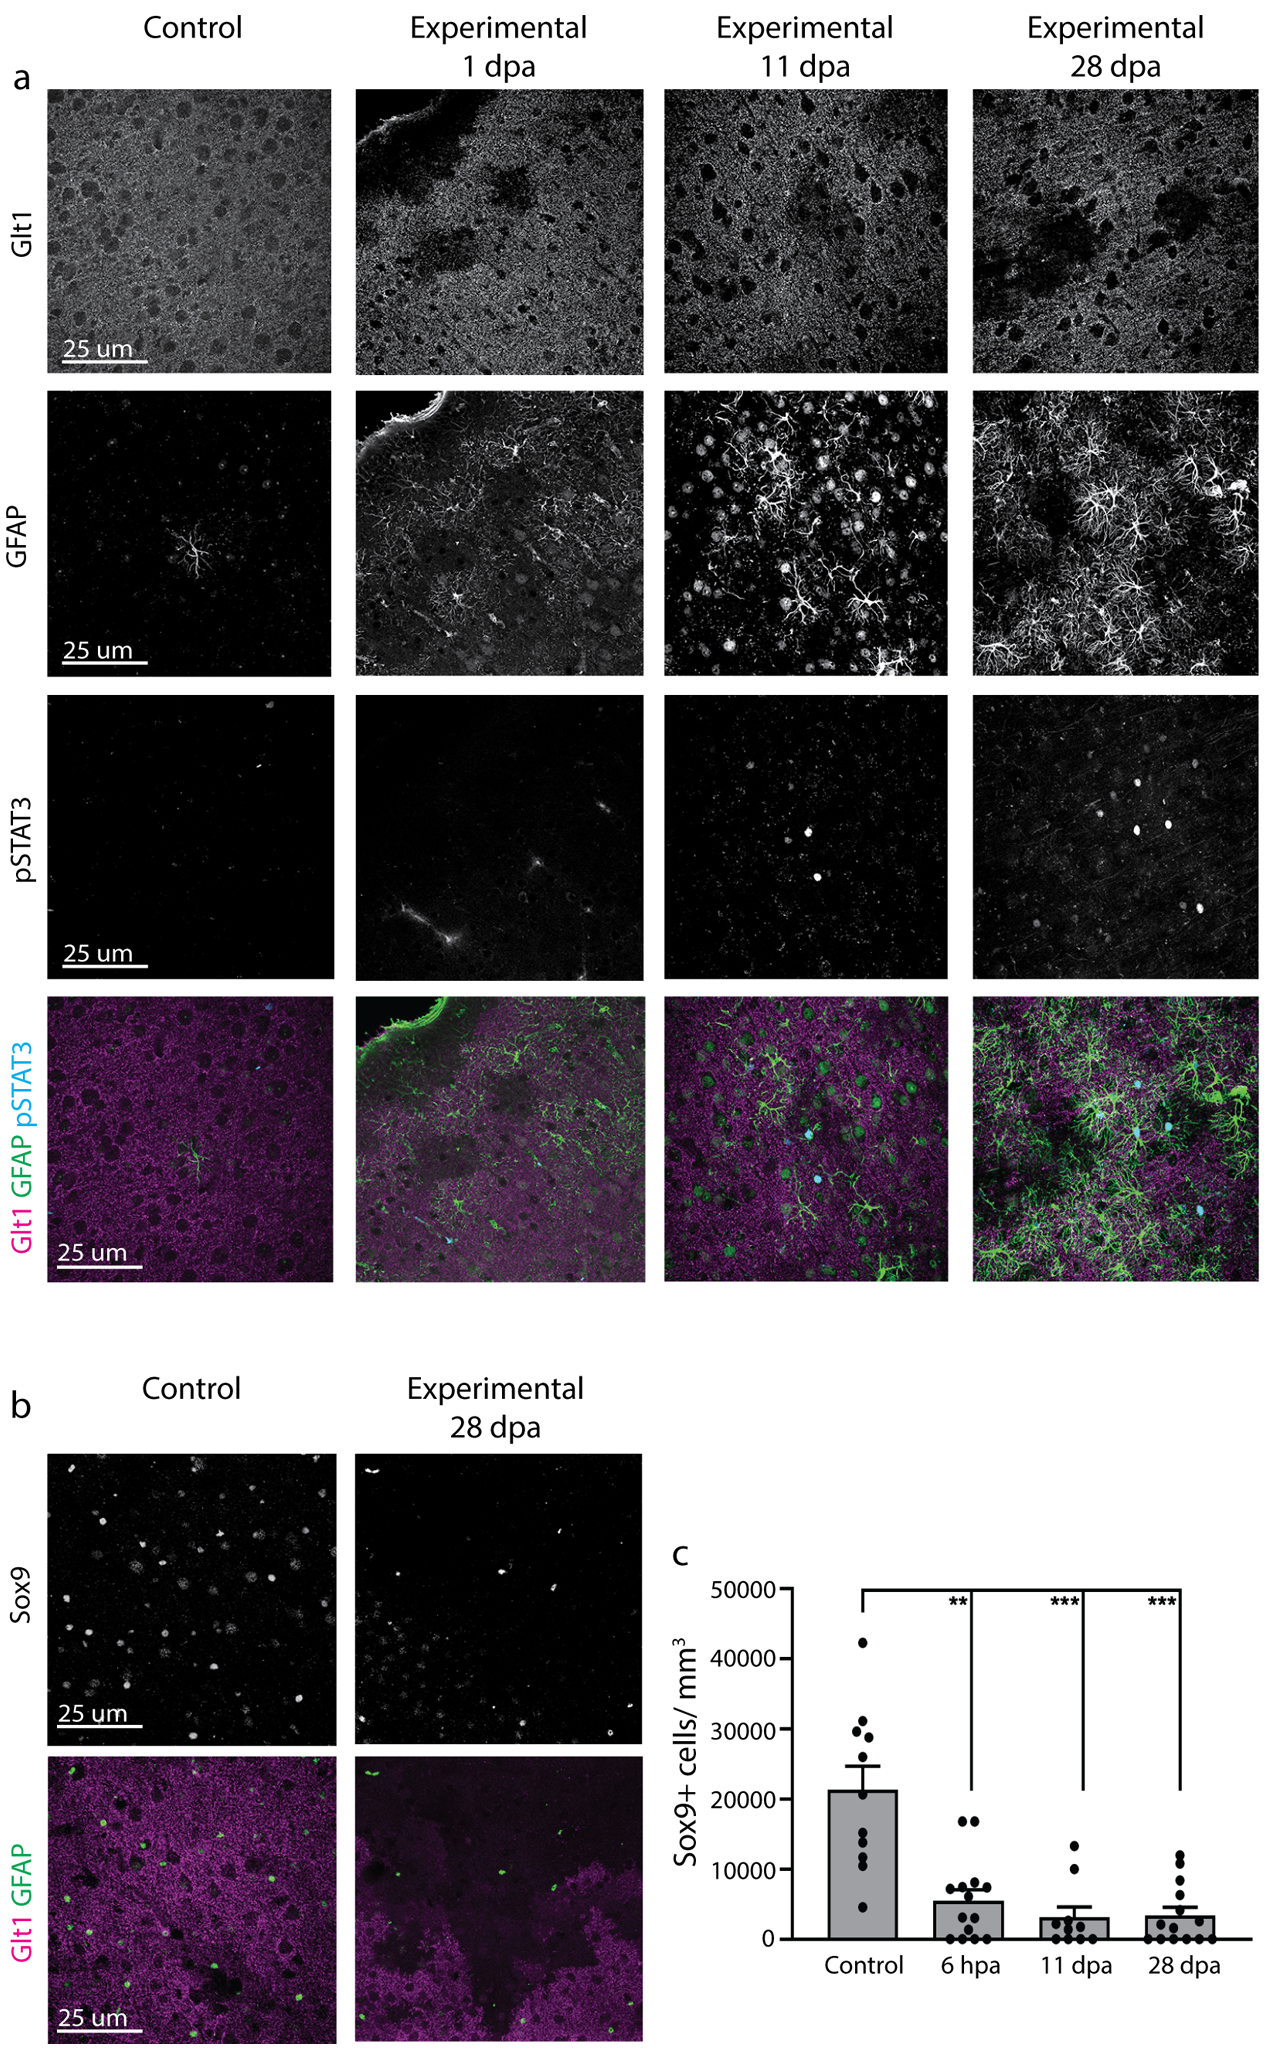
Astrocytes adjacent to areas of astrocyte ablation had late increased phosphorylation of STAT3 and unchanged Sox9. a. Astrocytes adjacent to regions of Glt1 loss were negative for pSTAT3 at 1, 3 and 5 dpa. GFAP+ astrocytes close to astrocyte ablation areas labeled positive for phosphorylated STAT3 at 11 dpa and 28 dpa. b. Regions of astrocyte ablation indicated by lack of Glt1 showed greatly reduced expression of the astrocyte transcription factor Sox9 compared to controls, while astrocytes adjacent to regions of ablation showed no changes in Sox9 expression. c. Number of Sox9+ cells per mm³ was quantified in regions lacking Glt1 and was compared to control mice. (Control: 21302 ± 3399, n= 11; 6 hpa: 5524 ± 1526, n= 14; 11 dpa: 3138 ± 1478, n= 10; 28 dpa: 3424 ± 1142, n= 14). Dunn’s multiple comparisons test. (Control vs. 6 hpa, p= 0.0076; Control vs. 11 dpa, p= 0.0007; Control vs. 28 dpa, p= 0.0003).
We did not observe obvious differences in neuronal densities after labeling with NeuroTrace at 6 hpa and 11 dpa when compared to controls. However, NeuroTrace-positive cells appeared smaller at 28 dpa. This was found only in regions of astrocyte ablation while neuronal soma size appeared normal in neighboring Glt1+ areas (Suppl. Fig 5). These findings warrant further investigation in future studies.
We next assessed if astrocyte ablation activated microglia and if this might affect timing of astrocytic STAT3 phosphorylation. At 3 dpa, some microglia had increased levels of Iba1 appeared changed in morphology, with many membrane-rich processes. At 11dpa, many more microglia within areas of astrocyte ablation were clearly activated with Iba1 upregulation, hypertrophy of cell bodies and main processes. At this timepoint, classic morphological changes reminiscent of microglia activation dominated while “membrane-rich” microglia were no longer observed. At 28dpa, microglia activation within the areas of astrocyte ablation was even more pronounced. Some microglia were de-ramified while others had an increased number of processes (Suppl. Fig. 6). Given that phosphorylation of STAT3 in astrocytes aligned in severity with the severity of microglia activation is possible that astrocytes and microglia close to ablation areas respond to each other’s activation state.
The transcription factor Sox9 is expressed primarily by astrocytes and is upregulated in reactive astrocytes in models of stroke and Parkinson’s disease (Choi et al., 2018; Sun et al., 2017). We tested for Sox9 expression in astrocytes in and around regions of ablation (Fig. 4b). We quantified the number of Sox9+ cells per mm3 in regions of astrocyte ablation compared to controls without ablation and found significant reduction at all time points examined (Fig. 4c).
3.5. Astrocytes adjacent to ablated areas respond with morphological changes
After focal brain injury, astrocytes become hypertrophic with swollen GFAP+ cell bodies and processes. Astrocytes extend their processes toward the site of injury (Oberheim, Wang, Goldman, & Nedergaard, 2006; Robel, Bardehle, Lepier, Brakebusch, & Götz, 2011). This results, in conjunction with the response of other glia, in a physical boundary sealing the injured area off from the uninjured parts of the brain. To determine if astrocytes adjacent to ablated astrocytes respond in a similar fashion, we employed the Simple Neurite Tracer in Fiji/ImageJ in order to create a 3D projection of GFAP+ astrocytes and their processes. Length and thickness of astrocytes’ major GFAP-expressing processes were traced, and Sholl analysis was used to determine process complexity. In control mice, sparse numbers of GFAP+ astrocytes were located along blood vessels. These astrocytes were traced as controls. Table 3 contains all data and statistics obtained from astrocyte tracing. After astrocyte ablation, astrocytes neighboring the ablated regions changed over time in the number, length and volume of their GFAP+ processes (Fig. 5a). Total process length of neighboring astrocytes increased by 43.4 percent from 1 dpa (815.919 μm ± 77.147 μm, n=15) to 28 dpa (1170.540 ± 116.179 μm, n=15 ) (Fig. 5b). Total process volume of these astrocytes more than doubled, increasing by 137.8 percent from 1 dpa (514.2 μm ± 79.34 μm3, n=15) to 28 dpa (1223 ± 110.830 μm3 n=15) (Fig. 5c). Sholl analysis comparing astrocytes neighboring ablation regions at 1 dpa and 28 dpa showed a significant increase in process arborization (Two-way ANOVA for number of intersections versus timepoint, p<0.0001, n=15 astrocytes per timepoint) (Fig. 5d), suggesting that more astrocyte processes expressed GFAP over time. To determine if astrocytes extend processes into the areas of astrocyte ablation, we examined the dimensions of astrocyte domains by drawing quadrants, using the location of the ablation region as a guide (Fig. 5e). We did not find changes in length to width ratio at any timepoint compared to controls (Fig. 5f). When looking at the area of the quadrants, we also found no changes in proximal to distal area at any timepoint compared to controls (Fig. 5g). This suggests that longer GFAP+ processes result from GFAP-filaments stretching farther into already present processes rather than processes stretching into areas of loss to replace lost astrocytes. Alternatively, our approach to measuring astrocyte shape based on GFAP-tracing might not be sensitive enough to detect small polarizations toward areas of loss. In all, these data suggest that loss of astrocytes initiates mild morphological changes in their neighbors characterized by presence of GFAP filaments in a larger number of processes and increase in process volume, yet we could not detect directional polarity to these changes. Thus, loss of contact to a neighbor might either not be a signal inducing astrocyte polarity or diffuse BBB leakage, other ablation regions in close proximity, and additional cellular and molecular triggers may be present that overwrite a strong polarization toward the lost astrocyte.
Figure 5.
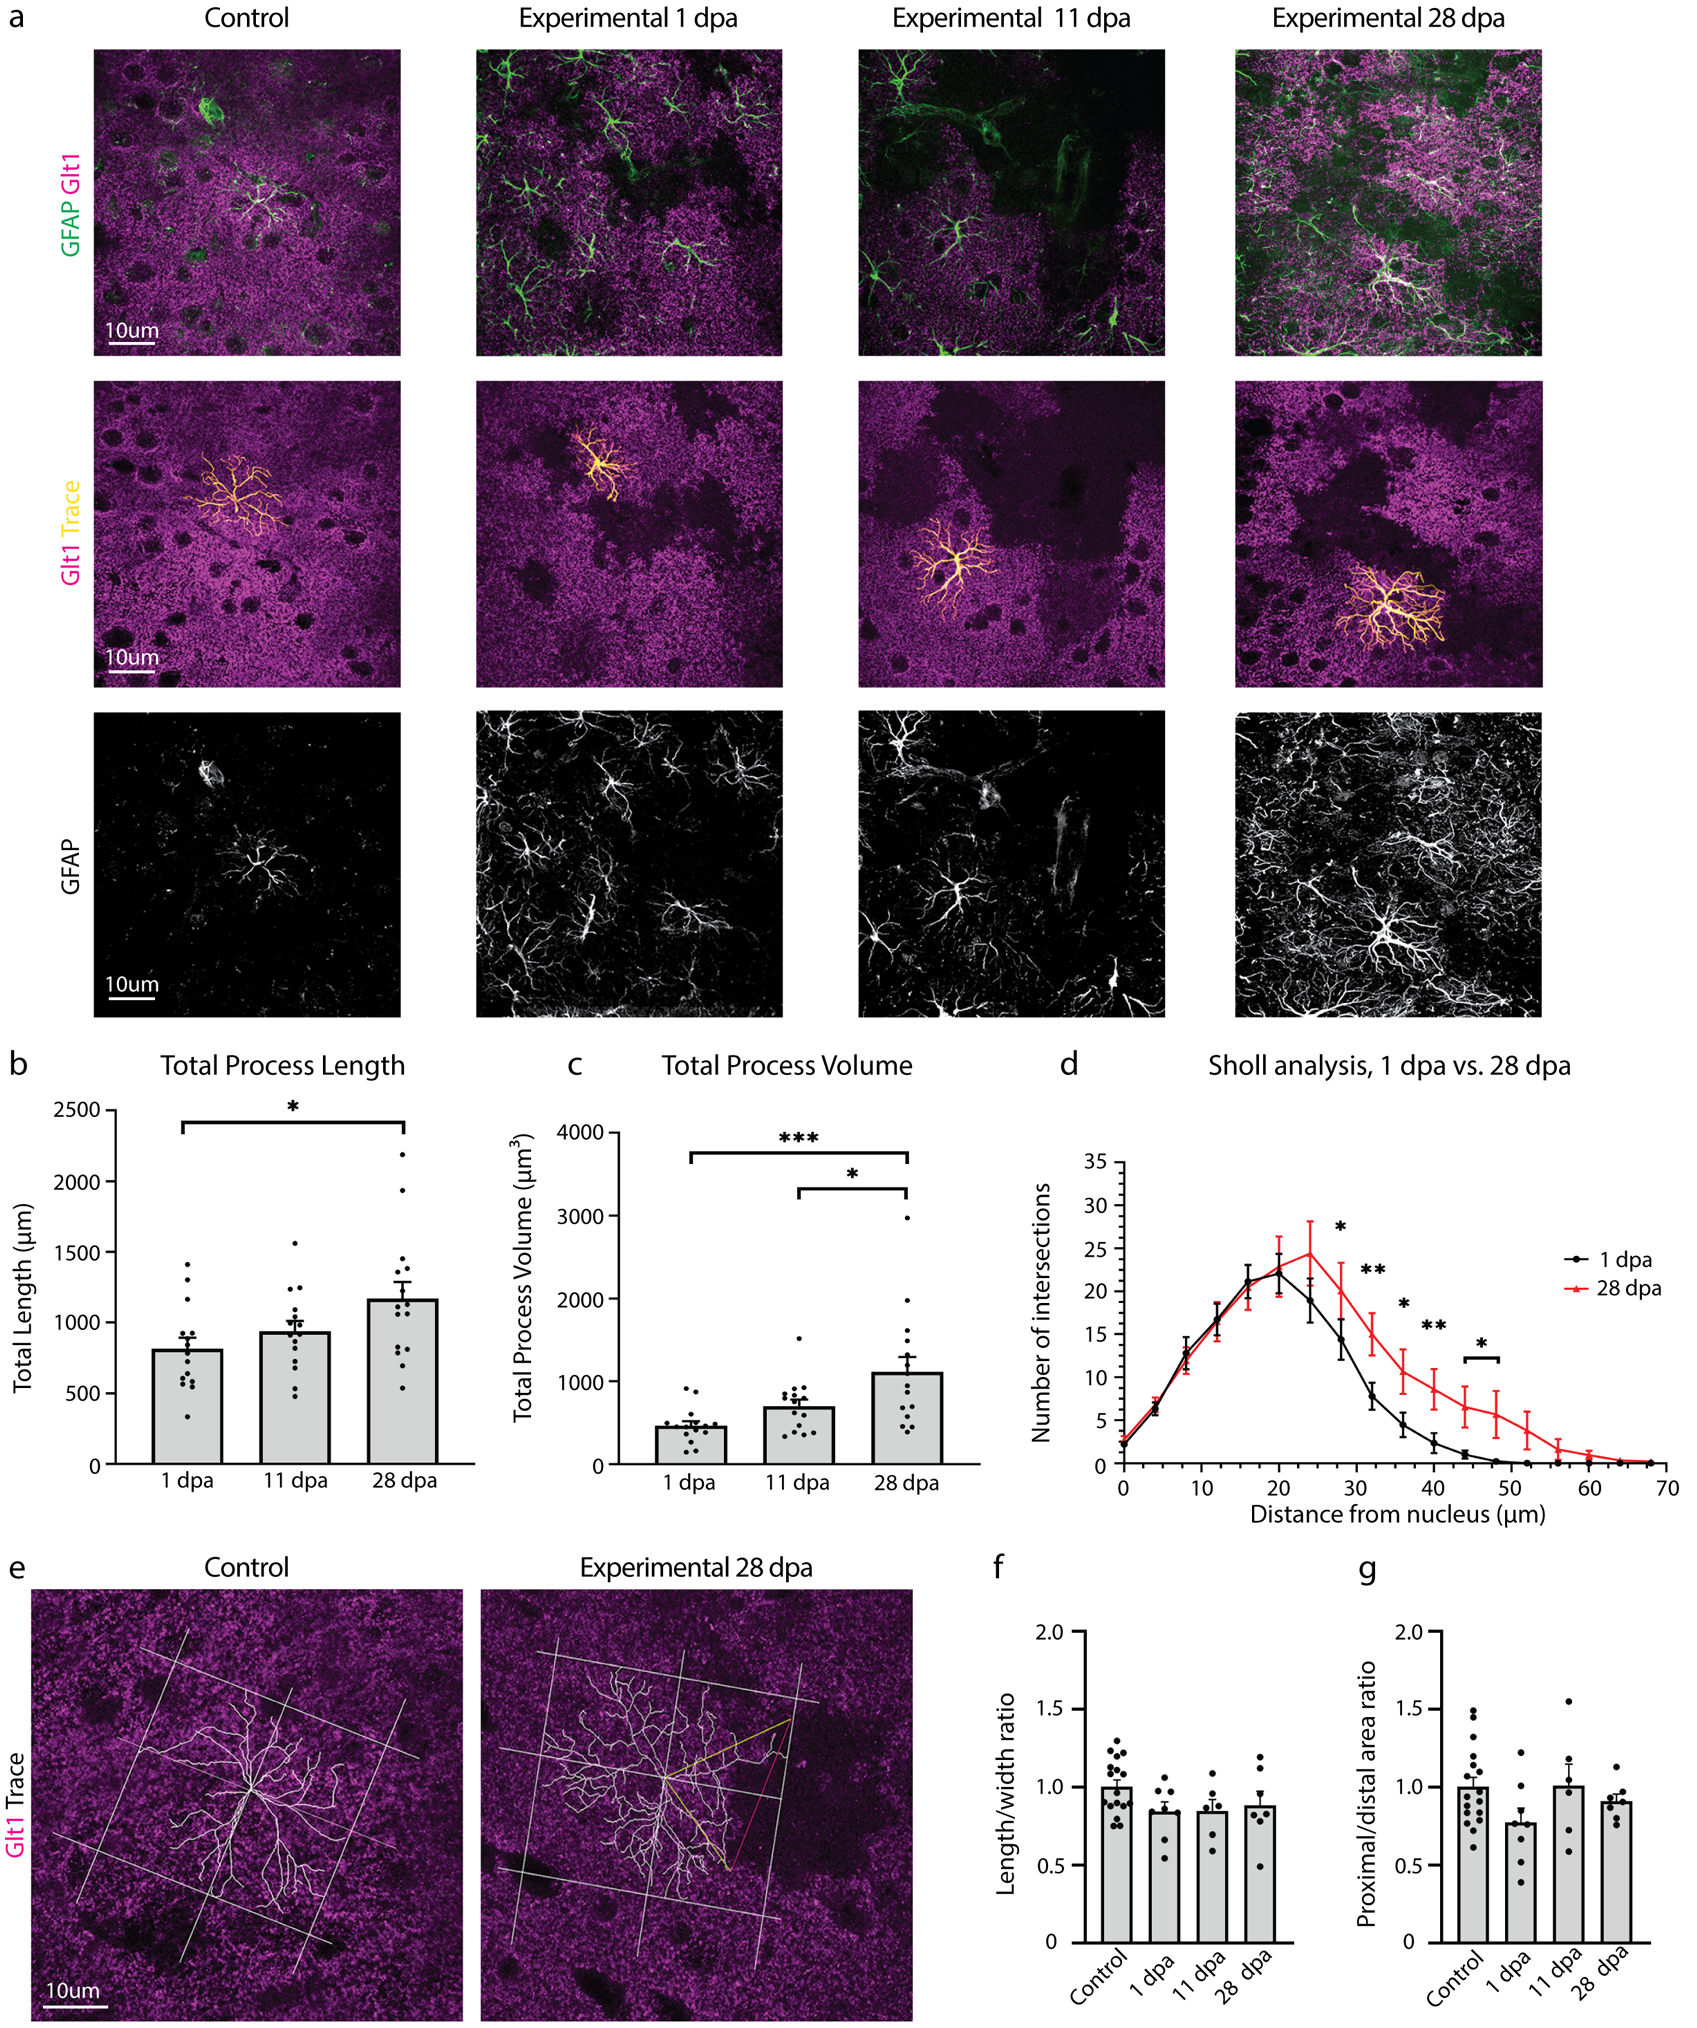
Astrocyte ablation induced GFAP upregulation in processes and mild morphological changes in neighboring astrocytes. a. Astrocytes adjacent to regions of astrocyte ablation indicated by lack of Glt1 showed increased expression of GFAP as early as 1 dpa and continued through 28 dpa. GFAP labeling was used to trace loss-adjacent astrocyte processes in ImageJ. b. Total length of all GFAP+ processes was quantified for loss-adjacent astrocytes at 1, 11, and 28 days post administration of tamoxifen. (1 dpa: 815.9 ± 77.147, n= 15; 11 dpa: 938.8 ± 93.45, n= 15; 28 dpa: 1171 ± 116.179, n= 15). Tukey’s multiple comparisons test. (1 dpa vs. 11 dpa, p= 0.6083; 1 dpa vs. 28 dpa, p= 0.0228; 11 dpa vs. 28 dpa, p= 0.1810). c. Total volume of all GFAP+ processes was quantified for loss-adjacent astrocytes at 1, 11, and 28 days post administration of tamoxifen. (1 dpa: 514.2 ± 79.34, n= 15; 11 dpa: 799.8 ± 43.81, n= 15; 28 dpa: 1223 ± 110.830, n= 15). Tukey’s multiple comparisons test. (1 dpa vs. 11 dpa, p= 0.6446; 1 dpa vs. 28 dpa, p= 0.0204; 11 dpa vs. 28 dpa, p= 0.1499). d. Sholl analysis compared arborization complexity of loss-adjacent astrocytes at 1 and 28 dpa. For statistics, see Table 3. e. Changes in astrocyte polarity were tested by drawing quadrants using astrocyte ablation regions as a reference when present. The two quadrants closest to ablation regions were called proximal, while the two quadrants furthest away were called distal. f. Length to width ratios of drawn quadrants were calculated and compared at 1, 11, and 28 dpa. (Control: 1.005 ± 0.0429, n= 17; 1 dpa: 08472 ± 0.06033, n= 8; 11 dpa: 0.8472 ± 0.0732, n= 6; 28 dpa: 0.8849 ± 0.08895, n= 7). Tukey’s multiple comparison test. (Control vs. 1 dpa, p= 0.2119; Control vs. 11 dpa, p= 0.3058; Control vs. 28 dpa, p= 0.4944). g. The ratio of proximal quadrant areas to distal quadrant areas were calculated and compared among early, middle, and late timepoints. (Control: 1.002 ± 0.06148, n= 17; 1 dpa: 0.7228 ± 0.09323, n= 8; 11 dpa: 1.01 ± 0.1398, n= 6; 28 dpa: 0.9095 ± 0.04635, n= 7). Tukey’s multiple comparison test. (Control vs. 1 dpa, p= 0.1712; Control vs. 11 dpa, p > 0.9999; Control vs. 28 dpa, p= 0.8479).
3.6. Astrocytes adjacent to ablated areas do not proliferate to replace ablated neighbors
Astrocytes in the healthy mature brain are post-mitotic, but a subset of astrocytes re-enter the cell cycle after focal brain or spinal cord injury. We next asked if astrocyte ablation triggers a proliferative response in neighboring astrocytes geared toward replacing lost cells. In order to assess astrocyte proliferation, we chose two approaches. First, we labeled brain slices of experimental and control mice with Ki67, which is expressed during active phases of the cell cycle but is absent in resting non-mitotic cells (Scholzen & Gerdes, 2000). As expected, a small number of Ki67+ cells were present throughout the cortical gray matter and a higher number was found within adult neurogenic zones in all groups (Suppl. Fig. 7a). However, S100β+ astrocytes adjacent to ablated astrocytes did not co-label with Ki67 within the cortical gray matter at 6 hpa, 1, 3, 5, 11 or 28 dpa (Suppl. Fig. 7b, control: 2 Ki67+/S100β+ cells among 10,088 S100β+ cells, n=10 mice; experimental: 1 Ki67/S100β+ cell among 3,684 S100β+ cells, n= 3–5 mice per timepoint)
Secondly, we labeled all cells that proliferated using the base analog Bromodeoxyuridine (BrdU), which was administered twice daily after Tx administration for 1, 3 and 5 days to cumulatively label all cells that proliferated during this time. BrdU is incorporated during S-phase and can later be detected by immunohistochemistry, even if the cells were not actively proliferating at the time of the tissue harvest. Similar to the findings using the acute proliferation marker Ki67, we did not find S100β+ astrocytes that co-labeled for BrdU at 1, 3, or 5 dpa (Suppl. Fig. 8, control: 1 BrdU+/S100β+ cell among 1319 S100β+ cells, n=9 mice; experimental: 1 BrdU+/S100β+ cell among 2865 S100β+ cells, n=3 mice per timepoint). To determine if astrocyte proliferation occurred at a later time, BrdU was cumulatively injected 14–28 dpa. Astrocytes did not label for BrdU at 28 dpa, suggesting that proliferation was not initiated 2–4 weeks after ablation of neighboring astrocytes. Together, astrocyte loss did not initiate proliferation of adjacent astrocytes early or late after ablation.
3.7. Astrocytes ablation results in transient weight loss and mild behavioral abnormalities
Given the loss of astrocytes, leakage of the BBB, and astrogliosis response of neighboring astrocytes in experimental mice after tamoxifen administration, we asked if these events adversely affected mouse health and behavior. We weighed all mice immediately before tamoxifen administration (Day 0) and compared post-administration subsequent weight measurements to this value. As expected, control mice gradually gained weight over the course of 28 days. While experimental mice showed no immediate weight change up to 3 dpa, they started to lose weight at 5 dpa and reached a low of −7.249 ± 1.586 % weight loss at 7 dpa (Fig. 6a). Experimental mice began to regain weight between 11 and 14 dpa, returning to their pre-tamoxifen weight by 20 dpa and continuing to increase in a manner similar to control mice through 28 dpa.
Figure 6.
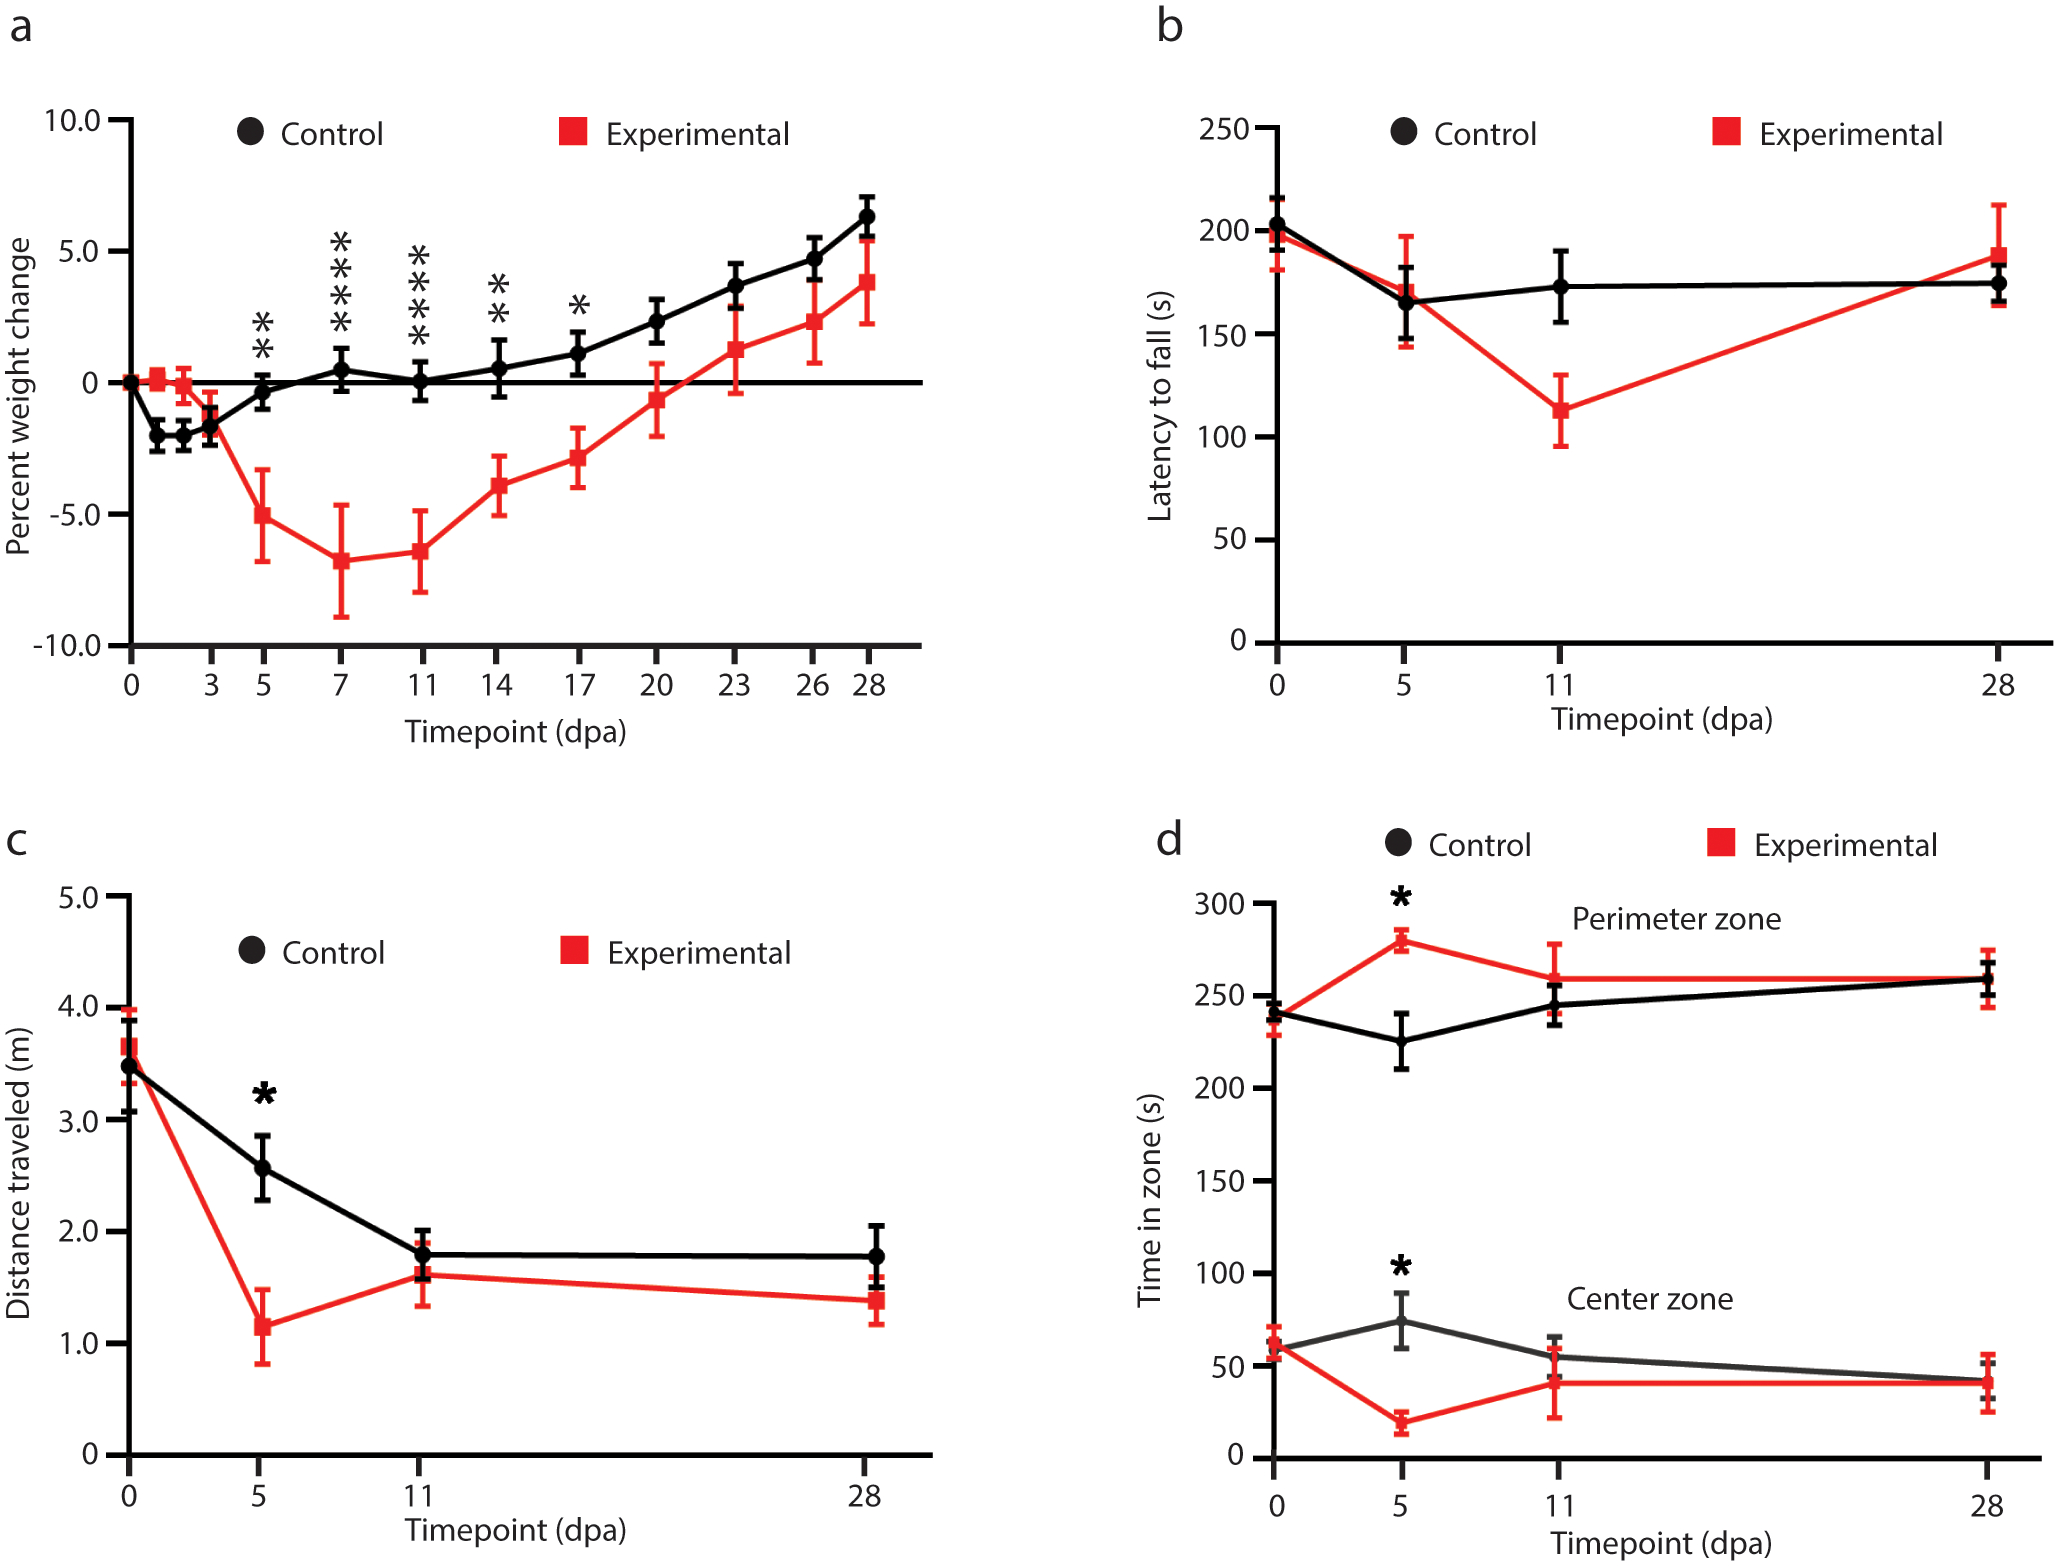
Mice show transient weight loss and mild behavioral abnormalities after astrocyte ablation. a. Mouse weights for each post-administration timepoint were calculated as the percent change from the weight recorded at Day 0, before tamoxifen was administered. For statistics, see Table 3. b. Rotarod performance was measured as latency to fall in seconds, or the time taken for the mouse to fall from the cylinder. (Day 0 control: 206.583 ± 11.209, Day 5 control: 179.083 ± 17.257, Day 11 control: 174.667 ± 14.552, Day 28 control: 178.833 ± 7.987, n for controls = 12; Day 0 experimental: 198.125 ± 16.269, Day 5 experimental: 143.325 ± 24.356, Day 11 experimental: 107.125 ± 21.278, Day 28 experimental: 188.5 ± 25.297, n for experimental = 8). Sidak’s multiple comparisons test. (Day 0 experimental vs. control, p= 0.9889; Day 5 experimental vs. control, p= 0.6843; Day 11 experimental vs. control, p= 0.0811; Day 28 experimental vs. control, p=0.9934). c. Total distance traveled in each five-minute open field session was measured before and at 5, 11, and 28 days after tamoxifen administration. (Day 0 control: 4.784 ± 0.359, Day 5 control: 3.501 ± 0.283, Day 11 control: 2.619 ± 0.206, Day 28 control: 2.319 ± 0.339, n for controls = 12; Day 0 experimental: 4.696 ± 0.335, Day 5 experimental: 1.567 ± 0.344, Day 11 experimental: 2.027 ± 0.399, Day 28 experimental: 1.960 ± 0.320, n for experimental = 8). Sidak’s multiple comparisons test. (Day 0 experimental vs. control, p= 0.9889; Day 5 experimental vs. control, p= 0.0173; Day 11 experimental vs. control, p= 0.9487; Day 28 experimental vs. control, p> 0.9999). d. The time spent in the perimeter zone (lower graph) and center zone (upper graph) out of the 300 total seconds in each session was determined before and at 5, 11, and 28 days after tamoxifen administration. (Perimeter time: Day 0 control: 241.733 ± 4.680, Day 5 control: 225.533 ± 15.177, Day 11 control: 245.075 ± 10.912, Day 28 control: 259.500 ± 8.919, n for controls = 12; Day 0 experimental: 237.363 ± 8.458, Day 5 experimental: 280.025 ± 5.837, Day 11 experimental: 259.400 ± 18.881, Day 28 experimental: 259.275 ± 15.703, n for experimental = 8). Sidak’s multiple comparisons test. (Day 0 experimental vs. control, p= 0.9866; Day 5 experimental vs. control, p= 0.0.0189; Day 11 experimental vs. control, p= 0.9487; Day 28 experimental vs. control, p> 0.9999). (Center time: Day 0 control: 58.475 ± 4.727, Day 5 control: 74.467 ± 15.177, Day 11 control: 54.925 ± 10.912, Day 28 control: 41.973 ± 9.636, n for controls = 12; Day 0 experimental: 62.638 ± 8.458, Day 5 experimental: 19.138 ± 6.065, Day 11 experimental: 40.600 ± 18.881, Day 28 experimental: 40.725 ± 15.703, n for experimental = 8). Sidak’s multiple comparisons test. (Day 0 experimental vs. control, p= 0.9889; Day 5 experimental vs. control, p= 0.0.0173; Day 11 experimental vs. control, p= 0.9487; Day 28 experimental vs. control, p> 0.9999).
To determine if astrocyte ablation affected motor coordination and balance, we used an accelerated-speed rotarod test. Mice performed the rotarod test before tamoxifen administration and at 5, 11, and 28 dpa, and the latency to fall was recorded. There was no difference between control and experimental mice despite a shorter but not statistically significant latency to fall at 11 dpa after astrocyte ablation (Fig. 6b).
To test general motor function we used the open field test. At 5 dpa, mice with astrocyte ablation traveled less overall (Fig. 6c) and spent less time spent in the center zone, while time spent in the perimeter zone increased (Fig. 6d). Yet at 11 and 28 dpa experimental mice showed no differences in any of these metrics compared to controls.
In summary, experimental mice transiently lose weight and have mild behavioral abnormalities that normalize approximately 2–4 weeks after astrocyte ablation.
4. Discussion
4.1. Astrocyte loss in the adult brain causes BBB damage of variable extent
Here, we demonstrate a necessary and non-redundant role for astrocytes in BBB maintenance in vivo using a mouse model of astrocyte ablation via tamoxifen-inducible conditional expression of the non-toxic DTA subunit, which inhibits protein synthesis. Astrocyte apoptosis occurred as early as 2 hours after tamoxifen administration. Cadaverine (~900 Da) leakage indicative of damage to the BBB occurred just as early around ablated astrocytes. In addition to penetration of the smaller molecular weight Cadaverine into the brain parenchyma, deposition of fibrinogen (340kDa) had taken place in a small subset of the areas with Cadaverine leakage. This suggests varying extents of BBB damage, possibly due to differing numbers of ablated astrocytes. Three recent studies ablating astrocytes have suggested that astrocytes are not needed for maintenance of the BBB in vivo. In the spinal cord, astrocyte ablation using a similar genetic DTA ablation system, no obvious lack of BBB integrity was observed (Schreiner et al., 2015; Tsai et al., 2012). Differences in CNS region (cortical gray matter versus spinal cord) or in the genetic approach (Glast-CreERT versus GFAP-CreERT2 or Aldh1l1-loxP-eGFP-STOP-loxP-DTA × Pax3-Cre) could account for the differences. Additionally, these studies only tested for large size damage to the BBB including presence of erythrocytes, lymphocytes and fibrinogen. It would be easy to overlook the small number of areas with BBB damage large enough to permit entry of fibrinogen or cells from the periphery. In our hands, detection of the larger-size breaches required screening of entire brains. The aforementioned studies did not assess smaller size BBB damage. Yet, small openings of the BBB permitting markers below 3 kDa still indicate significant dysfunction in the BBB (Yanagida et al., 2017).
One study concluded that there were no changes to the BBB based on the absence of leakage of Evans Blue (960 Da when unbound and 65–70 kDa when bound to albumin) and dextran (4 kDa) after laser ablation of astrocytes or endfeet followed by 2-photon imaging (Kubotera et al., 2019). Yet cell death was only confirmed by lack of a fluorescent eGFP signal, which can occur as a result of photobleaching after which the still-alive cell is no longer visible. The authors observed recovery of the GFP signal on vessels over the course of minutes to hours but no consequence of the intervention even though free Evans Blue is similar in size as Cadaverine. In our experience, GFP-labeled astrocytes photobleach readily while it is difficult to fully ablate the entire astrocyte or parts of it. It is also possible that 2-photon in vivo imaging is not sensitive enough to detect leakage of small amounts of dye. The advantage of Cadaverine is its uptake into neurons, which makes detection of even small leakages easy in tissue processed for immunohistochemistry when compared to detection of diffuse fluorescence in 2-photon imaging. Alternatively, it is possible that ablation of a single astrocyte or single endfoot is not sufficient to induce BBB damage and that secreted factors by neighboring cells are sufficient to maintain barrier integrity. Integrity of tight junctions and other barrier properties were not assessed in this study (Kubotera et al., 2019).
4.2. Do astrocyte-secreted factors maintain the blood-brain barrier?
We tested for tight junction integrity by examining the essential tight junction protein ZO-1, a transmembrane protein needed for assembly of the tight junction complex. In order to anchor the tight junctional complex to the cell’s actin cytoskeleton it must be localized correctly (Katsuno et al., 2008) and any abnormal localization of ZO-1 is indicative of defective tight junctions. Endothelial tight junctions were impaired hours after astrocyte ablation. In areas where astrocytes were ablated but Cadaverine leakage had not yet occurred, tight junctions appeared intact suggesting that astrocyte ablation caused damage to tight junctions, which then resulted in dye leakage. The mechanisms by which astrocytes maintain the BBB need to be resolved in future studies.
Of the secreted factors reported to modulate BBB function, only angiotensinogen is highly expressed in mature astrocytes. Angiotensinogen found in the CNS is produced primarily by astrocytes (Stornetta, Hawelu-Johnson, Guyenet, & Lynch, 1988) and is an essential component of the brain renin-angiotensin system (RAS) that maintains blood pressure homeostasis(Tanimoto et al., 1994).The enzymatic cleavage of angiotensinogen produces angiotensin-II (Ang-II), which binds to BBB endothelial cells and is considered to be a central player in regulating blood pressure, yet there is significant controversy whether Ang-II promotes or disrupts BBB integrity. Studies performed in vitro have shown that Ang-II reduces BBB permeability and promotes tight junction expression in developing BBB endothelial cell monolayers (Wosik et al., 2007), but increases permeability when added to already established monolayers (Fleegal-DeMotta, Doghu, & Banks, 2009). BBB-disruptive effects of Ang-II were also found in vivo, though in the context of injury, disease (Takane et al., 2017), or pre-induced hypertension. In these models, Ang-II was introduced either directly into the CNS via infusion (Li et al., 2016) or indirectly via BBB disruption (Biancardi, Son, Ahmadi, Filosa, & Stern, 2014)that permitted entry of Ang-II (alongside other blood-borne factors) from circulation. Both scenarios resulted in higher than physiological-levels of Ang-II that are not solely derived from astrocytes, and are thus insufficient models for studying roles of Ang-II mediated astrocyte maintenance of the BBB.
Complete lack of angiotensinogen and thus Ang-II also results in BBB disruption, evidenced by diffuse BBB leakage and decreased tight junction expression found in angiotensinogen knockout mice (Kakinuma et al., 1998; Wosik et al., 2007). Although tight junctions were not assessed thoroughly in this study, the BBB dysfunction bears similarities to our data. However, the lack of angiotensinogen throughout the body and during development creates a pre-existing hypertensive environment (Tanimoto et al., 1994) that prevents definitive conclusions about the role of angiotensinogen/ Ang-II in maintenance of the healthy adult BBB.
4.3. Astrocyte loss triggers partial and delayed scar formation in neighboring astrocytes
In areas surrounding astrocyte ablation, neighboring astrocytes responded with mild to moderate GFAP increase within the first week after ablation. This occurred in conjunction with microglia activation, which occurred around 3 days after ablation and was pronounced in areas of astrocyte loss at 28 dpa. Phosphorylation of the transcriptional activator STAT3, which has a binding site within the GFAP promoter and occurs 1–5 days after spinal cord injury, is responsible for scar formation after spinal cord injury (Wanner et al., 2013). Interestingly, STAT3 phosphorylation did not occur until 11 days after astrocyte ablation, well after we noted an increase in GFAP. This is in contrast to other reports demonstrating that phosphorylation of STAT3 precedes GFAP upregulation in striatal neurotoxicity (O’Callaghan, Kelly, VanGilder, Sofroniew, & Miller, 2014) and after spinal cord injury. In the latter injury paradigm, STAT3 phosphorylation subsides 7–14 days later (Herrmann et al., 2008). However, 2–4 weeks after astrocyte ablation an increasing number of astrocytes were positive for pSTAT3 which correlated with increased numbers of GFAP+ processes and morphological changes including cellular hypertrophy. This delayed timeline for STAT3 phosphorylation might be explained by the gradual astrocyte loss and reduced extent of BBB damage, compared to an acute large invasive injury with hemorrhage and infiltration of immune cells. Whether astrocyte cell death or BBB leakage triggered the response of neighboring astrocytes was difficult to determine given that BBB damage occurred quickly after astrocyte ablation.
4.4. Astrocyte loss does not induce proliferation of neighboring astrocytes
Astrocytes adjacent to ablated areas did not re-enter the cell cycle suggesting that loss of a neighbor is not sufficient to trigger re-entry into the cell cycle. This is surprising as culture studies suggest that contact inhibition is a prominent signal suppressing cell proliferation and exit from the cell cycle (Pavel et al., 2018). The lack of proliferation after astrocyte ablation in the adult brain suggests that other signals trigger re-entry of astrocytes into the cell cycle after CNS injury. In the context of severe focal brain or spinal cord injury, a 30–70 percent of scar-forming astrocytes proliferate (Bardehle et al., 2013; Buffo et al., 2008; Wanner et al., 2013), while proliferation is not initiated after genetically induced neuronal cell death, in mouse models of Alzheimer disease (Behrendt et al., 2013), or in a mouse model of chronic astrogliosis (Robel et al., 2009). Based on these observations, exposure of the brain to blood-borne substances might be a possible trigger initiating proliferation after acute injury. However, we did not observe proliferating astrocytes in areas with Cadaverine or fibrinogen leakage. This does not exclude the possibility that rapid exposure to or higher concentrations of blood-borne factors would induce astrocyte proliferation. Alternatively, different factors or a combination of factors absent after astrocyte ablation are necessary for astrocytes to re-enter the cell cycle.
4.5. The blood-brain barrier fails to repair in areas of astrocyte ablation
We observed BBB damage across all timepoints, suggesting a lack of barrier repair. However, the area covered by Cadaverine leakage was reduced by half and appeared restricted to areas of astrocyte ablation at 28 dpa, suggesting that the response of adjacent astrocytes might restrict diffusion of blood-borne factors. The ablation of proliferating, GFAP+ astrocytes after focal traumatic brain injury prevents repair, resulting in prolonged and more widespread BBB leakage. Interestingly, fetal astrocyte grafts can replace ablated astrocytes at the site of injury and induce BBB repair, suggesting an intrinsic ability of astrocytes in repairing the damaged BBB (Bush, et al.,1999). In the context of CNS injury, a dual role for astrocytes at the BBB is documented by many studies: In some injury paradigms, astrocytes upregulate factors that increase BBB permeability via downregulation of tight junctions. Among these factors are vascular endothelial growth factor, matrix metalloproteinases, and nitric oxides (Gu et al., 2012; Jiang, Xia, Jiang, Wang, & Gao, 2014; Yang, Estrada, Thompson, Liu, & Rosenberg, 2007). Conversely, increased expression of glial derived neurotrophic factor and retinoic acid promote tight junction expression and reduce permeability after stroke (Kong et al., 2015; Liu et al., 2016) and in multiple sclerosis (Mizee et al., 2014). Reactive astrocytes in inflammatory lesions can even form their own tight junctions, exerting barrier functions to limit leukocyte infiltration into the CNS when endothelial barriers are compromised (Horng, et al., 2017). Lack of angiotensinogen has also been associated with failure of BBB repair after cold injury. While the BBB was repaired and not permissive to Evans Blue in wildtype mice within 5 days of the injury, Evans Blue still leaked into the brain parenchyma of angiotensinogen KO mice 2 weeks post injury (Kakinuma et al., 1998). Thus dependent on disease context, age and surrounding microenvironment, astrocytes may lose their ability to maintain the BBB, contribute to BBB repair or even cause barrier damage.
Supplementary Material
Supplemental Figure 1. Semi-automatic quantification of Glt1 loss regions using ImageJ. a. Large images of sagittal slices were acquired for both experimental and control mice at all timepoints using line scanning at 20x magnification. b. Images were binarized based using intensity parameters that selected for Glt-1 negative regions. c. Binary images were run through the “fill holes” algorithm to fill in Glt-1 negative regions and create discrete shapes. d. The Glt1 negative regions that are blood vessels and neurons were excluded using consistent size and circularity quantification parameters. The remaining Glt1 negative regions were quantified as regions of astrocyte ablation.
Supplemental Figure 2. a. Male and female mice (DTAfl/wt//Glast-CreERTtg/wt) administered tamoxifen or an oil vehicle only or nothing at all (naïve) did not show astrocyte ablation indicated by no lack of the continuous labeling of astrocyte fine processes with the astrocyte marker membrane-associated astrocyte glutamate transporter Glt1. b-c. In addition to cortical loss of Glt1, Experimental mice showed Glt1 loss in hippocampus and striatum after tamoxifen administration. d. Bergmann glia in the cerebellum that highly express GLAST at high levels in the adult and this in cerebellum showed noticeable depletion in density after tamoxifen administration (arrowheads).
Supplemental Figure 3. Astrocyte ablation in cortex indicated by lack of expression of astrocyte markers. a. Lack of astrocyte marker S100β overlaps with lack of Glt1 in experimental mice. b. In control mice, the few Glt1-negative areas detected still labeled for S100β (arrowheads). c. Lack of astrocyte marker Aquaporin-4 (AQ4) overlaps with lack of Glt1 in experimental mice at early, middle, and late timepoints. d. For each image, mean grayscale value for AQP4 was measured in regions lacking Glt1 and compared to mean grayscale value for AQP4 in adjacent Glt-positive regions for early (6 hpa), middle (11 dpa) and late (28 dpa) timepoints. (6 hpa outside ablation region: 621.048 ± 47.375, n=13; 11 dpa outside ablation region: 797.588 ± 52.533, n= 11; 28 outside ablation region: 866.386 ± 85.946, n= 13; 6 hpa inside ablation region: 159.998 ± 23.087, n= 13; 11 dpa inside ablation region: 232.135 ± 16.893, n= 11; 28 inside ablation region: 333.264 ± 27.403, n= 13). Tukey’s multiple comparisons test. (6 hpa outside ablation region vs. 6 hpa inside ablation region, p< 0.0001; 11 dpa outside ablation region vs. 11 dpa inside ablation region, p< 0.0001; 28 dpa outside ablation region vs. 28 dpa inside ablation region, p< 0.0001).
Supplemental Figure 4. Cadaverine leakage occurred after astrocyte ablation across cortex. a. Large area scans of cortex showed minimal Cadaverine leakage in control mice, while diffuse areas of leakage were found in experimental mice.
Supplemental Figure 5. Astrocyte ablation does not induce any obvious neuronal changes a. Nissl staining showed no observable changes in neuronal numbers in regions of astrocyte ablation at early and middle timepoints, though clusters of small Nissl+ cells appeared in ablation regions at the late 28 dpa timepoint.
Supplemental Figure 6. Astrocyte ablation induces changes in microglia morphology. a. Microglia showed morphology changes and increased Iba1 levels in regions of ablated astrocytes.
Supplemental Figure 7. Astrocyte ablation does not induce proliferation of neighboring astrocytes. a. Ki67+cells were present in all mice at the subependymal zone, which contains proliferating cells in adult mice. b. Astrocytes adjacent to loss regions did not express the mitotic marker Ki67 but Ki67+ cells of other cell identity (arrowheads) were present in both control and experimental groups.
Supplemental Figure 8. Astrocyte ablation does not induce proliferation of neighboring astrocytes. a. Astrocytes adjacent to loss regions did not express the mitotic marker BrdU but BrdU+ cells of other cell identity (arrowheads) were present in both control and experimental groups.
Acknowledgements
This work was supported by the National Institute of Neurological Disorders and Stroke at the National Institutes of Health (grant number R01NS105807). We thank Katie Barnes, Maame Boateng, Deyton Cook, and Dzenis Mahmutovic for their contributions to data collection.
Footnotes
Conflict of Interest Statement
The authors declare no conflict of interest.
Data Availability Statement
The data supporting the findings in this study are available upon reasonable request from the corresponding author.
References
- Anderson MA, Burda JE, Ren Y, Ao Y, O’Shea TM, Kawaguchi R, … Sofroniew MV (2016). Astrocyte scar formation aids central nervous system axon regeneration. Nature, 532(7598), 195–200. doi: 10.1038/nature17623 [DOI] [PMC free article] [PubMed] [Google Scholar]
- Argaw AT, Asp L, Zhang J, Navrazhina K, Pham T, Mariani JN, … John GR (2012). Astrocyte-derived VEGF-A drives blood-brain barrier disruption in CNS inflammatory disease. The Journal of clinical investigation, 122(7), 2454–2468. doi: 10.1172/JCI60842 [DOI] [PMC free article] [PubMed] [Google Scholar]
- Armulik A, Genové G, Mäe M, Nisancioglu MH, Wallgard E, Niaudet C, … Betsholtz C (2010). Pericytes regulate the blood–brain barrier. Nature, 468(7323), 557–561. doi: 10.1038/nature09522 [DOI] [PubMed] [Google Scholar]
- Bardehle S, Krüger M, Buggenthin F, Schwausch J, Ninkovic J, Clevers H, … Götz M (2013). Live imaging of astrocyte responses to acute injury reveals selective juxtavascular proliferation. Nature neuroscience, 16(5), 580–586. doi: 10.1038/nn.3371 [DOI] [PubMed] [Google Scholar]
- Behrendt G, Baer K, Buffo A, Curtis MA, Faull RL, Rees MI, … Dimou L (2013). Dynamic changes in myelin aberrations and oligodendrocyte generation in chronic amyloidosis in mice and men. Glia, 61(2), 273–286. doi: 10.1002/glia.22432 [DOI] [PubMed] [Google Scholar]
- Biancardi VC, Son SJ, Ahmadi S, Filosa JA, & Stern JE (2014). Circulating angiotensin II gains access to the hypothalamus and brain stem during hypertension via breakdown of the blood-brain barrier. Hypertension (Dallas, Tex. : 1979), 63(3), 572–579. doi: 10.1161/HYPERTENSIONAHA.113.01743 [DOI] [PMC free article] [PubMed] [Google Scholar]
- Boado RJ, & Pardridge WM (1993). Glucose Deprivation Causes Posttranscriptional Enhancement of Brain Capillary Endothelial Glucose Transporter Gene Expression via GLUT1 mRNA Stabilization. Journal of neurochemistry, 60(6), 2290–2296. doi: 10.1111/j.1471-4159.1993.tb03516.x [DOI] [PubMed] [Google Scholar]
- Boulay A-C, Saubaméa B, Adam N, Chasseigneaux S, Mazaré N, Gilbert A, … Cohen-Salmon M (2017). Translation in astrocyte distal processes sets molecular heterogeneity at the gliovascular interface. Cell Discovery, 3(1), 17005. doi: 10.1038/celldisc.2017.5 [DOI] [PMC free article] [PubMed] [Google Scholar]
- Buffo A, Rite I, Tripathi P, Lepier A, Colak D, Horn A-P, … Götz M (2008). Origin and progeny of reactive gliosis: A source of multipotent cells in the injured brain. Proceedings of the National Academy of Sciences of the United States of America, 105(9), 3581–3586. doi: 10.1073/pnas.0709002105 [DOI] [PMC free article] [PubMed] [Google Scholar]
- Bush TG, Puvanachandra N, Horner CH, Polito A, Ostenfeld T, Svendsen CN, Mucke L, Johnson MH, Sofroniew MV (1999). Leukocyte infiltration, neuronal degeneration, and neurite outgrowth after ablation of scar-forming, reactive astrocytes in adult transgenic mice. Neuron, 23(2), 297–308. doi: 10.1016/s0896-6273(00)80781-3 [DOI] [PubMed] [Google Scholar]
- Canfield SG, Stebbins MJ, Morales BS, Asai SW, Vatine GD, Svendsen CN, … Shusta EV (2017). An isogenic blood-brain barrier model comprising brain endothelial cells, astrocytes, and neurons derived from human induced pluripotent stem cells. Journal of neurochemistry, 140(6), 874–888. doi: 10.1111/jnc.13923 [DOI] [PMC free article] [PubMed] [Google Scholar]
- Choi D-J, Eun J-H, Kim BG, Jou I, Park SM, & Joe E-H (2018). A Parkinson’s disease gene, DJ-1, repairs brain injury through Sox9 stabilization and astrogliosis. Glia, 66(2), 445–458. doi: 10.1002/glia.23258 [DOI] [PubMed] [Google Scholar]
- Daneman R, Zhou L, Kebede AA, & Barres BA (2010). Pericytes are required for blood–brain barrier integrity during embryogenesis. Nature, 468(7323), 562–566. doi: 10.1038/nature09513 [DOI] [PMC free article] [PubMed] [Google Scholar]
- Fleegal-DeMotta MA, Doghu S, & Banks WA (2009). Angiotensin II Modulates BBB Permeability via Activation of the AT1 Receptor in Brain Endothelial Cells. Journal of Cerebral Blood Flow & Metabolism, 29(3), 640–647. doi: 10.1038/jcbfm.2008.158 [DOI] [PubMed] [Google Scholar]
- Gu Y, Zheng G, Xu M, Li Y, Chen X, Zhu W, … Shen J (2012). Caveolin-1 regulates nitric oxide-mediated matrix metalloproteinases activity and blood–brain barrier permeability in focal cerebral ischemia and reperfusion injury. Journal of neurochemistry, 120(1), 147–156. doi: 10.1111/j.1471-4159.2011.07542.x [DOI] [PubMed] [Google Scholar]
- Herrmann JE, Imura T, Song B, Qi J, Ao Y, Nguyen TK, … Sofroniew MV (2008). STAT3 is a critical regulator of astrogliosis and scar formation after spinal cord injury. The Journal of neuroscience : the official journal of the Society for Neuroscience, 28(28), 7231–7243. doi: 10.1523/JNEUROSCI.1709-08.2008 [DOI] [PMC free article] [PubMed] [Google Scholar]
- Horng S, Therattil A, Moyon S, Gordon A, Kim K, Argaw AT, Hara Y, Mariani JN, … John GR (2017) Astrocytic tight junctions control inflammatory CNS lesion pathogenesis. The Journal of Clinical Investigation. 127(8), 3136–3151. doi: 10.1172/ [DOI] [PMC free article] [PubMed] [Google Scholar]
- Huang B, Krafft PR, Ma Q, Rolland WB, Caner B, Lekic T, … Zhang JH (2012). Fibroblast growth factors preserve blood-brain barrier integrity through RhoA inhibition after intracerebral hemorrhage in mice. Neurobiology of disease, 46(1), 204–214. doi: 10.1016/j.nbd.2012.01.008 [DOI] [PMC free article] [PubMed] [Google Scholar]
- Igarashi Y, Utsumi H, Chiba H, Yamada-Sasamori Y, Tobioka H, Kamimura Y, … Sawada N (1999). Glial Cell Line-Derived Neurotrophic Factor Induces Barrier Function of Endothelial Cells Forming the Blood–Brain Barrier. Biochemical and Biophysical Research Communications, 261(1), 108–112. doi: 10.1006/bbrc.1999.0992 [DOI] [PubMed] [Google Scholar]
- Ito K, Sanosaka T, Igarashi K, Ideta-Otsuka M, Aizawa A, Uosaki Y, … Takizawa T (2016). Identification of genes associated with the astrocyte-specific gene Gfap during astrocyte differentiation. Scientific reports, 6(1), 23903. doi: 10.1038/srep23903 [DOI] [PMC free article] [PubMed] [Google Scholar]
- Janzer RC, & Raff MC (1987). Astrocytes induce blood–brain barrier properties in endothelial cells. Nature, 325(6101), 253–257. doi: 10.1038/325253a0 [DOI] [PubMed] [Google Scholar]
- Jiang S, Xia R, Jiang Y, Wang L, & Gao F (2014). Vascular endothelial growth factors enhance the permeability of the mouse blood-brain barrier. PloS one, 9(2), e86407–e86407. doi: 10.1371/journal.pone.0086407 [DOI] [PMC free article] [PubMed] [Google Scholar]
- Kakinuma Y, Hama H, Sugiyama F, Yagami K. i., Goto K, Murakami K, & Fukamizu A (1998). Impaired blood–brain barrier function in angiotensinogen-deficient mice. Nature Medicine, 4(9), 1078–1080. doi: 10.1038/2070 [DOI] [PubMed] [Google Scholar]
- Katsuno T, Umeda K, Matsui T, Hata M, Tamura A, Itoh M, … Tsukita S (2008). Deficiency of zonula occludens-1 causes embryonic lethal phenotype associated with defected yolk sac angiogenesis and apoptosis of embryonic cells. Molecular biology of the cell, 19(6), 2465–2475. doi: 10.1091/mbc.e07-12-1215 [DOI] [PMC free article] [PubMed] [Google Scholar]
- Kong L, Wang Y, Wang X-J, Wang X-T, Zhao Y, Wang L-M, & Chen Z-Y (2015). Retinoic acid ameliorates blood–brain barrier disruption following ischemic stroke in rats. Pharmacological Research, 99, 125–136. doi: 10.1016/j.phrs.2015.05.014 [DOI] [PubMed] [Google Scholar]
- Kubotera H, Ikeshima-Kataoka H, Hatashita Y, Allegra Mascaro AL, Pavone FS, & Inoue T (2019). Astrocytic endfeet re-cover blood vessels after removal by laser ablation. Scientific reports, 9(1), 1263–1263. doi: 10.1038/s41598-018-37419-4 [DOI] [PMC free article] [PubMed] [Google Scholar]
- Lee S-W, Kim WJ, Choi YK, Song HS, Son MJ, Gelman IH, … Kim K-W (2003). SSeCKS regulates angiogenesis and tight junction formation in blood-brain barrier. Nature Medicine, 9(7), 900–906. doi: 10.1038/nm889 [DOI] [PubMed] [Google Scholar]
- Li Z, Mo N, Li L, Cao Y, Wang W, Liang Y, … Guo X (2016). Surgery-Induced Hippocampal Angiotensin II Elevation Causes Blood-Brain Barrier Disruption via MMP/TIMP in Aged Rats. Frontiers in cellular neuroscience, 10, 105–105. doi: 10.3389/fncel.2016.00105 [DOI] [PMC free article] [PubMed] [Google Scholar]
- Liu Y, Wang S, Luo S, Li Z, Liang F, Zhu Y, … Huang R (2016). Intravenous PEP-1-GDNF is protective after focal cerebral ischemia in rats. Neuroscience Letters, 617, 150–155. doi: 10.1016/j.neulet.2016.02.017 [DOI] [PubMed] [Google Scholar]
- Longair MH, Baker DA, & Armstrong JD (2011). Simple Neurite Tracer: open source software for reconstruction, visualization and analysis of neuronal processes. Bioinformatics, 27(17), 2453–2454. doi: 10.1093/bioinformatics/btr390 [DOI] [PubMed] [Google Scholar]
- Min H, Hong J, Cho I-H, Jang YH, Lee H, Kim D, … Lee SJ (2015). TLR2-induced astrocyte MMP9 activation compromises the blood brain barrier and exacerbates intracerebral hemorrhage in animal models. Molecular brain, 8, 23–23. doi: 10.1186/s13041-015-0116-z [DOI] [PMC free article] [PubMed] [Google Scholar]
- Mizee MR, Nijland PG, van der Pol SMA, Drexhage JAR, van het Hof B, Mebius R, … de Vries HE (2014). Astrocyte-derived retinoic acid: a novel regulator of blood–brain barrier function in multiple sclerosis. Acta Neuropathologica, 128(5), 691–703. doi: 10.1007/s00401-014-1335-6 [DOI] [PubMed] [Google Scholar]
- Mori T, Tanaka K, Buffo A, Wurst W, Kühn R, & Götz M (2006). Inducible gene deletion in astroglia and radial glia—A valuable tool for functional and lineage analysis. Glia, 54(1), 21–34. doi: 10.1002/glia.20350 [DOI] [PubMed] [Google Scholar]
- Nathans J (2010). Generation of an inducible Slc1a3-cre/ERT transgenic allele. MGI Direct Submission. [Google Scholar]
- O’Callaghan JP, Kelly KA, VanGilder RL, Sofroniew MV, & Miller DB (2014). Early activation of STAT3 regulates reactive astrogliosis induced by diverse forms of neurotoxicity. PloS one, 9(7), e102003–e102003. doi: 10.1371/journal.pone.0102003 [DOI] [PMC free article] [PubMed] [Google Scholar]
- Oberheim NA, Wang X, Goldman S, & Nedergaard M (2006). Astrocytic complexity distinguishes the human brain. Trends in Neurosciences, 29(10), 547–553. doi: 10.1016/j.tins.2006.08.004 [DOI] [PubMed] [Google Scholar]
- Pardridge W, Boado R, & Farrell C (1990). Brain-type glucose transporter (GLUT-1) is selectively localized to the blood-brain barrier: Studies with quantitative Western blotting and in situ hybridization. The Journal of biological chemistry, 265, 18035–18040. [PubMed] [Google Scholar]
- Pavel M, Renna M, Park SJ, Menzies FM, Ricketts T, Füllgrabe J, … Rubinsztein DC (2018). Contact inhibition controls cell survival and proliferation via YAP/TAZ-autophagy axis. Nature communications, 9(1), 2961. doi: 10.1038/s41467-018-05388-x [DOI] [PMC free article] [PubMed] [Google Scholar]
- Reuss B, Dono R, & Unsicker K (2003). Functions of fibroblast growth factor (FGF)-2 and FGF-5 in astroglial differentiation and blood-brain barrier permeability: evidence from mouse mutants. The Journal of neuroscience : the official journal of the Society for Neuroscience, 23(16), 6404–6412. doi: 10.1523/JNEUROSCI.23-16-06404.2003 [DOI] [PMC free article] [PubMed] [Google Scholar]
- Robel S, Bardehle S, Lepier A, Brakebusch C, & Götz M (2011). Genetic deletion of cdc42 reveals a crucial role for astrocyte recruitment to the injury site in vitro and in vivo. The Journal of neuroscience : the official journal of the Society for Neuroscience, 31(35), 12471–12482. doi: 10.1523/JNEUROSCI.2696-11.2011 [DOI] [PMC free article] [PubMed] [Google Scholar]
- Robel S, Mori T, Zoubaa S, Schlegel J, Sirko S, Faissner A, … Götz M (2009). Conditional deletion of β1-integrin in astroglia causes partial reactive gliosis. Glia, 57(15), 1630–1647. doi: 10.1002/glia.20876 [DOI] [PubMed] [Google Scholar]
- Rubin LL, Hall DE, Porter S, Barbu K, Cannon C, Horner HC, … Morales J (1991). A cell culture model of the blood-brain barrier. The Journal of cell biology, 115(6), 1725–1735. doi: 10.1083/jcb.115.6.1725 [DOI] [PMC free article] [PubMed] [Google Scholar]
- Scholzen T, & Gerdes J (2000). The Ki-67 protein: From the known and the unknown. Journal of Cellular Physiology, 182(3), 311–322. doi: 10.1002/(SICI)1097-4652(200003)182:3<311::AID-JCP1>3.0.CO;2-9 [DOI] [PubMed] [Google Scholar]
- Schreiner B, Romanelli E, Liberski P, Ingold-Heppner B, Sobottka-Brillout B, Hartwig T, … Becher B (2015). Astrocyte Depletion Impairs Redox Homeostasis and Triggers Neuronal Loss in the Adult CNS. Cell Reports, 12(9), 1377–1384. doi: 10.1016/j.celrep.2015.07.051 [DOI] [PubMed] [Google Scholar]
- Sharma K, Schmitt S, Bergner CG, Tyanova S, Kannaiyan N, Manrique-Hoyos N, … Simons M (2015). Cell type- and brain region–resolved mouse brain proteome. Nature neuroscience, 18(12), 1819–1831. doi: 10.1038/nn.4160 [DOI] [PMC free article] [PubMed] [Google Scholar]
- Siddharthan V, Kim YV, Liu S, & Kim KS (2007). Human astrocytes/astrocyte-conditioned medium and shear stress enhance the barrier properties of human brain microvascular endothelial cells. Brain research, 1147, 39–50. doi: 10.1016/j.brainres.2007.02.029 [DOI] [PMC free article] [PubMed] [Google Scholar]
- Sirko S, Behrendt G, Johansson, Pia A, Tripathi P, Costa MR, Bek S, … Götz M (2013). Reactive Glia in the Injured Brain Acquire Stem Cell Properties in Response to Sonic Hedgehog. Cell Stem Cell, 12(4), 426–439. doi: 10.1016/j.stem.2013.01.019 [DOI] [PubMed] [Google Scholar]
- Srinivasan R, Lu T-Y, Chai H, Xu J, Huang BS, Golshani P, … Khakh BS (2016). New Transgenic Mouse Lines for Selectively Targeting Astrocytes and Studying Calcium Signals in Astrocyte Processes In Situ and In Vivo. Neuron, 92(6), 1181–1195. doi: 10.1016/j.neuron.2016.11.030 [DOI] [PMC free article] [PubMed] [Google Scholar]
- Stewart PA, & Wiley MJ (1981). Developing nervous tissue induces formation of blood-brain barrier characteristics in invading endothelial cells: A study using quail-chick transplantation chimeras. Developmental Biology, 84(1), 183–192. doi: 10.1016/0012-1606(81)90382-1 [DOI] [PubMed] [Google Scholar]
- Stornetta RL, Hawelu-Johnson CL, Guyenet PG, & Lynch KR (1988). Astrocytes Synthesize Angiotensinogen in Brain. Science, 242(4884), 1444–1446. [DOI] [PubMed] [Google Scholar]
- Sun W, Cornwell A, Li J, Peng S, Osorio MJ, Aalling N, … Nedergaard M (2017). SOX9 Is an Astrocyte-Specific Nuclear Marker in the Adult Brain Outside the Neurogenic Regions. The Journal of neuroscience : the official journal of the Society for Neuroscience, 37(17), 4493–4507. doi: 10.1523/JNEUROSCI.3199-16.2017 [DOI] [PMC free article] [PubMed] [Google Scholar]
- Takane K, Hasegawa Y, Lin B, Koibuchi N, Cao C, Yokoo T, & Kim-Mitsuyama S (2017). Detrimental Effects of Centrally Administered Angiotensin II are Enhanced in a Mouse Model of Alzheimer Disease Independently of Blood Pressure. Journal of the American Heart Association, 6(4), e004897. doi:doi: 10.1161/JAHA.116.004897 [DOI] [PMC free article] [PubMed] [Google Scholar]
- Tanimoto K, Sugiyama F, Goto Y, Ishida J, Takimoto E, Yagami K, … Murakami K (1994). Angiotensinogen-deficient mice with hypotension. Journal of Biological Chemistry, 269(50), 31334–31337. [PubMed] [Google Scholar]
- Tao-Cheng JH, Nagy Z, & Brightman MW (1987). Tight junctions of brain endothelium in vitro are enhanced by astroglia. The Journal of neuroscience : the official journal of the Society for Neuroscience, 7(10), 3293–3299. doi: 10.1523/JNEUROSCI.07-10-03293.1987 [DOI] [PMC free article] [PubMed] [Google Scholar]
- Tsai H-H, Li H, Fuentealba LC, Molofsky AV, Taveira-Marques R, Zhuang H, … Rowitch DH (2012). Regional Astrocyte Allocation Regulates CNS Synaptogenesis and Repair. Science, 337(6092), 358. doi: 10.1126/science.1222381 [DOI] [PMC free article] [PubMed] [Google Scholar]
- Wanner IB, Anderson MA, Song B, Levine J, Fernandez A, Gray-Thompson Z, … Sofroniew MV (2013). Glial scar borders are formed by newly proliferated, elongated astrocytes that interact to corral inflammatory and fibrotic cells via STAT3-dependent mechanisms after spinal cord injury. The Journal of neuroscience : the official journal of the Society for Neuroscience, 33(31), 12870–12886. doi: 10.1523/JNEUROSCI.2121-13.2013 [DOI] [PMC free article] [PubMed] [Google Scholar]
- Wolburg H, Neuhaus J, Kniesel U, Krauss B, Schmid EM, Ocalan M, … Risau W (1994). Modulation of tight junction structure in blood-brain barrier endothelial cells. Effects of tissue culture, second messengers and cocultured astrocytes. Journal of Cell Science, 107(5), 1347–1357. [DOI] [PubMed] [Google Scholar]
- Wosik K, Cayrol R, Dodelet-Devillers A, Berthelet F, Bernard M, Moumdjian R, … Prat A (2007). Angiotensin II Controls Occludin Function and Is Required for Blood–Brain Barrier Maintenance: Relevance to Multiple Sclerosis. The Journal of Neuroscience, 27(34), 9032–9042. doi: 10.1523/jneurosci.2088-07.2007 [DOI] [PMC free article] [PubMed] [Google Scholar]
- Xia Y. p., He Q. w., Li Y. n., Chen S. c., Huang M, Wang Y, … Hu B (2013). Recombinant human sonic hedgehog protein regulates the expression of ZO-1 and occludin by activating angiopoietin-1 in stroke damage. PloS one, 8(7), e68891–e68891. doi: 10.1371/journal.pone.0068891 [DOI] [PMC free article] [PubMed] [Google Scholar]
- Yanagida K, Liu CH, Faraco G, Galvani S, Smith HK, Burg N, … Hla T (2017). Size-selective opening of the blood-brain barrier by targeting endothelial sphingosine 1-phosphate receptor 1. Proceedings of the National Academy of Sciences of the United States of America, 114(17), 4531–4536. doi: 10.1073/pnas.1618659114 [DOI] [PMC free article] [PubMed] [Google Scholar]
- Yang Y, Estrada EY, Thompson JF, Liu W, & Rosenberg GA (2007). Matrix Metalloproteinase-Mediated Disruption of Tight Junction Proteins in Cerebral Vessels is Reversed by Synthetic Matrix Metalloproteinase Inhibitor in Focal Ischemia in Rat. Journal of Cerebral Blood Flow & Metabolism, 27(4), 697–709. doi: 10.1038/sj.jcbfm.9600375 [DOI] [PubMed] [Google Scholar]
- Zhang Y, Chen K, Sloan SA, Bennett ML, Scholze AR, O’Keeffe S, … Wu JQ (2014). An RNA-sequencing transcriptome and splicing database of glia, neurons, and vascular cells of the cerebral cortex. The Journal of neuroscience : the official journal of the Society for Neuroscience, 34(36), 11929–11947. doi: 10.1523/JNEUROSCI.1860-14.2014 [DOI] [PMC free article] [PubMed] [Google Scholar]
- Zhang ZG, Zhang L, Croll SD, & Chopp M (2002). Angiopoietin-1 reduces cerebral blood vessel leakage and ischemic lesion volume after focal cerebral embolic ischemia in mice. Neuroscience, 113(3), 683–687. doi: 10.1016/S0306-4522(02)00175-6 [DOI] [PubMed] [Google Scholar]
- Zhang ZG, Zhang L, Jiang Q, Zhang R, Davies K, Powers C, … Chopp M (2000). VEGF enhances angiogenesis and promotes blood-brain barrier leakage in the ischemic brain. The Journal of clinical investigation, 106(7), 829–838. doi: 10.1172/JCI9369 [DOI] [PMC free article] [PubMed] [Google Scholar]
- Zheng Y, Vertuani S, Nyström S, Audebert S, Meijer I, Tegnebratt T, … Holmgren L (2009). Angiomotin-Like Protein 1 Controls Endothelial Polarity and Junction Stability During Sprouting Angiogenesis. Circulation Research, 105(3), 260–270. doi:doi: 10.1161/CIRCRESAHA.109.195156 [DOI] [PubMed] [Google Scholar]
Associated Data
This section collects any data citations, data availability statements, or supplementary materials included in this article.
Supplementary Materials
Supplemental Figure 1. Semi-automatic quantification of Glt1 loss regions using ImageJ. a. Large images of sagittal slices were acquired for both experimental and control mice at all timepoints using line scanning at 20x magnification. b. Images were binarized based using intensity parameters that selected for Glt-1 negative regions. c. Binary images were run through the “fill holes” algorithm to fill in Glt-1 negative regions and create discrete shapes. d. The Glt1 negative regions that are blood vessels and neurons were excluded using consistent size and circularity quantification parameters. The remaining Glt1 negative regions were quantified as regions of astrocyte ablation.
Supplemental Figure 2. a. Male and female mice (DTAfl/wt//Glast-CreERTtg/wt) administered tamoxifen or an oil vehicle only or nothing at all (naïve) did not show astrocyte ablation indicated by no lack of the continuous labeling of astrocyte fine processes with the astrocyte marker membrane-associated astrocyte glutamate transporter Glt1. b-c. In addition to cortical loss of Glt1, Experimental mice showed Glt1 loss in hippocampus and striatum after tamoxifen administration. d. Bergmann glia in the cerebellum that highly express GLAST at high levels in the adult and this in cerebellum showed noticeable depletion in density after tamoxifen administration (arrowheads).
Supplemental Figure 3. Astrocyte ablation in cortex indicated by lack of expression of astrocyte markers. a. Lack of astrocyte marker S100β overlaps with lack of Glt1 in experimental mice. b. In control mice, the few Glt1-negative areas detected still labeled for S100β (arrowheads). c. Lack of astrocyte marker Aquaporin-4 (AQ4) overlaps with lack of Glt1 in experimental mice at early, middle, and late timepoints. d. For each image, mean grayscale value for AQP4 was measured in regions lacking Glt1 and compared to mean grayscale value for AQP4 in adjacent Glt-positive regions for early (6 hpa), middle (11 dpa) and late (28 dpa) timepoints. (6 hpa outside ablation region: 621.048 ± 47.375, n=13; 11 dpa outside ablation region: 797.588 ± 52.533, n= 11; 28 outside ablation region: 866.386 ± 85.946, n= 13; 6 hpa inside ablation region: 159.998 ± 23.087, n= 13; 11 dpa inside ablation region: 232.135 ± 16.893, n= 11; 28 inside ablation region: 333.264 ± 27.403, n= 13). Tukey’s multiple comparisons test. (6 hpa outside ablation region vs. 6 hpa inside ablation region, p< 0.0001; 11 dpa outside ablation region vs. 11 dpa inside ablation region, p< 0.0001; 28 dpa outside ablation region vs. 28 dpa inside ablation region, p< 0.0001).
Supplemental Figure 4. Cadaverine leakage occurred after astrocyte ablation across cortex. a. Large area scans of cortex showed minimal Cadaverine leakage in control mice, while diffuse areas of leakage were found in experimental mice.
Supplemental Figure 5. Astrocyte ablation does not induce any obvious neuronal changes a. Nissl staining showed no observable changes in neuronal numbers in regions of astrocyte ablation at early and middle timepoints, though clusters of small Nissl+ cells appeared in ablation regions at the late 28 dpa timepoint.
Supplemental Figure 6. Astrocyte ablation induces changes in microglia morphology. a. Microglia showed morphology changes and increased Iba1 levels in regions of ablated astrocytes.
Supplemental Figure 7. Astrocyte ablation does not induce proliferation of neighboring astrocytes. a. Ki67+cells were present in all mice at the subependymal zone, which contains proliferating cells in adult mice. b. Astrocytes adjacent to loss regions did not express the mitotic marker Ki67 but Ki67+ cells of other cell identity (arrowheads) were present in both control and experimental groups.
Supplemental Figure 8. Astrocyte ablation does not induce proliferation of neighboring astrocytes. a. Astrocytes adjacent to loss regions did not express the mitotic marker BrdU but BrdU+ cells of other cell identity (arrowheads) were present in both control and experimental groups.