Abstract
Approximately one-third of global CO2 fixation occurs in a phase-separated algal organelle called the pyrenoid. Existing data suggest that the pyrenoid forms by the phase separation of the CO2-fixing enzyme Rubisco with a linker protein; however, the molecular interactions underlying this phase separation remain unknown. Here we present the structural basis of the interactions between Rubisco and its intrinsically disordered linker protein EPYC1 (Essential Pyrenoid Component 1) in the model alga Chlamydomonas reinhardtii. We find that EPYC1 consists of five evenly-spaced Rubisco-binding regions that share sequence similarity. Single-particle cryo-electron microscopy of these regions in complex with Rubisco indicates that each Rubisco holoenzyme has eight binding sites for EPYC1, one on each Rubisco small subunit. Interface mutations disrupt binding, phase separation, and pyrenoid formation. Cryo-electron tomography supports a model where EPYC1 and Rubisco form a co-dependent multivalent network of specific low-affinity bonds, giving the matrix liquid-like properties. Our results advance the structural and functional understanding of the phase separation underlying the pyrenoid, an organelle that plays a fundamental role in the global carbon cycle.
The CO2-fixing enzyme Rubisco drives the global carbon cycle, mediating the assimilation of approximately 100 gigatons of carbon per year1. The gradual decrease of atmospheric CO2 over billions of years2 has made Rubisco’s job increasingly difficult, to the point where CO2 assimilation limits the growth rate of many photosynthetic organisms3. This selective pressure is thought to have led to the evolution of CO2 concentrating mechanisms, which feed concentrated CO2 to Rubisco to enhance growth4. Of these mechanisms, the most poorly understood relies on the pyrenoid, a phase separated organelle5 found in the chloroplast of nearly all eukaryotic algae and some land plants (Fig. 1a, b)6,7. The pyrenoid enhances the activity of Rubisco by clustering it around modified thylakoid membranes that supply Rubisco with concentrated CO28,9.
Fig. 1 |. EPYC1 consists of five tandem sequence repeats, each of which contains a Rubisco-binding region.
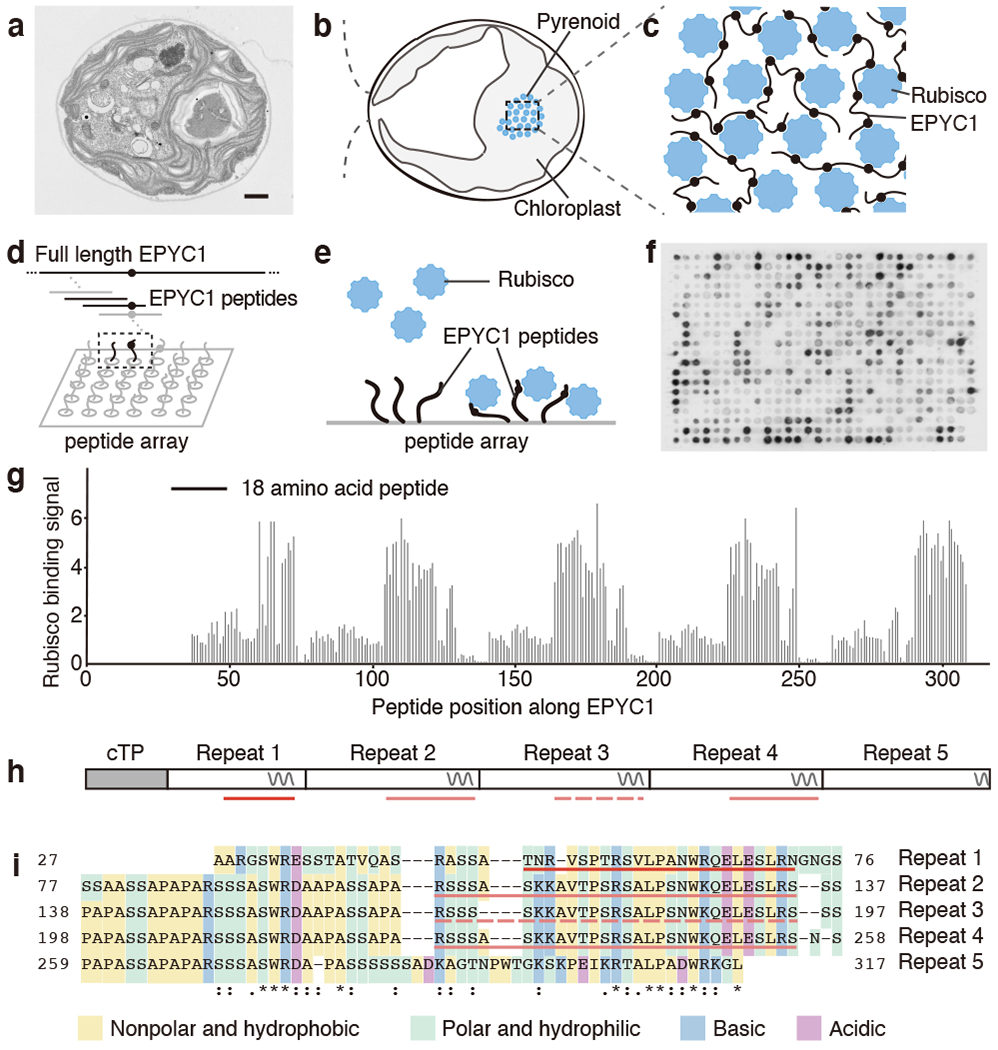
a, A representative (N=15) transmission electron microscopy (TEM) image of a Chlamydomonas cell. Scale bar = 1 μm. b, Cartoon depicting the chloroplast and pyrenoid in the image shown in panel a. The blue dots indicate the location of Rubisco enzymes clustered in the pyrenoid matrix. c, We hypothesized that pyrenoid matrix formation is mediated by multivalent interactions between Rubisco and the intrinsically disordered protein EPYC1. d, We designed an array of 18 amino acid peptides tiling across the full length EPYC1 sequence. e, Incubation of the array with purified Rubisco allows identification of peptides that bind to Rubisco. f, Image of the Rubisco binding signal from the peptide tiling array. g, The Rubisco binding signal was quantified and plotted for each peptide as a function of the position of the middle of the peptide along the EPYC1 sequence. The initial 26 amino acids of EPYC1 correspond to a chloroplast targeting peptide (cTP), which is not present in the mature protein12. Results are representative of three independent experiments. h, The positions of EPYC1’s five sequence repeats are shown to scale with panel g. Predicted α-helical regions are shown as wavy lines. i, Primary sequence of EPYC1, with the five sequence repeats aligned. In panels h and i, the regions represented by peptides subsequently used for structural studies are underlined with red lines (EPYC149-72) and pink lines (EPYC1106-135). EPYC1106-135 is an exact match to the underlined sequence of Repeats 2 and 4, and has a one-amino acid difference from the corresponding region in Repeat 3 (dashed underline).
For decades, the mechanism for packaging the Rubisco holoenzyme into the pyrenoid remained unknown. Recent work showed that in the leading model alga Chlamydomonas reinhardtii (Chlamydomonas hereafter), the clustering of Rubisco into the pyrenoid matrix requires the Rubisco-binding protein EPYC110. EPYC1 and Rubisco are the most abundant components of the pyrenoid and bind to each other. Moreover, combining purified EPYC1 and Rubisco together produces phase-separated condensates11 that mix internally at a rate similar to that observed for the matrix in vivo5, suggesting that these two proteins are sufficient to form the structure of the pyrenoid matrix. The sequence repeats within EPYC1 and eight-fold symmetry of the Rubisco holoenzyme led us to hypothesize that EPYC1 and Rubisco each have multiple binding sites for the other, allowing the two proteins to form a co-dependent condensate (Fig. 1c)10.
Here, we determined the structural basis that underlies the EPYC1-Rubisco condensate. Using biophysical approaches, we found that EPYC1 has five evenly spaced Rubisco-binding regions that share sequence homology and can bind to Rubisco as short peptides. We obtained cryo-electron microscopy structures showing that each of EPYC1’s Rubisco-binding regions forms an α-helix that binds one of Rubisco’s eight small subunits via salt bridges and hydrophobic interactions. Mapping of these binding sites onto Rubisco holoenzymes within the native pyrenoid matrix indicates that the linker sequences between Rubisco-binding regions on EPYC1 are sufficiently long to connect together adjacent Rubisco holoenzymes. These discoveries advance the understanding of the pyrenoid and provide a high-resolution structural view of a phase-separated organelle.
Results
We could not directly determine the structure of full-length EPYC1 bound to Rubisco because mixing the two proteins together produces phase-separated condensates11. We thus aimed to first identify Rubisco-binding regions on EPYC1, and subsequently to use a structural approach to determine how these regions bind to Rubisco.
EPYC1 has five nearly identical Rubisco-binding regions
The intrinsically disordered nature of purified EPYC111 led us to hypothesize that the Rubisco-binding regions of EPYC1 were short and could bind to Rubisco as peptides without a need for tertiary folds. Therefore, to identify EPYC1 regions that bind to Rubisco, we synthesized a peptide array consisting of 18 amino acid peptides tiling across the full length EPYC1 sequence (Fig. 1d), and probed this array with native Rubisco purified from Chlamydomonas cells (Fig. 1e, f).
Our tiling array revealed five evenly-spaced Rubisco-binding regions on EPYC1, each consisting of a predicted α-helix and an upstream region (Fig. 1g, h and Supplementary Table 3). We confirmed the binding regions using surface plasmon resonance (SPR; Extended Data Fig. 1b, c). Sequence alignment guided by the five binding regions revealed that mature EPYC1 consists entirely of five sequence repeats (Fig. 1i), in contrast to the previously defined four repeats and two termini10 (Extended Data Fig. 1a). Our alignment indicates that the previously defined EPYC1 N- and C- termini, which at the time were not considered part of the repeats, actually share sequence homology with the central repeats.
The presence of a Rubisco-binding region on each of the previously defined EPYC1 repeats (Extended Data Fig. 1a) explains our yeast two-hybrid observations12 that a single EPYC1 repeat can interact with Rubisco, that knocking out the α-helix in an EPYC1 repeat disrupts this interaction, and that decreasing the number of EPYC1 repeats leads to a proportional decrease in EPYC1 interaction with Rubisco. It also explains our observations that decreasing the number of EPYC1 repeats leads to a proportional decrease in the tendency of EPYC1 and Rubisco to phase separate together11.
EPYC1 binds to Rubisco small subunits
The sequence homology of the five Rubisco-binding regions suggests that each region binds to Rubisco in a similar manner. To identify the binding site of EPYC1 on Rubisco, we determined three structures by using single-particle cryo-electron microscopy. The first structure consists of Rubisco in complex with peptide EPYC149–72, representing the first Rubisco-binding region of EPYC1 (2.13 Å overall resolution; ~2.5 Å EPYC1 peptide local resolution; Fig. 2, Extended Data Fig. 2–5; Supplementary Table 1). The second structure consists of Rubisco in complex with a second peptide, EPYC1106-135, representing the second, third and fourth Rubisco-binding regions of EPYC1 (2.06 Å overall resolution, ~2.5 Å EPYC1 peptide local resolution, Extended Data Fig. 6). The affinities of these peptides to Rubisco were low by protein interaction standards (KD ~3 mM; Extended Data Fig. 1d, e); thus, millimolar concentrations of peptide were required to approach full occupancy of peptide bound to Rubisco. For reference purposes, we also obtained a third structure of Rubisco in the absence of EPYC1 peptide (2.68 Å; Extended Data Fig. 2 and 3), which was nearly identical to the previously published X-ray crystallography structure13, with minor differences likely due to the absence of the substrate analog 2-CABP in the active site of Rubisco in our sample14 (Extended Data Fig. 4).
Fig. 2 |. EPYC1 binds to Rubisco small subunits.
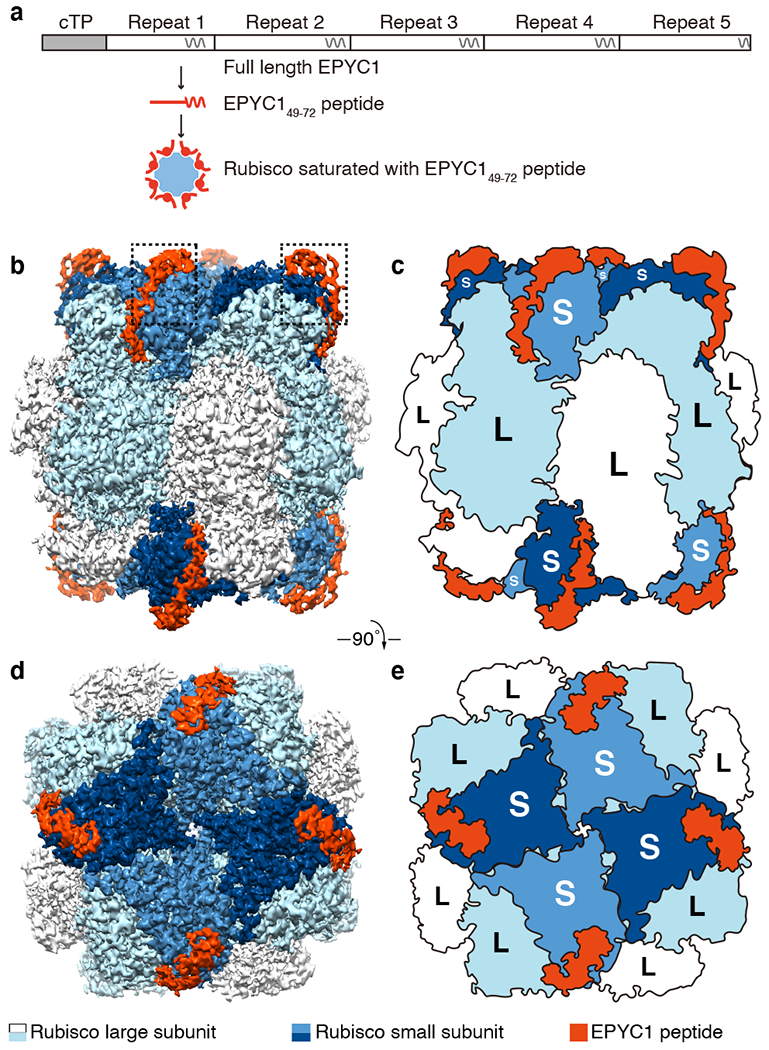
a, Peptide EPYC149-72, corresponding to the first Rubisco-binding region of EPYC1, was incubated at saturating concentrations with Rubisco prior to single-particle cryo-electron microscopy. b-e, Density maps (b, d) and cartoons (c, e) illustrate the side views (b, c) and top views (d, e) of the density map of the EPYC1 peptide-Rubisco complex. Dashed boxes in panel b indicate regions shown in Fig. 3a–f.
The structures of Rubisco in complex with EPYC149-72 and of Rubisco in complex with EPYC1106-135 were remarkably similar, indicating that these two peptides and the corresponding four regions of EPYC1 each bind to the same site on the Rubisco holoenzyme. The Rubisco holoenzyme consists of a core of eight catalytic large subunits in complex with eight small subunits, four of which cap each end of the holoenzyme (Fig. 2b–e). In each structure, an EPYC1 peptide was clearly visible bound to each Rubisco small subunit, suggesting that each Rubisco holoenzyme can bind up to eight EPYC1s (Fig. 2b–e and Extended Data Fig. 6b, c).
Salt bridges and a hydrophobic interface mediate binding
Both the EPYC149-72 and EPYC1106-135 peptides formed an extended chain that sits on top of the Rubisco small subunit’s two α-helices (Fig. 3a, b, Extended Data Fig. 6d, e). This binding site explains our previous observations that mutations in the Rubisco small subunit α-helices disrupted yeast two-hybrid interactions between EPYC1 and the Rubisco small subunit12 and prevented Rubisco’s assembly into a pyrenoid in vivo15. The C-terminal regions of the EPYC149-72 and EPYC1106-135 peptides (NW[R/K]QELESLR[N/S]) are well-resolved; each forms an α-helix that runs parallel to helix B of the Rubisco small subunit (Fig. 3a, b). The peptides’ N-termini extend the trajectory of the helix and follow the surface of the Rubisco small subunit (Fig. 2b–e, 3a–b and Extended Data Fig. 5, Extended Data Fig. 6b, c). The side chains of the peptides’ N-termini could not be well resolved, suggesting that these regions are more conformationally flexible.
Fig. 3 |. EPYC1 binds to Rubisco small subunit α-helices via salt bridges and a hydrophobic pocket.
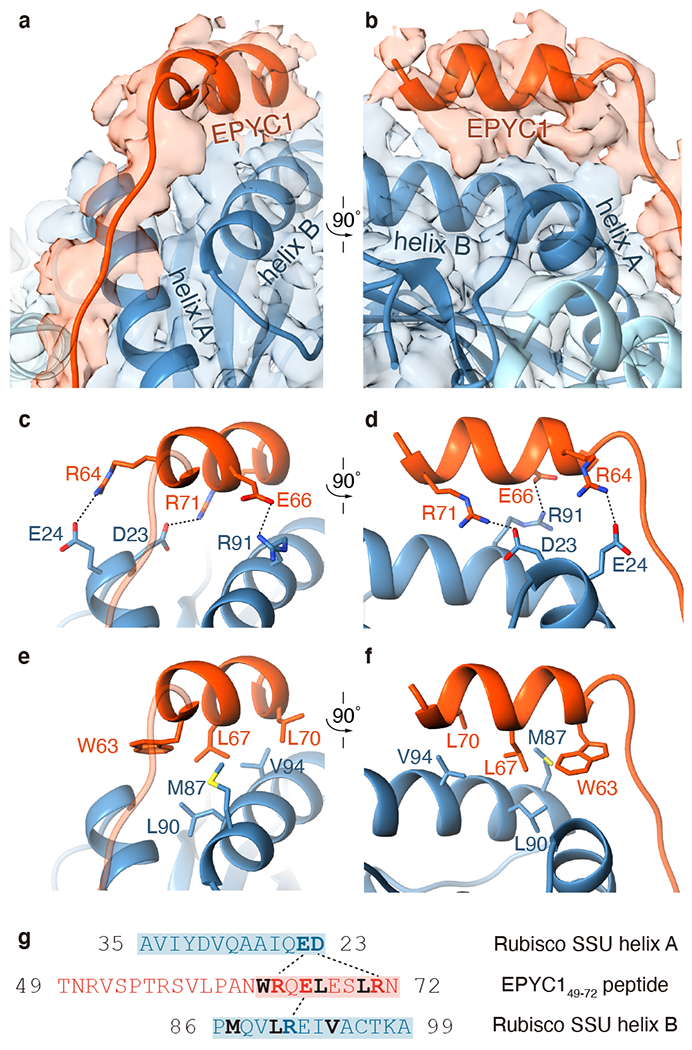
a-b, Front (a) and side (b) views of the EPYC149-72 peptide (red) bound to the two α-helices of the Rubisco small subunit (blue). c-d, Three pairs of residues form salt bridges between the helix of the EPYC149-72 peptide and the helices on the Rubisco small subunit. Shown are front (c) and side (d) views as in panel a and panel b. The distances from EPYC1 R64, R71 and E66 to Rubisco small subunit E24, D23 and R91 are 3.06 Å, 2.78 Å, and 2.79 Å, respectively. e-f, A hydrophobic pocket is formed by three residues of the EPYC149–72 peptide and three residues of helix B of the Rubisco small subunit. Shown are front (e) and side (f) views as in panel a and panel b. g, Summary of the interactions observed between the EPYC149-72 peptide and the two α-helices of the Rubisco small subunit. Helices are highlighted; the residues mediating interactions are bold; salt bridges are shown as dotted lines; residues contributing to the hydrophobic pocket are shown in black.
Our atomic models based on the density maps suggest that binding is mediated by salt bridges and a hydrophobic interface. Three residue pairs of EPYC149-72 likely form salt bridges (Fig. 3c, d and g): EPYC1 residues R64 and R71 interact with E24 and D23, respectively, of Rubisco small subunit α-helix A, and EPYC1 residue E66 interacts with R91 of Rubisco small subunit α-helix B. Furthermore, a hydrophobic interface is formed by W63, L67 and L70 of EPYC1 and M87, L90 and V94 of Rubisco small subunit helix B (Fig. 3e–g). Similar interactions were observed for the corresponding residues in EPYC1106-135 (Extended Data Fig. 6f–j).
Binding and phase separation require interface residues
To determine the importance of individual EPYC1 residues for binding, we investigated the impact on Rubisco binding of every possible single amino acid substitution for EPYC1’s first Rubisco-binding region by using a peptide array (Fig. 4a and Supplementary Table 4) and SPR (Extended Data Fig. 7). Consistent with our structural model, the peptide array indicated that EPYC1 salt bridge-forming residues R64, R71 and E66 and the hydrophobic interface residues W63, L67 and L70 were all required for normal EPYC1 binding to Rubisco. The strong agreement of our mutational analysis suggests that our structural model correctly represents EPYC1’s Rubisco-binding interface.
Fig. 4 |. Interface residues on EPYC1 are required for binding and phase separation of EPYC1 and Rubisco in vitro.
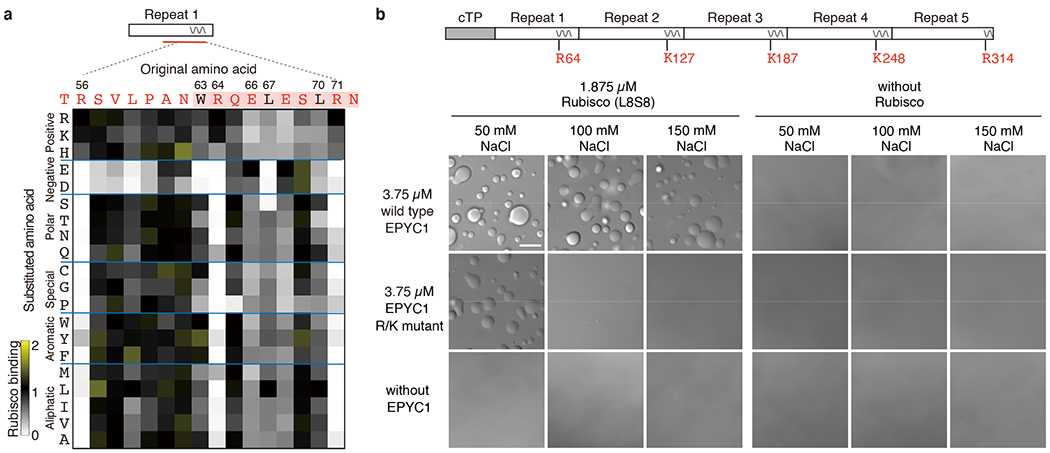
a, Rubisco binding to a peptide array representing every possible single amino acid substitution for amino acids 56-71 of EPYC1. The binding signal was normalized by the binding signal of the original sequence. b, The effect of mutating the central R or K in each of EPYC1’s Rubisco-binding regions on in vitro phase separation of EPYC1 with Rubisco. Scale bar = 10 μm. For each condition, the experiment was performed twice independently with similar results.
To determine the importance of EPYC1’s Rubisco-binding regions for pyrenoid matrix formation, we assayed the impact of mutations in these regions on formation of phase separated droplets by EPYC1 and Rubisco in vitro. The phase boundary was shifted by mutating R64 in the first Rubisco-binding region and the corresponding K or R in the other four Rubisco-binding regions of EPYC1 (Fig. 4b and Extended Data Fig. 8), suggesting that the Rubisco-binding regions mediate condensate formation.
Pyrenoid matrix formation requires interface residues
We validated the importance of Rubisco residues for binding to EPYC1 by yeast two-hybrid assays (Fig. 5a and Extended Data Fig. 9). A Rubisco small subunit D23A mutation, which eliminates the charge of the aspartate residue, had a severe impact on Rubisco small subunit interaction with EPYC1, as expected from the contribution of that residue to a salt bridge with R71 and homologous residues of EPYC1’s Rubisco-binding regions. Likewise, E24A and R91A each showed a moderate defect, consistent with the contributions of those residues to salt bridges with R64 and E66 (and homologous residues) of EPYC1, respectively. Additionally, M87D and V94D, mutations which convert hydrophobic residues to bulky charged residues, each had a severe impact on interaction, as expected from the participation of those residues in the hydrophobic interface. Combinations of these mutations abolished the interactions completely (Extended Data Fig. 9).
Fig. 5 |. Interface residues on Rubisco are required for yeast two-hybrid interactions between EPYC1 and Rubisco, and for pyrenoid matrix formation in vivo.

a, The importance of Rubisco small subunit residues for interaction with EPYC1 was tested by mutagenesis in a yeast two-hybrid experiment. b, The Rubisco small subunit-less mutant T60 (Δrbcs) was transformed with wild-type, D23A/E24A or M87D/V94D Rubisco small subunits. Serial 1:10 dilutions of cell cultures were spotted on TP minimal medium and grown in air or 3% CO2. c-d, Representative electron micrographs of whole cells (c) and corresponding pyrenoids (d) of the strains expressing wild-type, D23A/E24A, and M87D/V94D Rubisco small subunit. Dashes in panel c indicate regions shown in panel d. Scale bars = 500 nm. At least 25 cells were imaged for each strain; additional representative images are shown in Extended Data Fig. 10c.
To evaluate the importance of the binding interface in vivo, we generated Chlamydomonas strains with point mutations in the binding interface. Rubisco small subunit mutations D23A/E24A or M87D/V94D caused a growth defect under conditions requiring a functional pyrenoid (Fig. 5b, Extended Data Fig. 10a–b). Furthermore, the mutants lacked a visible pyrenoid matrix (Fig. 5c, d and Extended Data Fig. 10c), indicating that those Rubisco small subunit residues are required for matrix formation in vivo. The Rubisco mutants retained pyrenoid tubules16, as previously observed in other matrix-deficient mutants10,17–19.
Together, our data demonstrate that EPYC1’s Rubisco-binding regions bind to the Rubisco small subunit α-helices via salt-bridge interactions and a hydrophobic interface, enabling the condensation of Rubisco into the phase separated matrix.
A structural model for pyrenoid matrix formation
The presence of multiple Rubisco-binding regions along the EPYC1 sequence supports a model where consecutive Rubisco-binding regions on the same EPYC1 polypeptide can bind to different Rubisco holoenzymes and thus hold them together to form the pyrenoid matrix. If this model is correct, we would expect that the ~40 amino acid “linker” regions between consecutive Rubisco-binding regions on EPYC1 (Fig. 1g, i) would be sufficient to span the distance between EPYC1-binding sites on neighboring Rubisco holoenzymes in the pyrenoid matrix. To test this aspect of the model, we combined our atomic structure of the EPYC1-Rubisco interaction with the precise positions and orientations of Rubisco holoenzymes within the pyrenoid matrix of native cells that we had previously obtained by in-situ cryo-electron tomography5 (Fig. 6a, b). We mapped the positions of EPYC1 binding sites onto Rubisco holoenzymes in the matrix and measured the distances between nearest neighbor EPYC1 binding sites on adjacent holoenzymes (Fig. 6c, binding sites on the same holoenzyme were excluded in this analysis). The observed distances ranged from ~2 nm to ~7 nm, with a median distance of ~4 nm (Fig. 6d and Supplementary Table 5).
Fig. 6 |. A model for matrix structure consistent with in situ Rubisco positions and orientations.
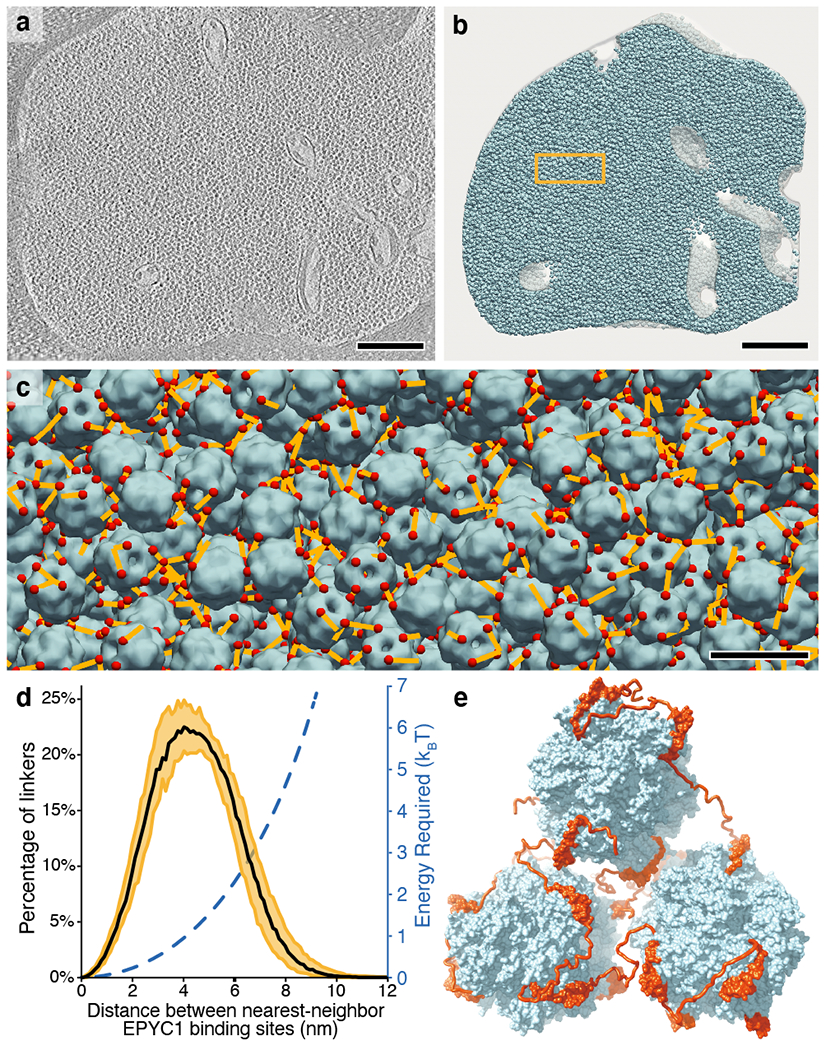
a, The pyrenoid matrix was imaged by cryo-electron tomography5. An individual slice through the three-dimensional volume is shown. Scale bar = 200 nm. b, The positions and orientations of individual Rubisco holoenzymes (blue) were determined with high sensitivity and specificity (97.5% positive identification) by template matching, subtomogram averaging, and classification and then mapped back into the tomogram volume shown in panel a. The yellow box indicates the region shown in panel c. Scale bar = 200 nm. c, The distances (yellow) between the nearest EPYC1-binding sites (red) on neighboring Rubisco holoenzymes (blue) were measured. The view is from inside the matrix; in some cases the nearest EPYC1 binding site is on a Rubisco that is out of the field of view, causing some yellow lines to appear unconnected in this image. Scale bar = 20 nm. The data shown in panels a-c are representative of the five independent tomograms used for this study. d, Histogram showing the distances between the nearest EPYC1 binding sites on neighboring Rubisco holoenzymes. The black line indicates the median, and the yellow shading indicates 95% confidence interval based on data from five independent tomograms. The estimated energy required for stretching a chain of 40 amino acids a given distance is shown in blue. e, A 3D model illustrates how EPYC1 (red) could crosslink multiple Rubisco holoenzymes (blue) to form the pyrenoid matrix. The conformations of the intrinsically disordered linkers between EPYC1 binding sites were modeled hypothetically.
A “linker” region of 40 amino acids is unlikely to be stretched to its maximum possible length of 14 nm in vivo due to the high entropic cost of this configuration. To determine whether a linker region can span the observed distances between nearest neighbor binding sites on adjacent Rubisco holoenzymes, we used a simple physics model to calculate the energy required to stretch a 40 amino acid chain to any given distance (Fig. 6d; see Methods). The model indicates that stretching the chain to ~7 nm requires an energy of 3 kBT (where kB is the Boltzmann constant and T is the temperature), which could reasonably be derived from thermal fluctuations. Thus, our data suggest that the linker region between consecutive Rubisco-binding sites on the EPYC1 polypeptide can span the distance between adjacent Rubisco holoenzymes to hold the pyrenoid matrix together in vivo. It also appears likely that, in addition to bridging neighboring Rubisco holoenzymes, consecutive Rubisco-binding regions on a given EPYC1 can bind multiple sites on one Rubisco holoenzyme, as the distance between the nearest binding sites on the same holoenzyme is < 9 nm.
Discussion
In this study, we have determined the structural basis for pyrenoid matrix formation for the first time in any species. We found that in the model alga Chlamydomonas, the intrinsically disordered protein EPYC1 has five regions of similar sequence that can bind to Rubisco as short peptides. These EPYC1 regions form an α-helix that binds to the Rubisco small subunit α-helices via salt bridges and hydrophobic interactions. EPYC1’s Rubisco-binding regions are spaced by linker sequences that are sufficiently long to span the distance between binding sites on adjacent Rubisco holoenzymes within the pyrenoid, allowing EPYC1 to serve as a molecular glue that clusters Rubisco together to form the pyrenoid matrix (Fig. 6e).
The multivalency of EPYC1 and the high KD (~3 mM; Extended Data Fig. 1e) of individual Rubisco-binding regions are consistent with the emerging principle that cellular phase separation is mediated by weak multivalent interactions20. The high dissociation rate constant (>1/s; Extended Data Fig. 1d) of individual Rubisco-binding regions explains how the pyrenoid matrix can mix internally on the time scale of seconds5 despite the multivalency of EPYC1. The even spacing of the five Rubisco-binding regions across EPYC1 is noteworthy and may be an indication of selective pressure for an optimal distance between binding regions, and thus of an optimal spacing between Rubisco holoenzymes in the matrix.
Knowledge of the EPYC1-Rubisco binding mechanism now opens doors to the molecular characterization of the regulation of this interaction, which may govern the dissolution and condensation of the matrix during cell division5 and in response to environmental factors21. For example, phosphorylation of EPYC122 may provide a mechanism to rapidly change the binding affinity of EPYC1 to Rubisco. Inactivation of one Rubisco-binding region on EPYC1 would yield four binding regions, which would allow two such EPYC1 molecules (each containing four Rubisco-binding regions, for a total of eight Rubisco-binding regions) to form a mutually satisfied complex with each Rubisco holoenzyme (containing eight EPYC1-binding sites), a configuration that is predicted to favor dissolution of the matrix5.
Our structures explain how other proteins bind to Rubisco
In a parallel study (Meyer et al., please see unpublished manuscript provided as reference material), we recently discovered that a common sequence motif is present on many pyrenoid-localized proteins. The motif binds Rubisco, enabling recruitment of motif-containing proteins to the pyrenoid and mediating adhesion between the matrix, pyrenoid tubules, and starch sheath. This motif, [D/N]W[R/K]XX[L/I/V/A], is present in EPYC1’s Rubisco-binding regions as defined in the present study, and the motif residues mediate key binding interactions with Rubisco. In our structures, the R/K of the motif is represented by R64 and K127 of EPYC1, each of which forms a salt bridge with E24 of the Rubisco small subunit. The XX of the motif almost always includes a D or E; in our structures this feature is represented by E66 and E129 of EPYC1, each of which forms a salt bridge with R91 of the Rubisco small subunit. Finally, the W and [L/I/V/A] of the motif are represented by W63/W126 and L67/L130 of EPYC1, which contribute to the hydrophobic interactions with M87, L90 and V94 of the Rubisco small subunit. The key roles of the motif residues in the interface presented here strongly suggest that the structures we have obtained for motifs from EPYC1 also explain where and how all other variants of the motif, including those found on the key pyrenoid proteins SAGA1, SAGA2, RBMP1, RBMP2 and CSP41A, bind to Rubisco. Our observation that the Rubisco small subunit D23A/E24A and M87D/V94D mutants exhibit a more severe disruption of the pyrenoid than the epyc1 mutant10 supports the idea that this region of Rubisco interacts not only with EPYC1, but also with other proteins required for pyrenoid biogenesis, making this binding interaction a central hub of pyrenoid biogenesis.
Structural differences between the pyrenoid and carboxysomes
Although α- and β-carboxysomes are morphologically, functionally and evolutionarily distinct from the pyrenoid, their Rubisco is also thought to be clustered by linker proteins. Like EPYC1, the α-carboxysome linker protein CsoS223 is intrinsically disordered and is proposed to bind Rubisco as an unfolded peptide24. In contrast, the β-carboxysome linker protein CcmM has been proposed to bind Rubisco using folded globular domains25,26. The use of an unfolded peptide as in the case of EPYC1 and CsoS2 may provide the benefit of requiring fewer amino acids for achieving the desired binding function. A notable difference is the location of the binding site on Rubisco: whereas both carboxysomal linker proteins bind to the interface between two Rubisco large subunits24,26, EPYC1 binds to the Rubisco small subunit. It remains to be seen whether this difference in binding site has functional consequences, such as impacts on the three-dimensional packing of Rubisco.
Our findings advance the ability to engineer a pyrenoid
There is currently significant interest in engineering Rubisco condensates into monocotyledonous crops such as wheat and rice to enhance yields27–30. Binding of EPYC1 to the Rubisco small subunit presents a promising route for engineering a Rubisco condensate, as the Rubisco small subunit is encoded in the nuclear genome, making it more easily amenable to genetic modification in those crops than the chloroplast-encoded Rubisco large subunit31. Knowledge of the binding mechanism now allows engineering of minimal sequence changes into native crop Rubiscos to enable binding to EPYC1 and to other key proteins required to reconstitute a functional pyrenoid.
Insights into pyrenoid matrix formation in other species
Pyrenoids appear to have evolved independently in different lineages through convergent evolution7,32. EPYC1, its Rubisco-binding sequences, and the amino acid residues that form the EPYC1 binding site on the surface of Rubisco are conserved across the order Volvocales, as evidenced from the genome sequences of Tetrabaena socialis, Gonium pectorale and Volvox carteri (Supplementary Table 2). While the molecular mechanisms of matrix formation in other lineages remain to be uncovered, candidate linker proteins have been identified based on similarity of sequence properties to EPYC110. We hypothesize that the matrix in other lineages is formed based on similar principles to those we observed in Chlamydomonas. Our experimental approach for characterizing the binding interaction provides a roadmap for future structural studies of pyrenoids across the tree of life.
We provide a structural view of a phase-separated organelle
The pyrenoid matrix presents an unusual opportunity to study a two-component molecular condensate where one of the components, Rubisco, is large and rigid, and the other component, EPYC1, is a simple intrinsically disordered protein consisting of nearly identical tandem repeats. The rigidity and size of Rubisco holoenzymes previously enabled the determination of their positions and orientations within the pyrenoid matrix of native cells by cryo-electron tomography5. The identification of EPYC1 binding sites on Rubisco in the present work and the modeling of linker regions between EPYC1’s Rubisco binding regions now make the Chlamydomonas pyrenoid matrix one of the most structurally well-defined phase-separated organelles. Thus, beyond advancing our structural understanding of pyrenoids, organelles that play a central role in the global carbon cycle, we hope that the findings presented here will also more broadly enable advances in the biophysical understanding of phase-separated organelles.
Methods
Strains and culture conditions
Chlamydomonas wild-type (WT) strain cMJ030 was maintained in the dark or low light (~10 μmol photons m−2 s−1) on 1.5% agar plates containing Tris-Acetate-Phosphate medium with revised trace elements33. For Rubisco extraction, 500 mL Tris-Acetate-Phosphate medium in a 1 L flask was inoculated with a loopful of cells and the culture was grown to 4 × 10⁶ cells/mL at 22°C, shaking at 200 rpm under ~100 μmol photons m−2 s−1 white light in 3% CO2. Chlamydomonas mutant T60–334 (Δrbcs; containing a deletion of both RBCS genes) was used for generating Rubisco small subunit point mutants and a wild-type control in the same background. This strain was maintained on agar in the dark or low light (~10 μmol photons m−2s−1).
Protein extraction
Rubisco was purified from Chlamydomonas strain cMJ03035. Cells were disrupted by ultrasonication in lysis buffer (10 mM MgCl2, 50 mM Bicine, 10 mM NaHCO3, 1 mM dithiothreitol, pH 8.0) supplemented with Halt Protease Inhibitor Cocktail, EDTA-Free (Thermo Fisher Scientific). The soluble lysate was fractionated by ultracentrifugation on a 10-30% sucrose gradient in a SW 41 Ti rotor at a speed of 35,000 rpm for 20 hours at 4°C. Rubisco-containing fractions were applied to an anion exchange column (MONO Q 5/50 GL, GE Healthcare) and eluted with a linear salt gradient from 30 to 500 mM NaCl in lysis buffer.
Peptide arrays
Peptide arrays were purchased from the MIT Biopolymers Laboratory (Cambridge, MA). The tiling array was composed of 18-amino-acid peptides that tiled across the full-length EPYC1 sequence with a step size of one amino acid. Each peptide was represented by at least two spots on the array, and these replicates were averaged during data analysis. The locations of peptides on the array were randomized. In the substitution arrays, peptides were designed to represent every possible one-amino-acid mutation of the indicated region on EPYC1 by substitution with one of the other 19 amino acids. The arrays were activated by methanol, then washed 3×10 min in binding buffer (50 mM HEPES, 50 mM KOAc, 2 mM Mg(OAc)2.4H2O, 1 mM CaCl2 and 200 mM sorbitol, pH 6.8). The arrays were then incubated at 4°C with 1 mg purified Rubisco overnight. The arrays were washed in binding buffer to remove any unbound Rubisco. Using a semi-dry transfer apparatus (BIO-RAD), bound Rubisco was transferred onto an Immobilon-P PVDF membrane (Millipore Sigma). The Rubisco was detected by one of two methods: western blotting, or fluorescent labeling. While replicates using the two methods gave similar results, toward the end of the project we found that fluorescent labeling had a lower background, so we show fluorescent labeling data in Figure 1; all other data were obtained by western blotting and chemiluminescence. For fluorescent labeling, Rubisco was labeled with Alexa Fluor™ 680 dye (Thermo Fisher Scientific) and detected by Typhoon Scanner (GE Healthcare). For western blotting, Rubisco was immuno-detected with a polyclonal primary antibody raised against Rubisco15 (1:10,000) followed by a HRP conjugated goat anti-rabbit (1:20,000; Invitrogen), and the chemiluminescence was detected by ImageQuant LAS 4000 (GE Healthcare). Images were analyzed with ImageQuant TL (GE Healthcare). Arrays were stripped with Restore™ Western Blot Stripping Buffer before re-use (Thermo Fisher Scientific).
For both types of arrays, values for identical sequences present multiple times were averaged. For tiling arrays, the average value for each sequence was plotted at its position in EPYC1 (or at multiple positions for sequences present multiple times). For amino acid substitution arrays, the ratio of each substitution sequence to the corresponding wildtype sequence was calculated and arrayed by amino acid and position.
Surface plasmon resonance (SPR) experiments
All the surface preparation experiments were performed at 25°C using a Biacore 3000 instrument (GE Healthcare). Purified Rubisco was immobilized on CM5 sensor chips using a Biacore Amine Coupling Kit according to the manufacturer’s instructions. Briefly, the chip surface was activated by an injection of 1:1 N-hydroxysuccinimide (NHS)/1-ethyl-3-(3-dimethylaminopropyl)carbodiimide hydrochloride (EDC). Rubisco was diluted to ~100 μg/mL in 10 mM acetate (pH 4.5; this pH had been previously optimized using the immobilization pH scouting wizard) and was injected over the chip surface. Excess free amine groups were then capped with an injection of 1 M ethanolamine. Typical immobilization levels were 8,000 to 10,000 resonance units (RU), as recommended for binding experiments of small molecules. For kinetic experiments (for determining the binding affinities), the typical immobilization levels were ~5,000 RU. The control surfaces were prepared in exactly the same manner as the experimental surfaces except that no Rubisco was injected. For immobilizations, the running buffer was the Biacore HBS-EP Buffer (0.01 M HEPES pH 7.4, 0.15 M NaCl, 3 mM EDTA, 0.005% v/v Surfactant P20).
All the binding assays were performed using the Biacore PBS-P+ Buffer (20 mM phosphate buffer, 2.7 mM KCl, 137 mM NaCl and 0.05% Surfactant P20, pH 6.8) as a running buffer, as recommended for small molecule analysis in Biacore systems. The analytes, consisting of EPYC1 peptides synthesized by Genscript (Piscataway, New Jersey), were dissolved in the same running buffer and diluted to 1 mM. The analytes were injected over the control surface and experimental surfaces at a flow rate of 26 μL/min for 2.5 minutes, followed by 2.5 minutes of the running buffer alone to allow for dissociation. The surfaces were then regenerated using running buffer at a flow rate of 30 μL/min for 10 minutes. In all cases, binding to the control surface was negligible.
For determining the KD of EPYC1 peptide, the kinetic assays were performed with a running buffer consisting of 200 mM sorbitol, 50 mM HEPES, 50 mM KOAc, 2 mM Mg(OAc)2•4H2O and 1 mM CaCl2 at pH 6.8 (the same buffer as the peptide array assay). The EPYC1 peptide was dissolved in the same running buffer as the assay and the serial dilutions were also made in the same buffer. The analytes were injected over the control surface and experimental surfaces at a flow rate of 15 μL/min for 2 minutes, followed by 10 minutes with the running buffer alone to allow for dissociation. The surfaces were then regenerated by the running buffer at a flow rate of 30 μL/min for 10 minutes. In all cases, binding to the blank chip was negligible. The fitting and modeling were performed with the BIAevaluation software.
Single-particle cryo-electron microscopy data collection and image processing
Rubisco and EPYC149-72 peptides with the final concentrations of 1.69 mg/ml (=3.02 μM) and 7.5 mM, respectively, were incubated together on ice for 20 minutes in buffer consisting of 200 mM sorbitol, 50 mM HEPES, 50 mM KOAc, 2 mM Mg(OAc)2•4H2O and 1 mM CaCl2 at pH 6.8 (the same buffer as the peptide array assay and the SPR binding assay). Rubisco and EPYC1106-135 peptides with the final concentrations of 1.75 mg/ml (=3.13 μM) and 10 mM, respectively, were incubated together on ice for 20 minutes in the same buffer described above. For apo Rubisco and Rubisco incubated with peptides, similar cryo grid-making procedures were used. 400-mesh Quantifoil 1.2/1.3 Cu grids (Quantifoil, Großlöbichau, Germany) were made hydrophilic by glow discharging for 60 seconds with a current of 15 mA in a PELCO easiGlow system. Cryo grids were produced using a FEI Mark IV Vitrobot (FEI company, part of Thermo Fisher Scientific, Hillsboro, OR). The chamber of the Vitrobot was kept at 4°C and 100% relative humidity. 3 μl of sample was applied to the glow-discharged grid and blotted with filter paper for 3 seconds with the equipment-specific blotting force set at 3. After blotting, the grid was rapidly plunge-frozen into a liquid ethane bath.
For apo Rubisco and Rubisco incubated with EPYC149-72 peptide, cryo grids were loaded into a 300 kV FEI Titan Krios cryo electron microscope (FEI Company) at HHMI Janelia Research Campus, Janelia Krios2, equipped with a Gatan K2 Summit camera. After initial screening and evaluation, fully automated data collection was carried out using SerialEM. The final exposure from each collection target was collected as a movie utilizing dose fractionation on the K2 Summit camera operated in super-resolution mode. The movies were collected at a calibrated magnification of 38,168x, corresponding to 1.31 Å per physical pixel in the image (0.655 Å per super-resolution pixel). The dose rate on the specimen was set to be 5.82 electrons per Å2 per second and total exposure time was 10 s, resulting in a total dose of 58.2 electrons per Å2. With dose fractionation set at 0.2 s per frame, each movie series contained 50 frames and each frame received a dose of 1.16 electrons per Å2. The spherical aberration constant of the objective lens is 2.7 mm and an objective aperture of 100 μm was used. The nominal defocus range for the automated data collection was set to be between −1.5 μm and −3.0 μm. For Rubisco incubated with EPYC1106-135 peptide, the final exposure was collected on Janelia Krios1 equipped with a CS-corrector, a Gatan Bioquantum energy filter and a post-filter K3 camera. The movies were collected at a nominal magnification of 81,000x, corresponding to 0.844 Å per physical pixel in the image (0.422 Å per super-resolution pixel). The dose rate on the specimen was set to be 12 electrons per pixel per second and total exposure time was 3.56 s, resulting in a total dose of 60 electrons per Å2. Each movie series contained 60 frames and each frame received a dose of 1 electron per Å2. The nominal defocus range for the automated data collection was set to be between −1 μm and −1.6 μm.
The movies were 2x binned and motion corrected using MotionCor236 and CTF was estimated using CTFFIND37 in Relion38. 1,809,869 EPYC149-72 peptide-bound Rubisco particles, 2,257,131 EPYC1106-135 peptide-bound Rubisco particles, and 677,071 Rubisco particles in the apo state were selected using cisTEM39. 2D classification was performed using cisTEM. The classes presenting detailed features in class averages were chosen for 3D classification on cryoSPARC40,41 and on Relion. The 3D class showing clear secondary structures was chosen for 3D auto-refine first without symmetry and then with D4 symmetry imposed. After CTF refinement and Bayesian polishing in Relion, the reconstructed map resolution is 2.68 Å for the apo state, 2.62 Å for the EPYC149-72 peptide-bound state, and 2.06 Å for the EPYC1106-135 peptide-bound state. The EPYC149-72 peptide-bound particles at super-resolution pixel size were further subjected to CTF refinement and polishing, resulting in map at 2.13 Å resolution. Details for single-particle cryo-EM data collection and image processing are included in the Supplementary Table 1.
Single-particle cryo-electron microscopy model building, fitting, and refinement
A full model for Rubisco from Chlamydomonas was produced from an X-ray structure13 (PDB entry 1GK8) and used for rigid body fitting into a local resolution filtered apo or EPYC149-72 peptide-bound Rubisco cryo-EM map using UCSF Chimera42. After rigid body fitting of the full complex, initial flexible fitting was performed in COOT43 by manually going through the entire peptide chain of a single large and small Rubisco subunit before applying the changes to the other seven large and small subunits. The C-terminal part of the small subunit was built manually and the sequences updated to the RBCS2 sequences. The sequence of the EPYC149-72 peptide was used to predict secondary structure elements using JPred444, which gave the prediction that the C-terminal region (NWRQELES) is α-helical. Guided by this prediction, the peptide was built manually into the density using COOT. Additional maps like the initial 2.62 Å from the binned data and maps filtered to different resolutions with various applied B-factors were also used to help with model building in unclear regions. Additional real space refinement of the entire complex was performed using Phenix45. The EPYC1106-135 peptide bound map was used to build a model of the EPYC1106-135 peptide. First rigid body fitting of the EPYC149-72 peptide-bound Rubisco model into a local resolution filtered EPYC1106-135 peptide-bound Rubisco cryo-EM map was performed using UCSF Chimera. Then the sequence of the peptide was mutated to the EPYC1106-135 peptide sequence, followed by flexible fitting to slightly adjust the PDB to the density. Models were subjected to an all-atom structure validation using MolProbity46. Figures were produced using UCSF Chimera.
Liquid–liquid phase separation assay
Proteins used in the liquid–liquid phase separation assay were obtained and stored essentially as described previously11. Briefly, Rubisco was purified from Chlamydomonas reinhardtii cells (CC-2677 cw15 nit1–305 mt-5D, Chlamydomonas Resource Center), grown in Sueoka’s high-salt medium47, using a combination of anion exchange chromatography and gel filtration.
The EPYC1 full-length gene (encoding amino acids 1-317) and corresponding R/K mutant (EPYC1R64A/K127A/K187A/K248A/R314A) were synthesized by GenScript and cloned between the SacII and HindIII site of the pHue vector48. Proteins were produced in the E. coli strain BL21 (DE3) harbouring pBADESL49 for co-expression of the E. coli chaperonin GroEL/S. The purification was conducted with minor changes (dialysis for removal of high immidazol concentrations was skipped by running the gel-filtration column before the second IMAC). After the first IMAC step and cleavage50 of the N-terminal His6–ubiquitin tag, proteins were separated by gel filtration. Finally, the peak fraction was passed a second time through an IMAC column, collecting EPYC1 from the flow through.
EPYC1-Rubisco condensates were reconstituted in vitro in a buffer containing 20 mM Tris-HCl (pH 8.0) and NaCl concentrations as indicated. 5 μl reactions were incubated for 3 minutes at room temperature before monitoring the droplet formation by differential interference contrast (DIC) microscopy. DIC images were acquired with a Nikon Eclipse Ti Inverted Microscope using a 60× oil-immersion objective after allowing the droplets to settle on the coverslip (Superior Marienfeld, Germany) surface for about 3 minutes. For droplet sedimentation assays 10 μl reactions were incubated for 3 minutes at 20°C before separating the droplets form the bulk phase by spinning for 3 minutes at 21,000xg and 4°C. Pelleted droplets and supernatant fractions were analyzed using Coomassie-stained SDS-PAGE.
Yeast two-hybrid assay
Yeast two-hybrid to detect interactions between EPYC1 and RbcS1 was carried out as described previously12. EPYC1 was cloned into the two-hybrid vector pGBKT7 to create a fusion with the GAL4 DNA binding domain. Point mutations were introduced by PCR into RbcS1, which was then cloned in the pGADT7 to create a fusion with the GAL4 activation domain. Yeast cells were then co-transformed with binding and activation domain vectors. Successful transformants were cultured, diluted to an optical density at 600 nm (OD600) of 0.5 or 0.1, and plated onto SD-L-W and SD-L-W-H containing increasing concentrations of the HIS3 inhibitor triaminotriazole (3-AT). Plates were imaged after 3 days. Spots shown in Fig. 5a were grown at 5 mM 3-AT from a starting OD600 of 0.5; they are a subset of the full dataset shown in Extended Data Fig. 6.
Cloning of Rubisco small subunit point mutants
The plasmid pSS1-ITP51 which contains Chlamydomonas RBCS1 including UTRs and introns 1 and 2 was used as a starting point for generating plasmids pSH001 and pSH002, which encode RBCS1D23A/E24A, and RBCS1M87D/V94D, respectively. The point mutations were generated by Gibson assembly52 of gBlocks (synthesized by Integrated DNA Technologies) containing the desired mutations into pSS-ITP that had been enzyme digested by restriction endonucleases (XcmI and BbvCI for the D23A/E24A mutations and BbvCI and BlpI for the M87D/V94D mutations). All constructs were verified by Sanger sequencing.
The fragment for making pSH001 (containing the D23A/E24A Rubisco small subunit mutant) had the following sequence: GCAGGGCTGCCCCGGCTCAGGCCAACCAGATGATGGTCTGGACCCCGGTCAACAACAAGATGTTCGAGACCTTCTCCTACCTGCCTCCTCTGACCGCCGCGCAGATCGCCGCCCAGGTCGACTACATCGTCGCCAACGGCTGGATCCCCTGCCTGGAGTTCGCTGAGGCCGACAAGGCCTACGTGTCCAAC
The fragment for making pSH002 (containing the M87D/V94D Rubisco small subunit mutant) had the following sequence: CTGCCTGGAGTTCGCTGAGGCCGACAAGGCCTACGTGTCCAACGAGTCGGCCATCCGCTTCGGCAGCGTGTCTTGCCTGTACTACGACAACCGCTACTGGACCATGTGGAAGCTGCCCATGTTCGGCTGCCGCGACCCCGACCAGGTGCTGCGCGAGATCGACGCCTGCACCAAGGCCTTCCCCGATGCCTACGTGCGCCTGGTGGCCTTCGACAACCAGAAGCAGGTGCAGATCATGGGCTTCCTGGTCCAGCGCCCCAAGACTGCCCGCGACTTCCAGCCCGCCAACAAGCGCTCCGTGTAAATGGAGGCGCTCGTCGATCTGAGCCGTGTGTGATGTTTGTTGGTGTTTGAGCGAGTGCAATGAGAGTGTGTGTGTGTGTGTTGTTGGTGTGTGGCTAAGCCAAGCGTGATCGC
Both the plasmids pSH001 and pSH002 have been submitted to the Chlamydomonas Resource Center (www.chlamycollection.org).
Transformation of Chlamydomonas to make the Rubisco small subunit point mutants
Chlamydomonas strains Δrbcs;RBCSWT, Δrbcs;RBCSD23A/E24A, and Δrbcs;RBCSM87D/V94D (The accession numbers of these strains in Chlamydomonas Resource Center are CC-5616, CC-5617 and CC-5618, respectively.) were generated by transforming pSS1-ITP, pSH001, and pSH002 (encoding Rubisco small subunit constructs) into the Rubisco small subunit deletion mutant T60 (Δrbcs) by electroporation as described previously53. For each transformation, 29 ng kbp−1 of KpnI linearized plasmid was mixed with 250 μL of 2 x 10⁸ cells mL−1 at 16°C and electroporated immediately. Transformant colonies were selected on Tris-Phosphate plates without antibiotics at 3% v/v CO2 under ~50 μmol photons m−2 s−1 light. The sequence of RbcS in the transformants was verified by PCR amplification and Sanger sequencing.
Spot tests
Δrbcs;RBCSWT, Δrbcs;RBCSD23A/E24A, and Δrbcs;RBCSM87D/V94D (The accession numbers of these strains in Chlamydomonas Resource Center are CC-5616, CC-5617 and CC-5618, respectively.) were grown in Tris-Phosphate medium at 3% CO2 until ~2x10⁶ cells mL−1. Cells were diluted in Tris-Phosphate medium to a concentration of 8.7 ×10⁷ cells mL−1, then serially diluted 1:10 three times. 7.5 μL of each dilution was spotted onto four TP plates and incubated in air or 3% CO2 under 20 or 100 μmol photons m−2 s−1 white light for 9 days before imaging.
Transmission electron microscopy
Samples for electron microscopy were fixed for 1 hour at room temperature in 2.5% glutaraldehyde in Tris-Phosphate medium (pH 7.4), followed by 1 hour at room temperature in 1% OsO4, 1.5% K3Fe(CN)3, and 2 mM CaCl2. Fixed cells were then bulk stained for 1 hour in 2% uranyl acetate, 0.05 M maleate buffer at pH 5.5. After serial dehydration (50%, 75%, 95%, and 100% ethanol, followed by 100% acetonitrile), samples were embedded in epoxy resin containing 34% Quetol 651, 44% nonenyl succinic anhydride, 20% methyl-5- norbornene-2,3-dicarboxylic anhydride, and 2% catalyst dimethylbenzylamine. Ultramicrotomy was done by the Core Imaging Lab, Medical School, Rutgers University. Imaging was performed at the Imaging and Analysis Center, Princeton University, on a CM100 transmission electron microscope (Philips, Netherlands) at 80 kV.
Measurement of nearest-neighbor distances between EPYC1 binding sites on Rubisco holoenzymes within pyrenoids
For detailed descriptions of the Chlamydomonas cell culture, vitrification of cells onto EM grids, thinning of cells by cryo-focused ion beam milling, 3D imaging of native pyrenoids by cryo-electron tomography, tomographic reconstruction, template matching, and subtomogram averaging, see our previous study5. In that study, we measured the distances between the center positions of Rubisco complexes within tomograms of five pyrenoids. The spatial parameters determined in that study were combined with the EPYC1-binding sites resolved here by cryo-EM single-particle analysis to measure the nearest-neighbor distances between EPCY1 binding sites on adjacent Rubisco complexes within the native pyrenoid matrix.
The in situ subtomogram average EMD-36945 was used as the reference for the Rubisco model. We extracted the isosurface from this density using the 0.5 contour level recommended in the Electron Microscopy Data Bank entry. We then fit the atomic model of EPYC1-bound Rubisco (Fig. 2) within the EMD-3694 density, and for each EPYC1 binding site, we marked the closest point on the isosurface to define the EPYC1 binding sites on this model. The positions and orientations previously determined by subtomogram averaging were used to place each Rubisco model and its corresponding binding sites into the pyrenoid tomograms using the PySeg program54.
To compute the nearest-neighbor distances between EPYC1 binding sites on two different Rubisco complexes, first, linkers were drawn between each EPYC1 binding site and all other binding sites within 25 nm. Binding sites on the same Rubisco complex were ignored. Next, the linkers were filtered by length (defined as the Euclidean distance between the two binding sites), and only the shortest linker was retained for each binding site. To prevent edge effects, linkers were discarded if they had a binding site <12 nm from the masked excluded volume (grey in Fig. 6b), which marks the border of the analyzed pyrenoid matrix. Finally, linker distances were plotted in a histogram to show the distribution of lengths (normalized to 100%).
Regarding the accuracy of the Rubisco localization in the previous study5, we used template matching, subtomogram alignment, and hierarchical classification to identify 97.5% of the Rubisco complexes in each of the five pyrenoid volumes. The Rubisco average was determined at a resolution of 16.5 Å. This could be interpreted to mean that the Rubisco complexes were localized with 1.65 nm precision. However, this resolution is not a simple reflection of translational and rotational accuracy, but is also greatly limited by the contrast transfer function and pixel size of the tomographic data. Furthermore, with this localization uncertainty being random for each particle, it would not change the ~4 nm peak distance between neighboring EPYC1 binding sites measured in our current study.
Modeling of the energy required to stretch EPYC1-linker regions
The energy required to stretch the linker regions between EPYC1’s Rubisco-binding regions was determined as follows. The force F required to stretch a 40 amino acid linker region to any given length z was approximated using a wormlike chain model55:
In the above equation, kB is the Boltzmann constant, T is the temperature, Lp is the persistence length (assumed to be 1 nm, a representative value for disordered proteins), and L0 is the contour length (estimated as 40 amino acids * 0.36 nm/amino acid). The energy required to stretch the linker to a length x is given by:
This energy was calculated and plotted in Fig. 6d.
Data availability
All data generated or analyzed during this study are included in this Article, the Extended Data and the Supplementary tables. The single-particle cryo-EM maps have been deposited in the Electron Microscopy Data Bank with accession codes EMDB-22401, EMDB-22308 and EMDB-22462. The atomic models have been deposited in the Protein Data Bank under accession codes PDB 7JN4, PDB 7JFO and PDB 7JSX. The raw datasets have been deposited in the Electron Microscopy Public Image Archive with accession codes EMPIAR-10503, EMPIAR-10502 and EMPIAR-10501. The subtomogram average of Rubisco has been deposited in the Electron Microscopy Data Bank with accession code EMD-3694.
Extended Data
Extended Data Fig. 1. The EPYC1 peptides with the highest binding affinities to Rubisco were chosen for structural studies.
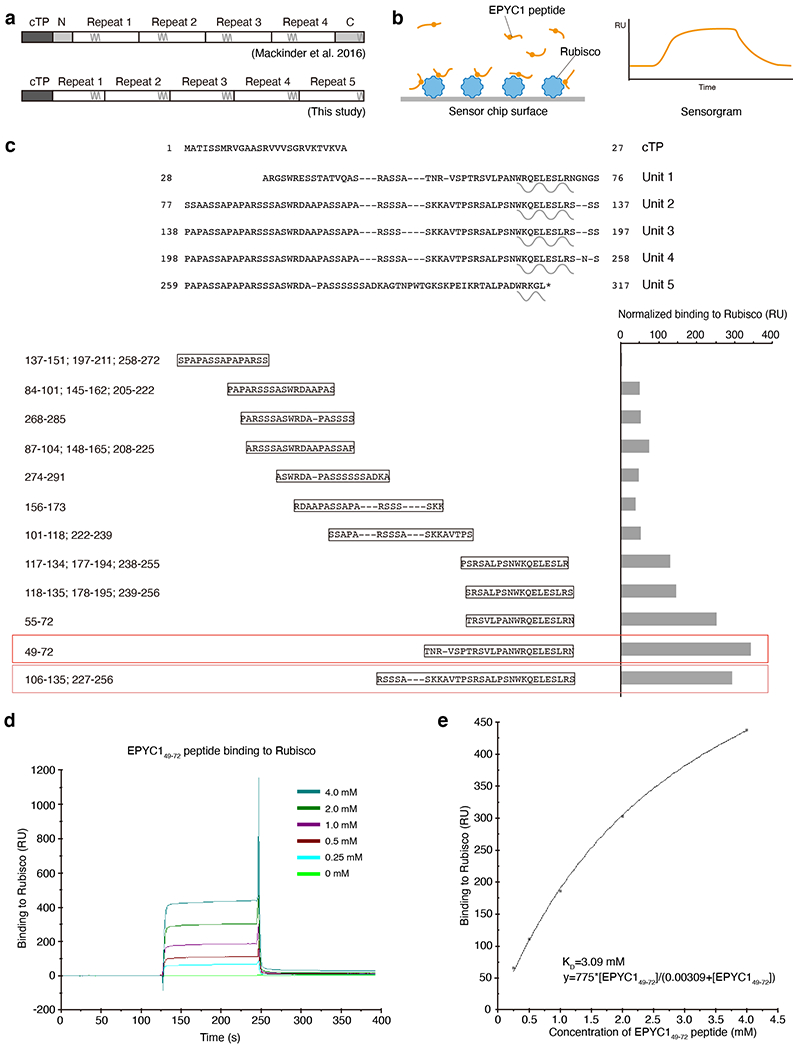
a, Diagram indicating the differences between the previously defined sequence repeats10 and the newly defined sequence repeats on full-length EPYC1. b, To verify the Rubisco-binding regions on EPYC1, surface plasmon resonance (SPR) was used to measure the binding of EPYC1 peptides to Rubisco. Purified Rubisco was immobilized on a sensor surface, and the EPYC1 peptides in solution were injected over the surface. The binding activity was recorded in real time in a sensorgram. c, The peptides used in SPR experiments are shown aligned to the sequence as shown in Fig. 1. The Rubisco-binding signal from the SPR experiment of each peptide is shown after normalization to the peptide’s molecular weight. EPYC149-72 (boxed in red) and EPYC1106-135 (boxed in pink) were chosen for structural studies based on their reproducible high Rubisco binding signal. d, The Rubisco-binding response of the EPYC149-72 peptide at different concentrations was measured by SPR. e, The binding responses shown in (d) were fitted to estimate the KD of EPYC149-72 peptide binding to Rubisco.
Extended Data Fig. 2. Single-particle cryo-EM data collection and image processing procedure.
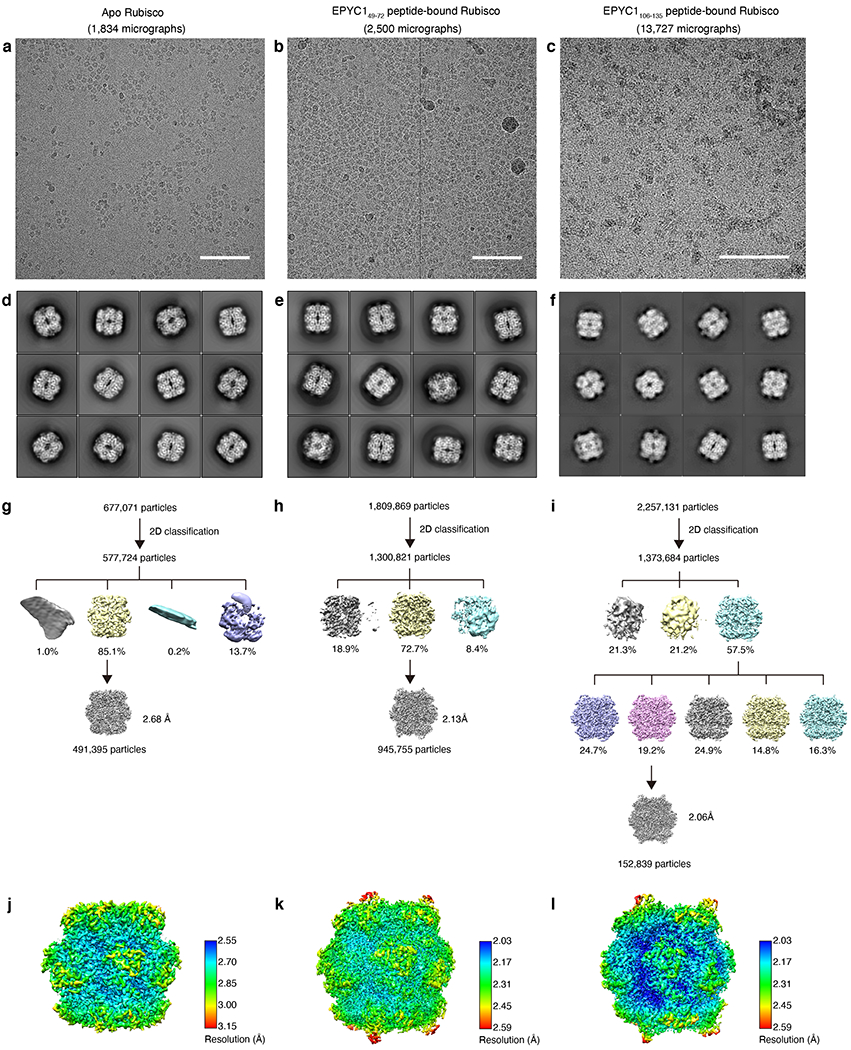
a-c, Representative micrographs of the apo Rubisco sample (a), the Rubisco-EPYC149-72 complex (b) and the Rubisco-EPYC1106-135 complex (c). Scale bars = 100 nm. d-f, Representative 2D class averages of the apo Rubisco sample (d), the Rubisco-EPYC149-72 complexes (e) and the Rubisco-EPYC1106-135 complexes (f). g-i, Overview of the workflow for single-particle data processing for the apo Rubisco sample (g), the Rubisco-EPYC149-72 sample (h) and the Rubisco-EPYC1106-135 sample (i). j-l, Local resolution estimation of the final refined apo Rubisco map (j), the final refined Rubisco-EPYC149-72 complex map (k) and the final refined Rubisco-EPYC1106-135 complex map (l).
Extended Data Fig. 3. Cryo-EM analysis and resolution of apo Rubisco and Rubisco-EPYC1 peptide complexes in this study.
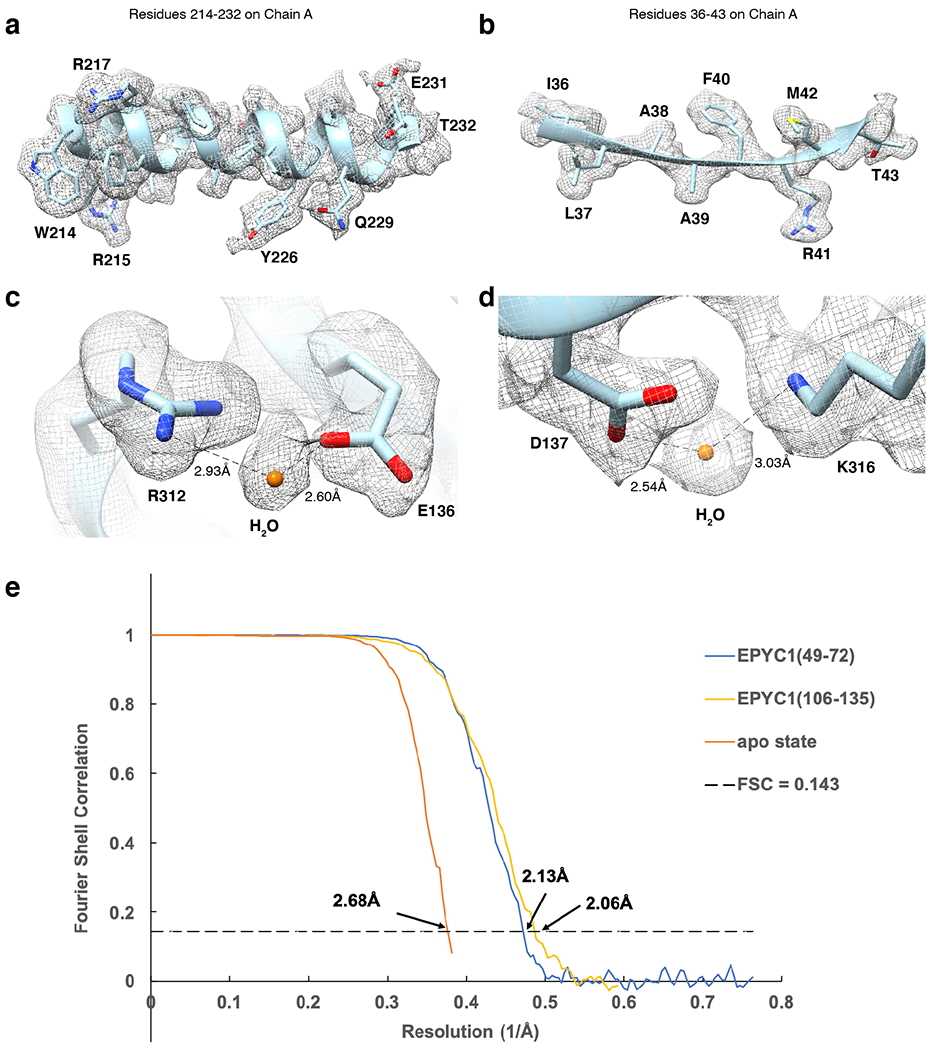
a-b, Representative cryo-EM density quality showing an α-helix of residues 214-232 in chain A (one of the Rubisco large subunits) (a) and a β-sheet of residues 36-43 in chain A (b) of the Rubisco-EPYC149-72 density map and structural model. The densities are shown as meshwork in gray. The backbones of the structural model are in ribbon representation, and side chains are shown in stick representation. c-d, Representative cryo-EM density quality showing water molecules as orange spheres. One water molecule between R312 and E136 on chain A is shown in panel c, and another water molecule between D137 and K316 on chain A is shown in panel d. e, Fourier shell correlation (FSC) curves of the final density maps of apo Rubisco and the Rubisco-EPYC1 peptide complexes.
Extended Data Fig. 4. Comparison of our EM structure of apo Rubisco and the published X-ray crystallography structure (1gk8) of Rubisco purified from Chlamydomonas reinhardtii13, and comparison of our EM structure of apo Rubisco and Rubisco bound with EPYC149-72 peptide.
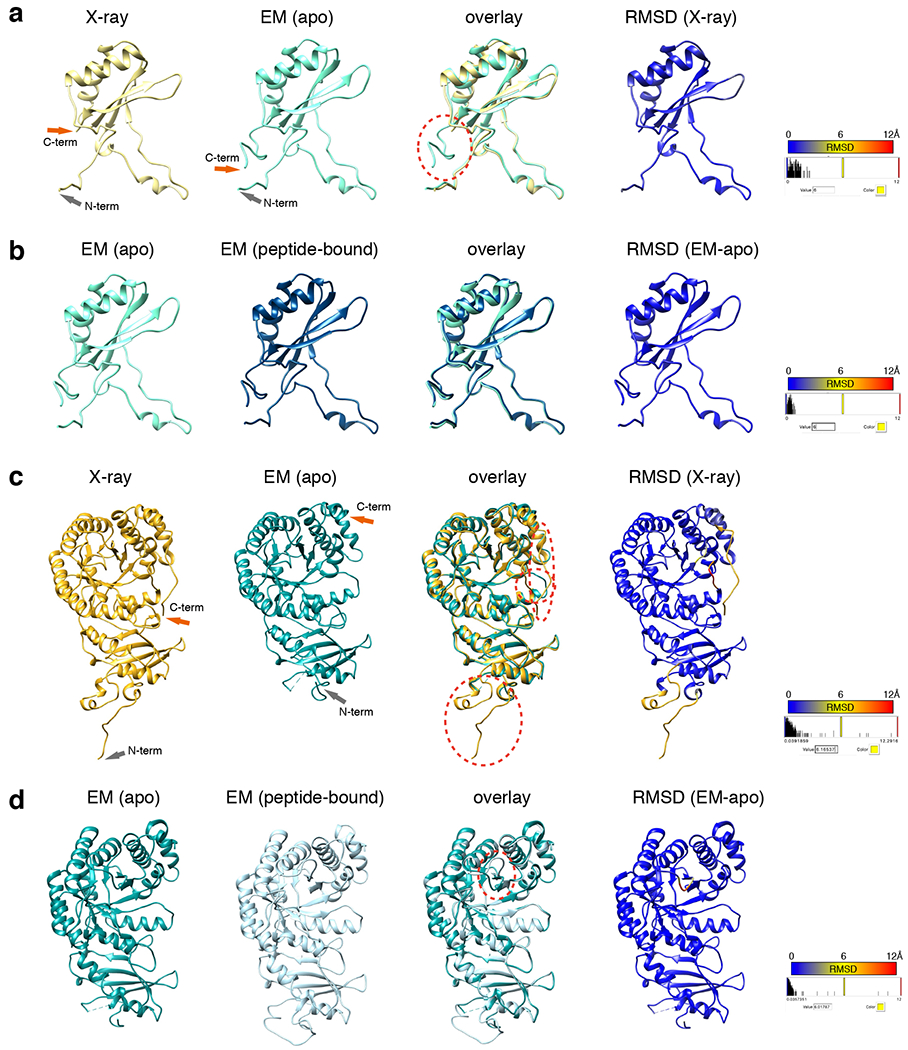
a, Comparison of the structure of the small subunit of apo Rubisco obtained here by EM with 1gk8. The EM structure has additional C-terminus density past residue 126, circled by a red dashed line. b, Comparison of our two EM structures of the small subunit: from apo Rubisco and from EPYC149-72 peptide-bound Rubisco. c, Comparison of the structure of the large subunit of apo Rubisco obtained here by EM with 1gk8. The three major differences found between the X-ray structure and the EM structure of the large subunit are circled with red dashed lines. d, Comparison of our two EM structures of the large subunit: from apo Rubisco and from EPYC149-72 peptide-bound Rubisco. The major difference found between the EPYC149-72 peptide-bound structure and the apo EM structure was the loop between K175 and L180 of the large subunit, which is shown circled by a red dashed line.
Extended Data Fig. 5. Additional residues may contribute to the interaction between EPYC1 and Rubisco.
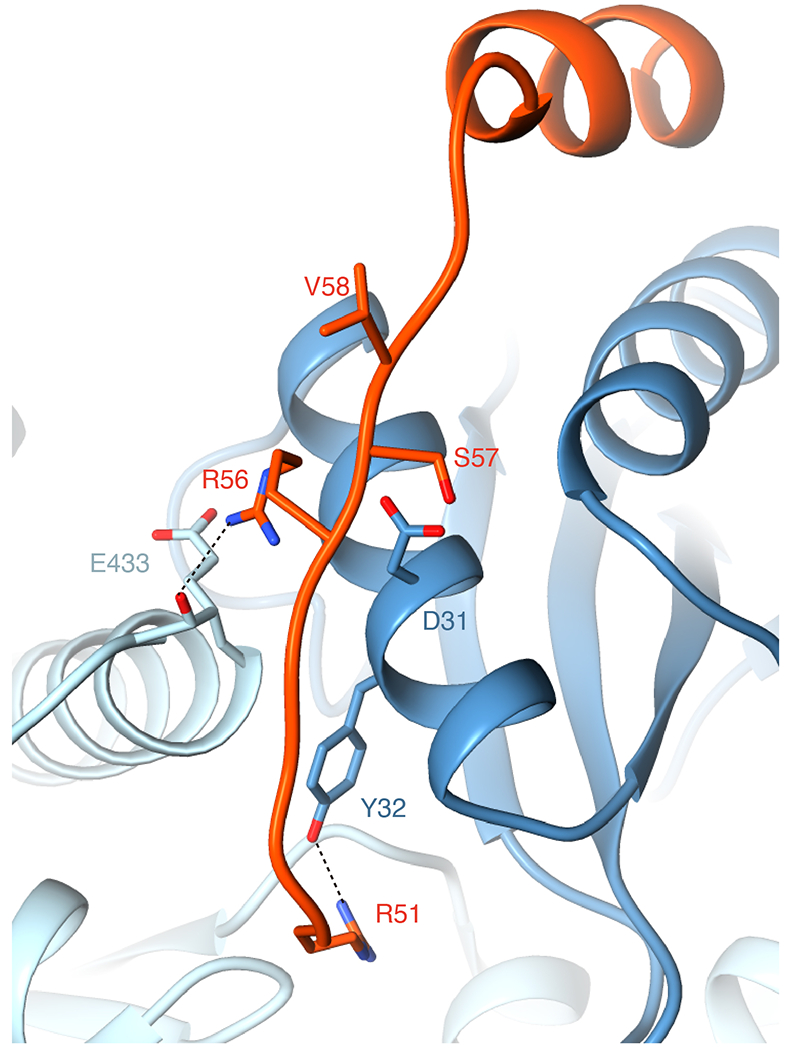
Our Rubisco-EPYC149-72 peptide structure suggests that R56 of the EPYC149-72 peptide may interact with D31 of the Rubisco small subunit and E433 of the Rubisco large subunit (the atoms of the backbone of E433 are also shown to display the possible interaction). R51 of the EPYC149-72 peptide may form a salt bridge with Y32 of the Rubisco small subunit. Residues S57 and V58 of the EPYC149-72 peptide are close to D31 in the structure, which may explain why replacing either of these residues with a negatively charged residue disrupts binding (Fig. 4a).
Extended Data Fig. 6. The EPYC1106-135 peptide binds to Rubisco small subunit α-helices via salt bridges and a hydrophobic pocket in a similar manner to the EPYC149-72 peptide.
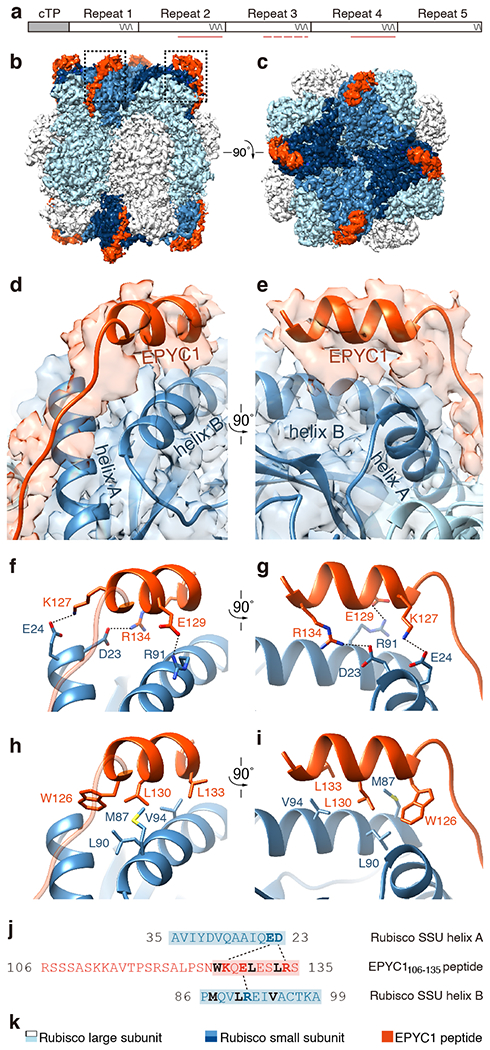
a, The EPYC1106-135 peptide represents the second, third and fourth Rubisco-binding regions of EPYC1 indicated by pink lines and dash line (the peptide is a perfect match to the second and fourth Rubisco-binding regions, and there is a one-amino acid difference between the peptide and the third repeat). b-c, Side view (b) and top view (c) of the density map of the EPYC1106-135 peptide-Rubisco complex. Dashes in panel b indicate regions shown in panels d-i. d-e, Front (d) and side (e) views of the EPYC1106-135 peptide (red) bound to the two α-helices of the Rubisco small subunit (blue). f-g, Three pairs of residues form salt bridges between the helix of the EPYC1106-135 peptide and the helices on the Rubisco small subunit. Shown are front (f) and side (g) views as in panel d and panel e. The distances from EPYC1 K127, R134 and E129 to Rubisco small subunit E24, D23 and R91 are 2.96 Å, 3.17 Å, and 2.68 Å, respectively. h-i, A hydrophobic pocket is formed by three residues of the EPYC1106-135 peptide and three residues of helix B of the Rubisco small subunit. Shown are front (h) and side (i) views as in panel d and panel e. j, Summary of the interactions observed between the EPYC1106-135 peptide and the two α-helices of the Rubisco small subunit. Helices are highlighted; the residues mediating interactions are bold; salt bridges are shown as dotted lines; residues contributing to the hydrophobic pocket are shown in black. k, Color keys used in this figure.
Extended Data Fig. 7. Surface plasmon resonance analysis of binding of point mutants of EPYC155-72 to Rubisco.
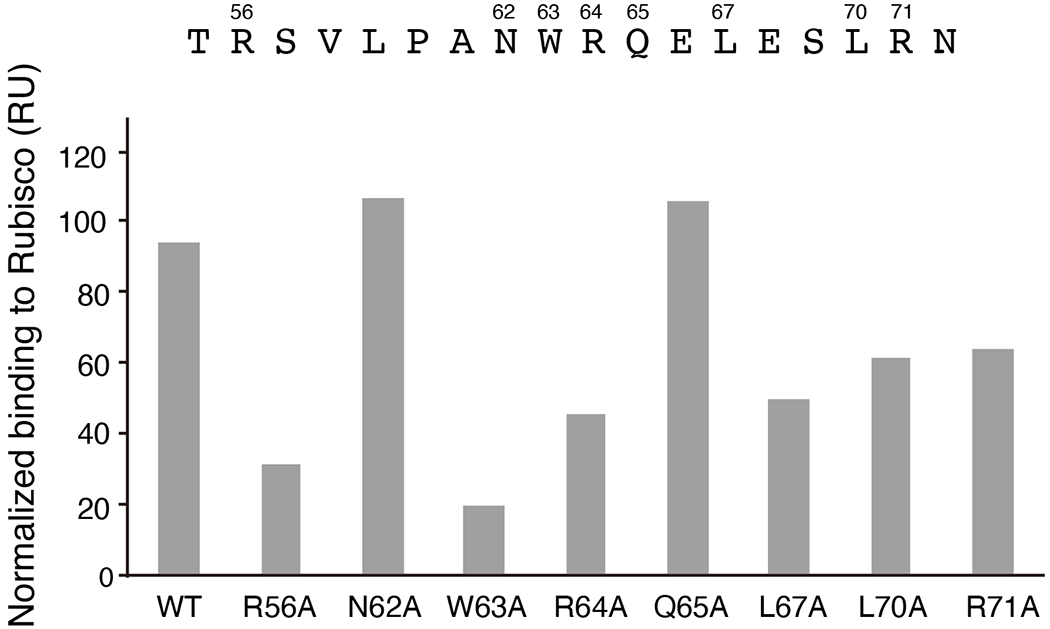
The wild-type (WT) peptide or peptides with the indicated mutations were synthesized, and their Rubisco-binding signal was measured by surface plasmon resonance.
Extended Data Fig. 8. Interface residues on EPYC1 identified by cryo-EM are important for binding and phase separation of EPYC1 and Rubisco.
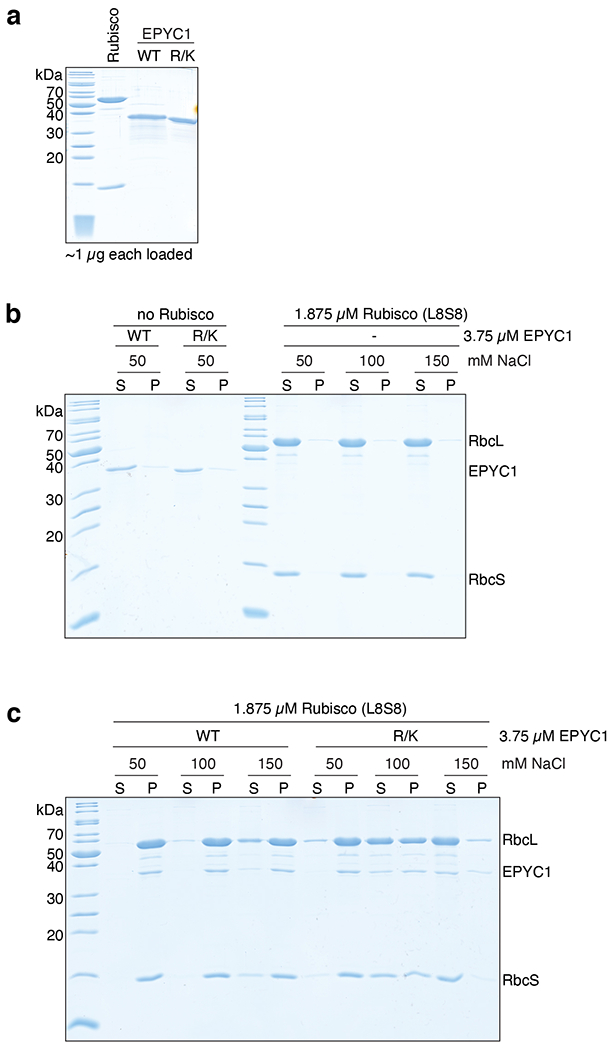
a, SDS-PAGE analysis of purified proteins used for in vitro phase separation experiments. WT = wild-type EPYC1; R/K = EPYC1R64A/K127A/K187A/K248A/R314. b-c, A droplet sedimentation assay was used as a readout of phase separation complementary to the microscopy analyses shown in Fig. 4b. Proteins at indicated concentrations were mixed and incubated for 10 minutes, then condensates were pelleted by centrifugation. Supernatant (S) and pellet (P) fractions were run on a denaturing gel. The negative controls with no Rubisco or with no EPYC1 are shown in (b), and the wild-type Rubisco with wild-type EPYC1 or mutant EPYC1 are shown in (c). Data shown here are representative of two independent replicates.
Extended Data Fig. 9. Yeast two-hybrid assays of interactions between EPYC1 and wild-type or mutated Rubisco small subunit.
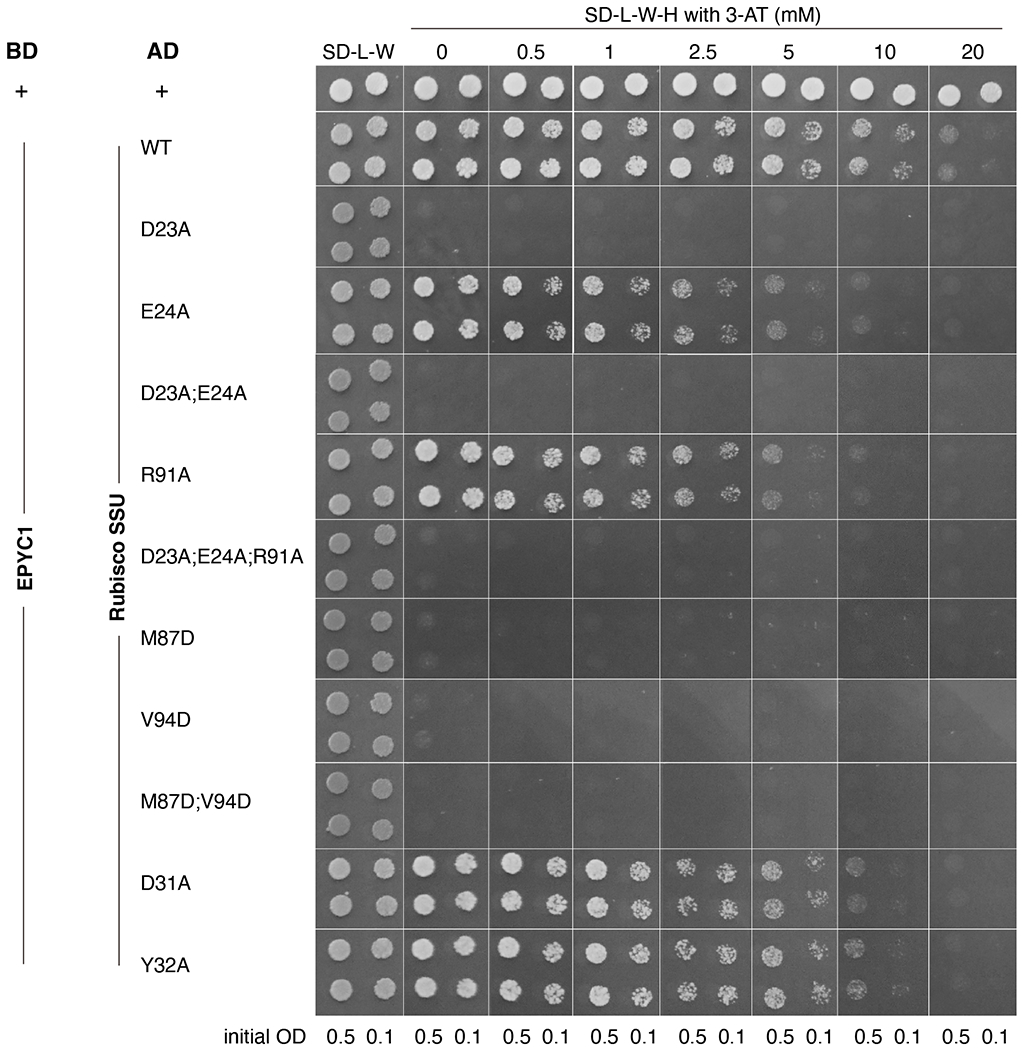
Colonies are shown after 3 days growth on plates. A subset of the data shown in this figure is shown in Fig. 5a.
Extended Data Fig. 10. Selection of the Rubisco small subunit mutant strains for phenotype analysis.
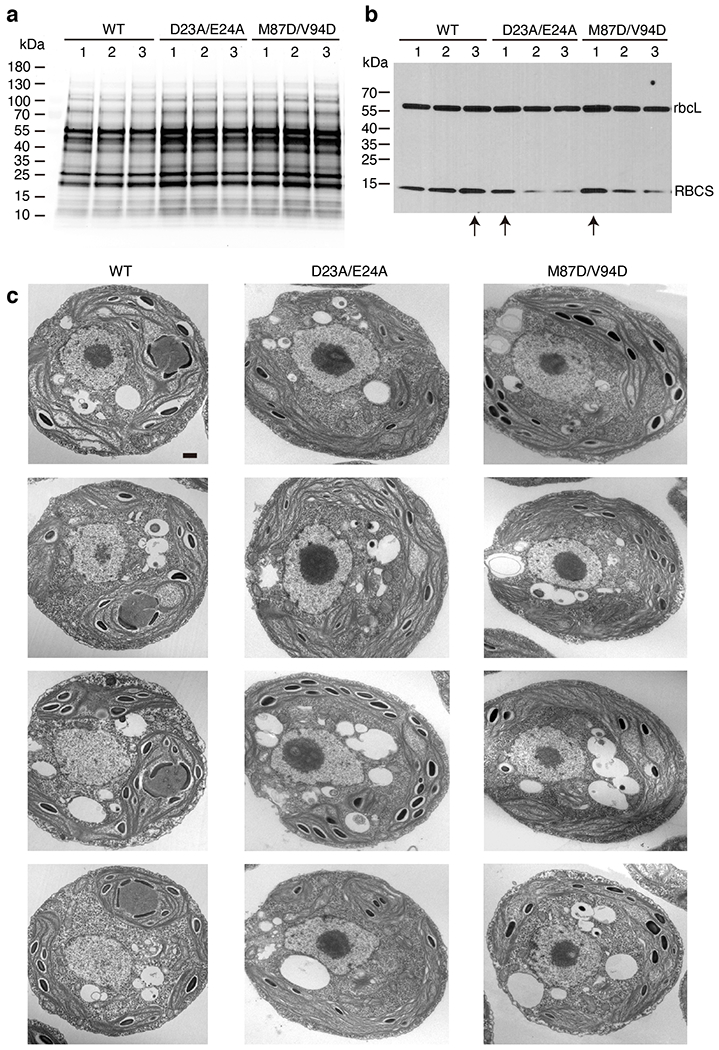
a, The Rubisco small subunit-less mutant T60 (Δrbcs) was transformed with DNA encoding wild-type and mutant Rubisco small subunits (RBCS) to produce candidate transformants with the genotypes Δrbcs;RBCSWT, Δrbcs;RBCSD23A/E24A, and Δrbcs;RBCSM87D/V94D. Total protein extracts for three strains from each transformation were separated on a polyacrylamide gel. b, The gel shown in panel a was probed by Western blot using a polyclonal antibody mixture that detects both large and small Rubisco subunits. The experiments shown in panel a and b were performed once for selecting the candidate transformants with the highest RBCS expression level from each genotype, in case any phenotype may be caused by low expression level of Rubisco. Selected strains are indicated by an arrow below the lanes and were used for the subsequent phenotypic analyses shown in Fig. 5 and panel c. c, Additional representative TEM images of whole cells of the strains expressing wild-type, D23A/E24A, and M87D/V94D Rubisco small subunit. Scale bar = 500 nm. For each strain, at least 25 images (one image for one cell) were taken and showing similar results.
Supplementary Material
Acknowledgements
We thank Jianping Wu, Nieng Yan, Luke Mackinder, Cliff Brangwynne and members of the Jonikas laboratory for helpful discussions; Ned Wingreen, Silvia Ramundo, Jessi Hennacy, Eric Franklin and Alexandra Wilson for constructive feedback on the manuscript; Wolfgang Baumeister and Jürgen Plitzko for providing support and cryo-ET instrumentation; and Miroslava Schaffer for help with acquiring the cryo-ET data, previously published in Freeman Rosenzweig et al., 2017. This project was funded by National Science Foundation (IOS-1359682 and MCB-1935444), National Institutes of Health (DP2-GM-119137), and Simons Foundation and Howard Hughes Medical Institute (55108535) grants to M.C.J., Deutsche Forschungsgemeinschaft grant (EN 1194/1-1 as part of FOR2092) to B.D.E., Ministry of Education (MOE Singapore) Tier 2 grant (MOE2018-T2-2-059) to O.M.-C., UK Biotechnology and Biological Sciences Research Council (BB/S015531/1) and Leverhulme Trust (RPG-2017-402) grants to A.J.M and N.A., NIH grant R01GM071574 to F.M.H., Deutsche Forschungsgemeinschaft fellowship (PO2195/1-1) to S.A.P., and National Institute of General Medical Sciences of the National Institutes of Health (T32GM007276) training grant to V.K.C.. The content is solely the responsibility of the authors and does not necessarily represent the official view of the National Institutes of Health.
Footnotes
Conflict of interest statement
Princeton University and HHMI have submitted a provisional patent application on aspects of the findings.
References
- 1.Field CB, Behrenfeld MJ, Randerson JT & Falkowski P Primary production of the biosphere: integrating terrestrial and oceanic components. Science 281, 237–240 (1998). [DOI] [PubMed] [Google Scholar]
- 2.Hessler AM, Lowe DR, Jones RL & Bird DK A lower limit for atmospheric carbon dioxide levels 3.2 billion years ago. Nature 428, 736–738 (2004). [DOI] [PubMed] [Google Scholar]
- 3.Ainsworth EA & Long SP What have we learned from 15 years of free-air CO2 enrichment (FACE)? A meta-analytic review of the responses of photosynthesis, canopy properties and plant production to rising CO2. New Phytol 165, 351–371, doi: 10.1111/j.1469-8137.2004.01224.x (2005). [DOI] [PubMed] [Google Scholar]
- 4.Raven JA, Cockell CS & De La Rocha CL The evolution of inorganic carbon concentrating mechanisms in photosynthesis. Philosophical transactions of the Royal Society of London. Series B, Biological sciences 363, 2641–2650, doi: 10.1098/rstb.2008.0020 (2008). [DOI] [PMC free article] [PubMed] [Google Scholar]
- 5.Freeman Rosenzweig ES et al. The Eukaryotic CO2-Concentrating Organelle Is Liquid-like and Exhibits Dynamic Reorganization. Cell 171, 148–162 e119, doi: 10.1016/j.cell.2017.08.008 (2017). [DOI] [PMC free article] [PubMed] [Google Scholar]
- 6.Badger MR et al. The diversity and coevolution of Rubisco, plastids, pyrenoids, and chloroplast-based CO2-concentrating mechanisms in algae. Can J Bot 76, 1052–1071, doi: 10.1139/b98-074 (1998). [DOI] [Google Scholar]
- 7.Villarreal JC & Renner SS Hornwort pyrenoids, carbon-concentrating structures, evolved and were lost at least five times during the last 100 million years. Proc Natl Acad Sci U S A 109, 18873–18878, doi: 10.1073/pnas.1213498109 (2012). [DOI] [PMC free article] [PubMed] [Google Scholar]
- 8.Wang Y, Stessman DJ & Spalding MH The CO2 concentrating mechanism and photosynthetic carbon assimilation in limiting CO2 : how Chlamydomonas works against the gradient. The Plant journal : for cell and molecular biology 82, 429–448, doi: 10.1111/tpj.12829 (2015). [DOI] [PubMed] [Google Scholar]
- 9.Raven JA CO2-concentrating mechanisms: A direct role for thylakoid lumen acidification? Plant Cell Environ 20, 147–154, doi:Doi 10.1046/J.1365-3040.1997.D01-67.X (1997). [DOI] [Google Scholar]
- 10.Mackinder LC et al. A repeat protein links Rubisco to form the eukaryotic carbon-concentrating organelle. Proc Natl Acad Sci U S A 113, 5958–5963, doi: 10.1073/pnas.1522866113 (2016). [DOI] [PMC free article] [PubMed] [Google Scholar]
- 11.Wunder T, Cheng SLH, Lai SK, Li HY & Mueller-Cajar O The phase separation underlying the pyrenoid-based microalgal Rubisco supercharger. Nature communications 9, 5076, doi: 10.1038/s41467-018-07624-w (2018). [DOI] [PMC free article] [PubMed] [Google Scholar]
- 12.Atkinson N et al. The pyrenoidal linker protein EPYC1 phase separates with hybrid Arabidopsis-Chlamydomonas Rubisco through interactions with the algal Rubisco small subunit. Journal of experimental botany 70, 5271–5285, doi: 10.1093/jxb/erz275 (2019). [DOI] [PMC free article] [PubMed] [Google Scholar]
- 13.Taylor TC, Backlund A, Bjorhall K, Spreitzer RJ & Andersson I First crystal structure of Rubisco from a green alga, Chlamydomonas reinhardtii. J Biol Chem 276, 48159–48164, doi: 10.1074/jbc.M107765200 (2001). [DOI] [PubMed] [Google Scholar]
- 14.Duff AP, Andrews TJ & Curmi PM The transition between the open and closed states of rubisco is triggered by the inter-phosphate distance of the bound bisphosphate. J Mol Biol 298, 903–916, doi: 10.1006/jmbi.2000.3724 (2000). [DOI] [PubMed] [Google Scholar]
- 15.Meyer MT et al. Rubisco small-subunit α-helices control pyrenoid formation in Chlamydomonas. Proc Natl Acad Sci U S A 109, 19474–19479, doi: 10.1073/pnas.1210993109. (2012). [DOI] [PMC free article] [PubMed] [Google Scholar]
- 16.Engel BD et al. Native architecture of the Chlamydomonas chloroplast revealed by in situ cryo-electron tomography. eLife 4, DOI: 10.7554/eLife.04889, doi: 10.7554/eLife.04889 (2015). [DOI] [PMC free article] [PubMed] [Google Scholar]
- 17.Goodenough UW & Levine RP Chloroplast structure and function in ac-20, a mutant strain of Chlamydomonas reinhardi. 3. Chloroplast ribosomes and membrane organization. J Cell Biol. 44, 547–562, doi: 10.1083/jcb.44.3.547 (1970). [DOI] [PMC free article] [PubMed] [Google Scholar]
- 18.Ma Y, Pollock SV, Xiao Y, Cunnusamy K & Moroney JV Identification of a novel gene, CIA6, required for normal pyrenoid formation in Chlamydomonas reinhardtii. Plant Physiol 156, 884–896, doi: 10.1104/pp.111.173922 (2011). [DOI] [PMC free article] [PubMed] [Google Scholar]
- 19.Caspari OD et al. Pyrenoid loss in Chlamydomonas reinhardtii causes limitations in CO2 supply, but not thylakoid operating efficiency. Journal of experimental botany 68, 3903–3913, doi: 10.1093/jxb/erx197 (2017). [DOI] [PMC free article] [PubMed] [Google Scholar]
- 20.Li P et al. Phase transitions in the assembly of multivalent signalling proteins. Nature 483, 336–340, doi: 10.1038/nature10879 (2012). [DOI] [PMC free article] [PubMed] [Google Scholar]
- 21.Borkhsenious ON, Mason CB & Moroney JV The Intracellular Localization of Ribulose-1,5-Bisphosphate Carboxylase/Oxygenase in Chlamydomonas reinhardtii. Plant Physiol 116, 1585–1591, doi: 10.1104/pp.116.4.1585 (1998). [DOI] [PMC free article] [PubMed] [Google Scholar]
- 22.Turkina MV, Blanco-Rivero A, Vainonen JP, Vener AV & Villarejo A CO2 limitation induces specific redox-dependent protein phosphorylation in Chlamydomonas reinhardtii. Proteomics 6, 2693–2704, doi: 10.1002/pmic.200500461 (2006). [DOI] [PubMed] [Google Scholar]
- 23.Cai F et al. Advances in Understanding Carboxysome Assembly in Prochlorococcus and Synechococcus Implicate CsoS2 as a Critical Component. Life (Basel) 5, 1141–1171, doi: 10.3390/life5021141 (2015). [DOI] [PMC free article] [PubMed] [Google Scholar]
- 24.Oltrogge LM et al. Multivalent interactions between CsoS2 and Rubisco mediate alpha-carboxysome formation. Nat Struct Mol Biol 27, 281–287, doi: 10.1038/s41594-020-0387-7 (2020). [DOI] [PMC free article] [PubMed] [Google Scholar]
- 25.Long BM, Badger MR, Whitney SM & Price GD Analysis of carboxysomes from Synechococcus PCC7942 reveals multiple Rubisco complexes with carboxysomal proteins CcmM and CcaA. J Biol Chem 282, 29323–29335, doi: 10.1074/jbc.M703896200 (2007). [DOI] [PubMed] [Google Scholar]
- 26.Wang H et al. Rubisco condensate formation by CcmM in beta-carboxysome biogenesis. Nature 566, 131–135, doi: 10.1038/s41586-019-0880-5 (2019). [DOI] [PubMed] [Google Scholar]
- 27.Hennacy JH & Jonikas MC Prospects for Engineering Biophysical CO2 Concentrating Mechanisms into Land Plants to Enhance Yields. Annual review of plant biology, doi: 10.1146/annurev-arplant-081519-040100 (2020). [DOI] [PMC free article] [PubMed] [Google Scholar]
- 28.Long BM et al. Carboxysome encapsulation of the CO2-fixing enzyme Rubisco in tobacco chloroplasts. Nature communications 9, 3570, doi: 10.1038/s41467-018-06044-0 (2018). [DOI] [PMC free article] [PubMed] [Google Scholar]
- 29.Lin MT, Occhialini A, Andralojc PJ, Parry MA & Hanson MR A faster Rubisco with potential to increase photosynthesis in crops. Nature 513, 547–550, doi: 10.1038/nature13776 (2014). [DOI] [PMC free article] [PubMed] [Google Scholar]
- 30.Atkinson N et al. Introducing an algal carbon-concentrating mechanism into higher plants: location and incorporation of key components. Plant Biotechnol J 14, 1302–1315, doi: 10.1111/pbi.12497 (2016). [DOI] [PMC free article] [PubMed] [Google Scholar]
- 31.Hanson MR, Gray BN & Ahner BA Chloroplast transformation for engineering of photosynthesis. Journal of experimental botany 64, 731–742, doi: 10.1093/jxb/ers325 (2013). [DOI] [PubMed] [Google Scholar]
- 32.Raven JA, Beardall J & Sanchez-Baracaldo P The possible evolution and future of CO2-concentrating mechanisms. J Exp Bot 68, 3701–3716, doi: 10.1093/jxb/erx110 (2017). [DOI] [PubMed] [Google Scholar]
- 33.Kropat J et al. A revised mineral nutrient supplement increases biomass and growth rate in Chlamydomonas reinhardtii. The Plant journal : for cell and molecular biology 66, 770–780, doi: 10.1111/j.1365-313X.2011.04537.x (2011). [DOI] [PMC free article] [PubMed] [Google Scholar]
- 34.Khrebtukova I & Spreitzer RJ Elimination of the Chlamydomonas gene family that encodes the small subunit of ribulose-1,5-bisphosphate carboxylase/oxygenase. Proc Natl Acad Sci U S A 93, 13689–13693, doi: 10.1073/pnas.93.24.13689 (1996). [DOI] [PMC free article] [PubMed] [Google Scholar]
- 35.Zhang R et al. High-Throughput Genotyping of Green Algal Mutants Reveals Random Distribution of Mutagenic Insertion Sites and Endonucleolytic Cleavage of Transforming DNA. Plant Cell 26, 1398–1409, doi: 10.1105/tpc.114.124099 (2014). [DOI] [PMC free article] [PubMed] [Google Scholar]
- 36.Zheng SQ et al. MotionCor2: anisotropic correction of beam-induced motion for improved cryo-electron microscopy. Nat Methods 14, 331–332, doi: 10.1038/nmeth.4193 (2017). [DOI] [PMC free article] [PubMed] [Google Scholar]
- 37.Rohou A & Grigorieff N CTFFIND4: Fast and accurate defocus estimation from electron micrographs. J Struct Biol 192, 216–221, doi: 10.1016/j.jsb.2015.08.008 (2015). [DOI] [PMC free article] [PubMed] [Google Scholar]
- 38.Zivanov J et al. New tools for automated high-resolution cryo-EM structure determination in RELION-3. eLife 7, doi: 10.7554/eLife.42166 (2018). [DOI] [PMC free article] [PubMed] [Google Scholar]
- 39.Grant T, Rohou A & Grigorieff N cisTEM, user-friendly software for single-particle image processing. eLife 7, doi: 10.7554/eLife.35383 (2018). [DOI] [PMC free article] [PubMed] [Google Scholar]
- 40.Punjani A, Rubinstein JL, Fleet DJ & Brubaker MA cryoSPARC: algorithms for rapid unsupervised cryo-EM structure determination. Nat Methods 14, 290–296, doi: 10.1038/nmeth.4169 (2017). [DOI] [PubMed] [Google Scholar]
- 41.Punjani A, Brubaker MA & Fleet DJ Building Proteins in a Day: Efficient 3D Molecular Structure Estimation with Electron Cryomicroscopy. IEEE Trans Pattern Anal Mach Intell 39, 706–718, doi: 10.1109/TPAMI.2016.2627573 (2017). [DOI] [PubMed] [Google Scholar]
- 42.Pettersen EF et al. UCSF Chimera--a visualization system for exploratory research and analysis. J Comput Chem 25, 1605–1612, doi: 10.1002/jcc.20084 (2004). [DOI] [PubMed] [Google Scholar]
- 43.Emsley P, Lohkamp B, Scott WG & Cowtan K Features and development of Coot. Acta Crystallogr D Biol Crystallogr 66, 486–501, doi: 10.1107/S0907444910007493 (2010). [DOI] [PMC free article] [PubMed] [Google Scholar]
- 44.Drozdetskiy A, Cole C, Procter J & Barton GJ JPred4: a protein secondary structure prediction server. Nucleic Acids Res 43, W389–394, doi: 10.1093/nar/gkv332 (2015). [DOI] [PMC free article] [PubMed] [Google Scholar]
- 45.Adams PD et al. PHENIX: a comprehensive Python-based system for macromolecular structure solution. Acta Crystallogr D Biol Crystallogr 66, 213–221, doi: 10.1107/S0907444909052925 (2010). [DOI] [PMC free article] [PubMed] [Google Scholar]
- 46.Chen VB et al. MolProbity: all-atom structure validation for macromolecular crystallography. Acta Crystallogr D Biol Crystallogr 66, 12–21, doi: 10.1107/S0907444909042073 (2010). [DOI] [PMC free article] [PubMed] [Google Scholar]
- 47.Sueoka N Mitotic replication of deoxyribonucleic acid in Chlamydomonas reinhardi. Proc Natl Acad Sci U S A. 46, 83–91, doi: 10.1073/pnas.46.1.83 (1960). [DOI] [PMC free article] [PubMed] [Google Scholar]
- 48.Catanzariti AM, Soboleva TA, Jans DA, Board PG & Baker RT An efficient system for high-level expression and easy purification of authentic recombinant proteins. Protein Sci 13, 1331–1339, doi: 10.1110/ps.04618904 (2004). [DOI] [PMC free article] [PubMed] [Google Scholar]
- 49.Ewalt KL, Hendrick JP, Houry WA & Hartl FU In vivo observation of polypeptide flux through the bacterial chaperonin system. Cell 90, 491–500, doi: 10.1016/s0092-8674(00)80509-7 (1997. ). [DOI] [PubMed] [Google Scholar]
- 50.Baker RT et al. in Ubiquitin and Protein Degradation, Part A Methods in Enzymology 540–554 (2005). [Google Scholar]
- 51.Genkov T, Meyer M, Griffiths H & Spreitzer RJ Functional hybrid rubisco enzymes with plant small subunits and algal large subunits: engineered rbcS cDNA for expression in chlamydomonas. J Biol Chem 285, 19833–19841, doi: 10.1074/jbc.M110.124230 (2010). [DOI] [PMC free article] [PubMed] [Google Scholar]
- 52.Gibson DG et al. Enzymatic assembly of DNA molecules up to several hundred kilobases. Nature methods 6, 343–345, doi: 10.1038/nmeth.1318 (2009). [DOI] [PubMed] [Google Scholar]
- 53.Li X et al. A genome-wide algal mutant library and functional screen identifies genes required for eukaryotic photosynthesis. Nat Genet 51, 627–635, doi: 10.1038/s41588-019-0370-6 (2019). [DOI] [PMC free article] [PubMed] [Google Scholar]
- 54.Martinez-Sanchez A et al. Template-free detection and classification of membrane-bound complexes in cryo-electron tomograms. Nat Methods, doi: 10.1038/s41592-019-0675-5 (2020). [DOI] [PubMed] [Google Scholar]
- 55.Cheng S, Cetinkaya M & Grater F How sequence determines elasticity of disordered proteins. Biophys J 99, 3863–3869, doi: 10.1016/j.bpj.2010.10.011 (2010). [DOI] [PMC free article] [PubMed] [Google Scholar]
Associated Data
This section collects any data citations, data availability statements, or supplementary materials included in this article.
Supplementary Materials
Data Availability Statement
All data generated or analyzed during this study are included in this Article, the Extended Data and the Supplementary tables. The single-particle cryo-EM maps have been deposited in the Electron Microscopy Data Bank with accession codes EMDB-22401, EMDB-22308 and EMDB-22462. The atomic models have been deposited in the Protein Data Bank under accession codes PDB 7JN4, PDB 7JFO and PDB 7JSX. The raw datasets have been deposited in the Electron Microscopy Public Image Archive with accession codes EMPIAR-10503, EMPIAR-10502 and EMPIAR-10501. The subtomogram average of Rubisco has been deposited in the Electron Microscopy Data Bank with accession code EMD-3694.


