Abstract
Background
Patients with pancreatic neuroendocrine tumors (PNETs) often present with metastases, which reduce survival. Molecular features associated with PNET tumorigenesis have been reported, but mechanisms of metastasis remain incompletely understood.
Methods
RNA sequencing was performed on primary and metastatic PNETs from 43 patients. Differentially expressed genes were identified and quantitative PCR (qPCR) used to confirm expression differences. BON cells were transfected with siRNAs and shRNAs to create knockdowns. Expression changes were confirmed by qPCR, cell viability assessed, and protein levels evaluated by Western blot.
Results
Nodal and hepatic metastases had decreased expression of somatostatin (SST) compared to primary tumors (p = .003). qPCR in a validation cohort confirmed 5.3-fold lower SST expression in hepatic metastases (p = .043) with no difference in SST receptor, synaptophysin, or chromogranin A expression. SST knockdown in BON cells increased cell metabolic activity, viability, and growth. SST-knockdown cells had significantly higher levels of phosphorylated Akt protein and higher mTOR compared to controls.
Conclusions
PNET metastases have lower expression of SST than primary tumors, and SST knockdown increased growth in PNET cell lines. This was associated with increased activation of Akt, identifying this pathway as a potential mechanism by which loss of SST expression promotes the metastatic phenotype.
Keywords: pancreas, neuroendocrine tumor, metastasis, somatostatin, gene expression, proliferation
Article Summary
Metastatic pancreatic neuroendocrine tumors have lower somatostatin expression compared to primary tumors. Knockdown of somatostatin increased phosphorylated Akt, suggesting a potential mechanism for the metastatic phenotype.
Background
Pancreatic neuroendocrine tumors (PNETs) are rare, heterogeneous neoplasms that have been increasing in incidence over the past 40 years.1,2 As the treatments for PNETs have expanded, survival has improved.2 Nevertheless, the 5-year survival for patients with PNETs is only 38%, one of the lowest survival rates for neuroendocrine tumors (NETs) from all sites.3 These low survival rates are due in part to the tendency of PNETs to present late. Of patients diagnosed with PNETs, 22% present with localized and 64% with distant disease.4 The median overall survival of patients with localized PNETs is approximately 230 months, decreasing to 90 months with regional disease, and 20 months with distant metastases.2
Knowledge of the genetic basis of primary PNETs has been aided by identification of predisposing genes for the hereditary conditions multiple endocrine neoplasia type 1, von Hippel-Lindau syndrome, neurofibromatosis, and tuberous sclerosis complex.5 Other genes implicated in PNET tumorigenesis identified from sporadic tumors include DAXX, ATRX, and genes in the mTOR pathway.6 Genes in the DNA damage response pathways, chromosomal and telomere alterations, and epigenetic changes have also been noted in the development of primary PNETs.7 In comparison, the molecular events associated with PNET metastasis remain poorly understood.
Pancreatic neuroendocrine tumors and their metastases are known to express G protein-coupled somatostatin receptors (SSTRs),8 which allow tumors to be imaged and treated with somatostatin (SST) analogues. Somatostatin is synthesized as a preproprotein which is cleaved into 28 or 14 amino acid active forms in neuroendocrine cells throughout the body, with its highest expression in the gastrointestinal tract and pancreas.9 Among other functions, SST inhibits pancreatic exocrine and endocrine function, inhibits the secretion of growth hormone and insulin, and also has anti-proliferative effects.10 It is used clinically to treat symptoms of carcinoid syndrome and to reduce the progression of gastroenteropancreatic NETs.11 Since exogenous administration of SST analogues appears to suppress tumor growth, we set out to determine whether there were differences in endogenous SST expression in PNET primaries and their metastases and to further explore how SST expression affects cell growth and survival.
Methods
RNA Sequencing
RNA sequencing (RNA-Seq) was performed on primary and metastatic tumors collected from 43 patients undergoing resection of PNETs.12 Nodal and hepatic metastases were resected with corresponding primary tumors in 18 and 16 patients, respectively. All patients provided written informed consent under an Institutional Review Board-approved protocol (IRB Number 199911057). Tumors were stored in RNALater (Thermo Fisher Scientific) at −20°C and RNA extracted using the RNeasy Plus Universal Kit (Qiagen). RNA was enriched, fragmented, converted to cDNA, and ligated to sequencing adaptors using the TruSeq Stranded mRNA Library Prep Kit (Illumina). RNA quality was assessed using the Agilent 2100 Bioanalyzer (Agilent Technologies) and then sequenced on the Illumina HiSeq 4000 genome sequencer. RNA-Seq reads were mapped and log2 fold changes estimated using the voom package in R v. 3.5.0 (R Foundation).
Gene validation
Matched primary tumors and hepatic metastases were collected from an additional 12 patients for gene validation by quantitative PCR (qPCR). RNA was extracted as described above and reverse transcribed to cDNA using qScript cDNA Supermix (QuantaBio). Quantitative PCR was performed with gene-specific primers and PerfeCTa SYBR Green Supermix dye (Quantabio) using the 7900HT Fast Real-Time PCR System (Applied Biosystems). Primer sequences were obtained from PrimerBank (https://pga.mgh.harvard.edu/primerbank/) and purchased from Integrated DNA Technologies (IDT). Primer sequences used for qPCR analysis are: ribosomal protein lateral stalk subunit P1 (RPLP1): forward-AGCCTCATCTGCAATGTAGGG, reverse-TCAGACTCCTCGGATTCTTCTTT; SST: forward-ACCCAACCAGACGGAGAATGA, reverse-GCCGGGTTTGAGTTAGCAGA; synaptophysin (SYP): forward- CTCGGCTTTGTGAAGGTGCT, reverse-CTGAGGTCACTCTCGGTCTTG; chromogranin A (CGA): forward-TAAAGGGGATACCGAGGTGATG, reverse-TCGGAGTGTCTCAAAACATTCC; and SSTR2: forward-TGGCTATCCATTCCATTTGACC, reverse-AGGACTGCATTGCTTGTCAGG. Gene expression levels were normalized to the control gene RPLP1 to determine the delta cycle threshold. Differential expression was determined by Wilcoxon rank-sum test using R.
RNA interference and cell viability assays
The human PNET cell line, BON,13 was cultured at 37°C in Dulbecco’s Modified Eagle Medium: Nutrient Mixture F-12 (DMEM/F12) supplemented with 10% fetal bovine serum (FBS), 100 μg/mL penicillin-streptomycin, and 1 mM L-glutamine. BON cells were reverse-transfected with two Dicer-substrate short interfering RNAs (DsiRNAs) against SST purchased from IDT (hs.Ri.SST.13.3 and hs.Ri.SST.13.4) and a scrambled negative control (DS Scrambled Neg) using Lipofectamine 2000 and Opti-MEM I (Thermo Fisher Scientific) per manufacturer protocol.14 Cells were harvested after 5 days. To measure cell viability, 1x alamarBlue (BioRad) was added and fluorescence signal was detected using excitation and emission wavelengths at 560 and 590 nm, respectively.
To create stable knockdown cell lines, lentiviral plasmids with a scrambled short hairpin RNA (shRNA) and SST shRNAs were purchased from Applied Biologic Materials and transfected in tsa201 cells using PolyFect (Qiagen) according to the manufacturer’s protocol. Lentiviruses encoding the scrambled shRNA and SST shRNAs were used to infect BON cells. BON cells stably expressing shRNAs were selected using 2.5 μg/mL puromycin. SST knockdown was confirmed by immunofluorescence (IF). Cells were cultured on glass cover slips, fixed with 4% paraformaldehyde for 10 minutes, and stained with primary antibody against SST (GeneTex) at 1/100 dilution for 2 hours. Cells were washed and incubated with anti-mouse secondary antibody conjugated with Alexa Fluor 488 at 1/500 dilution for 2 hours (ThermoFisher). Immunofluorescent images were taken using a fluorescent microscope at 300 ms exposure time. For the cell proliferation experiment, 5,000 cells were seeded per well in a 24-well plate and cultured in BON culture medium with 2.5 μg/mL puromycin. Culture medium was replaced every 2 days. Cell number was determined by manual counting using a hemocytometer every 2 days.
Western blotting
Cell proteins were isolated by lysis in radioimmunoprecipitation assay (RIPA) buffer with phosphatase and protease inhibitor (Roche). Protein concentrations were measured by BioRad protein assay and equal amounts of protein were loaded onto polyacrylamide gels. Proteins were transferred onto PVDF membranes (Millipore) and blocked with bovine serum albumin (BSA) in tris-buffered saline with Tween-20 (TBST). Membranes were incubated with primary antibodies against phospho-Akt (Ser473), phospho-mTOR (Ser2448), total Akt, total mTOR (Cell Signaling Technology), and GAPDH (Abcam) at 1/1000 dilution. Membranes were washed in TBST and incubated with horseradish peroxidase-conjugated anti-rabbit secondary antibody (Cell Signaling Technology) at 1/3000 dilution. Proteins were visualized with enhanced chemiluminescence (ECL) with Clarity Western ECL Substrate (BioRad). Densitometry quantification was performed using ImageJ (NIH).
Results
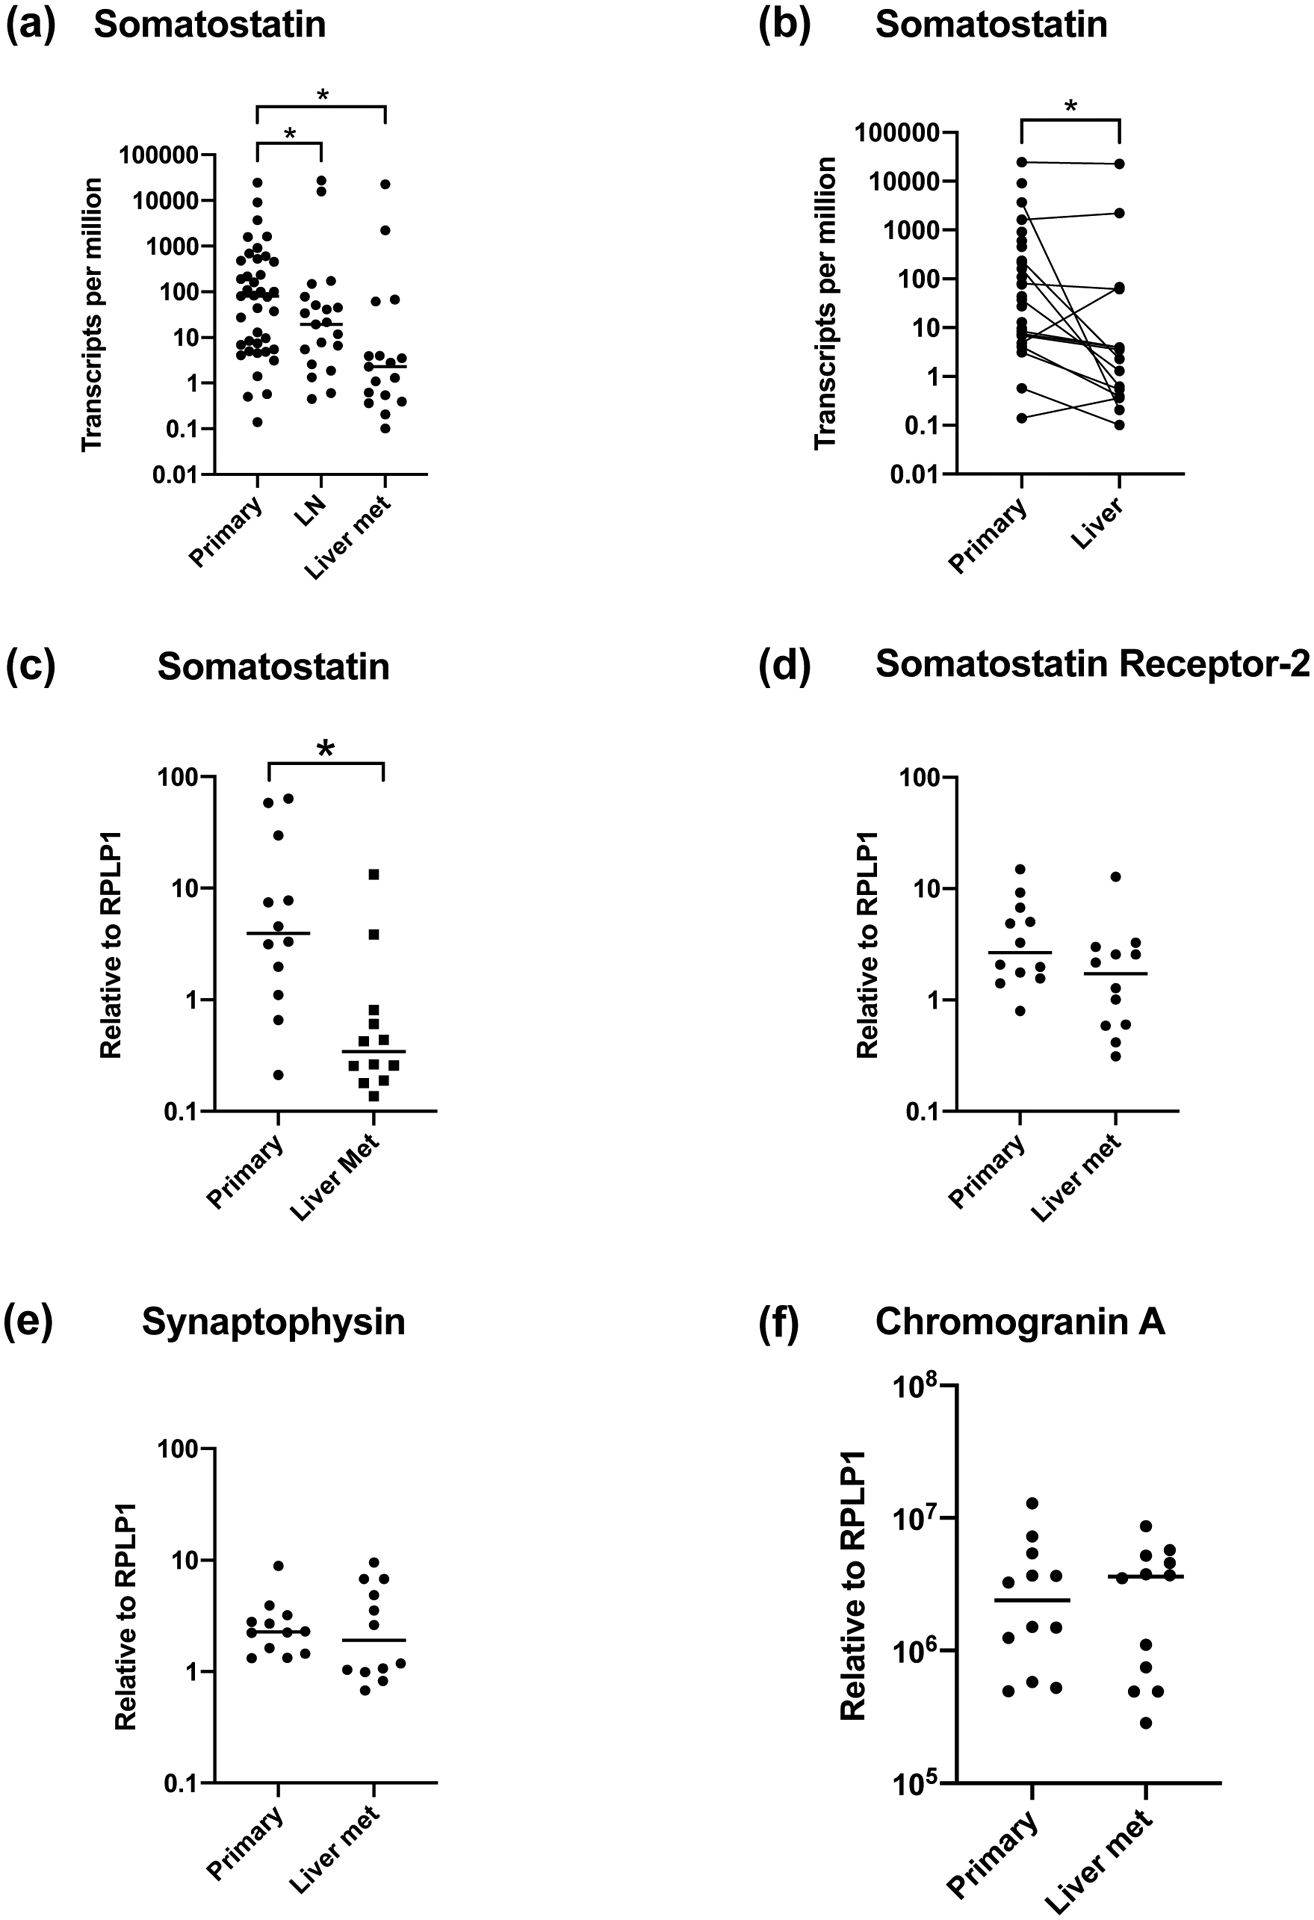
RNA-Seq was performed on well or moderately-differentiated, Grade 1 or 2 PNETs (39 primary tumors, 21 nodal metastases, 17 hepatic metastases) from 43 patients (Table 1). The median age at surgery was 65.9 years and 24 patients (56%) were female. Hepatic and nodal metastases had 35.0-fold and 4.2-fold lower SST expression, respectively, compared to primary tumors (p = .003, Figure 1a). In the 16 patients with both hepatic metastases and primary tumors, the metastases had 1.9-fold lower SST expression relative to their matched primary tumors (p = .041, Figure 1b), while in 19 matched nodal metastases the difference in SST expression compared to primary tumors was not statistically significant (p = .20). There were no differences in expression of SSTR2, SYN, or CGA between primary tumors, nodal metastases, and hepatic metastases from the RNA-seq data.
Table 1:
Patient characteristics in RNA sequencing and gene validation cohorts
| RNA Sequencing | qPCR Validation | |
|---|---|---|
| n = 43 | n = 12 | |
| Sex | ||
| Male | 19 | 6 |
| Female | 24 | 6 |
| Median age (range, years) | 65.9 (40.9–91.0) | 62.8 (54.2–90.9) |
| Median follow-up (years) | 6.1 | 2.5 |
| Node positive disease (%) | 31 (72.1%) | 9 (75%) |
| Grade 1 (%) | 11 (25.6%) | 2 (16.7%) |
| Grade 2 (%) | 32 (74.4%) | 9 (75%) |
| Grade 3 (%)* | - | 1 (8.3) |
| PFS (median, years) | 3.2 | 3.5 |
Progression-free survival (PFS);
well-differentiated
Figure 1. Somatostatin expression is lower in PNET metastases compared to primary tumors.

(a) Comparison of somatostatin expression in primary PNETs, nodal metastases, and hepatic metastases from 43 patients by RNA sequencing. (b) Comparison of somatostatin expression between matched primary and hepatic metastases (n = 16) by RNA sequencing from the same cohort of patients as in (a). (c-f) Comparison of gene expression in primary PNETs and hepatic metastases by qPCR in a different validation cohort of 12 patients for somatostatin (c), somatostatin receptor 2 (d), synaptophysin (e), and chromogranin A (f). * p < .05
Abbreviations: lymph node (LN), metastasis (met), pancreatic neuroendocrine tumor (PNET)
We validated these findings by qPCR on a set of 12 additional patients who had matched primary PNETs and hepatic metastases resected (Table 1). qPCR demonstrated that SST expression was 5.3-fold lower in hepatic metastases compared to primary tumors (p = .043, Figure 1c). There was no significant difference in expression of SSTR2 (p = .11, Figure 1d), SYN (p = .79, Figure 1e), or CGA (p = .91, Figure 1f) between metastases and primary tumors. Therefore, metastatic tumors maintained their neuroendocrine markers, suggesting they did not lose their neuroendocrine differentiation after metastasis, but expressed markedly lower levels of SST.
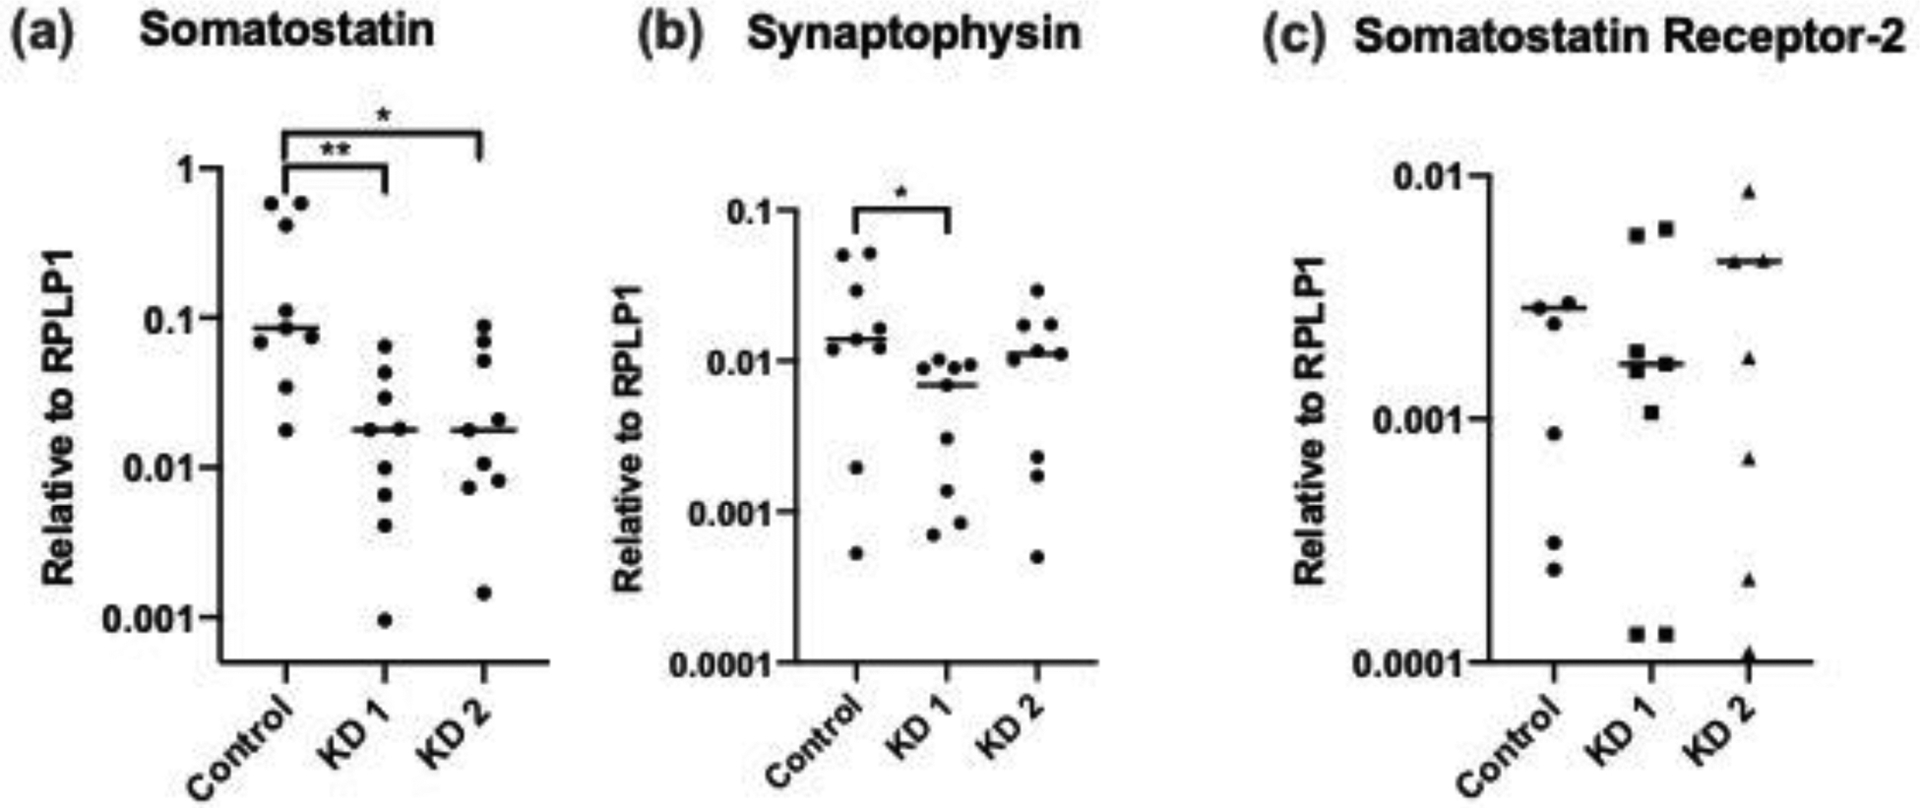
We sought to study the role of decreased SST expression by creating an in vitro model in PNET cell lines. SST was knocked down in BON cells by transfection with two siRNAs to create knockdown 1 and 2 (KD 1 and 2). Knockdown was confirmed by qPCR, which demonstrated 9-fold lower SST expression in knockdown cell lines compared to control (p = .006, Figure 2a). There was a difference in SYN expression between control and KD 1 (Figure 2b), and no statistically significant difference in SSTR2 expression (Figure 2c) between control and both knockdowns. Knockdown was further confirmed by IF staining against SST protein (Figure 3a).
Figure 2. Comparison of gene expression in BON SST-knockdown cells.

(a-c) Comparison between SST-knockdown and control BON cells of expression of somatostatin (a), synaptophysin (b), and somatostatin receptor 2 (c) by qPCR. BON cells were reverse-transfected with two siRNA against SST to create KD 1 and KD 2 with a scrambled siRNA as a control. Data are from three independent experiments. * p < .05, ** p < .01.
Abbreviations: knockdown (KD), short interfering RNA (siRNA), somatostatin (SST)
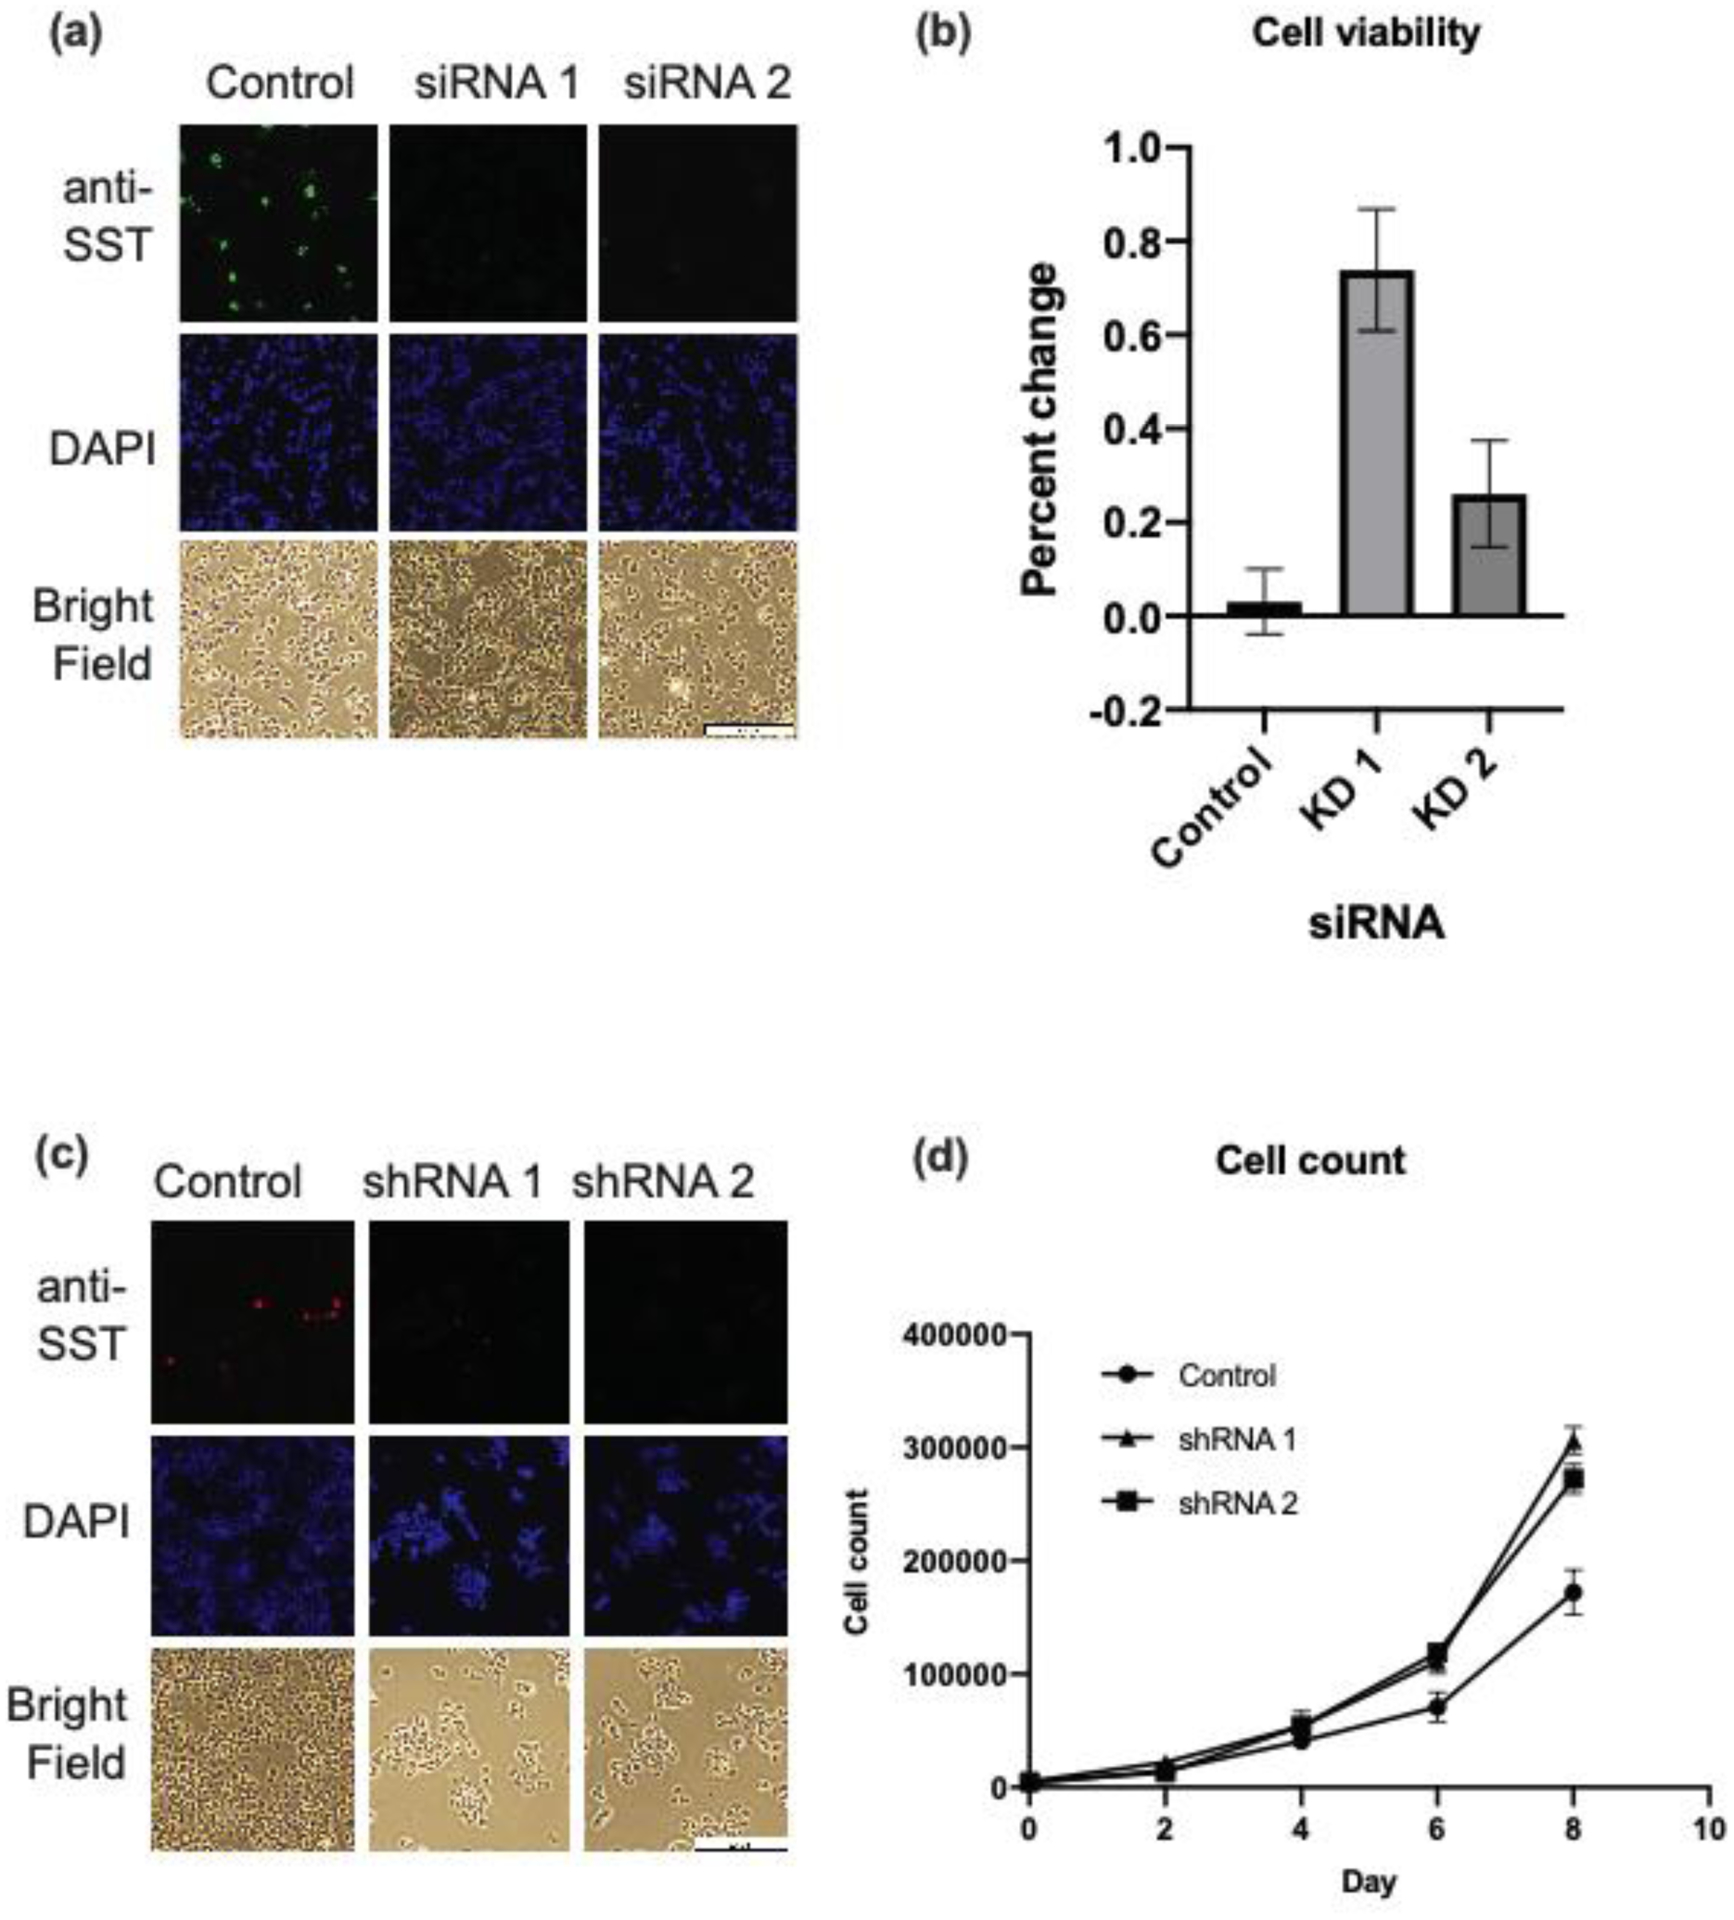
Figure 3. SST knockdown increases cell viability and growth in BON cells.

(a) Immunofluorescence image of SST-knockdown and control BON cells. Knockdown was accomplished by reverse-transfection with two siRNA against SST and a scrambled siRNA as a control. (b) Cell viability of SST-knockdown and control cells at day 3 and 6 post-transfection. Cell viability was determined using alamarBlue assay. (c) Immunofluorescence image of stable SST-knockdown and control cells. Knockdown was accomplished by infection with lentivirus encoding two shRNAs against SST and a scrambled shRNA as a control. (d) Cell count of stable SST-knockdown and control cells, determined by manual counting using a hemocytometer every two days. Data represent mean ± SEM from triplicates.
Abbreviations: short interfering RNA (siRNA), short hairpin RNA (shRNA), somatostatin (SST)
The viability of SST-knockdown cells was compared to that of scrambled control cells. SST-knockdown and control cells were plated at equal concentrations and viability determined by measuring fluorescence with alamarBlue assay. In this assay, fluorescence intensity represents cell metabolic activity, a proxy for cell viability. After 72 hours of incubation, KD 1 and 2 had 74% and 26% increase in fluorescence from the initial time point, as compared to a 3% increase in fluorescence in scrambled control cells (p < .001, Figure 3b).
To determine whether SST-knockdown cells increased cell growth, two SST stable knockdown cell lines (shRNA 1 and 2) were created by infecting BON cells with two lentiviruses harboring shRNAs against SST. shRNA knockdown was confirmed by IF, which demonstrated decreased SST staining in knockdown cells compared to control (Figure 3c). Knockdown cell lines were plated at equal concentrations and manually counted over eight days. By day eight, the knockdown cell lines had greater cell counts compared to control (p < .001, Figure 3d). These findings demonstrate that cells with decreased SST expression had increased cell viability and proliferation.
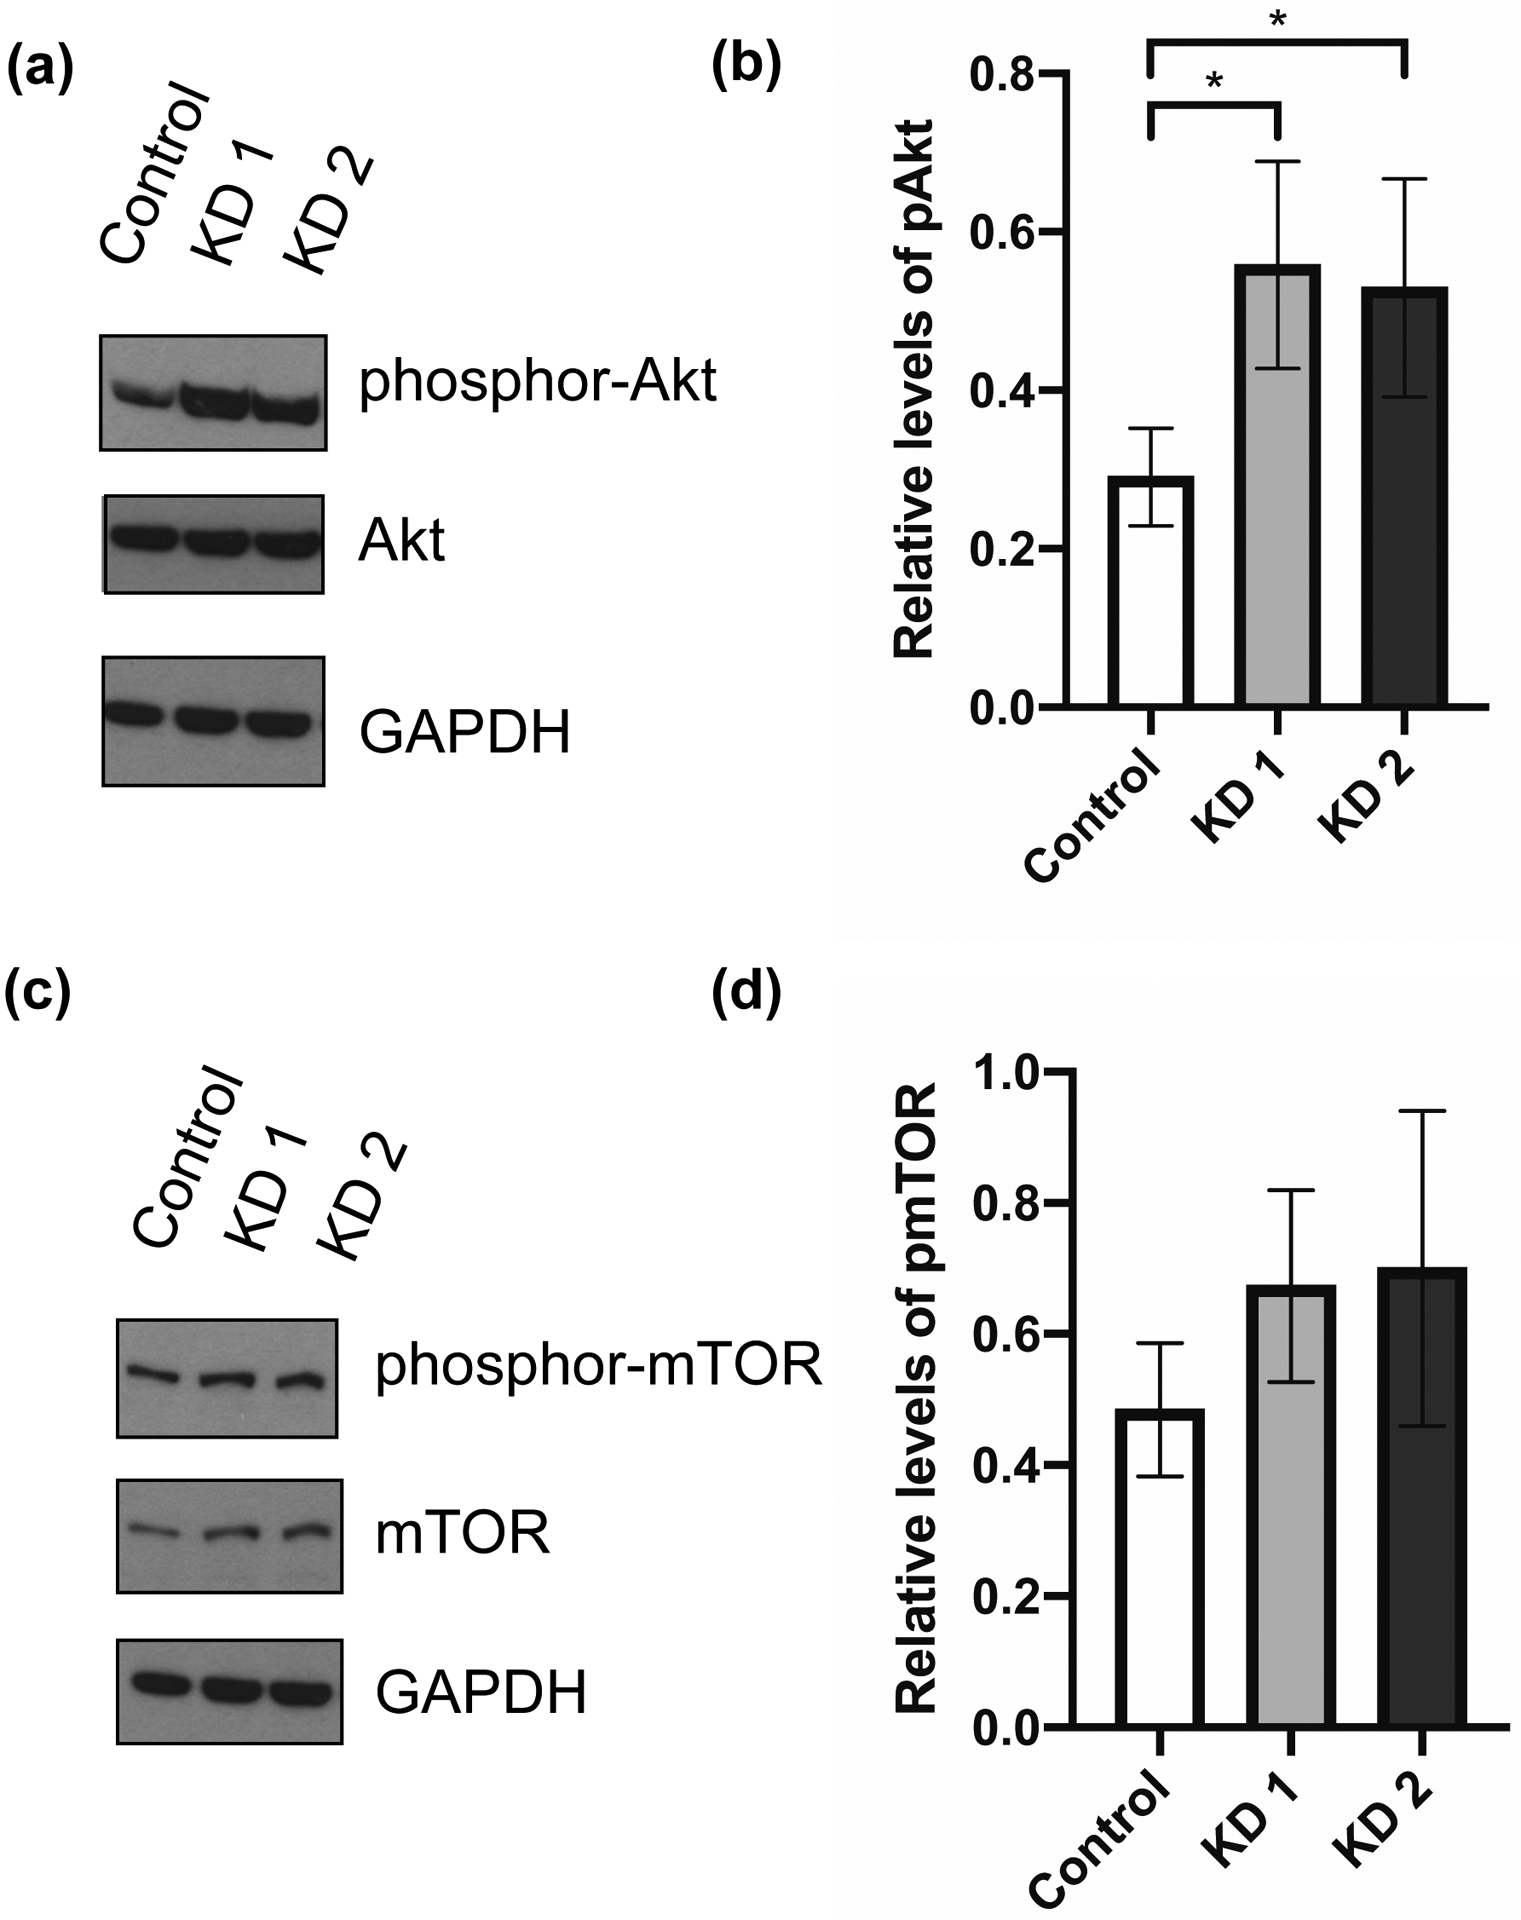
Since the Akt pathway is known to promote cell survival and is upregulated in PNETs,15 we set out to determine whether SST may mediate its effects through increased Akt activity. Protein was extracted from SST-knockdown and control cells five days after siRNA transfection and probed for phosphorylated-Akt (Figure 4a). Normalized to GAPDH, KD 1 had a 2-fold increase and KD 2 had a 1.6-fold increase in phosphorylated-Akt (p = .049, Figure 4b), with no difference in total Akt. Activation of the mTOR pathway has also been demonstrated in PNETs,6,16 so we probed for differential phosphorylated-mTOR expression (Figure 4c). KD 1 and 2 had approximately 1.4-fold increase in phosphorylated-mTOR compared to control, although this finding did not reach statistical significance (Figure 4d). Knockdown cells also expressed higher levels of total mTOR protein, although the difference was not statistically significant. These results show that decreased SST expression may confer increased cell growth and viability through increased activation of the Akt pathway.
Figure 4. SST knockdown increases phosphorylation of Akt.

Representative Western blots (repeated 3 or more times) of SST-knockdown and control BON cells. Protein was collected at day 5 after siRNA transfection for Western blot analysis. (a) Blots were incubated with antibodies against phosphor-Akt (Ser473), total Akt, and GAPDH. (b) Relative levels of phosphor-Akt, normalized to GAPDH, between SST-knockdown and control cells. (c) Blots were incubated with antibodies against phosphor-mTOR (Ser2448), total mTOR, and GAPDH. (c) Relative levels of phosphor-mTOR, normalized to GAPDH, between SST-knockdown and control cells. Quantification performed by ImageJ analysis. Data represent mean ± SD and are representative of 3 or more experiments. * p < .05.
Abbreviations: short interfering RNA (siRNA), knockdown (KD), somatostatin (SST)
Discussion
This study demonstrates that SST expression is significantly lower in PNET metastases relative to primary tumors, raising the question of whether this is an association or whether decreased SST is responsible for the more aggressive phenotype of PNET metastases. We confirmed that knockdown of SST expression increased cell growth and viability in vitro, and that decreased SST expression in turn leads to increased phosphorylation and therefore activation of the Akt pathway, which is dysregulated in multiple cancers.17
The PI3K/Akt/mTOR pathways have been implicated in PNET development and patients with PNETs and constitutive Akt/mTOR activation may have shorter progression-free survival.6,18 Akt is a serine/threonine kinase that promotes cell survival and inhibits apoptosis through inhibition of multiple substrates, including the mTOR inhibitor TSC2.19 mTOR is a serine/threonine kinase that increases cell growth and proliferation through increase in the production of nucleotides, proteins, and lipids, and suppression of catabolism and autophagy.17,19 Dysregulation of Akt/mTOR is believed to be vital to cancer cell development by allowing cancer cells to grow and divide in environments where nutrients and oxygen can be scarce.17 Recognition of the role of the mTOR pathway in tumorigenesis has led to the development of mTOR inhibitors as anti-cancer drugs. The mTOR inhibitor everolimus is approved for gastroenteropancreatic NETs and improves progression-free survival in patients with advanced PNETs.20 Temsirolimus, another mTOR inhibitor, has demonstrated survival benefit in patients with locally advanced or metastatic PNETs in combination with bevacizumab.21 Secondary activation of mTOR in response to drug treatment is thought to be one mechanism by which NETs develop drug resistance, particularly to mTOR inhibitors like everolimus.
Somatostatin, a peptide hormone present in the neuroendocrine and digestive systems, has multiple inhibitory functions throughout the body, including inhibition of endocrine and exocrine secretion, gastrointestinal motility, cell survival and proliferation, and angiogenesis.22 Initially developed in the 1980s, SST analogues provide symptomatic relief of carcinoid syndrome by inhibiting the secretory activity of NETs, which express SSTRs. Somatostatin analogues have also demonstrated anti-tumor effects and treatment improves progression-free survival in patient with advanced NETs.11
Somatostatin has five distinct receptors, and it signaling pathways are complex. Somatostatin interacts with the phosphoinositide 3-kinase (PI3K)/Akt pathway, through which it exerts some of its direct antiproliferative mechanisms, like inhibition of the cell cycle, induction of apoptosis, and inhibition of cell migration and invasion.22 Somatostatin also has indirect antiproliferative mechanisms, such as inhibition of angiogenesis and suppression of growth factors and growth hormones.10 The somatostatin analogue octreotide has been shown to decrease phosphorylated-Akt in pituitary tumor cells23 and in gastrointestinal enteroendocrine cells.24
The interaction between somatostatin and Akt/mTOR have not been previously connected in the development of PNET metastasis. In this study, we demonstrate that PNET metastases have decreased SST gene expression compared to primary tumors. The reduction of SST expression promotes cell viability and growth in vitro, which is mediated by increased activation of Akt and possibly mTOR. These findings suggest that SST is an upstream regulator of Akt and an important inhibitor of cell growth and proliferation.
Acknowledgements
This work was supported by NIH Grants No. T32CA148062 (CGT, ATS), T32CA078586 (SKS); SPORE Grants No. P50 CA174521 (JRH), P50 CA174521 Career Enhancement Program and PDX Supplement (PHE); and NANETS BTSI award (PHE).
Footnotes
Disclosures
The authors declare no conflict of interest.
Selected for presentation at the American Association of Endocrine Surgeons Annual Meeting in Birmingham, AL April 4–6, 2020
References
- 1.Lawrence B, Gustafsson BI, Chan A, Svejda B, Kidd M, Modlin IM. The epidemiology of gastroenteropancreatic neuroendocrine tumors. Endocrinol Metab Clin North Am. 2011;40(1):1–18, vii. [DOI] [PubMed] [Google Scholar]
- 2.Dasari A, Shen C, Halperin D, et al. Trends in the Incidence, Prevalence, and Survival Outcomes in Patients With Neuroendocrine Tumors in the United States. JAMA Oncol. 2017;3(10):1335–1342. [DOI] [PMC free article] [PubMed] [Google Scholar]
- 3.Modlin IM, Lye KD, Kidd M. A 5-decade analysis of 13,715 carcinoid tumors. Cancer. 2003;97(4):934–959. [DOI] [PubMed] [Google Scholar]
- 4.Yao JC, Hassan M, Phan A, et al. One hundred years after “carcinoid”: epidemiology of and prognostic factors for neuroendocrine tumors in 35,825 cases in the United States. J Clin Oncol. 2008;26(18):3063–3072. [DOI] [PubMed] [Google Scholar]
- 5.Scott AT, Howe JR. Evaluation and Management of Neuroendocrine Tumors of the Pancreas. Surg Clin North Am. 2019;99(4):793–814. [DOI] [PMC free article] [PubMed] [Google Scholar]
- 6.Jiao Y, Shi C, Edil BH, et al. DAXX/ATRX, MEN1, and mTOR pathway genes are frequently altered in pancreatic neuroendocrine tumors. Science. 2011;331(6021):1199–1203. [DOI] [PMC free article] [PubMed] [Google Scholar]
- 7.Mafficini A, Scarpa A. Genomic landscape of pancreatic neuroendocrine tumours: the International Cancer Genome Consortium. J Endocrinol. 2018;236(3):R161–r167. [DOI] [PMC free article] [PubMed] [Google Scholar]
- 8.Reubi JC, Kvols LK, Waser B, et al. Detection of somatostatin receptors in surgical and percutaneous needle biopsy samples of carcinoids and islet cell carcinomas. Cancer Res. 1990;50(18):5969–5977. [PubMed] [Google Scholar]
- 9.Rai U, Thrimawithana TR, Valery C, Young SA. Therapeutic uses of somatostatin and its analogues: Current view and potential applications. Pharmacol Ther. 2015;152:98–110. [DOI] [PubMed] [Google Scholar]
- 10.Susini C, Buscail L. Rationale for the use of somatostatin analogs as antitumor agents. Annals of oncology : official journal of the European Society for Medical Oncology. 2006;17(12):1733–1742. [DOI] [PubMed] [Google Scholar]
- 11.Caplin ME, Pavel M, Ćwikła JB, et al. Lanreotide in Metastatic Enteropancreatic Neuroendocrine Tumors. New England Journal of Medicine. 2014;371(3):224–233. [DOI] [PubMed] [Google Scholar]
- 12.Scott AT, Weitz M, Breheny PJ, et al. Gene Expression Signatures Identify Novel Therapeutics for Metastatic Pancreatic Neuroendocrine Tumors. Clinical Cancer Research. 2020:clincanres.2884.2019. [DOI] [PMC free article] [PubMed] [Google Scholar]
- 13.Evers BM, Townsend CM Jr., Upp JR, et al. Establishment and characterization of a human carcinoid in nude mice and effect of various agents on tumor growth. Gastroenterology. 1991;101(2):303–311. [DOI] [PubMed] [Google Scholar]
- 14.Yu JY, DeRuiter SL, Turner DL. RNA interference by expression of short-interfering RNAs and hairpin RNAs in mammalian cells. Proc Natl Acad Sci U S A. 2002;99(9):6047–6052. [DOI] [PMC free article] [PubMed] [Google Scholar]
- 15.Wang Y, Ozawa A, Zaman S, et al. The tumor suppressor protein menin inhibits AKT activation by regulating its cellular localization. Cancer Res. 2011;71(2):371–382. [DOI] [PMC free article] [PubMed] [Google Scholar]
- 16.Qian ZR, Ter-Minassian M, Chan JA, et al. Prognostic significance of MTOR pathway component expression in neuroendocrine tumors. J Clin Oncol. 2013;31(27):3418–3425. [DOI] [PMC free article] [PubMed] [Google Scholar]
- 17.Mossmann D, Park S, Hall MN. mTOR signalling and cellular metabolism are mutual determinants in cancer. Nature reviews Cancer. 2018;18(12):744–757. [DOI] [PubMed] [Google Scholar]
- 18.Fernandes I, Pacheco TR, Costa A, et al. Prognostic significance of AKT/mTOR signaling in advanced neuroendocrine tumors treated with somatostatin analogs. Onco Targets Ther. 2012;5:409–416. [DOI] [PMC free article] [PubMed] [Google Scholar]
- 19.Saxton RA, Sabatini DM. mTOR Signaling in Growth, Metabolism, and Disease. Cell. 2017;168(6):960–976. [DOI] [PMC free article] [PubMed] [Google Scholar]
- 20.Yao JC, Fazio N, Singh S, et al. Everolimus for the treatment of advanced, non-functional neuroendocrine tumours of the lung or gastrointestinal tract (RADIANT-4): a randomised, placebo-controlled, phase 3 study. The Lancet. 2016;387(10022):968–977. [DOI] [PMC free article] [PubMed] [Google Scholar]
- 21.Hobday TJ, Qin R, Reidy-Lagunes D, et al. Multicenter Phase II Trial of Temsirolimus and Bevacizumab in Pancreatic Neuroendocrine Tumors. Journal of clinical oncology : official journal of the American Society of Clinical Oncology. 2015;33(14):1551–1556. [DOI] [PMC free article] [PubMed] [Google Scholar]
- 22.Bousquet C, Lasfargues C, Chalabi M, et al. Current Scientific Rationale for the Use of Somatostatin Analogs and mTOR Inhibitors in Neuroendocrine Tumor Therapy. The Journal of Clinical Endocrinology & Metabolism. 2012;97(3):727–737. [DOI] [PubMed] [Google Scholar]
- 23.Cerovac V, Monteserin-Garcia J, Rubinfeld H, et al. The Somatostatin Analogue Octreotide Confers Sensitivity to Rapamycin Treatment on Pituitary Tumor Cells. Cancer Res. 2010;70(2):666–674. [DOI] [PubMed] [Google Scholar]
- 24.Villaume K, Blanc M, Gouysse G, et al. VEGF secretion by neuroendocrine tumor cells is inhibited by octreotide and by inhibitors of the PI3K/AKT/mTOR pathway. Neuroendocrinology. 2010;91(3):268–278. [DOI] [PubMed] [Google Scholar]


