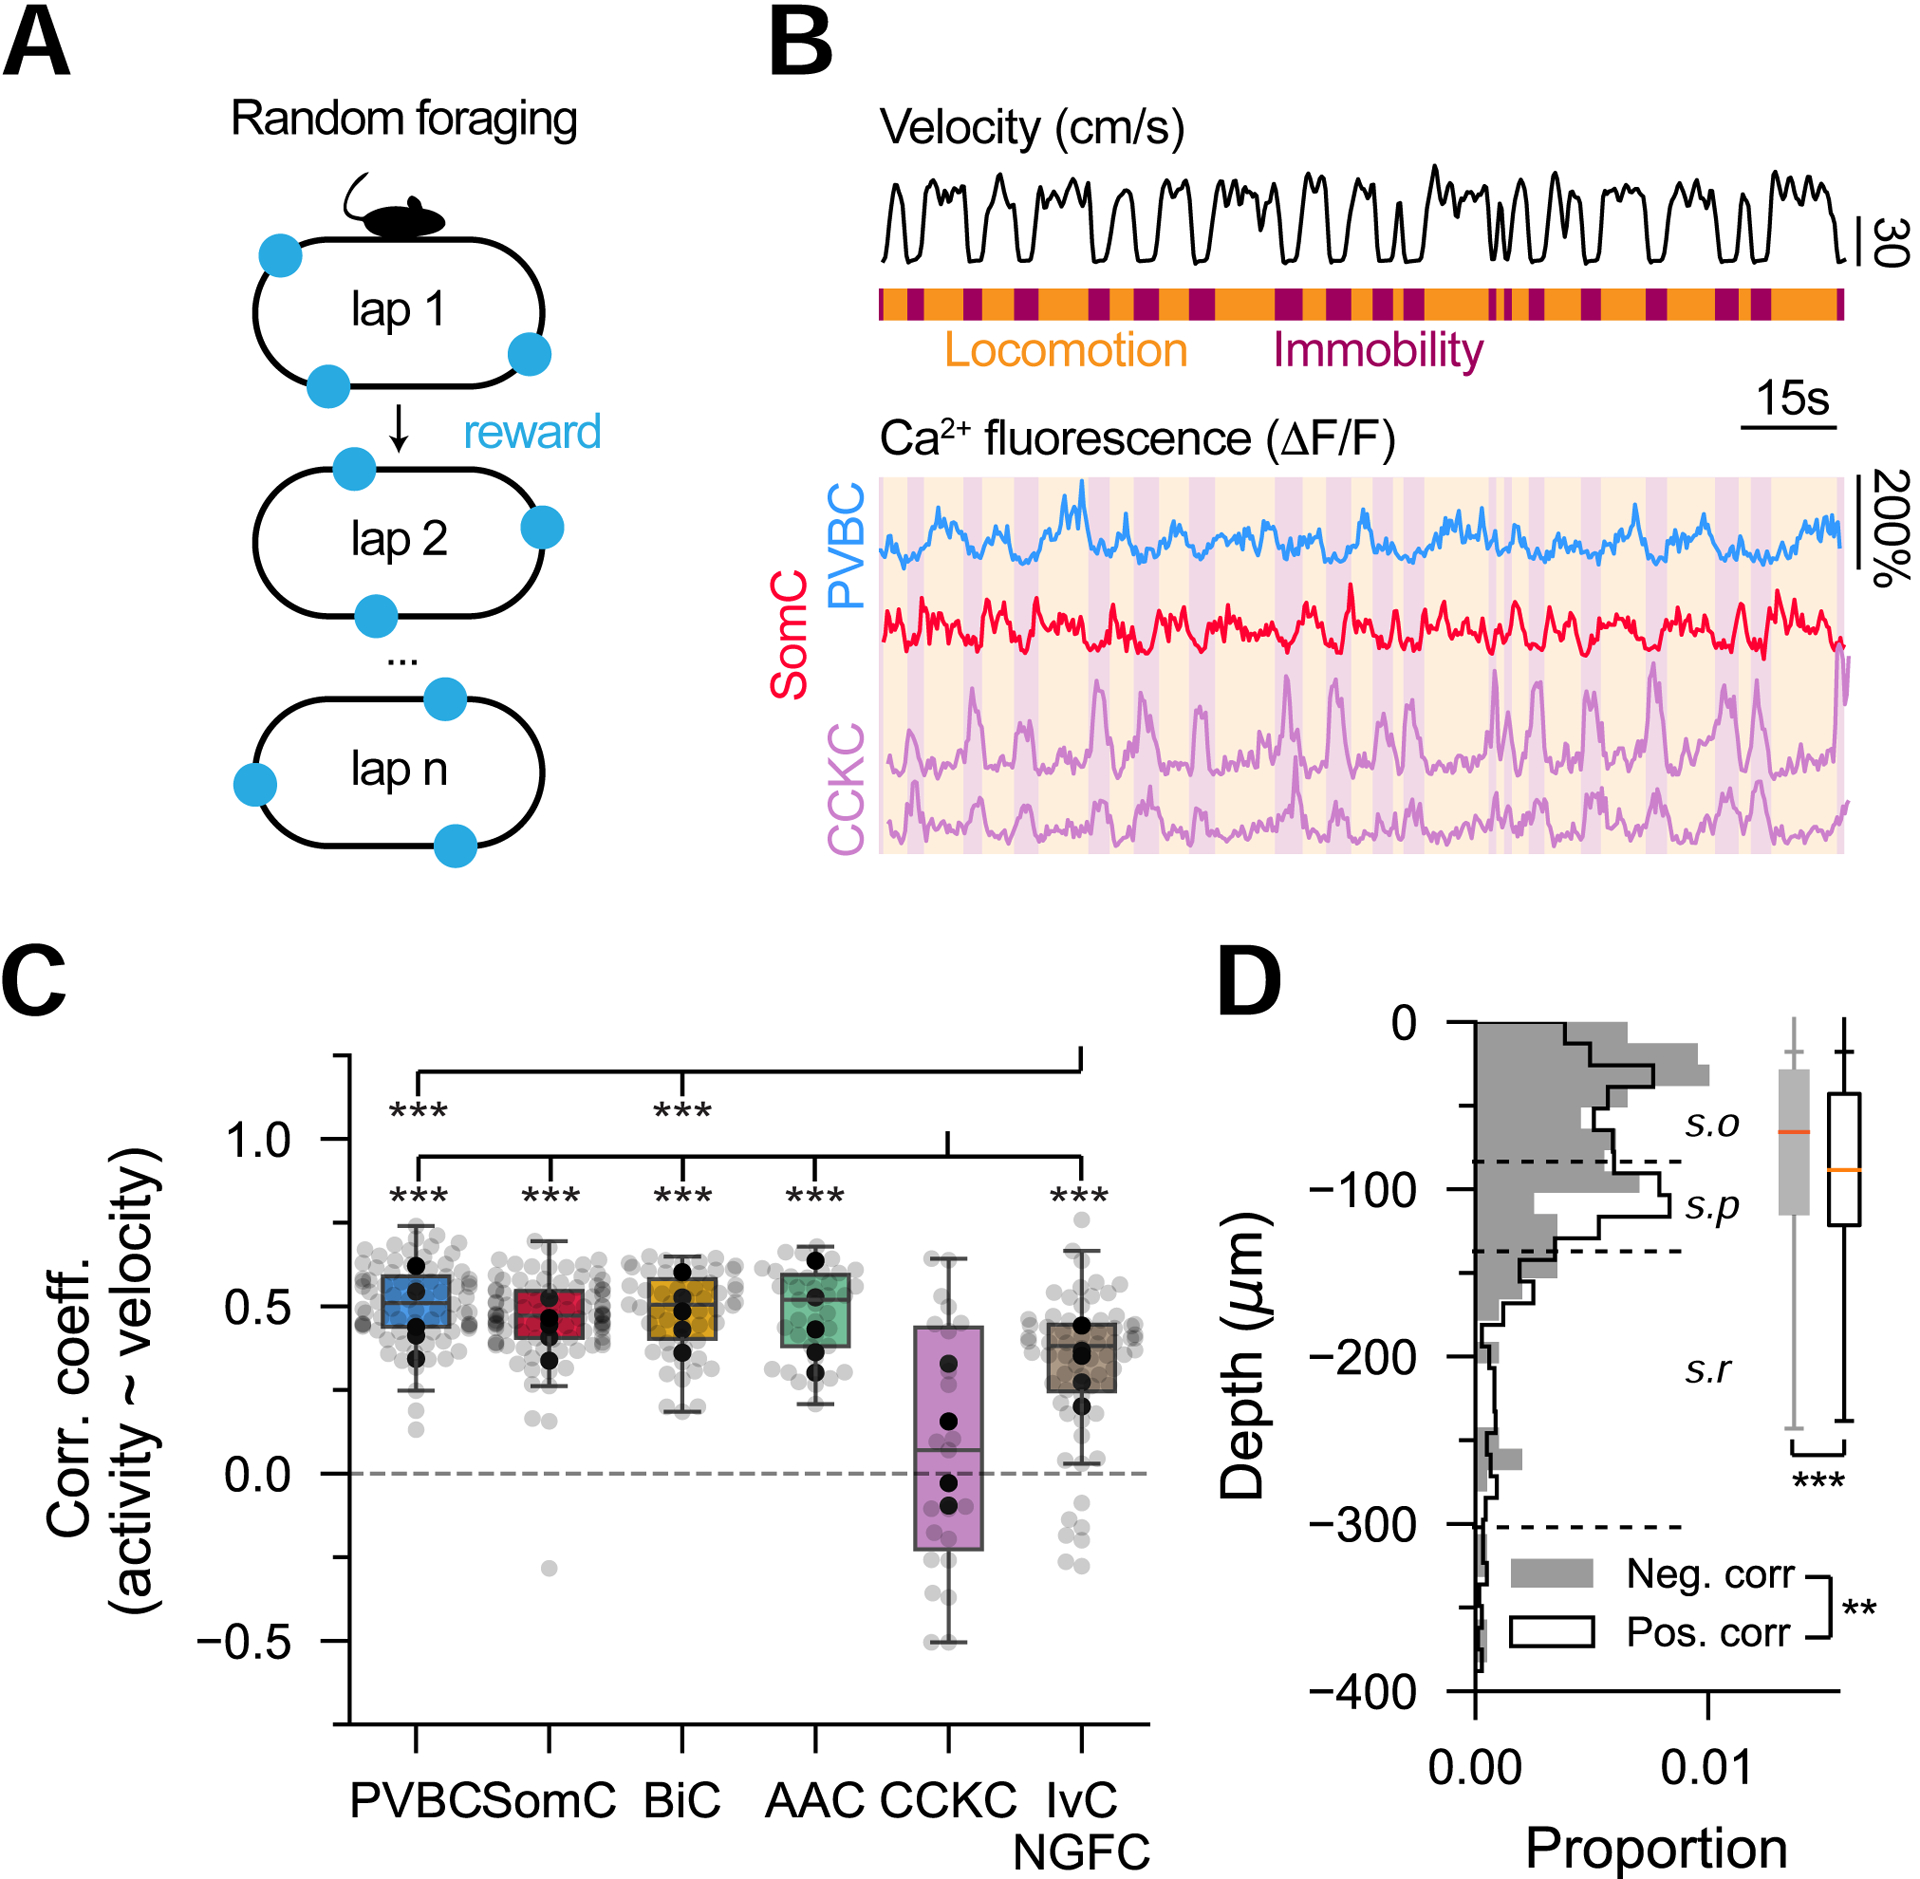
Figure 2 -. Locomotion-state-dependent activity of IN subtypes.

A. Schematic of the random foraging task.
B. Representative ΔF/F traces from PVBC, SomC and CCKC. Locomotion and immobility epochs are overlaid in orange and purple, respectively.
C. Pearson’s correlation coefficients of ΔF/F traces and velocity (n = 134 PVBC, 180 SomC, 75 BiC, 56 AAC, 44 CCKC, 119 IvC/NGFC from n = 7 mice). One-way ANOVA (p < 10−10) with post hoc Tukey’s range test corrected for multiple testing. Mouse averages are indicated by the black dots.
D. Depth distribution of all negatively (filled gray, n = 156) and positively (empty black, n = 1429) correlated cells with velocity, regardless of subtype (n = 7 mice). Negatively correlated cells are more dorsal in stratum oriens than positively correlated cells, which are closer to stratum pyramidale. Two-sample Kolmogorov-Smirnov test on distributions (p = 0.02) and Mann-Whitney U test on populations (p < 0.001).
