Abstract
Lafora disease (LD) is a fatal adolescence-onset neurodegenerative condition. The hallmark of LD is the accumulation of aberrant glycogen aggregates called Lafora bodies (LBs) in the brain and other tissues. Impeding glycogen synthesis from early embryonic stages by genetic suppression of glycogen synthase (MGS) in an animal model of LD prevents LB formation and ultimately the pathological manifestations of LD thereby indicating that LBs are responsible for the pathophysiology of the disease. However, it is not clear whether eliminating glycogen synthesis in an adult animal after LBs have already formed would halt or reverse the progression of LD.
Herein we generated a mouse model of LD with inducible MGS suppression. We evaluated the effect of MGS suppression at different time points on LB accumulation as well as on the appearance of neuroinflammation, a pathologic trait of LD models.
In the skeletal muscle, MGS suppression in adult LD mice blocked the formation of new LBs and reduced the number of glycogen aggregates. In the brain, early but not late MGS suppression halted the accumulation of LBs. However, the neuroinflammatory response was still present, as shown by the levels of reactive astrocytes, microglia and inflammatory cytokines.
Our results confirm that MGS as a promising therapeutic target for LD and highlight the importance of an early diagnosis for effective treatment of the disease.
Keywords: Lafora disease, glycogen, brain aggregates, glycogen synthase, astrogliosis, neuroinflammation
1. Introduction.
Lafora disease (LD; EPM2, OMIM254780) is a fatal adolescence onset epilepsy. It is a recessive inherited disease caused by mutations in either Epm2a, which encodes laforin, a dual phosphatase with a carbohydrate binding domain, or Epm2b, which encodes malin, a ubiquitin E3 ligase (Nitschke et al, 2018; Verhalen et al, 2018). Laforin and malin form a functional complex that regulates glycogen metabolism (Gentry et al, 2005; Vilchez et al, 2007), although their mechanism of action and how their demise contributes to the accumulation of glycogen in LD remain to be elucidated. LD is characterized by the presence of large deposits of poorly branched glycogen known as Lafora bodies (LBs) (Chan et al, 2005; Delgado-Escueta, 2007; Ganesh et al, 2006). Two types of LBs have been identified in the brain, namely those located in the somas of neurons (neuronal LBs, nLBs) and those amassed in astrocytic processes (corpora amylacea-like, CAL) (Auge et al, 2018; Rubio-Villena et al, 2018). LBs accumulate not only in the brain but also in other tissues, such as skeletal muscle and heart (Brewer & Gentry, 2019; Cavanagh, 1999). These deposits mainly comprise aberrant, poorly branched glycogen, although they also contain proteins related to glycogen metabolism that can be used to detect the presence of these aggregates and proteins related to the autophagy machinery (Auge et al, 2018; Criado et al, 2012; Duran et al, 2014; Puri et al, 2011).
In the central nervous system (CNS), glycogen is synthesized by the muscle isoform of glycogen synthase (MGS). We and others have demonstrated that brain LBs underlie the pathophysiology of LD (Duran et al, 2014; Pederson et al, 2013; Turnbull et al, 2011a). In our previous work, we showed that knocking out the MGS gene (Gys1) from the CNS in early embryonic stages in a mouse model of LD (malinKO mice) prevented the formation of LBs and the progression of the disease (Duran et al, 2014). Interestingly, the depletion of only one allele of Gys1 in the malinKO mice was sufficient to ameliorate the phenotype of this LD model. These results identified MGS as a promising therapeutic target for LD. In this regard, efforts are being undertaken by several groups to develop molecular tools that could be used as therapeutic agents to target MGS in the brain, e.g. by blocking its expression by means of antisense oligonucleotides or by reducing its activity using small molecular weight inhibitors (Solmesky et al, 2017; Tang et al, 2020). Given that LD is normally diagnosed after the appearance of clinical symptoms, a targeted therapy will necessarily start at a time at which LB tissue content is already high. However, there is no information about the consequences of targeting MGS expression or activity in adult brains that have already developed LBs. To address this point, we generated a malinKO mouse in which the deletion of MGS can be induced at any time point. Our results demonstrate that in muscle this intervention not only blocks the formation of new LBs, but reduces the number of glycogen aggregates. In the brain, only with an early intervention, it is possible to arrest the amassing of LBs and restore to normal levels proteins that are accumulated in the brains of LD models. However, preexisting brain LBs are not eliminated and MGS suppression is insufficient to prevent the neuroinflammatory response, characteristic of the model.
2. Materials and methods.
Animals.
All procedures were approved by the University of Barcelona Barcelona Science Park’s Animal Experimentation Committee and were carried out following Spanish (BOE 34/11370–421, 2013) and European Union (2010/63/EU) regulations, and The National Institutes of Health guidelines for the care and use of laboratory animals. Mice were maintained in collective cages (up to five animals per cage) on a 12/12 h light/dark cycle under specific pathogen-free conditions in the Animal Research Center at the Barcelona Science Park. Animals were allowed access ad libitum to commercial mouse chow and water. After weaning at 3 weeks of age, tail clippings were taken for genotyping by qPCR (performed by Transnetyx). Experiments were carried out in C57/Bl6 mice at different ages, the youngest at 4 months and the oldest at 11 months. For the generation of malinKO with inducible supression of MGS, we combined our MGS conditional knockout, based on the Cre-lox technology as described (Duran et al, 2014) with CreERT2 Cre transgenic mice (B6.129-Gt(ROSA)26Sortm1(Cre/ERT2)Tyj/J, Jackson mice), which ubiquitously express a tamoxifen-inducible Cre-recombinase. We then combined these mice with malinKO mice (Valles-Ortega et al, 2011). Genotyping of the alleles involved was performed using specific probes designed and applied by TransnetYX®. All experimental protocols were approved by the Barcelona Science Park Animal Experimentation Committee, and were carried out following Spanish (BOE 34/11370–421, 2013) and European Union (2010/63/EU) regulations, and The National Institutes of Health guidelines for the care and use of laboratory animals. Experiments were conducted using littermates and both males and females were included in each group. Where necessary, experimental groups included multiple litters for statistical power.
2.1. Tamoxifen administration.
Tamoxifen solution was prepared fresh each time. To prepare the stock at 20mg/ml, tamoxifen was first dissolved in 100% EtOH, then completed with filtered Sunflower seed oil (Sigma) and left overnight with agitation at 37°C. A total of three doses of 0.225 mg tamoxifen/g of body weight were administered by intraperitoneal injection (IP) in each mouse in alternate days.
2.2. Histology.
Animals were deeply anesthetized with thiobarbital (Braun) and perfused transcardially with 4% paraformaldehyde in phosphate buffer saline (PBS). Brains and skeletal muscles (quadriceps) were removed, postfixed overnight, transversally trimmed, and embedded in paraffin. Paraffin sections (3 μm thick) were cut using a Leica microtome. Periodic acid-Schiff staining (PAS) was performed using an Artisanlink Pro machine (DAKO AR165 kit). For immunofluroescence, the staining protocol was optimized and adapted for the requirements of each antibody. The primary antibodies used were: anti-MGS (3886, Cell signaling); anti-laforin (mouse monoclonal, clon Ab2, gift from Dr. Santiago Rodriguez de Córdoba); anti-GFAP (MAB360, Merck Millipore); and anti-Iba1 (019–19741, Wako-Chem). The secondary antibodies used were: anti-rabbit DyLight 594 (DI-1094, Vector); anti-Rabbit Alexa Fluor 488 (A11034, ThermoFisher); anti-Mouse Alexa Fluor 568 (A11031, Invitrogen); or/and anti-mouse IgG Alexa Fluor 488 (405319, Biolegend), in combination with DAPI (Sigma). The samples were mounted in fluorescence mounting media (Dako). For brightfield labelling the antibody used was anti-CD11b (ab133357, Abcam) and the secondary antibody BrightVision poly HRP-Anti-Rabbit IgG (DPVR-110HRP, ImmunoLogic). Antigen–antibody complexes were reveled with 3–3′-diaminobenzidine (K346811, Agilent). Sections were counterstained with hematoxylin (CS700, Dako, Agilent) and mounted with toluene-free mounting medium (CS705, Agilent). For each case, specificity of staining was confirmed by staining with a mouse IgG1, Kappa (MAB0042 R&D Systems, Biotechne) or a rabbit IgG (ab27478, Abcam) isotype control. For the brain, serial sections containing the CA1-CA2-CA3 and Dentate gyrus (DG) regions of the hippocampus were analyzed. At least 3 sections were analyzed for each sample and staining, the number of mice per experimental group is indicated in each figure. Brightfield and fluorescent images were acquired with a NanoZoomer-2.0 HT C9600 digital scanner (Hamamatsu) equipped with a 20X objective. All images were visualized with a gamma correction set at 1 for fluorescence in the image control panel of the NDP.view 2 U12388–01 software (Hamamatsu, Photonics, France). Brightness was adjusted to improve printing quality to 130% in each color channel and image. The stainings were analyzed by the digital software analysis QuPath (Bankhead et al, 2017). For nLBs detection, particle identification was stablished to 2–200 μm2 background radius and 0.8–1 circularity for nLBs. CAL was defined as the substraction of the number of nLBs from the total of particles detected per region. ¨Cell detection¨ tool was used to detect aggregates, and to detect Iba1-positive cells. Ïntensity features¨ was used to calculate pixel intensity/mm2 of the total hippocampal area (ROI) in each section for GFAP and CD11b stainings.
2.3. Glycogen quantification.
Mice were deeply anesthetized with thiobarbital and decapitated. The brain and quadriceps were quickly removed and immediately frozen in liquid nitrogen. Whole brains and quadriceps were pulverized in liquid nitrogen and stored at −80°C. Frozen brain and muscle aliquots were boiled in 30% KOH for 15 min. Glycogen was precipitated in EtOH 66 % and determined by an amyloglucosidase-based assay, as described previously (Chan & Exton, 1976).
2.4. Western blot.
Homogenates of frozen tissues were obtained using the following buffer: 25 mM Tris-HCl (pH 7.4), 25 mM NaCl, 1% Triton X-100, 0.1% SDS, 0.5 mM EGTA, 10 mM sodium pyrophosphate, 1 mM sodium orthovanadate, 10 mM NaF, 25 nM okadaic acid and a protease inhibitor cocktail tablet (Roche). To obtain the soluble and the insoluble fractions of total homogenates, we followed the protocol previously described (Valles-Ortega et al, 2011). Briefly, total homogenates were centrifuged at 13000g for 15 min at 4°C. The pellet containing the insoluble fraction was recovered in the same volume as the supernatant corresponding to the soluble fraction. Samples were loaded on 10% acrylamide gels for SDS-PAGE and transferred to Immobilon membranes (Millipore). The following primary antibodies were used: anti-GS (rabbit, 3886, Cell Signalling); anti-laforin (mouse, 3.5.5, kindly provided by Dr. Santiago Rodríguez de Córdoba); and anti-p62 (guinea pig, Progen). The following secondary antibodies were used: anti-rabbit and anti-mouse IgG-HRP (GE Healthcare); and anti-guinea pig HRP (Jackson Immuno Research). Proteins were detected by the ECL method (Immobilon Western Chemiluminescent HRP Substrate, Millipore), and loading control of the western blot membrane was performed using the REVERT (LI-COR Bioscience) total protein stain.
2.5. Quantitative (q)PCR.
Total RNA was isolated from frozen brain or quadricep muscle using Trizol reagent (LifeTechnologies, Carlsbad, CA, USA). It was then purified with an RNeasy Mini Kit (Qiagen, Hilden, Germany) and treated with DNase I (Qiagen) to degrade genomic DNA. Reverse transcription was performed using the qScript cDNA Synthesis Kit (Quanta Biosciences, Beverly, MA, USA). qPCR was performed using a Quantstudio 6 Flex (Applied Biosystems, Foster City, CA, USA). The following mouse-specific SYBRgreen set of primers (Sigma, Madrid, Spain) was used:Gys1(forward:CAGAGCAAAGCACGAATCCA,reverse:CATAGCGGCCAGCGATAAAG);beta-2microglobulin(b2M),used as a housekeeping gene(forward: ATGCACGCAGAAAGAAATAGCAA,reverse:AGCTATCTAGGATATTTCCAATTTTTGAA), 18S rRNA housekeeping gene (forward: ATTAAGTCCCTGCCCTTTGTACAC, reverse: TAGATAGTCAAGTTCGACCGTCTTCTC),Il6(forward:TAGTCCTTCCTACCCCAATTTC C,reverse:TTGGTCCTTAGCCACTCCTTC),CD11b(forward:CCTTGTTCTCTTTGATGCAG, reverse: GTGATGACAACTAGGATCTT), Cxcl10 (forward: CCGTCATTTTCTGCCTCATC, reverse:CTCGCAGGGATGATTTCAAG),Arginase1(Arg1)(forward:CAGAAGAATGGAAG AGTCAG, reverse: CAGATATGCAGGGAGTCACC). All the samples were run as triplicates. For representation of the results, relative expression (2−ΔΔCt) was calculated.
Statistics.
Significance between two variables was analyzed using Student’s t-test performed with the GraphPad Prism software (La Jolla, CA, USA). When indicated, Student’s t-test was validated by linear mixed models as follows for internal confirmation. For validation, in cases where the quantifications were ratios of continuous variables that are restricted between zero and one, beta regression models were considered. Otherwise, Gaussian errors were assumed after appropriate transformation. (a) MGS number or particles in Hp and Cx, laforin number of particles in Hp and Cx, CAL and nLBs number in Hp and Cx, GFAP pixel intensity in HP and Iba1 cell number in Hp. Measures were log transformed after adding a base count of 0.5 to avoid zero misspecifications. Normality was assumed after data transformation. Linear mixed effect models were fitted using the R package lmerTest (Kuznetsova et al, 2017) including the group as variable of interest and the biological replicate as random effect. Adjustment for multiple testing (single-step correction method) was performed using the R package multcomp (Hothorn et al, 2008). (b) Hp_CD11b. For each individual, the repeated measurements were averaged out. A Beta regression model, logit link function, was fitted using the R package betareg (Cribari-Neto & Zeileis, 2010). Adjustment for multiple testing (single-step correction method) is performed using the R package multcomp. The following p values were considered to be statistically significant: p value≤0.05(*), p value ≤ 0.01 (**), and p value ≤ 0.001 (***).
3. Results.
3.1. Generation of malinKO mice with inducible deletion of MGS.
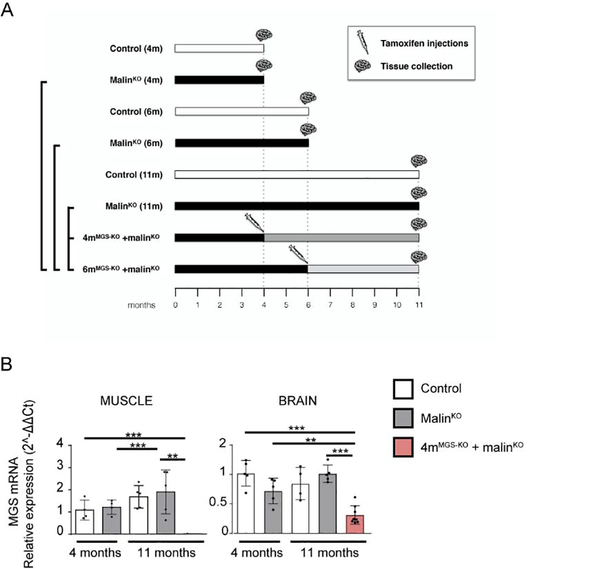
To obtain animals in which MGS deletion can be induced at a certain time point, we combined our conditional MGS knockout, based on the Cre-lox technology (Duran et al, 2013), with UBC-Cre-ERT2 mice, in which a tamoxifen-inducible Cre recombinase is expressed ubiquitously (Ruzankina et al, 2007) thus generating an inducible MGS knockout (MGS-KO). We also obtained heterozygous mice for conditional MGS (MGS-HET), in which only one of the alleles of MGS is conditional and thus can be deleted by Cre recombinase. We then combined MGS-KO and MGS-HET mice with malinKO mice, a model of LD that accumulates LBs and presents astrogliosis and inflammatory response at 11 months (Duran et al, 2014) (see Methods and Fig. 1A). We induced MGS recombination by IP tamoxifen injection at two points of LD progression: 1) at 4 months of age (group named 4mMGS-KO+malinKO), a time point at which a significant number of LBs have already accumulated in the brain and LB-containing fibers could be detected in the muscle; and 2) at 6 months of age (group named 6mMGS-KO+malinKO), an intermediate stage of the disease. The experimental groups analyzed and the group comparisons of interest are indicated in Fig. 1A. Briefly, we focused on the following comparisons: 1) Eleven-month-old 4mMGS-KO+malinKO mice and 6mMGS-KO+malinKO mice compared to malinKO mice of the same age; 2) Eleven-month-old 4mMGS-HET+malinKO mice and 6mMGS-HET+malinKO mice compared to malinKO mice of the same age; 3) Eleven-month-old 4mMGS-KO+malinKO and 6mMGS-KO+malinKO mice compared to 4 or 6 months malinKO, respectively (corresponding to the time point when tamoxifen was administered), to study a possible reversal of LB content.
Figure 1.
Experimental groups, timeline and MGS mRNA expression levels after tamoxifen administration. A. Control and malinKO mice were injected with tamoxifen at either 4 or 6 months of age. Samples were collected at the different time points indicated. B. Quadriceps muscle and brain tissue obtained from 11-month-old wt, malinKO and 4mMGS-KO+malinKO mice-treated with tamoxifen at 4 months of age. Graphics show the MGS mRNA relative expression level (2−ΔΔCt). 18S rRNA was used as housekeeping gene for internal control. Each dot represents one mouse, n: 5–8. Data shown as mean±SD. Statistics: Student’s t-test: *p≤0.05, ** p≤0.005, *** p≤0.001.
Since the expression of Cre is ubiquitous in our conditional mouse colony, we compared the effectiveness of knocking out MGS in the skeletal muscle (quadriceps) and in the brain of 4mMGS-KO+malinKO mice. The efficiency for the Gys1 gene recombination through tamoxifen administration was tissue-dependent with a MGS mRNA suppression of 98% and 70% in skeletal muscle and brain, respectively (Fig. 1B).
3.2. Effects of MGS suppression on LBs in muscle.
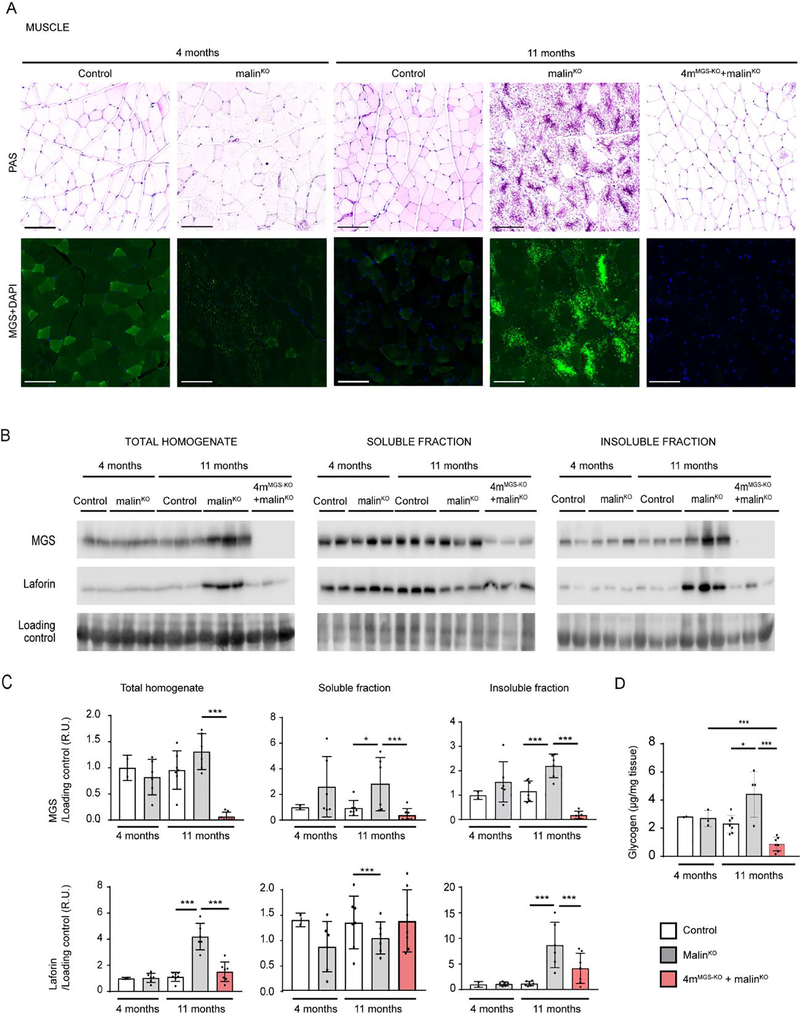
We first studied the effects of MGS deletion on the skeletal muscle of 11-month-old 4mMGS-KO+malinKO mice. The presence of LBs was visualized by Periodic acid-Schiff (PAS) staining, which specifically stains carbohydrates, and by immunofluorescence using anti-MGS antibody. MGS and other proteins of glycogen metabolism are strongly attached to LBs and can thus be used as LB markers. In malinKO animals, the skeletal muscle progressively accumulates LBs in specific fibers (Turnbull et al, 2011b). 4-month-old malinKO already showed fibers containing PAS-positive aggregates that were smaller and less abundant than those present in 11-month-old animals (Fig. 2A). These aggregates were also detected by MGS immunofluorescence. Neither PAS- nor MGS-positive aggregates were detected in control mice. Interestingly, the number of LBs was dramatically reduced in 11-month-old 4mMGS-KO+malinKO mice (Fig. 2A).
Figure 2.
MGS suppression in skeletal muscle. A. PAS staining. Representative images of quadriceps muscle stained with PAS (upper panels) and MGS (green) with DAPI (blue) (lower panels) for each experimental mouse group. Scale bar: 100 μm. B. MGS and laforin protein detection by western blot from total homogenates and soluble and insoluble fractions. Two representative samples for 4-month-old control mice and three representative samples for the other groups are shown in each western blot. Loading control: LICOR- revert staining. C. Quantifications of protein detected by western blot. Relative optical density (OD) units were related to loading control and normalized to the 4-month-old control group. D. Total glycogen measurement. Total amount of glycogen was determined in quadriceps muscles from animals in each experimental group (μg/mg tissue). In all the graphics each dot represents one mouse. Data are shown as mean±SD. n=2–7 mice per group as indicated. Statistics: Student’s t-test. *p≤0.05, ** p≤0.005, *** p≤0.001.
To further assess the effects of depleting MGS expression, we measured the levels of proteins known to be attached to LBs and increased in malinKO mice, namely MGS and laforin (DePaoli-Roach et al, 2010; Duran et al, 2014; Tagliabracci et al, 2008) in total homogenates and in the soluble and insoluble fractions, the latter being the one that contains LB-associated proteins. Western blot analyses of muscle homogenates of 4mMGS-KO+malinKO mice confirmed the absence of MGS protein, from both the soluble and the insoluble fractions, (Fig. 2B, 2C), thereby indicating that degradation of the LB-bound (insoluble) MGS had also taken place. Laforin was greatly increased in the insoluble fraction of aged malinKO mice. Interestingly, MGS suppression in 4mMGS-KO+malinKO mice prevented the accumulation of laforin in the insoluble fraction (Fig. 2B, 2C).
Next, we measured total glycogen concentration, which includes both normal and aggregated glycogen. As expected, at 11 months, the total glycogen levels of muscle in malinKO animals were significantly elevated compared to age-matched control mice. 4mMGS-KO+malinKO mice presented a decrease in muscle glycogen below the levels found at 4-month-old malinKO mice (Fig. 2D).
Taken together, these results show that suppression of MGS expression in the skeletal muscle of LD mice blocked the formation of new LBs and led to a reduction in the number of glycogen aggregates.
3.3. Effects of MGS suppression on LBs in brain.
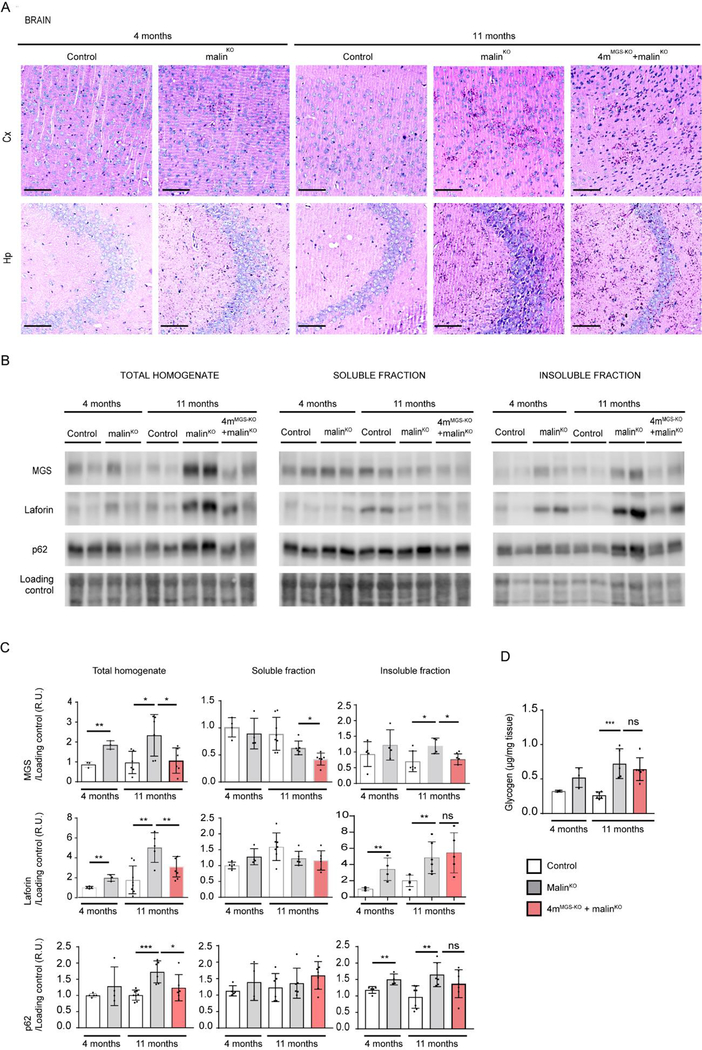
The impact of MGS suppression on the brain of 11-month-old 4mMGS-KO+malinKO mice was first analyzed by PAS staining. LBs were distributed throughout the brain parenchyma, being highly abundant in the cortex and hippocampus (Criado et al, 2012; Duran et al, 2014; Machado-Salas et al, 2012). After MGS suppression, PAS-positive aggregates were still detectable in these two brain structures in 4mMGS-KO+malinKO mice, although they were significantly less abundant than in age-matched malinKO counterparts (Fig. 3A).
Figure 3.
MGS suppression in the brain. A. PAS staining. Representative images from prefrontal cortical region, Cx (upper panels) and hippocampal region, Hp (lower panels) from brains of each experimental group. Scale bar: 100μm. B. MGS, laforin and p62 protein content in brain. Two representative samples of total homogenates, and soluble and insoluble fractions for each group is shown. Loading control: LICOR- revert staining. n=3–6 mice per group. C. Quantifications of protein detected by western blot. Relative optical density (OD) units were related to loading control and normalized to the 4-month-old control group. D. Total amount of glycogen was determined in brain from animals in each experimental group (μg/mg tissue): 4 and 11-month-old control mice, 4 and 11-month-old malinKO mice and 4mMGS-KO+malinKO mice.Statistics: Student’s t-test. *p≤0.05, ** p≤0.005, *** p≤0.001. In all the graphics each dot represents one mouse, n=3–6 mice per group as indicated. Data are shown as mean±SD. Statistics: Student’s t-test. *p≤0.05, ** p≤0.005, *** p≤0.001.
We next measured MGS protein levels in total homogenates and in the soluble and insoluble fractions. In 4mMGS-KO+malinKO mice, the levels of MGS were reduced with respect to age-matched malinKO mice in both total homogenates and the insoluble fractions. The MGS suppression also prevented the accumulation of laforin, which is characteristic of the aged malinKO mice (Fig. 3B, 3C).
As LD progresses, components of the autophagic machinery, such as p62, colocalize with LBs (Auge et al, 2018; Chambers et al, 2018; Duran et al, 2014; Puri et al, 2011), which suggests that this machinery is unable to complete degradation through autophagosome formation (Sánchez-Martín et al, 2015). Increased levels of p62 were found in total homogenates and insoluble fractions of malinKO brains, as previously reported (Duran et al, 2014). In contrast, the levels of p62 in 4mMGS-KO+malinKO brain homogenates were similar to those of control animals in all fractions, again indicating that the build-up of LBs was reduced compared to malinKO mice (Fig. 3B, 3C).
We next measured total glycogen levels and observed a 2.7-fold increase in the malinKO brain at 11 months compared to age-matched control animals (Fig. 3D). These levels remained elevated in 4mMGS-KO+malinKO mice. These results indicated that MGS suppression in brain achieved only a partial arrest of glycogen and LBs accumulation, and revealed the need for further analysis using quantitative biochemical and imaging methods.
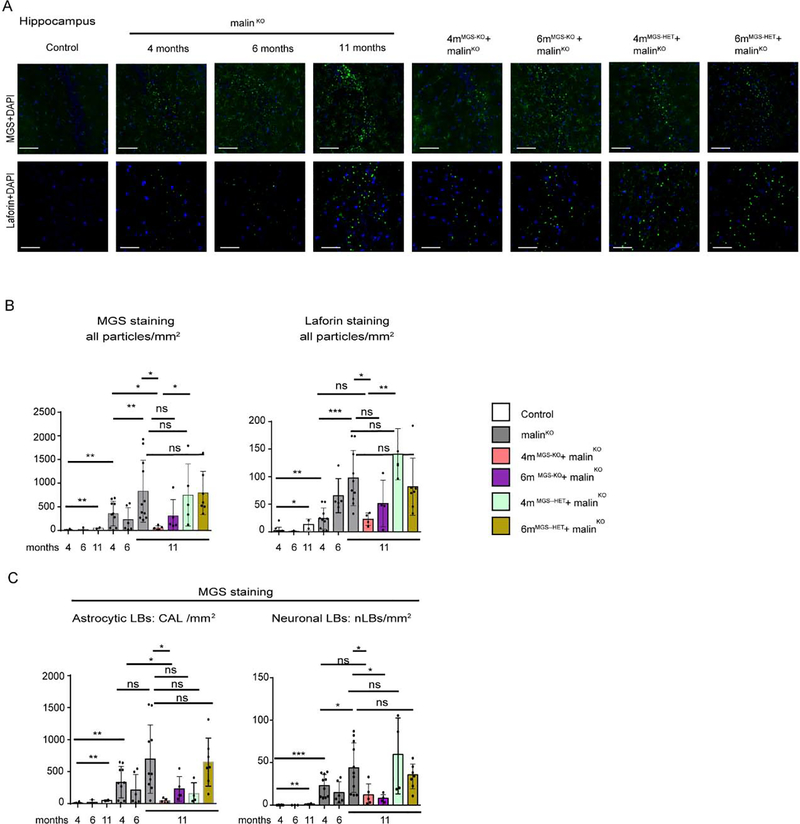
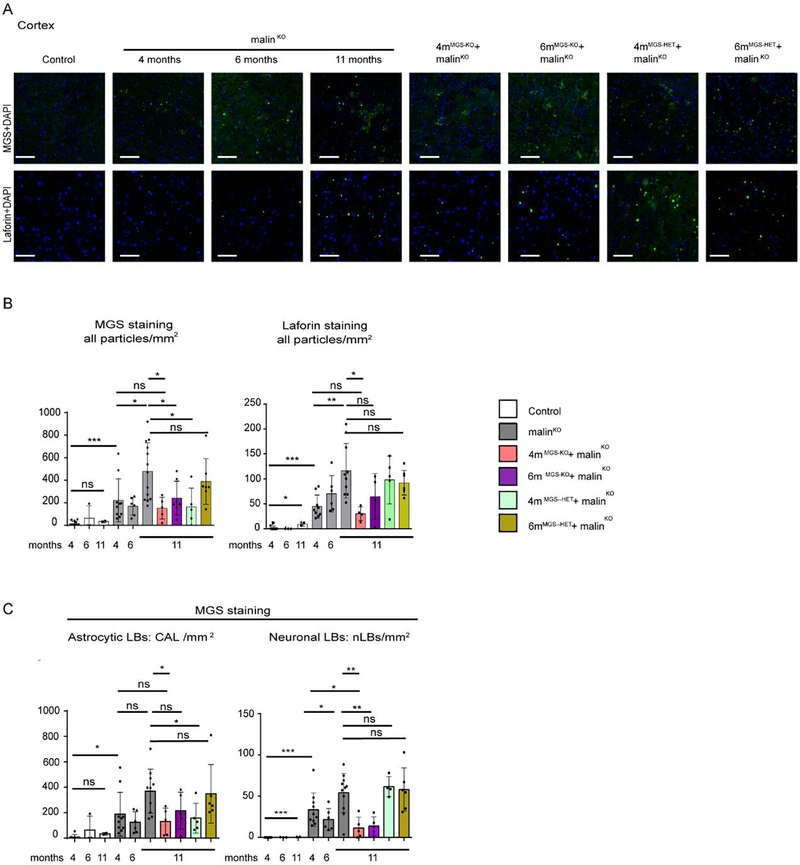
To further determine the scope of the MGS suppression approach in the brain, we used immunofluorescence to analyze two regions of the brain, namely the hippocampus (Fig 4) and cortex (Fig 5). The total number of LBs in these two regions of the brain at each time point was determined by anti-MGS antibody staining and anti-laforin antibody staining (Fig. 4B, C). Laforin was particularly abundant in nLBs (Fig. 4B) and both MGS and laforin staining showed a progressive accumulation in 4-, 6- and 11-month-old malinKO mice (Fig. 4A, 4B, 5A, 5B). Importantly, LB accumulation was arrested at the time point of MGS suppression (4-months) in both the hippocampus (Fig 4B, 4C) and the cortex (Fig. 5B, 5C) in 4mMGS-KO+malinKO, since the levels of the two LB markers were comparable to those of 4-month-old malinKO mice (Fig 4B, 4C) and clearly lower than in 11-months-old malinKO mice.
Figure 4.
LB quantification in the hippocampal region. A. LB visualization in the hippocampus by immunofluorescence. Representative images of the CA2/CA3 region of the hippocampus (Hp) stained with anti-MGS (green, upper panels) and anti-laforin (green, lower panels) antibodies in combination with DAPI (blue) from each group. Scale bar: 100μm. B. Total number of particles detected in the whole Hp area from each brain by anti-MGS and anti-laforin antibodies staining. Mean values between experiments are represented, a total of 3–4 non-consecutive sections were measured per brain for MGS staining and 4–6 non-consecutive sections for laforin staining. Data is expressed as number of particles per mm2, shown as mean±SD. C. Quantification of CAL and nLBs in the hippocampus by MGS staining. Data are expressed as number of particles per mm2, shown as mean±SD. 3–4 sections were analyzed in each brain sample from n= 2–9 mice per group as indicated. In all the graphics, each dot represents one mouse. Student’s t-test test validated by a linear mixed effect model analysis: *p≤0.05, ** p≤0.005, *** p≤0.001.
Figure 5.
LB quantification in the cortical prefrontal region. A. Cortical LB visualization by immunofluorescence. Representative images of the prefrontal cortex region (Cx) stained with anti-MGS (green, upper panels) and anti-laforin (green, lower panels) antibodies in combination with DAPI (blue) from each group. Scale bar: 100μm. B. Total number of particles detected in Cx from each brain by anti-MGS and anti-laforin antibodies stainings. Mean values between experiments are represented, a total of 3–4 non-consecutive sections were measured per brain for MGS and 4–6 non-consecutive sections for laforin. Each dot represents one mouse. Data are expressed as number of particles per mm2. C. Quantification of CAL and nLBs in the prefrontal cortex by MGS staining. Mean values between experiments are represented 3–4 sections were analyzed in each brain n=2–10 mice per group as indicated. Data are expressed as number of particles per mm2, shown as mean±SD. In all the graphics, each dot represents one mouse. Statistics: Student’s t-test test validated by by a linear mixed effect model analysis: *p≤0.05, ** p≤0.005, *** p≤0.001.
As 4mMGS-KO+malinKO mice showed a clear arrest of LB accumulation, we checked the impact of a later intervention, i.e. after 6 months of LD progression (6mMGS-KO+malinKO). In this condition, no differences in LB accumulation were found with respect to 11-month-old malinKO mice in the hippocampus or in the cortex (Fig. 5A, 5B).
We next studied 4mMGS-HET+malinKO and 6mMGS-HET+malinKO brain samples, in which only one of the MGS alleles is conditional and is thus deleted after tamoxifen administration, generating heterozygous animals that have a lower expression of MGS than their homozygous counterparts (Duran et al, 2014). In these mice, the LB content was comparable to that of age-matched malinKO mice (Fig. 4B). Therefore, knocking out only one allele of MGS was not enough to arrest LB accumulation.
We next quantified LB subtypes, namely CAL and nLBs, independently by means of a digital analysis based on aggregate size and morphological parameters (see Methods section). As reflected in the quantifications, 4mMGS-KO+malinKO mice showed an arrest in the formation of both CAL and nLBs in the hippocampus (Fig 4C) and in the cortex (Fig 5C), indicating that the arrest of the accumulation of LBs occurred both in neurons and astrocytes.
3.4. Impact of MGS suppression on neuroinflammation.
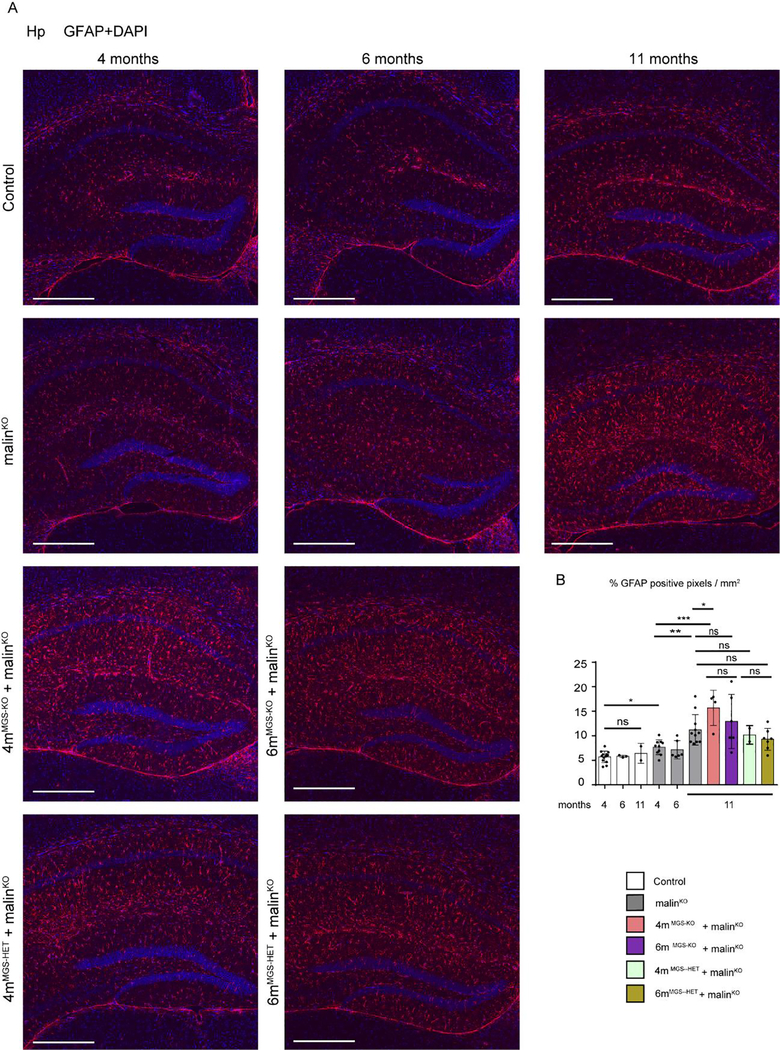
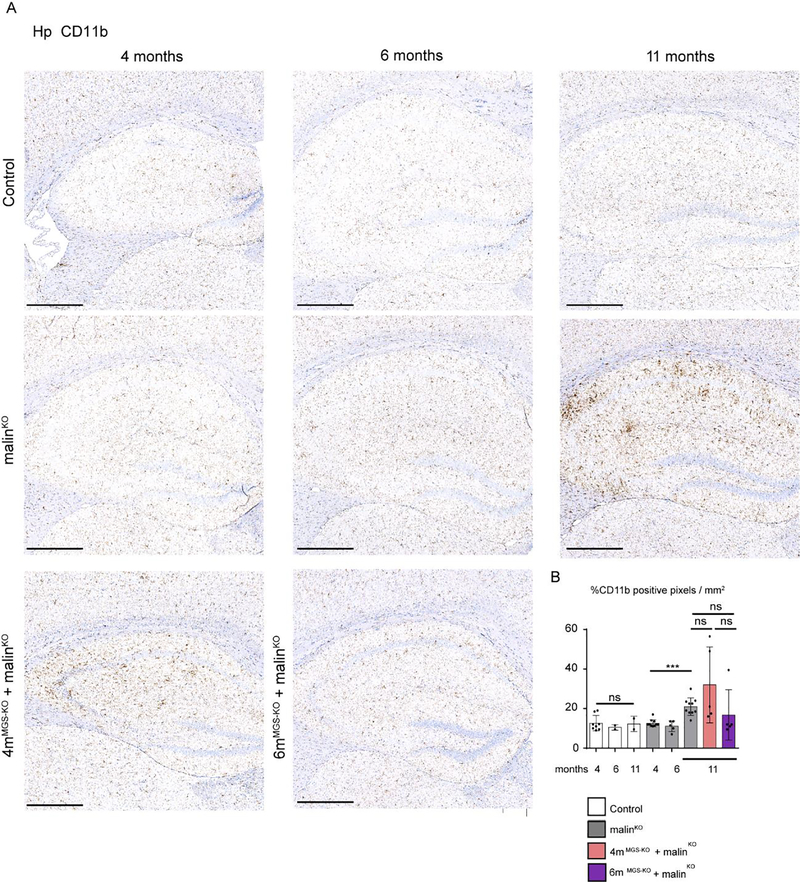
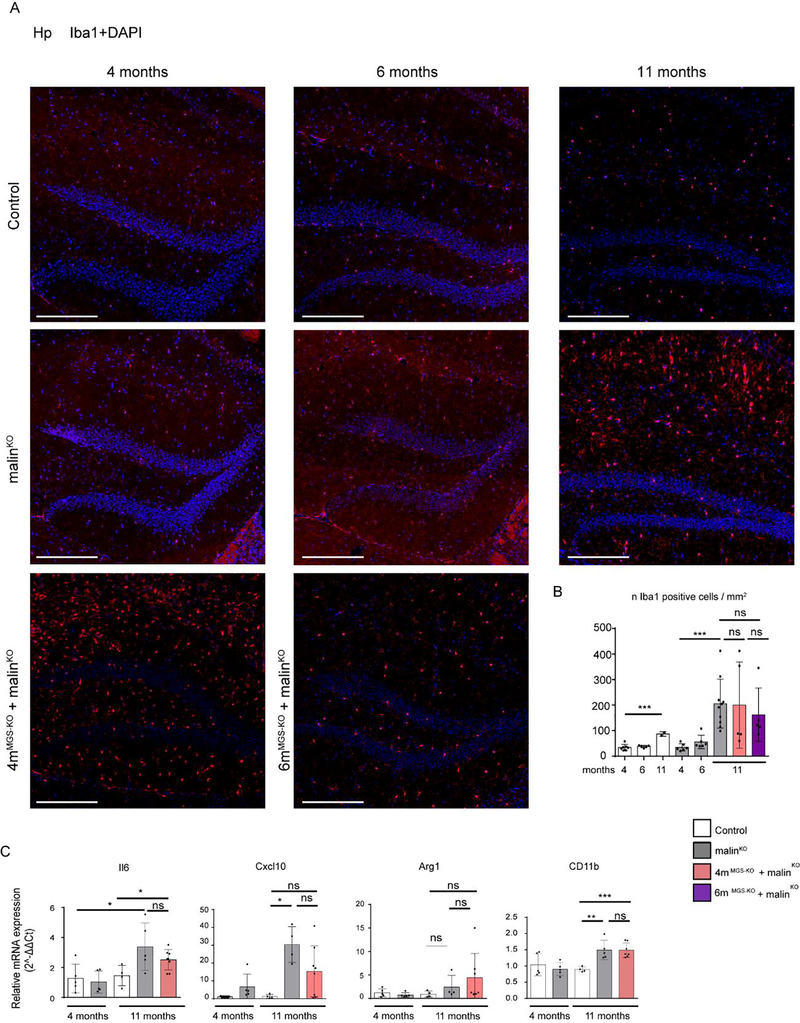
Neuroinflammation is one of the most important traits in the pathophysiology of LD (Lahuerta et al, 2020). To assess its extent, we quantified the presence of reactive astrocytes by immunohistochemistry with antibodies against GFAP (Fig 6), and the activation of microglia through immunostaining with anti-Iba1 (Fig 7) and anti-CD11b (Fig 8) in the hippocampus of the different groups. A small increase in the number of astrocytes was detected in 4-month-old malinKO brains, but reactive astrocytes were markedly increased in the hippocampus of 11-month-old malinKO mice confirming previous results (Duran et al, 2014) (Fig. 6). However, we did not observe a significant reduction in GFAP-positive astrocytes in the hippocampus of 4mMGS-KO+malinKO or 6mMGS-KO+malinKO mice compared to age-matched malinKO mice. Similarly, both Iba1-(Fig. 7) and CD11b-positive microglia (Fig. 8) were increased in 11-month-old malinKO mice and were statistically indistinguishable from age-matched 4mMGS-KO+malinKO animals.
Figure 6.
Astrogliosis in hippocampus by GFAP immunofluorescence. A. Representative images of the Hp regions of each experimental group stained with anti-GFAP antibody (red) and DAPI (blue). Scale bar: 500μm. B. Quantification of GFAP inmunostaining. The percentage of positive pixel for GFAP staining was quantified and represented as % positive pixel/mm2. Mean values between experiments are shown from 3 non-consecutive sections for each sample. Each dot represents one animal, n= 5–10. Data shown as mean±SD. Statistics: Student’s t-test validated by a linear mixed effect model analysis: *p≤0.05, ** p≤0.005, *** p≤0.001.
Figure 7.
Microgliosis in hippocampus by CD11b immunohistochemistry. A. Representative images of the Hp regions of each experimental group stained with anti-CD11b. Scale bar: 500 μm. B. Quantification of hippocampal microgliosis with CD11b staining. The percentage of CD11b positive pixels per area was quantified and represented as n of CD11b positive cells/mm2. Mean values and SD from serial analysis is shown. Data from 2–3 non-consecutive brain sections. Each dot represents one mice. Scale bar: 500 μm. Statistics: Student’s t-test test validated by a linear mixed effect model analysis: *p≤0.05, ** p≤0.005, *** p≤0.001.
Figure 8.
Microgliosis in hippocampus by Iba1 inmunofluorescence and total brain qPCR analysis of inflammatory markers. A. Representative images of the dentate gyrus of Hp regions of each experimental group stained with anti-Iba1 antibody. Scale bar: 250μm. B. Iba1- positive cells were quantified by cell detection and represented as n cells /mm2. Mean values and SD from serial analysis are shown. Data from 2–4 non-consecutive brain sections and.n=2–8 mice as indicated. Statistics: Student’s t-test test validated by a linear mixed effect model analysis: *p≤0.05, ** p≤0.005, *** p≤0.001. C. RNA from total brain homogenate was obtained to analyze the expression of inflammatory genes by qPCR: IL6, CxCl10, Arg1and CD11b. Graphics show the relative expression levels (2-ΔΔCt). The b2M gene was used as housekeeping gene. Each dot represents one mice, n= 4–8 mice as indicated. Data shown as mean±SD. Statistics: Student’s t-test. *p≤0.05, ** p≤0.005, *** p≤0.001.
An inflammatory response in the brain can be evaluated as well by measuring the expression of interleukins or chemokines, namely Il6 and Cxcl10, that are normally absent in control mice but are increased in LD (Lahuerta et al, 2020; López-González et al, 2017). We also analyzed the expression of Arginase-1 (Arg-1) the expression of which is associated with a neuroprotective role of microglia (Cheon et al, 2017; Sica et al, 2015; Tugal et al, 2013) and CD11b for microglial population. Il6, Cxcl10 and C11b expression was increased in 11-month-old malinKO brains compared to age-matched controls, but expression in 4mMGS-KO+malinKO brains was statistically indistinguishable from malinKO brains (Fig 8C). No differences in Arg-1 expression were found among the groups (Fig. 8C). Taken together, these results indicate that an inflammatory response persists in the brain of 11-month-old 4mMGS-KO+malinKO mice despite the arrest of LB accumulation.
4. Discussion.
The demonstration that LB accumulation underlies the pathophysiology of LD identified MGS as a druggable target for the treatment of the disease. However, the question remained as to whether this therapeutic approach would be effective once LBs have accumulated. Here we demonstrate that it is possible to arrest the progressive accumulation of LBs in skeletal muscle and brain by suppressing MGS expression after the onset of the disease in adult malinKO mice, although there are important differences between the two tissues.
In skeletal muscle, we found a reduction in the number of LBs as revealed by PAS, the prevention of insoluble laforin accumulation, and a decrease in soluble and insoluble glycogen levels. On the basis of these results, we hypothesize that once glycogen synthesis was arrested in muscle, not only the formation of new LBs was prevented, but that some of the preexisting LBs were degraded. This LB clearance would occur through a yet unknown malin/laforin-independent mechanism.
In the brain, the accumulation of LBs was arrested upon MGS suppression at 4 months, and by the time the mice reached 11 months of age, the number of LBs, and the laforin and p62 protein content were similar to those seen at 4 months of age. However, both laforin and p62 remained detectable in the insoluble fraction, and total glycogen levels remained elevated compared to control mice. On the basis of these results, we conclude that MGS suppression in the brain arrested the accumulation of new LBs of both types, CAL and nLBs, but did not facilitate the clearance of preexisting LBs. Our results also show that suppressing MGS at 6 months of age is far less effective that at 4 months. This remarks the importance of an early intervention for a successful treatment of the disease. Furthermore, as shown by the results obtained in 4mMGS-HET+malinKO and 6mMGS-HET+malinKO mice, knocking out only one MGS allele is not effective, indicating that a thorough reduction of MGS expression is required to block the progression of the accumulation of LBs in the adult brain. Several factors might contribute to the differences found between muscle and brain. First, the efficiency of Gys1 recombination after tamoxifen induction differs between the two tissues, being complete in skeletal muscle but partial in the brain. Second, the relative number of LBs in both tissues in 4-month-old mice differs, being much more abundant in the brain. Third, there are tissue-associated differences in LB characteristics such as size, morphology and cellular distribution, which might determine their availability for degradation after MGS suppression. Further work is needed to elucidate the presence of distinct LB degradation mechanisms across tissues and also within the LB types present in the brain (CAL and nLBs).
In the 4mMGS-KO+malinKO brain, although LB accumulation was arrested by MGS suppression and LB-associated proteins were maintained at levels that correspond to those of 4-month-old malinKO mice, we did not observe an amelioration on the neuroinflammatory response. Although these observations might be limited by the partial efficiency of MGS suppression in the brain, they underlay importance of the time point at which MGS is suppressed. In our malinKO mice, the progression of LD from 0 to 6 months was slow but accelerated from 6 to 11 months, a period in which neuroinflammation became evident with the specific markers used against reactive astrocytes and microglia. However, it has been recently described that inflammation can be detected as early as at 3 months (Lahuerta et al, 2020; López-González et al, 2017). Thus, neuroinflammation could already be irreversible in 4-month-old malinKO mice. In this context, early intervention becomes essential to optimize the effects of MGS suppression. In this regard, the precise time at which the first LBs appear in patients and in experimental models of LD remains unknown. In patients, LB formation is expected to start before the first clinical manifestations, frequently seen during infancy and adolescence. In mice, laforin accumulation can be detected at 3-month-old malinKO mice and LBs at 3 months (Criado et al, 2012; Machado-Salas et al, 2012), thereby opening up the possibility for even earlier appearance of these aggregates.
5. Conclusions.
Our findings show that MGS suppression early after the onset of LD arrests the accumulation of LBs in the brain, greatly reduces LB and glycogen content in muscle, and reverts alterations of LB-associated proteins in brain and muscle. However, MGS suppression in the adult brain is insufficient to prevent the appearance of neuroinflammation at the time points tested. Thus, the arrest of LB accumulation by MGS suppression might contribute to ameliorate the progression of LD only when this approach is applied at early stages of the disease. Furthermore, our findings confirm the relevance of the development of molecular tools targeting MGS to efficiently modify the progression of LD, but that in order to be effective they should block a high percentage of the MGS expression or activity and the treatment should be implemented as early as possible. Consequently, it is crucial to achieve an early genetic diagnosis in LD patients, including asymptomatic siblings in order to initiate any potential LD treatment at a stage with the lowest possible accumulation of LBs in the brain.
Highlights.
Only an early suppression of glycogen synthase arrests the accumulation of Lafora bodies in the brain of Lafora disease model.
Early suppression of glycogen synthase greatly reduces Lafora bodies in muscle of Lafora disease model.
Glycogen synthase suppression at the time points tested is insufficient to prevent the appearance of neuroinflammation.
An early genetic diagnosis of Lafora disease is crucial for the efficiency of glycogen synthase-based therapeutic approaches.
Acknowledgments.
We wish to thank Anna Adrover, Emma Veza, Vanessa Hernandez and Laura I. Alcaide for technical assistance, Tanya Yates for correcting the English manuscript and the members of the Histopathology, Mouse Mutant, Advanced Digital Microscopy and Biostatistics facilities at IRB Barcelona for their assistance and Kathryn Brewer for helpful discussions.
Funding.
IRB Barcelona is the recipient of a Severo Ochoa Award of Excellence from MINECO (Government of Spain). This work was supported by a grant from MINECO (BFU2017-84345-P) to JD and JJG, the CIBER de Diabetes y Enfermedades Metabólicas Asociadas (ISCIII, Ministerio de Ciencia e Innovación) and a grant from the National Institutes of Health (NIH-NINDS) (P01 NS097197) to JJG. None of the supporting agencies had any role in establishing the work or in writing the manuscript.
Footnotes
Declarations of Competing Interest.
None.
Declaration of interests
The authors declare that they have no known competing financial interests or personal relationships that could have appeared to influence the work reported in this paper.
Publisher's Disclaimer: This is a PDF file of an unedited manuscript that has been accepted for publication. As a service to our customers we are providing this early version of the manuscript. The manuscript will undergo copyediting, typesetting, and review of the resulting proof before it is published in its final form. Please note that during the production process errors may be discovered which could affect the content, and all legal disclaimers that apply to the journal pertain.
References.
- Auge E, Pelegri C, Manich G, Cabezon I, Guinovart JJ, Duran J, Vilaplana J (2018) Astrocytes and neurons produce distinct types of polyglucosan bodies in Lafora disease. Glia 66: 2094–2107 [DOI] [PMC free article] [PubMed] [Google Scholar]
- Bankhead P, Loughrey MB, Fernández JA, Dombrowski Y, McArt DG, Dunne PD, McQuaid S, Gray RT, Murray LJ, Coleman HG, James JA, Salto-Tellez M, Hamilton PW (2017) QuPath: Open source software for digital pathology image analysis. Sci Rep 7: 017–17204 [DOI] [PMC free article] [PubMed] [Google Scholar]
- Brewer MK, Gentry MS (2019) Brain Glycogen Structure and Its Associated Proteins: Past, Present and Future. Adv Neurobiol 23: 17–81 [DOI] [PMC free article] [PubMed] [Google Scholar]
- Cavanagh JB (1999) Corpora-amylacea and the family of polyglucosan diseases. Brain Res Brain Res Rev 29: 265–295 [DOI] [PubMed] [Google Scholar]
- Criado O, Aguado C, Gayarre J, Duran-Trio L, Garcia-Cabrero AM, Vernia S, San Millan B, Heredia M, Roma-Mateo C, Mouron S, Juana-Lopez L, Dominguez M, Navarro C, Serratosa JM, Sanchez M, Sanz P, Bovolenta P, Knecht E, Rodriguez de Cordoba S (2012) Lafora bodies and neurological defects in malin-deficient mice correlate with impaired autophagy. Human molecular genetics 21: 1521–1533 [DOI] [PubMed] [Google Scholar]
- Cribari-Neto F, Zeileis A (2010) Beta Regression in R. Journal of Statistical Software; Vol 1, Issue 2 (2010) [Google Scholar]
- Chambers JK, Thongtharb A, Shiga T, Azakami D, Saito M, Sato M, Morozumi M, Nakayama H, Uchida K (2018) Accumulation of Laforin and Other Related Proteins in Canine Lafora Disease With EPM2B Repeat Expansion. Veterinary Pathology 55: 543–551 [DOI] [PubMed] [Google Scholar]
- Chan EM, Andrade DM, Franceschetti S, Minassian B (2005) Progressive myoclonus epilepsies: EPM1, EPM2A, EPM2B. Adv Neurol 95: 47–57 [PubMed] [Google Scholar]
- Chan TM, Exton JH (1976) A rapid method for the determination of glycogen content and radioactivity in small quantities of tissue or isolated hepatocytes. Anal Biochem 71: 96–105 [DOI] [PubMed] [Google Scholar]
- Cheon SY, Kim EJ, Kim JM, Kam EH, Ko BW, Koo BN (2017) Regulation of Microglia and Macrophage Polarization via Apoptosis Signal-Regulating Kinase 1 Silencing after Ischemic/Hypoxic Injury. Front Mol Neurosci 10 [DOI] [PMC free article] [PubMed] [Google Scholar]
- Delgado-Escueta AV (2007) Advances in lafora progressive myoclonus epilepsy. Curr Neurol Neurosci Rep 7: 428–433 [DOI] [PubMed] [Google Scholar]
- DePaoli-Roach AA, Tagliabracci VS, Segvich DM, Meyer CM, Irimia JM, Roach PJ (2010) Genetic depletion of the malin E3 ubiquitin ligase in mice leads to lafora bodies and the accumulation of insoluble laforin. J Biol Chem 285: 25372–25381 [DOI] [PMC free article] [PubMed] [Google Scholar]
- Duran J, Gruart A, Garcia-Rocha M, Delgado-Garcia JM, Guinovart JJ (2014) Glycogen accumulation underlies neurodegeneration and autophagy impairment in Lafora disease. Human molecular genetics 23: 3147–3156 [DOI] [PubMed] [Google Scholar]
- Duran J, Saez I, Gruart A, Guinovart JJ, Delgado-García JM (2013) Impairment in long-term memory formation and learning-dependent synaptic plasticity in mice lacking glycogen synthase in the brain. Journal of cerebral blood flow and metabolism : official journal of the International Society of Cerebral Blood Flow and Metabolism 33: 550–556 [DOI] [PMC free article] [PubMed] [Google Scholar]
- Ganesh S, Puri R, Singh S, Mittal S, Dubey D (2006) Recent advances in the molecular basis of Lafora’s progressive myoclonus epilepsy. J Hum Genet 51: 1–8 [DOI] [PubMed] [Google Scholar]
- Gentry MS, Worby CA, Dixon JE (2005) Insights into Lafora disease: malin is an E3 ubiquitin ligase that ubiquitinates and promotes the degradation of laforin. Proceedings of the National Academy of Sciences of the United States of America 102: 8501–8506 [DOI] [PMC free article] [PubMed] [Google Scholar]
- Hothorn T, Bretz F, Westfall P (2008) Simultaneous inference in general parametric models. Biom J 50: 346–363 [DOI] [PubMed] [Google Scholar]
- Kuznetsova A, Brockhoff PB, Christensen RHB (2017) lmerTest Package: Tests in Linear Mixed Effects Models. Journal of Statistical Software; Vol 1, Issue 13 (2017) [Google Scholar]
- Lahuerta M, Gonzalez D, Aguado C, Fathinajafabadi A, García-Giménez JL, Moreno-Estellés M, Romá-Mateo C, Knecht E, Pallardó FV, Sanz P (2020) Reactive Glia-Derived Neuroinflammation: a Novel Hallmark in Lafora Progressive Myoclonus Epilepsy That Progresses with Age. Mol Neurobiol 57: 1607–1621 [DOI] [PMC free article] [PubMed] [Google Scholar]
- López-González I, Viana R, Sanz P, Ferrer I (2017) Inflammation in Lafora Disease: Evolution with Disease Progression in Laforin and Malin Knock-out Mouse Models. Mol Neurobiol 54: 3119–3130 [DOI] [PMC free article] [PubMed] [Google Scholar]
- Machado-Salas J, Avila-Costa MR, Guevara P, Guevara J, Durón RM, Bai D, Tanaka M, Yamakawa K, Delgado-Escueta AV (2012) Ontogeny of Lafora bodies and neurocytoskeleton changes in Laforin-deficient mice. Exp Neurol 236: 131–140 [DOI] [PMC free article] [PubMed] [Google Scholar]
- Nitschke F, Ahonen SJ, Nitschke S, Mitra S, Minassian BA (2018) Lafora disease - from pathogenesis to treatment strategies. Nature reviews Neurology 14: 606–617 [DOI] [PMC free article] [PubMed] [Google Scholar]
- Pederson BA, Turnbull J, Epp JR, Weaver SA, Zhao X, Pencea N, Roach PJ, Frankland PW, Ackerley CA, Minassian BA (2013) Inhibiting glycogen synthesis prevents Lafora disease in a mouse model. Annals of neurology 74: 297–300 [DOI] [PMC free article] [PubMed] [Google Scholar]
- Puri R, Suzuki T, Yamakawa K, Ganesh S (2011) Dysfunctions in endosomal-lysosomal and autophagy pathways underlie neuropathology in a Mouse model for Lafora disease. Human molecular genetics 21: 175–184 [DOI] [PubMed] [Google Scholar]
- Rubio-Villena C, Viana R, Bonet J, Garcia-Gimeno MA, Casado M, Heredia M, Sanz P (2018) Astrocytes: new players in progressive myoclonus epilepsy of Lafora type. Human molecular genetics 27: 1290–1300 [DOI] [PMC free article] [PubMed] [Google Scholar]
- Ruzankina Y, Pinzon-Guzman C, Asare A, Ong T, Pontano L, Cotsarelis G, Zediak VP, Velez M, Bhandoola A, Brown EJ (2007) Deletion of the developmentally essential gene ATR in adult mice leads to age-related phenotypes and stem cell loss. Cell Stem Cell 1: 113–126 [DOI] [PMC free article] [PubMed] [Google Scholar]
- Sánchez-Martín P, Romá-Mateo C, Viana R, Sanz P (2015) Ubiquitin conjugating enzyme E2-N and sequestosome-1 (p62) are components of the ubiquitination process mediated by the malin-laforin E3-ubiquitin ligase complex. Int J Biochem Cell Biol 69: 204–214 [DOI] [PubMed] [Google Scholar]
- Sica A, Erreni M, Allavena P, Porta C (2015) Macrophage polarization in pathology. Cell Mol Life Sci 72: 4111–4126 [DOI] [PMC free article] [PubMed] [Google Scholar]
- Solmesky LJ, Khazanov N, Senderowitz H, Wang P, Minassian BA, Ferreira IM, Yue WW, Lossos A, Weil M, Kakhlon O (2017) A novel image-based high-throughput screening assay discovers therapeutic candidates for adult polyglucosan body disease. The Biochemical journal 474: 3403–3420 [DOI] [PMC free article] [PubMed] [Google Scholar]
- Tagliabracci VS, Girard JM, Segvich D, Meyer C, Turnbull J, Zhao X, Minassian BA, Depaoli-Roach AA, Roach PJ (2008) Abnormal metabolism of glycogen phosphate as a cause for Lafora disease. J Biol Chem 283: 33816–33825 [DOI] [PMC free article] [PubMed] [Google Scholar]
- Tang B, Frasinyuk MS, Chikwana VM, Mahalingan KK, Morgan CA, Segvich DM, Bondarenko SP, Mrug GP, Wyrebek P, Watt DS, DePaoli-Roach AA, Roach PJ, Hurley TD (2020) Discovery and Development of Small-Molecule Inhibitors of Glycogen Synthase. J Med Chem 63: 3538–3551 [DOI] [PMC free article] [PubMed] [Google Scholar]
- Tugal D, Liao X, Jain MK (2013) Transcriptional control of macrophage polarization. Arterioscler Thromb Vasc Biol 33: 1135–1144 [DOI] [PubMed] [Google Scholar]
- Turnbull J, DePaoli-Roach AA, Zhao X, Cortez MA, Pencea N, Tiberia E, Piliguian M, Roach PJ, Wang P, Ackerley CA, Minassian BA (2011a) PTG depletion removes Lafora bodies and rescues the fatal epilepsy of Lafora disease. PLoS genetics 7: e1002037. [DOI] [PMC free article] [PubMed] [Google Scholar]
- Turnbull J, Girard JM, Pencea N, Zhao X, Graham TE, Wang P, Ackerley CA, Minassian BA (2011b) Lafora bodies in skeletal muscle are fiber type specific. Neurology 76: 1674–1676 [DOI] [PMC free article] [PubMed] [Google Scholar]
- Valles-Ortega J, Duran J, Garcia-Rocha M, Bosch C, Saez I, Pujadas L, Serafin A, Canas X, Soriano E, Delgado-Garcia JM, Gruart A, Guinovart JJ (2011) Neurodegeneration and functional impairments associated with glycogen synthase accumulation in a mouse model of Lafora disease. EMBO molecular medicine 3: 667–681 [DOI] [PMC free article] [PubMed] [Google Scholar]
- Verhalen B, Arnold S, Minassian BA (2018) Lafora Disease: A Review of Molecular Mechanisms and Pathology. Neuropediatrics 49: 357–362 [DOI] [PMC free article] [PubMed] [Google Scholar]
- Vilchez D, Ros S, Cifuentes D, Pujadas L, Vallès J, García-Fojeda B, Criado-García O, Fernández-Sánchez E, Medraño-Fernández I, Domínguez J, García-Rocha M, Soriano E, Rodríguez de Córdoba S, Guinovart JJ (2007) Mechanism suppressing glycogen synthesis in neurons and its demise in progressive myoclonus epilepsy. Nat Neurosci 10: 1407–1413 [DOI] [PubMed] [Google Scholar]


