


Abstract
Bcl-2 phosphorylation at serine-70 (S70pBcl2) confers resistance against drug-induced apoptosis. Nevertheless, its specific mechanism in driving drug-resistance remains unclear. We present evidence that S70pBcl2 promotes cancer cell survival by acting as a redox sensor and modulator to prevent oxidative stress-induced DNA damage and execution. Increased S70pBcl2 levels are inversely correlated with DNA damage in chronic lymphocytic leukemia (CLL) and lymphoma patient-derived primary cells as well as in reactive oxygen species (ROS)- or chemotherapeutic drug-treated cell lines. Bioinformatic analyses suggest that S70pBcl2 is associated with lower median overall survival in lymphoma patients. Empirically, sustained expression of the redox-sensitive S70pBcl2 prevents oxidative stress-induced DNA damage and cell death by suppressing mitochondrial ROS production. Using cell lines and lymphoma primary cells, we further demonstrate that S70pBcl2 reduces the interaction of Bcl-2 with the mitochondrial complex-IV subunit-5A, thereby reducing mitochondrial complex-IV activity, respiration and ROS production. Notably, targeting S70pBcl2 with the phosphatase activator, FTY720, is accompanied by an enhanced drug-induced DNA damage and cell death in CLL primary cells. Collectively, we provide a novel facet of the anti-apoptotic Bcl-2 by demonstrating that its phosphorylation at serine-70 functions as a redox sensor to prevent drug-induced oxidative stress-mediated DNA damage and execution with potential therapeutic implications.
INTRODUCTION
Tumor intracellular redox milieu is a critical determinant of cell fate, and changes in the levels of intracellular reactive oxygen species (ROS) impact various signaling networks such as those associated with cell proliferation, survival and death (1–9). A well-studied facet of ROS is its detrimental effects on cells, particularly at levels that overwhelm the anti-oxidant defence systems. Such insults culminate in overt oxidative stress, which triggers cellular toxicity such as DNA damage and apoptosis (8,10–12). These observations, therefore, underscore the importance of the critical balance between intracellular ROS production and anti-oxidant defence systems in maintaining redox homeostasis, thereby preventing the detrimental effects of ROS.
Bcl-2 is an anti-apoptotic protein, deregulation of which is associated with drug-resistance in hematologic malignancies (5,13–21). Canonically, Bcl-2 blocks apoptosis by sequestering the pro-apoptotic protein BAX, thereby preventing mitochondrial outer-membrane permeabilization (MOMP) and release of apoptogenic proteins such as cytochrome c and apoptosis inducing factor (AIF). Notably, there is mounting experimental evidence that deregulated expression of Bcl-2 is associated with, or plays a critical role in, myriad cellular processes including cell cycle progression, cellular senescence, autophagy and ROS regulation (22,23). To that end, our previous work has unravelled a novel facet in the non-canonical biology of Bcl-2 by demonstrating that Bcl-2 overexpression in human leukemia cells is associated with an increase in intracellular superoxide (O2.−) levels, which endows cancer cells the ability to evade apoptotic execution (5). Furthermore, during states of normoxia, the ‘pro-oxidant’ activity of Bcl-2 is linked to an increase in mitochondrial redox metabolism (24–26); however, when faced with overt oxidative stress, enforced or constitutively high expression levels of Bcl-2 serve to counterbalance the increase in mitochondrial ROS (24,25), potentially to avert cell damage and death.
Notwithstanding the distinctly opposing effects of Bcl-2 overexpression, contingent upon cellular redox status, the mechanism as well as the functional outcome and clinical relevance of this novel redox rheostat facet of Bcl-2 biology remain unexplored. There is emerging evidence that a critical determinant of the redox dichotomous activity of Bcl-2 is its post-translational status, in particular phosphorylation at serine-70 (S70pBcl2). To that end, downregulation of superoxide dismutase 1 (SOD1) or overexpression of a O2.−-producing GTPase Rac1 mutant (G12V) resulted in sustained S70pBcl2, which could be blocked by scavenging intracellular O2.−. This correlation was corroborated in advanced stage/grade clinical lymphomas (27,28), thereby suggesting a provocative hypothesis that the drug refractory phenotype of aggressive hematologic cancers could well be a function of an altered redox milieu in response to sustained S70pBcl2.
Intrigued by the dichotomy of redox-dependent functional biology of Bcl-2, we set out to investigate the effect and molecular mechanism(s) of S70pBcl2 on the sensitivity and response of cancer cells to execution signals that are dependent on the intermediary involvement of oxidative stress. In this regard, the underlying mechanism of death execution triggered by a number of conventionally used chemotherapeutic agents involves an increase in intracellular ROS production and oxidative stress-induced DNA damage. Here, we present evidence for the first time implicating S70pBcl2 as a redox rheostat in suppressing drug-induced DNA damage via its ability to modulate oxidative stress. We also provide a mechanistic insight into the redox regulatory activity of S70pBcl2 and the potential therapeutic implications of targeting this mono-site phosphorylation of Bcl-2 in chronic lymphocytic leukemia (CLL) patient-derived primary cells.
MATERIALS AND METHODS
Cell line and cell culture
Human leukemia Jurkat (ATCC® TIB-152™), CEM (ATCC® CCL-119™) and human lymphoma DHL4 (ATCC® CRL-2957™) cells were obtained from ATCC. Human lymphoma OCI-Ly1 (DSMZ ACC722) cells were obtained from DSMZ and human nasopharyngeal C666-1 and HK-1 cells were obtained from Goh Boon Cher's Lab, Cancer Singapore Institute, Singapore. These cells were cultured in RPMI-1640, supplemented with 1% streptomycin-penicillin, 2mM l-glutamine and 10% FBS. Human leukemia CEM and HeLa stably expressing the human BCL2 (CEM/Bcl-2 and HeLa/Bcl-2) or neomycin gene (CEM/Neo and HeLa/Neo) were cultured in RPMI-1640 and DMEM respectively, supplemented with 20 μg/ml G418, 2 mM l-glutamine and 10% FBS. Stable CrisprBCL2-Jurkat cells (knockdown) were generated from Jurkat cell (ATCC® TIB-152™), using the ‘Bcl-2 CRISPR/Cas9 KO’ (sc-400025-KO-2) and ‘HDR’ (sc-400025-HDR-2) plasmids from Santa Cruz via electroporation, and cultured in RPMI-1640, supplemented with 0.75 μg/ml puromycin, 2mM l-glutamine and 10% FBS. Cells were cultured at 37°C in a humidified atmosphere of 95% air and 5% CO2. Cells were routinely checked for mycoplasma. Only mycoplasma-free cells (fewer than 25 passages) were used in all experiments. Cell lines were authenticated by Short Tandem Repeat method from Transcend (NUHS) and Promega, WI, USA.
Chemicals and reagents
Fetal Bovine Serum (FBS) and Phosphate Buffered Saline (PBS) were purchased from Hyclone™, ThermoFisher Scientific, Waltham, MA, USA. HEPES, EDTA, EGTA, TEMED, isopropanol, aprotonin, pepstatin, phenylmethanesulfonyl fluoride (PMSF), leupeptin, sodium fluoride (NaF), sodium orthovanadate (Na3VO4), diethyldithiocarbamate (DDC), doxorubicin, etoposide, fludarabine, 5-flouroUracil (5-FU), cisplatin, dimethyl-9,9’-biacridinium dinitrate (Lucigenin), N-acetyl-cysteine (NAC) were purchased from Sigma-Aldrich, St. Louis, MO, USA. Venetoclax (VEN) was purchased from Medchem Express LLC. Streptomycin–penicillin and l-glutamine were purchased from Gibco. Coomassie Blue dye and bovine serum albumins (BSA) were purchased from ThermoFisher Scientific. Methanol and sodium dodecyl sulphate (SDS) were purchased from Merck, Kenilworth, NJ, USA. Sucrose and 30% acrylamide/bis solution were purchased from Bio-Rad. Goat anti-mouse and anti-rabbit IgG horseradish peroxidase conjugated secondary antibodies were purchased from Pierce, TX, USA. Protein A agarose beads were purchased from Santa Cruz, TX, USA. Chloromethyl-2-,7-dichlorofluorescin diacetate (DCFDA) and MitoSox™ were purchased from Molecular Probes, Thermo Fisher Scientific.
Primary antibodies for western blot
Bcl-2 mouse primary antibody (Cat.#610539, BD Bioscience, MA, USA and Cat.#658702 Biolegend, CA, USA). SOD1 mouse (Cat.#556360, BD Bioscience) and SOD2 rabbit (Cat.#06–984, Milipore, Sigma-Aldrich) primary antibody. COX5A mouse antibody (Cat.#ab110262, Abcam, Cambridge, UK and Santa Cruz). S70pBcl2 (Cat.#2827), S345pChk1 (Cat.#2348), γH2AX (Cat.#2577), S358pMLKL (Cat.#91689), MLKL (Cat.#14993T), Caspase-3 (Cat.#9662), GAPDH (Cat.#5174S) rabbit and Chk1 (Cat.#2360) mouse primary antibody (Cell Signaling, MA, USA). S87pBcl2 (Cat.#sc-16323) rabbit primary antibody and β-actin (Cat.#sc-47778) mouse primary antibody (Santa Cruz). T69pBcl2 (Cat.#PA5–36742) rabbit and BAX (Cat.#MA5–14003) mouse primary antibody (ThermoFisher Scientific, MA, USA). IgG rabbit (Cat.#3703, ProSci, CA, USA, Cat.#2729, Cell Signaling) and IgG mouse antibody (Cat.#sc-2025, Santa Cruz, TX, USA).
Primary antibodies for co-immunoprecipitation
Bcl-2 rabbit primary antibody (Cat.#12789–1-AP, Proteintech, IL, USA and Cat.#sc-783, Santa Cruz). COX5A rabbit primary antibody (Cat.#ab180129, Abcam).
Plasmid and siRNAs
S70A and S70E Bcl-2 mutants were previously generated from pcDNA3.1-BCL2 by using the QuickChange Site-Directed Mutagenesis Kit (Stratagene) (27,28). Two ON-TARGETplus SOD1 (Cat.#J-008364–09 and J-008364–10) specific siRNA sequences were purchased from Dharmacon Technologies (ThermoFisher Scientific). 2 COX5A (Cat.#SR306213) specific siRNA were purchased from Origene, MD, USA. Bcl-2 CRISPR/Cas9 KO (Cat.#sc-400025-KO-2) and HDR (Cat.#sc-400025-HDR-2) plasmids were purchased from Santa Cruz.
Electroporation-based transfection
Suspension cells (10 × 106) were transfected with either 2μg of pcDNA3.1, WT BCL2, S70A, S70E plasmids or 150 nM/20 nM of siSOD1/siCOX5A or 1.5 μg of CRISPR/Cas9 KO and HDR plasmids using the Neon™ Electroporator from Invitrogen, ThermoFisher Scientific as previously described (27,28). Following transfection, cells were incubated for 30 hours (h) for plasmids or 48 h for siRNA or antibiotic selection of stable CRISPR/Cas9-mediated knockdown at 5% CO2 and 37°C prior to further experiments.
Calcium phosphate-based transfection
Adherent cells (0.5 × 10⁶) were transiently transfected with either 2 μg of pcDNA3.1, WT BCL2, S70A, S70E plasmids via the calcium phosphate-based transfection as previously described (28). Following transfection, cells were incubated for 30 h at 5% CO2 and 37°C prior to further experiments.
Co-immunoprecipitation assay
10 million cells were lysed in ice-cold co-IP-buffer (0.5% Nonidet-P40, 50 mM Tris, pH 7.6, 150 mM NaCl, 1 mM EDTA) supplemented with protease inhibitors (10 μg/ml aprotinin, 20 μg/ml pepstatin-A, 1 mM PMSF, 10 μg/ml leupeptin) and phosphatase inhibitors (1 mM NaF, 1 mM Na3VO4). 1200 μg lysates were pre-cleared with protein-A agarose beads (Cat.#sc-2001, Santa Cruz) on rotation at 4°C, 90 min. Following beads removal, 3 μg primary antibody was added to sample, incubated on rotation at 4°C overnight and precipitated with protein-A agarose beads on rotation at 4°C, 4 h. Beads were then centrifuged, washed with ice-cold co-IP buffer three times and analyzed via western blot.
Western blot analysis
Phosphorylation and total protein expressions were analyzed via western blot analysis with specific polyclonal or monoclonal antibodies as mentioned in the article. Protocol is as previously described (27,28). Burn-out of chemiluminescence substrate were avoided during the development of western blot bands to ensure that densitometric quantification could be performed accurately. ImageJ was used for densitometric quantification, where an area coverage and horizontally-directed scanning of bands were fixed prior to obtaining the density of the western blot bands for analysis.
Intracellular O2.− measurement by Lucigenin chemiluminescence assay
O2.− level was measured using the O2.−-specific lucigenin-based chemiluminescence assay. 5 million cells/sample were re-suspended with 450 μl ATP lysis buffer. 400 μl suspension was used for O2.− measurement using the Berthold Sirius Luminometer (Berthold detection systems). Luminescent signals obtained were subsequently normalized to the sample protein concentration quantification with remaining 50 μl lysate. Results were presented as RLU/μg protein in fold change over control.
Intracellular ROS and mitochondrial O2.- measurement by flow cytometry
0.2 million cells were harvested and incubated with 5 μM DCFDA or 5 μM Mitosox, 15 min at 37°C. DFCDA or Mitosox analysis was performed by the EPICS Elite ESP flow cytometer (Beckman Coulter) with excitation/emission wavelengths of 488/525 nm or 510/580 nm respectively. At least 10 000 events were analyzed.
SOD activity assay
Cells were homogenized in ice-cold 20 mM HEPES buffer, pH 7.2 containing 1 mM EGTA, 210 mM mannitol and 70 mM sucrose. Cells were subsequently centrifuged and supernatant was collected for SOD activity measurement and calculation according to the protocol provided by the manufacturer (Cat.#706002, Cayman Chemical, MI, USA).
COX activity assay
The Human Complex-IV Activity Microplate Assay Kit (Cat.#ab109909, Abcam) was used to measure cellular COX activity according to the protocol provided by manufacturer following treatment or transfection.
Oxygen consumption rate (OCR)
Cellular OCR (0.25 million cells) was measured via the XFe24 Analyzer (Seahorse Bioscience, MA, USA) according to the protocol provided by manufacturer. Basal and maximal OCR readings (pmol/min) were obtained and analysed using the XFe Wave software. FCCP was used to attain maximal respiration. Rotenone and Antimycin A were used to indicate mitochondrial OCR. OCR was displayed in kinetics and fraction (Basal OCR) of treatments/transfections over respective controls at approximately 20 min.
Immunofluorescence/confocal microscopy
5 million cells were fixed (4% paraformaldehyde) at room-temperature (RT), 20 min, washed with ice-cold 1XPBS and permeabilized (0.05% Triton X-100) at RT, 10 min. Cells were then washed with ice-cold 1× PBS and incubated with blocking buffer (1× PBS, 2% BSA, 5% FBS) on rotation at 4°C, 2 h. Resulting cells were incubated with primary antibodies (1:100) (8-OHdG, Cat.#sc-66036, Santa Cruz; γH2AX, Cat.#2577, Cell Signaling; Bcl-2, Cat.#12789–1-AP, Proteintech, Cat.#sc-783, Santa Cruz; COX5A, Cat.#ab110262, Abcam) in blocking buffer at 4°C overnight and washed with ice-cold 1× PBS twice before incubated with AlexaFluor-488 and AlexaFlour-568 secondary antibodies (1:200) in blocking buffer on rotation at RT, 2 h. Cells were washed with ice-cold 1× PBS and added onto a hydrophobic-drawn circle of a polylysine-coated microscope glass plate. FlourSave™ Reagent (Milipore) with Hoechst (1:1000) was added on sample and sealed with coverslip. Sample was analyzed on Olympus Fluoview FV1000 confocal microscope and processed with Olympus Flouview 3.0 viewer.
Comet Assay was performed using the OxiSelect™ 96-Well comet assay kit and according to the manufacturer's protocol (Cat#STA-355, Cell Biolabs, CA, USA). Processed samples were then viewed and captured under the ZEISS® Axio Vert.A1 Microscope. Percentage DNA tail (%) and tail length of comets were obtained using the OpenComet software (29).
Proximity ligation assay
The Duolink® In-Situ Red Starter Kit Mouse/Rabbit (Cat.#DUO92101, Sigma Aldrich) was used according to the manufacturer's protocol as well as previously described (28) to visualize protein–protein interaction as discrete red spots under confocal microscopy.
Cell viability/survival assays
3-(4,5-Dimethylthiazol-2-yl)-2,5-diphenyltetrazolium bromide (MTT) (Cat.#M5655, Sigma-Aldrich) was used as previously described (27,28). Experiments involving NAC, samples were washed and re-suspended with PBS before adding to MTT. Celltiter-Glo (CTG) (Cat.#PR-G7573, Promega) was used according to the protocol provided by manufacturer. For Annexin-V staining, stroma NK.Tert cells (5 × 10³/100 μl) (RCB2350, Riken Cell Bank, Japan) were seeded on a 96-well plate overnight followed by cryopreserved CLL patient-derived primary cells (5 × 10⁴/100 μl), total volume 200 μl. Stroma NK.Tert cells were used to maintain CLL patient-derived primary cell survival. Following drug treatment, cells were stained with 10 μl of 10× Annexin-V binding buffer (100 mM HEPES, 40 mM KCl, 1.4 M NaCl, 7.5 mM MgCl2, 25 mM CaCl2 pH 7.4) with Annexin-V and Hoechst-33342 for 15 min at RT, fixed with Annexin-V fix buffer (4% formaldehyde, 0.5% glutaraldehyde in 1× Annexin-V binding buffer) for 10 min and neutralized with N2 buffer (1.7 M Tris, 1.25 M glycine, pH9.1). Samples were gated and analyzed based on live population (Hoechst+ Annexin V−) with BD-Fortessa flow cytometer as described by Villalobos-Ortiz et al. (30). Invitrogen Countess® II cell counter (Cat.#AMQAX1000R) was used to determine number of live cells with Trypan Blue exclusion test (Cat.#T10282) following drug treatment.
Patient sample preparation
Primary cells from lymphoma tissues were obtained from single-cell suspension preparation as previously described (28) following approval from National University of Singapore Institutional Review Board (IRB) and informed consent. Peripheral blood mononuclear cells (PBMC) from CLL patients were obtained from Ficoll-Paque-treated whole blood after density-gradient centrifugation (GE Heatlhcare, IL, USA) following approval from Dana-Farber IRB and informed consent. Cells were either lysed in RIPA or Co-IP lysis-buffers for western blot analysis or viably frozen in freezing media (90% FBS and 10% DMSO) for subsequent experiments.
Bioinformatics and code availability
-
Analysis of COX 5A expression
Gene expression data and corresponding clinical information of tumor samples were generated by TCGA database (The Cancer Genome Atlas Program, https://www.cancer.gov/tcga) and arranged by UCSC Xena. The expression dataset of normal control used for the analyses described in this study were generated by TCGA database and GTEx Portal and arranged by UCSC Xena (31). The GTEx Project was supported by the Common Fund of the Office of the Director of the National Institutes of Health and by NCI, NHGRI, NHLBI, NIDA, NIMH and NINDS. The bioinformatic analysis and statistical analysis were conducted using R language.
-
Lymphoma patient survival from BCL2 and SOD1 expressions
In-house database of National University Health System (NUHS) Translation Centre of Development and Research (TRANSCEND) Affymetrix meta-cohorts of DLBCL was compiled previously (32). Briefly, dataset in Affymetrix U133A2 and U133 Plus 2 platforms were downloaded from Gene Expression Omnibus1 and ArrayExpress2. Subsequently, the data were normalized using RMA and standardized using ComBat (33). Statistical analyses were conducted using Matlab® R2012a version 7.14.0.739, and statistics toolbox version 8.0 (MathWorks; Natick, MA). Kaplan–Meier analyses were conducted using GraphPad Prism® version 5.04 (GraphPad Software; La Jolla, CA, USA). Statistical significance of the Kaplan-Meier analysis was calculated by log-rank test.
Statistical analysis
Results were presented in bar graphs showing mean+SD, box-plot showing median and curve graphs. Two-tailed t-tests, one-way, two-way ANOVA, Sidak's multiple comparisons, Wilcoxon signed-rank and log-rank tests were used. Pearson correlation coefficient, R, was used for correlations between two variables. Statistical significance was set at P < 0.05.
RESULTS
S70pBcl2 is inversely correlated with DNA damage marker serine-345 phosphorylated Chk1 (S345pChk1) as well as associated with lower median overall survival (OS)
A key feature of oxidative stress is DNA damage. Since downregulation of SOD1 or overexpression of active Rac1 leads to an increased intracellular O2.− as well as sustained S70pBcl2 in advanced stage clinical lymphomas (27,28), we proceeded to verify if S70pBcl2 indeed had a protective redox phenotype in clinical patient samples by screening the levels of S70pBcl2 and DNA damage marker, S345pChk1 in two different patient cohorts of CLL and lymphoma samples (Tables 1 and 2). Interestingly, a visually and statistically significant inverse correlation between S70pBcl2 (normalized to Bcl-2) and S345pChk1 (normalized to Chk1) was observed in CLL patient-derived primary cells (Pearson correlation coefficient, R = –0.5441, n = 15, P-value = 0.0360) and lymphoma patient-derived primary cells (R = –0.4841, n = 17, P-value = 0.0490; Figure 1A–E). These significant inverse correlations were only observed between normalized S70pBcl2/Bcl-2 and S345pChk1/Chk1 but not between S70pBcl2 and Bcl-2 or S345pChk1 and Chk1 (Supplementary Figure S1A-C). As an internal control for comparing the expression in lysates from different patient samples (by densitometry), lysates from a specific patient were loaded onto different gels and marked as reference, ‘Ref.’ and denoted as fold change 1 (Figure 1A–C). In addition, patient sample numbers 5, 11, 12, 13 and 21 in the lymphoma cohort were removed from the correlation analyses as these patients were eventually not diagnosed with lymphoma (Table 2). The inverse correlation between normalized S70pBcl2/Bcl-2 and S345pChk1/Chk1 suggests that S70pBcl2 upregulation in cells with low SOD1 or high Rac1 may be a mechanism to prevent the build-up of oxidative stress. Nevertheless, no relationship could be concluded between the inverse correlation and treatments received by these patients as most patients were either under observation or had no available treatment information (Tables 1 and 2). Apart from that, bioinformatic analyses of lymphoma patients with high BCL2:SOD1 ratio displayed lower median OS as compared to those with low/equal BCL2:SOD1 ratio (Figure 1F-G). As low SOD1 protein level indicates a higher S70pBcl2 level (27), these results suggest that S70pBcl2 endows lymphoma cells a survival advantage by modulating cellular oxidative stress and its repercussion (i.e. DNA damage). We also noted that the OS curve of High-BCL2/High-SOD1 is similar to that of High-BCL2/Low-SOD1 (Supplementary Figure S2). This could be inferred that a high Bcl-2, without the accumulation of ROS, may still permit Bcl-2-driven cancer cells to survive and decrease patient survival rate, particularly when high Bcl-2 may also possess high S70pBcl2 level as shown by the significantly positive correlation between Bcl-2 and S70pBcl2 in CLL (R = 0.7477, P-value = 0.0014) and lymphoma (R = 0.5509, P-value = 0.0219) (Supplementary Figure S1A–C). Nevertheless, it should be considered that the OS curves are compared at the mRNA expression levels, which may not fully reflect the actual protein, activity and/or phosphorylation levels of Bcl-2 and SOD1.
Table 1.
Table displaying the pathological diagnoses and treatments of 15 patients with arbitrarily assigned numbers in the chronic lymphocytic leukemia (CLL) cohort
| Randomly assigned patient number | Pathological diagnosis | Chemotherapy/treatment |
|---|---|---|
| 1 | CLL | Observation, on Cemiplimab for squamous cell carcinoma |
| 2 | CLL | Acalabrutinib, Venetoclax, and Obinutuzumab |
| 3 | CLL | Observation |
| 4 | CLL | Ibrutinib |
| 5 | CLL | Observation |
| 6 | CLL | Observation |
| 7 | CLL | Observation |
| 8 | CLL | Observation |
| 9 | CLL | Observation |
| 10 | CLL | Observation |
| 11 | CLL | Observation |
| 12 | CLL | Observation |
| 13 | CLL | Methotrexate for DLBCL, Fludarabine with Cyclophosphamide |
| 14 | CLL | Ibrutinib |
| 15 | CLL | Rituximab |
Table 2.
Table displaying the pathological diagnoses and treatments of 22 patients with arbitrarily assigned numbers in the lymphoma cohort. Patient number 5, 11, 12, 13 and 21 were not included in the correlation analyses as they were eventually not diagnosed with lymphoma
| Randomly assigned patient number | Pathological diagnosis | Chemotherapy/treatment received before lymph node removal |
|---|---|---|
| 1 | Aggressive B-cell lymphoma with large cell morphology, Diffuse large B-cell lymphoma (DLBCL) | R-CHOP x6 cycles |
| 2 | Follicular lymphoma grade 2 to 3A, more than 75% follicular pattern | N.A. |
| 3 | Diffuse large B-cell lymphoma (non-germinal centre-like) | N.A. |
| 4 | Nodular lymphocyte predominant Hodgkin lymphoma | Rituximab x4 cycles |
| 5 | Metastatic poorly differentiated neuroendocrine carcinoma | Cisplatin and Etoposide x1 cycle |
| 6 | Mantle cell lymphoma | Maxi-CHOP x1 cycle, R-CHOP x2 cycles, R-MAXI CHOP x1 cycle |
| 7 | Diffuse large B-cell lymphoma with Grade 3B follicular lymphoma component | N.A. |
| 8 | Classic Hodgkin lymphoma, nodular sclerosis | ABVD x4 cycles Radiotherapy 20Gy in 10 fraction |
| 9 | Lymph node with diffuse large B-cell lymphoma | CHOP x6 cycles |
| 10 | Left cervical lymph nodes: Follicular lymphoma, grade 3 | N.A. |
| 11 | Necrotizing granulomatous inflammation | N.A. |
| 12 | Fibrous scar tissue | N.A. |
| 13 | Benign | No |
| 14 | Follicular lymphoma | Bevacizumab/XELOX x4 cycles |
| 15 | Large B-Cell lymphoma | R-CHOP x1 cycle |
| 16 | Follicular lymphoma predominantly low grade with focal high grade (grade 3A) areas, follicular and diffuse pattern | N.A. |
| 17 | Follicular lymphoma, low grade with increased proliferation index | RICE x3 cycles |
| 18 | Classic Hodgkin lymphoma, mixed cellularity subtype | ABVD x3 cycles plus IFRT |
| 19 | B-cell lymphoma | N.A |
| 20 | Follicular lymphoma, low grade (1-2) with high grade (3A) areas and with predominant follicular pattern (>75%). | R-CHOP x6 cycles followed by maintenance Rituximab |
| 21 | Kimura disease | N.A. |
| 22 | Small B-cell lymphoma with plasmacytic differentiation | N.A. |
R-CHOP: Rituximab, Cyclophosphamide, Doxorubicin hydrochloride (Hydroxydaunorubicin), Vincristine sulfate (Oncovin) and Prednisone.
ABVD: Doxorubicin Hydrochloride (Adriamycin), Bleomycin Sulfate, Vinblastine Sulfate and Dacarbazine.
RICE: Rituximab, Ifosfamide, Carboplatin, Etoposide.
IFRT: Involved-Field Radiation Therapy.
N.A.: not available.
Figure 1.

S70pBcl2 is inversely correlated to the DNA damage marker, S345pChk1 and associated with lower median patient overall survival. (A, B) Western blot showing S345pChk1, S70pBcl2, Chk1, Bcl-2 and β-actin for chronic lymphocytic leukemia (CLL) and lymphoma patient-derived primary cells with assigned arbitrary numbers. Reference ‘ref’ indicates internal controls for each western blot gel for densitometry normalization. CLL patient number 3 or lymphoma patient number 16 was used as the reference for each cohort and denoted the fold change 1. (C, D) Pearson correlation coefficient, R, between normalized densitometry of S70pBcl2/Bcl-2 and S345pChk1/Chk1 from CLL and lymphoma patient-derived primary cells. (E) Table displaying R-value and P-value of each correlation for CLL and lymphoma. (F, G) Kaplan-Meier analyses of overall survival in TRANSCEND diffuse large B-cell lymphoma (DLBCL) cohort. Cases were stratified by BCL2-SOD1 expression levels: low/high or low\low (blue), high\low (red). The P-value is computed by log-rank test. NIL indicates the median survival curve does not reach 50%. Abbrev.: HR, hazard ratio.
S70pBcl2 senses and modulates intracellular O2.− levels to prevent oxidative stress-induced DNA damage
To investigate the role of S70pBcl2 in redox-regulation at the protein level, Jurkat leukemia cells were either treated with increasing doses of SOD1 inhibitor, diethyldithiocarbamate (DDC), for 4 h or SOD1-targeted siRNAs (siSOD1) for 48 h. A dose-dependent increase in intracellular O2.- and S70pBcl2 levels were observed with DDC, plateauing at 400μM (Figure 2A, B). Similar results were obtained upon siSOD1 treatment (Figure 2C, D). Notably, two other Bcl-2 phosphorylation sites, threonine-69 or serine-87, were unaffected upon an increase in O2.− (Supplementary Figure S3) (27,28). Concurrently, we observed an increase in DNA damage markers in cells treated with DDC or siSOD1, evidenced by two established markers of oxidative stress/ROS-induced DNA damage (Ri-DNA damage) (34–37), S345pChk1 and γH2AX (Figure 2B and D). These data were corroborated by the comet assay for DNA damage visualization (Supplementary Figure S4). Furthermore, pre-treatment with the ROS scavenger, N-acetylcysteine (NAC), alleviated the increase in DNA damage markers as well as S70pBcl2 (Figure 2E, F). These observations were similarly re-capitulated upon removal of ONOO− (product of O2.− and nitric oxide reaction) by the OONO− decomposer catalyst, FeTPPS (Figure 2G). The concurrent increases in S70pBcl2, intracellular O2.- and DNA damage therefore suggest that S70pBcl2 is a sensor of oxidative stress.
Figure 2.

S70pBcl2 suppresses the increase in ROS and ROS-induced DNA damage. (A) Fold change in intracellular O2.− levels in Jurkat cells following treatment with increasing doses of DDC (μM) for 4 h. N = 4. (B) Western blot showing S345pChk1, γH2AX, S70pBcl2, Chk1, Bcl-2, β-actin of Jurkat cells following treatment with increasing doses of DDC after 4 h. Fold changes (FC) showing densitometry values of S345pChk1/Chk1 and γH2AX/β-actin below their respective targets (similarly shown in subsequent figures in the article). (C) Fold change in intracellular O2.− levels in Jurkat cells following 2 independent siRNA treatments (150 nM) against SOD1 for 48 h. N = 4. (D) Western blot showing S345pChk1, γH2AX, S70pBcl2, Chk1, Bcl-2, SOD1, β-actin of Jurkat cells following two independent siRNA treatments (150 nM) against SOD1 for 48 h. (E) Fold change in intracellular O2.− levels in Jurkat cells following pre-treatment with NAC (10 mM) for 2 h and treatment of DDC (400 μM) for 4 h. N = 4. (F) Western blot showing S345pChk1, γH2AX, S70pBcl2, Chk1, Bcl-2, β-actin of Jurkat cells following pre-treatment with NAC (10mM) for 2 h and treatment of DDC (400 μM) for 4 h. (G) Western blot showing S345pChk1, γH2AX, Chk1, S70pBcl2, Bcl-2, β-actin of Jurkat cells following pre-treatment with FeTPPS (50 μM) for 2 h and treatment with DDC (400 μM) for 4 h. (H) Fold change in intracellular O2.− levels in Jurkat cells following a 4- and 8-h time-kinetic treatments with 400 μM DDC. N = 5. (I) Western blot showing S345pChk1, γH2AX, S70pBcl2, Chk1, Bcl-2, β-actin of Jurkat cells following a 4- and 8-h time kinetic treatment with 400 μM DDC. (J) Fold change in intracellular O2.− levels in pcDNA3.1, wild-type (WT) BCL2, S70A or S70E transiently-transfected Jurkat cells, untreated or treated with DDC (400 μM) for 4 h. N = 5. (K) Western blot showing S345pChk1, γH2AX, Chk1, β-actin of pcDNA3.1, WT BCL2, S70A or S70E transiently-transfected Jurkat cells, untreated or treated with DDC (400 μM) for 4 h. Bar graphs showing mean and standard deviation (SD). One-way ANOVA and Sidak's multiple comparison were performed unless otherwise specified. * P ≤ 0.05, ** P ≤ 0.01, *** P ≤ 0.001, **** P ≤ 0.0001.
Next, to test if the redox-sensitive S70pBcl2 is a trigger to modulate the surge in O2.−, cells were treated with 400μM DDC and assessed at 4 and 8 h. Indeed, S70pBcl2 levels were sustained throughout the 8-h time course while S345pChk1, γH2AX and intracellular O2.− were reduced after 4 h (Figure 2H, I), therefore providing preliminary support that the redox-sensitive S70pBcl2 prevents Ri-DNA damage by regulating intracellular O2.−. We previously reported the redox dichotomy of Bcl-2, whereby overexpression of Bcl-2 in CEM cells promoted a mild pro-oxidant state while prevented further increase in intracellular O2.− when challenged with oxidative triggers (24,25). Keeping the latter observation in mind, overexpression of Bcl-2 in cancer cell lines with endogenously high O2.− would potentially display a similar effect in preventing a further surge in O2.- levels. Using Jurkat leukemia cells with endogenously higher intracellular O2.- than CEM leukemia cells (Supplementary Figure S5A), we observed that transient Bcl-2 overexpression in Jurkat cells prevented further increase in O2.- levels as compared to Bcl-2 overexpression in CEM cells, thereby supporting a redox rheostat activity of Bcl-2 (Supplementary Figure S5B-C). In addition, further overexpression of Bcl-2 in a stable Bcl-2 overexpressing CEM (CEM/Bcl-2) or human cervical carcinoma HeLa (HeLa/Bcl-2) cell line, which harbors constitutively higher intracellular O2.− (24,25,38), did not induce a further increase in O2.− levels (Supplementary Figure S5D-G). The latter observations were similarly re-capitulated in HK-1 nasopharyngeal carcinoma cells with higher endogenous intracellular O2.− levels than the C666-1 nasopharyngeal carcinoma cell line (Supplementary Figure S5H-J). Importantly, we observed a higher S70pBcl2 upon transient overexpression of Bcl-2 in Jurkat, CEM/Bcl-2, HeLa/Bcl-2 and HK-1 cells, thereby suggesting again that S70pBcl2 could modulate intracellular O2.− levels (Supplementary Figure S5C, E, G and J). To verify this, we transiently overexpressed the phosphor-mimetic (S70E) and non-phosphorylatable (S70A) mutants in Jurkat cells. Indeed, S70E (unlike S70A) not only suppressed the basal and DDC-induced intracellular O2.− levels but also blocked Ri-DNA damage (Figure 2J, K), thereby verifying the redox-modulating ability of S70pBcl2. Similarly, wild-type (WT) Bcl-2 overexpression, which results in endogenously higher S70pBcl2, also suppressed DDC-induced intracellular O2.− and Ri-DNA damage as compared to S70A (Figure 2J-K, Supplementary Figure S6). To further accentuate our findings, we have generated a stable Crispr-knockdown of BCL2 Jurkat cell line (CrisprBCL2-Jurkat) prior to transient expression of the BCL2 mutant plasmids as an extra step to avoid potential interference from the endogenous WT Bcl-2. The reduction of BCL2 expression was validated by qPCR and western blot analyses as shown by a significant 75% reduction in mRNA level and visually nearly undetectable protein expression (Supplementary Figure S7). Indeed, CrisprBCL2-Jurkat cells transiently transfected with S70A mutant plasmid displayed the highest DDC-induced intracellular O2.− as compared to CrisprBCL2-Jurkat cells transiently transfected with S70E mutant or WT BCL2 (Supplementary Figure S8). It is also noteworthy that the S70pBcl2 antibody could detect the phosphorylated band on S70E mutant (Supplementary Figure S6). This has been previously verified through Bcl-2 knockdown in both WT Bcl-2 and S70E mutant cells (28).
S70pBcl2 prevents chemotherapeutic agent-induced ROS production and subsequent Ri-DNA damage
It is worth noting that chemotherapeutic drugs such as etoposide could reduce S70pBcl2 (39). Indeed, we successfully re-capitulated this observation upon treatment with etoposide or doxorubicin (Figure 3A, B) and observed a reciprocal increase in mitochondrial and intracellular ROS levels as well as DNA damage markers and comet-tail formation (Figure 3A–D, Supplementary Figure S9). Importantly, pre-treatment with NAC reversed both etoposide- or doxorubicin-induced increases in ROS levels and subsequent Ri-DNA damage markers (Figure 3A–D). Nevertheless, the reduction of S70pBcl2 by etoposide or doxorubicin was not reversed by NAC (Figure 3A, B), thereby corroborating that S70pBcl2 functions upstream of the observed redox regulation and Ri-DNA damage. These data not only support the redox modulating role of S70pBcl2 in preventing Ri-DNA damage but also suggest that an enforced S70pBcl2 could desensitize cells to the redox and cytotoxic effects of chemotherapeutic agents. To ascertain the latter hypothesis, we overexpressed S70A and S70E mutants and measured cellular ROS levels and DNA damage. As expected, the basal levels of intracellular and mitochondrial ROS were suppressed in cells overexpressing the S70E mutant but not the S70A mutant. In addition, etoposide-induced increase in intracellular/mitochondrial ROS and Ri-DNA damage were also suppressed by S70E but not S70A (Figure 3E–G). Importantly, although the increased S70pBcl2 level with WT Bcl-2 overexpression was significantly reduced by treatment with etoposide, the residual S70pBcl2 could still partially prevent the induction of DNA damage markers as compared to S70A (Figure 3G). Similar observations were re-capitulated with immunofluorescence imaging, depicting the suppressive effect of S70E and WT Bcl-2 on γH2AX and the specific Ri-DNA damage lesion, 8-hydroxy-2’-deoxyguanisine (8-OHdG) (Figure 3H). Furthermore, transient overexpression of S70 mutants in CrisprBCL2-Jurkat verified that S70E, but not S70A, could suppress etoposide-induced DNA damage (Supplementary Figure S10). It is also expected that the re-expression of WT Bcl-2 in CrisprBCL2-Jurkat cells was unable to prevent etoposide-induced DNA damage (Supplementary Figure S10), compared to the overexpression of WT Bcl-2 in parental Jurkat cells (Figure 3G), as the level of S70pBcl2 is visually completely reduced by etoposide in CrisprBCL2-Jurkat cells, potentially due to the lower levels of WT Bcl-2. To further accentuate our findings, we performed a short 4-h treatment with commonly used chemotherapeutic agents, etoposide, doxorubicin, cisplatin and 5-flourouracil in parental Jurkat cells. Indeed, drugs that could reduce S70pBcl2 such as etoposide and doxorubicin, but not cisplatin and 5-FU, following 4-h treatment could reciprocally increase DNA damage markers (Figure 3I) and mitochondrial ROS levels (Supplementary Figure S11) markedly. It is also expected that cisplatin and 5-FU did not increase mitochondrial ROS in the absence of Bcl-2 in CrisprBCL2-Jurkat cells as our study indicates that the presence of a non-phosphorylated Bcl-2 is crucial for ROS production (Supplementary Figure S12). Taken together, we show that the levels of S70pBcl2 are inversely correlated with intracellular/mitochondrial ROS levels and DNA damage, thereby providing support that the redox-sensitive S70pBcl2 is responsible for negatively regulating ROS production and Ri-DNA damage (Figure 3J).
Figure 3.

S70pBcl2 prevents chemotherapeutic-induced ROS and subsequent DNA Damage. (A, B) Western blot showing S345pChk1, γH2AX, S70pBcl2, Chk1, Bcl-2, β-actin of Jurkat cells following pre-treatment with NAC (10 mM) for 2 h and treatment with etoposide (2.5 μM) or doxorubicin (1 μM) for 18 h. (C, D) Fold change in DCFDA or Mitosox staining levels in Jurkat cells following pre-treatment with NAC (10 mM) for 2 h and treatment with etoposide (2.5μM) or doxorubicin (1 μM) for 18 h. N = 3. (E, F) Fold change in DCFDA or Mitosox staining levels in pcDNA3.1, WT BCL2, S70A or S70E transiently-transfected Jurkat cells, treated with either DMSO or etoposide (2.5 μM) for 18 h. N = 4. (G) Western blot showing S345pChk1, γH2AX, S70pBcl2, Chk1, Bcl-2, β-actin of pcDNA3.1, WT BCL2, S70A or S70E transiently-transfected Jurkat cells, treated with either DMSO or etoposide (2.5 μM) for 18 h. (H) Confocal microscopy images showing γH2AX, 8-OHdG and DAPI (Nuclear) staining of pcDNA3.1, WT BCL2, S70A or S70E transiently-transfected Jurkat cells, DMSO (merged) or treated (individual and merged) with etoposide (2.5 μM) for 18 h. (I) Western blot showing S345pChk1, γH2AX, S70pBcl2, Chk1, Bcl-2, β-actin of Jurkat cells following treatment with increasing doses of doxorubicin, cisplatin, etoposide or 5-fluorouracil (5-FU) for 4 h. (J) Diagram showing the inverse relationship between redox-sensitive S70pBcl2 and ROS-induced DNA damage. Bar graphs showing mean and SD. One-way ANOVA and Sidak's multiple comparison were performed unless otherwise specified. * P ≤ 0.05, ** P ≤ 0.01, *** P ≤ 0.001, **** P ≤ 0.0001.
S70pBcl2 protects cancer cells against ROS stimulus or chemotherapeutic agent treatments
As S70pBcl2 could suppress intracellular ROS levels and Ri-DNA damage, we proceeded to examine if these effects were translated to an enhanced cell viability upon treatment with ROS stimulus or chemotherapeutic agents. Following the acquisition of IC50 dose for three DDC treatments of 24-h interval (72-h in total) (Figure 4A), a method to induce prolonged oxidative stress, we confirmed that DDC-induced O2.- is responsible for the reduction in cell survival as well as increase in caspase-3 cleavage, as 2-h pre-treatment with NAC reversed these effects (Figure 4B, C, Supplementary Figure S13A–C). This was similarly observed upon pre-treatment with NAC to reverse the cytotoxic effects and caspase-3 cleavage upon 24-h treatment with etoposide or doxorubicin (Figure 4D, Supplementary Figure S13A–C). Importantly, introduction of the mutant S70E (but not S70A) reversed the effects of DDC or etoposide (Figure 4E, F). These findings collectively indicate that S70pBcl2 could suppress ROS levels, thereby protecting cells from Ri-DNA damage-induced cell death.
Figure 4.
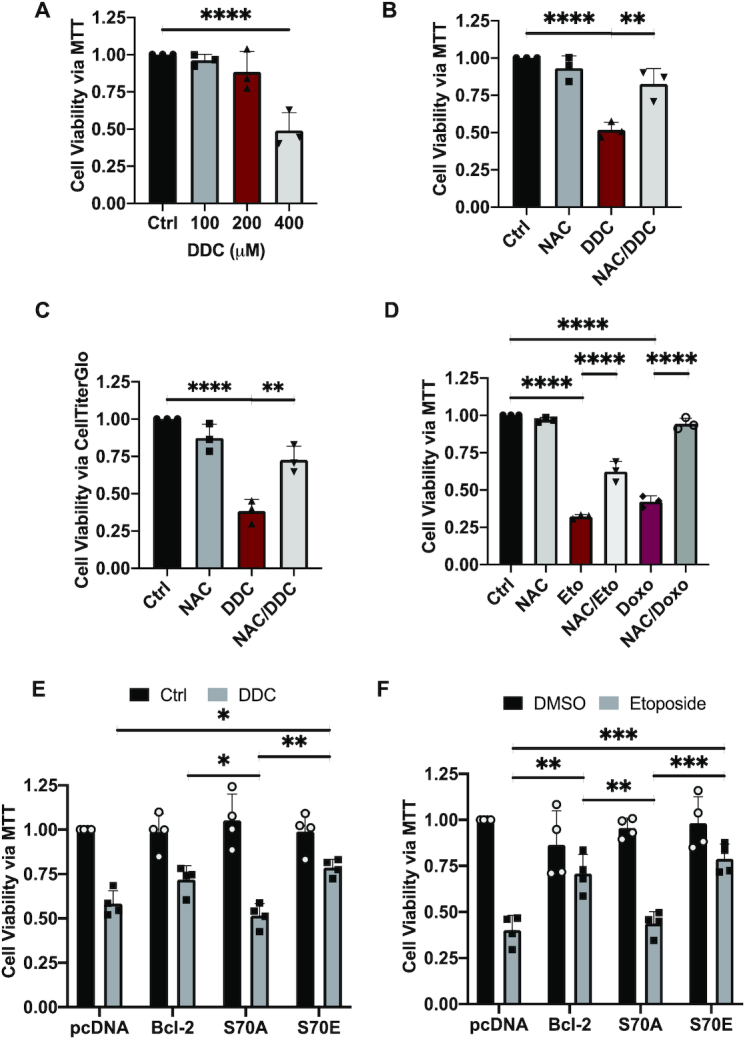
S70pBcl2 protects cancer cells from oxidative damage-induced cell death. (A) Fold change in cell viability of Jurkat cells treated with increasing doses of DDC (μM) 3 separate times at intervals of 24 h for 72 h. Cell viability measured by MTT assay. N = 3. (B, C) Fold change in cell viability of Jurkat cells pre-treated with NAC (10 mM) for 2 h and treated with DDC (400 μM) three separate times at intervals of 24 h for 72 h. Cell viability measured by MTT or CellTiterGlo assay. N = 3. (D) Fold change in cell viability of Jurkat cells pre-treated with NAC (10 mM) for 2 h and treated with either etoposide (2.5 μM) or doxorubicin (1 μM) for 24 h. Cell viability measured by MTT assay. N = 3. One-way ANOVA and Sidak's multiple comparison were performed for A–D. (E, F) Fold change in cell viability of pcDNA3.1, WT BCL2, S70A or S70E transiently-transfected Jurkat cells treated with either DDC (400 μM) three separate times at intervals of 24 h for 72 h or etoposide (2.5 μM) for 24 h. Cell viability measured by MTT assay. N = 4. Bar graphs showing mean and SD. Two-way ANOVA and Sidak's multiple comparison were performed for E and F. * P ≤ 0.05, ** P ≤ 0.01, *** P ≤ 0.001, **** P ≤ 0.0001.
S70pBcl2 negatively regulates the mitochondrial machinery
The first plausible explanation for the redox rheostat activity of S70pBcl2 is its ability to increase anti-oxidant proteins such as SOD1 or SOD2. However, our data showed that S70A and S70E overexpression in Jurkat or HK1 cells did not change the protein levels of SOD1 or SOD2 (Supplementary Figure S14A, B). Similarly, the cellular SOD activity was not substantially altered in the Bcl-2-mutant expressing cells, compared to DDC-treated positive control cells (Supplementary Figure S14C). On the other hand, we previously demonstrated the involvement of mitochondrial complex-IV subunit, COX5A, in mitochondrial ROS production, via its binding to the BH2 and C-terminal domains of Bcl-2 to facilitate efficient mitochondrial complex-IV assembly (25). With that in mind, we first confirmed the involvement of COX5A in regulating mitochondrial ROS production and DNA damage upon etoposide treatment by partially knocking down COX5A with low dose of siRNAs (20 nM). We reason that complete knockout of COX5A could lead to mitochondrial dysfunction, further ROS production and DNA damage. Indeed, partial COX5A knockdown was accompanied by reduced mitochondrial ROS production and Ri-DNA damage upon etoposide treatment, with no rescue of etoposide-mediated S70pBcl2 reduction (Figure 5A, B). This confirms the involvement of COX5A in regulating ROS production and Ri-DNA damage, downstream of the effect of S70pBcl2. Corroborating these findings, TCGA analyses revealed enhanced COX5A mRNA levels in diffuse large B-cell lymphoma, compared to non-lymphoma samples, which further suggests the need for hematologic cancers to harbor elevated S70pBcl2 to keep oxidative stress at manageable levels (Figure 5C). Importantly, co-immunoprecipitation assay showed that Bcl-2 has a lower interaction with COX5A when S70pBcl2 was upregulated by either DDC or siSOD1 treatment (Figure 5D–F). Inversely, immunoprecipitated COX5A showed no interaction with S70pBcl2. Input showing the S70pBcl2 band is included next to the co-IP as a control to denote the position of S70pBcl2, which is absent in the IP lane, as well as to ascertain a functional S70pBcl2 antibody (Supplementary Figure S15A). Furthermore, we treated Jurkat cells with venetoclax, a Bcl-2 specific BH3 mimetic, previously shown to reduce S70pBcl2 (28), and observed a reciprocal drop in S70pBcl2 and increase in Bcl-2 and COX5A interaction (Supplementary Figure S15B). Moreover, induced expression of S70E mutant similarly displayed reduced Bcl-2-COX5A interaction as compared to S70A (Figure 5G). Absence of IgG control interaction further ascertained the authenticity of Bcl-2-COX5A interaction (Figure 5D–G). In addition, COX5A expression levels were constant in all whole cell lysates (input) (Figure 5D-G), indicating that the reduced interaction between Bcl-2 and COX5A is not due to a drop in COX5A expression. In addition, as Bcl-2 and COX5A are both membrane-imbedded proteins, it is therefore crucial to preserve the membrane integrity of the mitochondria to assess the interaction between Bcl-2 and COX5A. To do so, we made use of the proximity ligation assay (PLA), which permits visualization of protein-protein interaction in situ without the need for cell and/or mitochondrial membrane lysis, unlike the co-IP assay. Indeed, only S70A-expressing CrisprBCL2-Jurkat cells showed interaction between Bcl-2 and COX5A, as indicated by the discrete red spots, as compared to WT Bcl-2 and S70E (Supplementary Figure S15C). As expected, pcDNA-vector expression in CrisprBCL2-Jurkat cells did not show discrete red spots due to the virtual absence of Bcl-2 and therefore, the lack of Bcl-2-COX5A interaction. This also serves as a negative control, on top of our blank negative control with no primary antibodies. We also ensured that COX5A expression was not affected in the S70 mutant-expressing CrisprBCL2-Jurkat cells, as shown by western blot analysis (Supplementary Figure S15C). Co-IP was also performed in three lymphoma patient samples. As the amount of immunoprecipitated Bcl-2 was different in these patients, the co-immunoprecipitated COX5A was normalized to Bcl-2 levels. We observed a similar trend of reduced interaction in direct correlation with S70pBcl2 expression in these lymphoma patient samples (Figure 5H). As an added step, we have used the conventional immunofluorescence imaging analysis to assess the localization of Bcl-2 and COX5A. Indeed, we observed a diminished co-localization between Bcl-2 and COX5A in parental Jurkat cells treated with DDC (elevated S70pBcl2) or HK-1 cells transfected with S70E, but not S70A (Figure 5I, J), thereby corroborating our observed findings on the interaction assays presented above. Collectively, these data support the role of S70pBcl2 in reducing Bcl-2–COX5A interaction.
Figure 5.

S70pBcl2 modulates the mitochondrial machinery. (A) Fold change in Mitosox staining levels in Jurkat cells silenced with two independent siCOX5A (20 nM) for 48 h and subsequently treated with etoposide (2.5 μM) for 18 h. N = 3. Two-way ANOVA and Sidak's multiple comparison were performed. Bar graph showing mean and SD. ** P ≤ 0.01, *** P ≤ 0.001. (B) Western blot showing S345pChk1, γH2AX, S70pBcl2, Chk1, Bcl-2, COX5A, β-actin of Jurkat cells silenced with two independent siCOX5A (20 nM) for 48 h and subsequently treated with etoposide (2.5 μM) for 18 h. (C) Boxplot displaying bioinformatics analyses of COX5A expression in transcript per million (TPM) in patient DLBCL (n = 47) vs normal blood (n = 444). Wilcoxon signed-rank test was used. (D, E) Co-immunoprecipitation assay and western blot showing immunoprecipitated Bcl-2, immunoblotted COX5A and IgG control lane as well as reversed co-immunoprecipitation. Input showing S70pBcl2, Bcl-2, COX5A, β-actin of Jurkat cells following treatment with DDC (400 μM) for 4 h. (F) Co-immunoprecipitation assay and western blot showing immunoprecipitated Bcl-2, immunoblotted COX5A and IgG control lane. Input showing S70pBcl2, Bcl-2, COX5A, SOD1, β-actin of Jurkat cells following treatment with two independent siSOD1 (150 nM) for 48 h. (G) Co-immunoprecipitation assay and western blot showing immunoprecipitated Bcl-2, immunoblotted COX5A and IgG control lane. Input showing S70pBcl2, Bcl-2, COX5A, β-actin of Jurkat cells transiently transfected with 2 μg pcDNA3.1, WT BCL2, S70A or S70E for 30 h. (H) Co-immunoprecipitation assay and western blot showing immunoprecipitated Bcl-2 and immunoblotted COX5A of three patient-derived primary lymphoma samples. Input showing S70pBcl2 of lymphoma patient-derived primary cells. Quantification and normalization of immunoblotted COX5A (S.E.) to immunoprecipitated Bcl-2 in percentage. L.E. Long exposure, S.E. Short exposure. N = 1. (I, J) Confocal microscopy images showing localization of Bcl-2 (red), COX5A (green) or merged (with DAPI) staining of Jurkat cells treated with DDC (400 μM) for 4 h or HK-1 cells transiently transfected with 2 μg pcDNA3.1, WT BCL2, S70A or S70E for 30 h.
S70pBcl2 suppresses mitochondrial COX activity and respiration
Given that Bcl-2-COX5A interaction is critical for the functional assembly of complex-IV (25), we evaluated the functional significance of S70pBcl2 in affecting mitochondrial COX activity in Jurkat cells treated with DDC or siSOD1. Indeed, COX activity was reduced in cells treated with DDC or siSOD1 (Figure 6A, B). Similarly, S70E mutant-transfected cells exhibited significantly reduced COX activity compared to S70A mutant-transfected cells (Figure 6C). Furthermore, a concurrent reduction in basal and maximal mitochondrial respirations were observed in Jurkat cells treated with DDC (S70pBcl2-induced) (Figure 6D). Reciprocally, Jurkat cells treated with increasing concentrations of etoposide for 4 h displayed enhanced basal and maximal mitochondrial respirations (Figure 6E), which corroborated with the reduced S70pBcl2 and increased mitochondrial ROS (Figure 3A, D, I). It is also noted that etoposide treatment after 18 h decreased mitochondrial respiration (Supplementary Figure S16), which could be explained by a reduced cell viability (27). Importantly, Jurkat cells expressing the S70E mutant exhibited reduced basal and maximal mitochondrial respirations as compared to S70A mutant (Figure 6F). Finally, we measured mitochondrial ROS production following siSOD1 or S70 mutant transfection. Indeed, siSOD1 and S70E expression, but not S70A, showed reduced mitochondrial ROS levels (Figure 6G, H). Taken together, our findings show that S70pBcl2 is a critical intracellular redox sensor and functions to prevent Ri-DNA damage and cell death by regulating mitochondrial machinery, activity and redox metabolism (Figure 7G).
Figure 6.

S70pBcl2 modulates mitochondrial COX activity, respiration rate and ROS production. (A) Fold change in COX activity of Jurkat cells following treatment with DDC (400 μM) for 4 h. N = 3. (B) Fold change in COX activity of Jurkat cells following treatment with two independent siSOD1 (150 nM) for 48 h. N = 3. (C) Fold change in COX activity of Jurkat cells transiently transfected with 2 μg pcDNA3.1, WT BCL2, S70A or S70E for 30 h. N = 3. (D, E) One representative line graph showing the kinetics of OCR in Jurkat cells following treatment with DDC (400 μM) or increasing doses of etoposide for 4 h. Fold change of OCR taken at point 3 ∼20 min. * indicates oligomycin, FCCP or rotenone and antimycin-A injections in a timely order. N = 4. (F) One representative line graph showing the kinetic of OCR in Jurkat cells transiently transfected with 2 μg pcDNA3.1, WT BCL2, S70A or S70E for 30 h. Fold change of OCR taken at point 3 ∼20 min. * indicates oligomycin, FCCP or rotenone and antimycin-A injections in a timely order. N = 6. (G, H) Fold change of Mitosox staining levels in Jurkat cells following treatment of siSOD1 for 48 h or transiently transfected with 2 μg pcDNA3.1, WT BCL2, S70A or S70E for 30 h. N = 3 and 4 respectively. Bar graphs showing mean and SD. Two-tailed t-test was performed for A, D and G. One-way ANOVA and Sidak's multiple comparison were performed unless otherwise specified. * P ≤ 0.05, ** P ≤ 0.01, *** P ≤ 0.001, **** P ≤ 0.0001.
Figure 7.

FTY720-mediated reduction of S70pBcl2 is associated with enhanced DNA damage and cell death of CLL patient-derived primary cells upon treatment combination with Fludarabine. (A) Flow chart indicating the work sequence of obtaining peripheral blood mononuclear cells (PBMC) from CLL patients (refer to methods) to drug treatments at various timepoints prior to western blot or cell viability analysis. Primary cells were co-cultured with stroma NK.Tert cells for cell viability analysis (refer to methods). (B) Western blot showing S345pChk1, γH2AX, S70pBcl2, Chk1, Bcl-2, β-actin of CLL patient-derived primary cells following pre-treatment with FTY720 (2.5μM) for 2 h and treatment with increasing doses of fludarabine for 10 h. (C–E) Fold change of quantified and normalized S70pBcl2/Bcl-2, S345pChk1/Chk1 and γH2AX/β-actin of six CLL patient-derived primary cells following pre-treatment with FTY720 (2.5 μM) for 2 h and treatment with increasing doses of fludarabine for 10 h. N = 6 patient samples with enough cells were used for western blot analysis. FTY: FTY720, Flu10: Fludarabine 10 μM, Flu50: Fludarabine 50 μM. (F) Fold change in cell viability of N = 9 CLL patient-derived primary cells following pre-treatment with FTY720 (2.5 μM) for 2 h and treatment with increasing doses of fludarabine for 48 h. Cell viability measured by annexin V staining and gated for CLL patient-derived primary cells but not stroma NK.Tert cells. Graphs showing mean and SD. One-way ANOVA and Sidak's multiple comparison were performed for C-E. Two-way ANOVA and Sidak's multiple comparison were performed for F. * P ≤ 0.05, ** P ≤ 0.01, *** P ≤ 0.001, **** P ≤ 0.0001. (G) Diagram depicting S70pBcl2 as a sensor of oxidative stress and modulator of intracellular and mitochondrial ROS production via its manipulation of the mitochondrial machinery, activity and redox metabolism. Reduction in S70pBcl2 could be a potential sensitizing option for ROS-based chemotherapy.
Protein Phosphatase 2A activator, FTY720, sensitizes CLL patient-derived primary cells to fludarabine, in conjunction with a reduction of S70pBcl2
Given that S70pBcl2 suppresses ROS levels to protect cancer cells from oxidative stress-induced execution as well as our previous work highlighting the critical involvement of protein phosphatase 2A (PP2A) in regulating S70pBcl2 in clinical lymphomas (27), we next set out to investigate the translational relevance of our present work in primary cells derived from CLL patients. We treated these primary cells (ex vivo) with the PP2A activator, FTY720 (40–42), and asked if S70pBcl2 removal would be accompanied by an enhanced sensitization to standard DNA-damaging chemotherapeutic agent, fludarabine (Figure 7A). Notably, 2-h pre-treatment with FTY720 not only reduced S70pBcl2 but also significantly enhanced DNA damage triggered by increasing fludarabine doses after 10 h (Figure 7B–E). Importantly, a 2-h pre-treatment with FTY720 followed by 48-h incubation with increasing fludarabine doses increased apoptosis significantly (Figure 7F). It is also expected that FTY720 alone could induce cell death as the drug itself could reduce S70pBcl2 and increase DNA damage (Figure 7B–E), which again provides support for the effect of S70pBcl2. Collectively, S70pBcl2 could be a potential biomarker of drug-refractory disease, and furthermore, targeting S70pBcl2 could be a novel strategy to overcome treatment resistance in hematologic malignancies.
DISCUSSION
Our work highlighted the effect of Bcl-2 phosphorylation in blocking Ri-DNA damage-induced execution by suppressing mitochondrial redox metabolism, a novel mechanism specific to the Bcl-2 residue, serine-70. This novel observation of S70pBcl2 in preventing ROS-induced DNA damage following drug treatments could be further linked to the regulatory effects of Bcl-2 on cell cycle progression (23). Given that ROS is implicated in S-phase progression (43,44), where DNA is prone to damage (45–47), it is tempting to speculate that S70pBcl2 is the key to preventing DNA damage by reducing ROS, subsequent ROS-dependent G1/S phase transition and Ri-DNA damage. In addition, it is noted that ROS and Ri-DNA damage are upstream signals to different types of cell death such as apoptosis, necroptosis, ferroptosis or even cellular senescence (11,12,37,48–52). Thus, it is likely that the protective redox sensing and modulating functions of S70pBcl2 may not only be affecting the conventional apoptosis but also other types of ROS- and Ri-DNA-mediated cell deaths. To support this claim, we observed that DDC, etoposide or doxorubicin could also increase the phosphorylation of MLKL (S358pMLKL), a mediator of necroptosis (53), which could be reversed when ROS is scavenged (Supplementary Figure S13C). This indicates that ROS or possibly Ri-induced DNA damage may concurrently induce various forms of cell death, which can be prevented by S70pBcl2.
Nevertheless, how do we reconcile with the observations that an initial increase in intracellular ROS is a stimulus for S70pBcl2, but this modification functions upstream to block further increase in mitochondrial ROS generation? We contend that a slight increase in intracellular ROS, also referred to as ‘pro-oxidant state’ endows cancer cells the ability to activate growth and/or proliferative signaling (54); however, as tumor progresses over time, the chronic oxidative stress reinforces cellular anti-oxidant defence systems via a suppressed mitochondrial redox metabolism, thereby preventing an overwhelming increase in intracellular ROS with potentially deleterious/damaging consequences, i.e. DNA damage. This hypothesis is corroborated by an association between higher S70pBcl2 and later stages of lymphomas (28). Similar redox-protective mechanisms have also been reported. For example, KRAS-expressing cells could upregulate the anti-oxidant NRF2 as a protective stress response to confer chemoresistance (55). The anti-oxidant SOD2 was also shown to be suppressed at early stage of skin carcinogenesis but increased at later stages in response to chronic oxidative milieu (56). As such, S70pBcl2 appears to be a response to an oxidative stress milieu, by way of regulating the mitochondrial machinery to reduce mitochondrial ROS generation. In addition, as a number of chemotherapeutic agents execute cancer cells via oxidative stress-induced DNA damage, this also implies a novel non-canonical mechanism of cell death evasion exhibited by cancer cells overexpressing S70pBcl2.
COX5A plays a part in complex-IV activity, which in turn affects mitochondrial OXPHOS and respiration (25). Its expression is shown to be upregulated in various cancer types as compared to respective normal tissues (Figure 5C and Supplementary Figure S14D). Our previous work also demonstrated that the BH2-domain and C-terminal of Bcl-2 interact with COX5A, leading to a more inclusive assembly and enhanced activity of COX as well as increased mitochondrial respiration and ROS generation (24,25). Other documented findings also indicate that hyperactivated COX could increase mitochondrial ROS generation (57). Given the significance and presence of COX5A in metabolism and tumor tissues, this suggests that an upregulated COX5A is required for the induction of a pro-oxidant environment for tumorigenesis and progression. However, as we show that chemotherapeutic drugs could also leverage on this Achilles heel by overwhelming cancer cells with detrimental ROS levels and subsequent DNA damage, the importance of regulated ROS production is therefore key to drug resistance and continual cancer survival. One may also question the potential involvement of BAX in the course of ROS-induced cell death as BAX has been implicated in ROS production (58) as well as MOMP induction for conventional apoptosis. As Jurkat cells is BAX-deficient (Supplementary Figure S17) (15,59), this indicates that the observed effects are likely dependent on S70pBcl2-mediated regulation of COX5A and independent of BAX. Nevertheless, we do not dismiss the possible effects of S70pBcl2 in inhibiting BAX and preventing Bcl-2-COX5A interaction concurrently when opposing cell death that is BAX-mediated. Similarly, Bcl-2 phosphorylation and the dissociation between Bcl-2 and Beclin-1 have been implicated in autophagy activation (60), which may also serve as a protective mechanism against cell death. As we have previously shown that starvation could also induce ROS production (25), it is plausible that starvation-induced ROS could elevate S70pBcl2, thereby concurrently suppressing further increase in ROS level and initiating Beclin-1-mediated autophagy to promote cancer cell survival. Collectively, it is likely that S70pBcl2 could concurrently influence these various pathways to promote survival, particularly in a cancer cell line that expresses BAX and COX5A as well as possesses functional autophagy.
Precision medicine is a major focus of cancer therapy, whereby established biological signatures are used as guidelines to specifically target different cancers (61). In our earlier studies, we demonstrated a biological signature in clinical lymphomas, where loss of SOD1 or increase in Rac1 is associated with an increase in S70pBcl2 (27,28). Our present study further expands this biological signature whereby an increase in S70pBcl2 could block DNA damage induction. This biological signature provides a tempting precision therapeutic approach, whereby the presence of this signature (i.e. low SOD1/high Rac1: high S70pBcl2: low DNA damage) would encourage the use of drugs to reduce S70pBcl2, thereby shutting down its redox rheostat activity against ROS-dependent chemotherapy. In addition, our findings provide a plausible explanation for the low drug efficacy of certain chemo- or ROS-based therapeutics that rely on oxidative stress-induced DNA damage for cancer cell execution. For example, drugs tested pre-clinically and/or in clinical trials such as 2-methoxyestradiol, tetrathiomolybdate and Motexafin gadolinium, capable of inhibiting SOD1 and/or accumulating O2.−, may potentially experience similar response as DDC; S70pBcl2 upregulation (62–72). Paclitaxel, a chemotherapeutic agent, has also been shown to increase O2.− and Bcl-2 phosphorylation in separate studies (73–75). In these cases, it is plausible that kinases or PP2A are regulated in manners that allow for sustained S70pBcl2, thus leading to therapeutic inefficacy. That said, drug combinations that inhibit kinases or activate PP2A to reduce S70pBcl2 would allow ROS-based therapeutic drugs to manifest their full therapeutic potential in cancer treatment. Indeed, our present work explored this option by combining a pre-clinically proven PP2A activator, FTY720 (FDA-approved for multiple sclerosis) with fludarabine for treatment against CLL patient-derived primary cells. Given the effectiveness of FTY720 in reducing S70pBcl2 and sensitizing these primary cells to fludarabine as well as the continuous global effort in exploring better candidate drugs to combine with the FCR regimen (fludarabine, cyclophosphamide and rituximab) for mutated or unmutated IGHV, TP53 and/or deleted 17p CLL patients, such as the recent work on FCR with ibrutinib or duvelisib (76,77), our work provides a strong rationale for repurposing FTY720 as a partner drug for combinatorial approach with the FCR regimen for the therapeutic management of CLL, rendered refractory by elevated S70pBcl2.
DATA AVAILABILITY
Gene expression dataset and corresponding clinical information of tumor and normal samples were arranged by and downloaded from UCSC Xena (https://xenabrowser.net/datapages/).
Dataset in Affymetrix U133A2 and U133 Plus 2 platforms were downloaded from Gene Expression Omnibus1 (http://www.ncbi.nlm.nih.gov/gds) and ArrayExpress2 (http://www.ebi.ac.uk/arrayexpress/). All other data are available from the authors on reasonable request.
Supplementary Material
ACKNOWLEDGEMENTS
We would like to thank Dr Goh Boon Cher, Hematology/Oncology, National University Health System (NUHS), Singapore for generously providing HK-1 and C666-1 cell lines and Jayshree Hirpara for her assistance in processing some of the lymphoma samples. The authors would also like to acknowledge Dr Huang Yun-Ju, Ruby and Tan Tuan Zea of the NUHS Translation Centre of Development and Research (TRANSCEND) for help with the bioinformatics analyses of the DLBCL cohorts.
Contributor Information
Stephen Jun Fei Chong, Department of Physiology, Yong Loo Lin School of Medicine, National University of Singapore (NUS), Singapore, Singapore; Department of Medical Oncology, Dana-Farber Cancer Institute, Boston, MA, USA.
Kartini Iskandar, Department of Physiology, Yong Loo Lin School of Medicine, National University of Singapore (NUS), Singapore, Singapore.
Jolin Xiao Hui Lai, Department of Physiology, Yong Loo Lin School of Medicine, National University of Singapore (NUS), Singapore, Singapore.
Jianhua Qu, Department of Physiology, Yong Loo Lin School of Medicine, National University of Singapore (NUS), Singapore, Singapore.
Deepika Raman, Department of Physiology, Yong Loo Lin School of Medicine, National University of Singapore (NUS), Singapore, Singapore.
Rebecca Valentin, Department of Medical Oncology, Dana-Farber Cancer Institute, Boston, MA, USA.
Charles Herbaux, Department of Medical Oncology, Dana-Farber Cancer Institute, Boston, MA, USA.
Mary Collins, Department of Medical Oncology, Dana-Farber Cancer Institute, Boston, MA, USA.
Ivan Cherh Chiet Low, Department of Physiology, Yong Loo Lin School of Medicine, National University of Singapore (NUS), Singapore, Singapore.
Thomas Loh, Department of Otolaryngology, National University of Healthcare System (NUHS), Singapore, Singapore.
Matthew Davids, Department of Medical Oncology, Dana-Farber Cancer Institute, Boston, MA, USA.
Shazib Pervaiz, Department of Physiology, Yong Loo Lin School of Medicine, National University of Singapore (NUS), Singapore, Singapore; NUS Graduate School of Integrative Science and Engineering, NUS, Singapore, Singapore; National University Cancer Institute, NUHS, Singapore, Singapore; Faculté de Médecine, Université de Paris, Paris, France.
SUPPLEMENTARY DATA
Supplementary Data are available at NAR Online.
FUNDING
National Medical Research Council of Singapore [NMRC/CIRG/1433/2015 to S.P.]. Funding for open access charge: NMRC.
Disclosure and conflict of interest statement. S.J.F.C., K.I., J.X.H.L., J.Q., D.R., M.C., I.C.C.L., T.L. and S.P. have no financial conflict of interest. R.V. has received travel reimbursement from AbbVie and Roche. C.H. has received honoraria from AbbVie. M.D. has received institutional research support from Genentech and Ascentage Pharma and has received personal fees from AbbVie, Genentech and Ascentage Pharma. Some data included in the article have been adapted from the thesis of S.J.F.C (first author) for the fulfilment of his Doctor of Philosophy degree at the National University of Singapore.
REFERENCES
- 1. Fiers W., Beyaert R., Declercq W., Vandenabeele P.. More than one way to die: apoptosis, necrosis and reactive oxygen damage. Oncogene. 1999; 18:7719–7730. [DOI] [PubMed] [Google Scholar]
- 2. Chen S.R., Dunigan D.D., Dickman M.B.. Bcl-2 family members inhibit oxidative stress-induced programmed cell death in Saccharomyces cerevisiae. Free Radical Biol. Med. 2003; 34:1315–1325. [DOI] [PubMed] [Google Scholar]
- 3. Kim H.S., Song M.C., Kwak I.H., Park T.J., Lim I.K.. Constitutive induction of p-Erk1/2 accompanied by reduced activities of protein phosphatases 1 and 2A and MKP3 due to reactive oxygen species during cellular senescence. J. Biol. Chem. 2003; 278:37497–37510. [DOI] [PubMed] [Google Scholar]
- 4. Koh L.W., Koh G.R., Ng F.S., Toh T.B., Sandanaraj E., Chong Y.K., Phong M., Tucker-Kellogg G., Kon O.L., Ng W.H. et al.. A distinct reactive oxygen species profile confers chemoresistance in glioma-propagating cells and associates with patient survival outcome. Antioxid. Redox Signal. 2013; 19:2261–2279. [DOI] [PubMed] [Google Scholar]
- 5. Clement M.V., Hirpara J.L., Pervaiz S.. Decrease in intracellular superoxide sensitizes Bcl-2-overexpressing tumor cells to receptor and drug-induced apoptosis independent of the mitochondria. Cell Death Differ. 2003; 10:1273–1285. [DOI] [PubMed] [Google Scholar]
- 6. Pervaiz S., Ramalingam J.K., Hirpara J.L., Clement M.V.. Superoxide anion inhibits drug-induced tumor cell death. FEBS Lett. 1999; 459:343–348. [DOI] [PubMed] [Google Scholar]
- 7. Gauron C., Rampon C., Bouzaffour M., Ipendey E., Teillon J., Volovitch M., Vriz S.. Sustained production of ROS triggers compensatory proliferation and is required for regeneration to proceed. Sci. Rep. 2013; 3:2084. [DOI] [PMC free article] [PubMed] [Google Scholar]
- 8. Chong S.J.F., Lai J.X.H., Eu J.Q., Bellot G.L., Pervaiz S.. Reactive oxygen species and oncoprotein signaling-A dangerous liaison. Antioxid. Redox. Signal. 2018; 29:1553–1588. [DOI] [PubMed] [Google Scholar]
- 9. Weinberg F., Hamanaka R., Wheaton W.W., Weinberg S., Joseph J., Lopez M., Kalyanaraman B., Mutlu G.M., Budinger G.R., Chandel N.S.. Mitochondrial metabolism and ROS generation are essential for Kras-mediated tumorigenicity. PNAS. 2010; 107:8788–8793. [DOI] [PMC free article] [PubMed] [Google Scholar]
- 10. Kamata H., Honda S., Maeda S., Chang L., Hirata H., Karin M.. Reactive oxygen species promote TNFalpha-induced death and sustained JNK activation by inhibiting MAP kinase phosphatases. Cell. 2005; 120:649–661. [DOI] [PubMed] [Google Scholar]
- 11. Harrison J.F., Hollensworth S.B., Spitz D.R., Copeland W.C., Wilson G.L., LeDoux S.P.. Oxidative stress-induced apoptosis in neurons correlates with mitochondrial DNA base excision repair pathway imbalance. Nucleic. Acids. Res. 2005; 33:4660–4671. [DOI] [PMC free article] [PubMed] [Google Scholar]
- 12. Yuan L.Q., Wang C., Lu D.F., Zhao X.D., Tan L.H., Chen X.. Induction of apoptosis and ferroptosis by a tumor suppressing magnetic field through ROS-mediated DNA damage. Aging (Albany NY). 2020; 12:3662–3681. [DOI] [PMC free article] [PubMed] [Google Scholar]
- 13. Gamen S., Anel A., Perez-Galan P., Lasierra P., Johnson D., Pineiro A., Naval J.. Doxorubicin treatment activates a Z-VAD-sensitive caspase, which causes deltapsim loss, caspase-9 activity, and apoptosis in Jurkat cells. Exp. Cell Res. 2000; 258:223–235. [DOI] [PubMed] [Google Scholar]
- 14. Guo B.C., Xu Y.H.. Bcl-2 over-expression and activation of protein kinase C suppress the trail-induced apoptosis in Jurkat T cells. Cell Res. 2001; 11:101–106. [DOI] [PubMed] [Google Scholar]
- 15. Karpinich N.O., Tafani M., Schneider T., Russo M.A., Farber J.L.. The course of etoposide-induced apoptosis in Jurkat cells lacking p53 and Bax. J. Cell. Physiol. 2006; 208:55–63. [DOI] [PubMed] [Google Scholar]
- 16. Konopleva M., Konoplev S., Hu W., Zaritskey A.Y., Afanasiev B.V., Andreeff M.. Stromal cells prevent apoptosis of AML cells by up-regulation of anti-apoptotic proteins. Leukemia. 2002; 16:1713–1724. [DOI] [PubMed] [Google Scholar]
- 17. Konopleva M., Tari A.M., Estrov Z., Harris D., Xie Z., Zhao S., Lopez-Berestein G., Andreeff M.. Liposomal Bcl-2 antisense oligonucleotides enhance proliferation, sensitize acute myeloid leukemia to cytosine-arabinoside, and induce apoptosis independent of other antiapoptotic proteins. Blood. 2000; 95:3929–3938. [PubMed] [Google Scholar]
- 18. Lisovsky M., Estrov Z., Zhang X., Consoli U., Sanchez-Williams G., Snell V., Munker R., Goodacre A., Savchenko V., Andreeff M.. Flt3 ligand stimulates proliferation and inhibits apoptosis of acute myeloid leukemia cells: regulation of Bcl-2 and Bax. Blood. 1996; 88:3987–3997. [PubMed] [Google Scholar]
- 19. Blombery P., Thompson E., Nguyen T., Birkinshaw R.W., Gong J., Chen X., McBean M., Thijssen R., Conway T., Anderson M.A. et al.. Multiple BCL2 mutations co-occurring with Gly101Val emerge in chronic lymphocytic leukemia progression on venetoclax. Blood. 2020; 135:773–777. [DOI] [PMC free article] [PubMed] [Google Scholar]
- 20. Blombery P., Anderson M.A., Gong J.N., Thijssen R., Birkinshaw R.W., Thompson E.R., Teh C.E., Nguyen T., Xu Z., Flensburg C. et al.. Acquisition of the recurrent Gly101Val mutation in BCL2 confers resistance to venetoclax in patients with progressive chronic lymphocytic leukemia. Cancer Discov. 2019; 9:342–353. [DOI] [PubMed] [Google Scholar]
- 21. Chong S.J.F., Davids M.S.. Breaking through BCL-2 inhibition in CLL. Blood. 2020; 135:709–711. [DOI] [PubMed] [Google Scholar]
- 22. Chong S.J.F., Marchi S., Petroni G., Kroemer G., Galluzzi L., Pervaiz S.. Noncanonical Cell Fate Regulation by Bcl-2 Proteins. Trends Cell Biol. 2020; 30:537–555. [DOI] [PubMed] [Google Scholar]
- 23. Mazel S., Burtrum D., Petrie H.T.. Regulation of cell division cycle progression by bcl-2 expression: a potential mechanism for inhibition of programmed cell death. J. Exp. Med. 1996; 183:2219–2226. [DOI] [PMC free article] [PubMed] [Google Scholar]
- 24. Chen Z.X., Pervaiz S.. Bcl-2 induces pro-oxidant state by engaging mitochondrial respiration in tumor cells. Cell Death Differ. 2007; 14:1617–1627. [DOI] [PubMed] [Google Scholar]
- 25. Chen Z.X., Pervaiz S.. Involvement of cytochrome c oxidase subunits Va and Vb in the regulation of cancer cell metabolism by Bcl-2. Cell Death Differ. 2010; 17:408–420. [DOI] [PubMed] [Google Scholar]
- 26. Chong S.J., Low I.C., Pervaiz S.. Mitochondrial ROS and involvement of Bcl-2 as a mitochondrial ROS regulator. Mitochondrion. 2014; 19:39–48. [DOI] [PubMed] [Google Scholar]
- 27. Low I.C., Loh T., Huang Y., Virshup D.M., Pervaiz S.. Ser70 phosphorylation of Bcl-2 by selective tyrosine nitration of PP2A-B56delta stabilizes its antiapoptotic activity. Blood. 2014; 124:2223–2234. [DOI] [PubMed] [Google Scholar]
- 28. Chong S.J.F., Lai J.X.H., Qu J., Hirpara J., Kang J., Swaminathan K., Loh T., Kumar A., Vali S., Abbasi T. et al.. A feedforward relationship between active Rac1 and phosphorylated Bcl-2 is critical for sustaining Bcl-2 phosphorylation and promoting cancer progression. Cancer Lett. 2019; 457:151–167. [DOI] [PubMed] [Google Scholar]
- 29. Gyori B.M., Venkatachalam G., Thiagarajan P.S., Hsu D., Clement M.V.. OpenComet: an automated tool for comet assay image analysis. Redox. Biol. 2014; 2:457–465. [DOI] [PMC free article] [PubMed] [Google Scholar]
- 30. Villalobos-Ortiz M., Ryan J., Mashaka T.N., Opferman J.T., Letai A.. BH3 profiling discriminates on-target small molecule BH3 mimetics from putative mimetics. Cell Death Differ. 2020; 27:999–1007. [DOI] [PMC free article] [PubMed] [Google Scholar]
- 31. Goldman M.J., Craft B., Hastie M., Repečka K., McDade F., Kamath A., Banerjee A., Luo Y., Rogers D., Brooks A.N. et al.. Visualizing and interpreting cancer genomics data via the Xena platform. Nat. Biotechnol. 2020; 38:675–678. [DOI] [PMC free article] [PubMed] [Google Scholar]
- 32. Tan T.Z., Miow Q.H., Miki Y., Noda T., Mori S., Huang R.Y., Thiery J.P.. Epithelial-mesenchymal transition spectrum quantification and its efficacy in deciphering survival and drug responses of cancer patients. EMBO Mol. Med. 2014; 6:1279–1293. [DOI] [PMC free article] [PubMed] [Google Scholar]
- 33. Johnson W.E., Li C., Rabinovic A.. Adjusting batch effects in microarray expression data using empirical Bayes methods. Biostatistics. 2007; 8:118–127. [DOI] [PubMed] [Google Scholar]
- 34. Kurz E.U., Douglas P., Lees-Miller S.P.. Doxorubicin activates ATM-dependent phosphorylation of multiple downstream targets in part through the generation of reactive oxygen species. J. Biol. Chem. 2004; 279:53272–53281. [DOI] [PubMed] [Google Scholar]
- 35. Macip S., Kosoy A., Lee S.W., O’Connell M.J., Aaronson S.A.. Oxidative stress induces a prolonged but reversible arrest in p53-null cancer cells, involving a Chk1-dependent G2 checkpoint. Oncogene. 2006; 25:6037–6047. [DOI] [PubMed] [Google Scholar]
- 36. Revet I., Feeney L., Bruguera S., Wilson W., Dong T.K., Oh D.H., Dankort D., Cleaver J.E.. Functional relevance of the histone gammaH2Ax in the response to DNA damaging agents. Proc. Natl. Acad. Sci. U.S.A. 2011; 108:8663–8667. [DOI] [PMC free article] [PubMed] [Google Scholar]
- 37. Venkatachalam G., Surana U., Clement M.V.. Replication stress-induced endogenous DNA damage drives cellular senescence induced by a sub-lethal oxidative stress. Nucleic. Acids. Res. 2017; 45:10564–10582. [DOI] [PMC free article] [PubMed] [Google Scholar]
- 38. Velaithan R., Kang J., Hirpara J.L., Loh T., Goh B.C., Le Bras M., Brenner C., Clement M.V., Pervaiz S.. The small GTPase Rac1 is a novel binding partner of Bcl-2 and stabilizes its antiapoptotic activity. Blood. 2011; 117:6214–6226. [DOI] [PubMed] [Google Scholar]
- 39. Chen C.L., Lin C.F., Chiang C.W., Jan M.S., Lin Y.S.. Lithium inhibits ceramide- and etoposide-induced protein phosphatase 2A methylation, Bcl-2 dephosphorylation, caspase-2 activation, and apoptosis. Mol. Pharmacol. 2006; 70:510–517. [DOI] [PubMed] [Google Scholar]
- 40. Liu Q., Zhao X., Frissora F., Ma Y., Santhanam R., Jarjoura D., Lehman A., Perrotti D., Chen C.S., Dalton J.T. et al.. FTY720 demonstrates promising preclinical activity for chronic lymphocytic leukemia and lymphoblastic leukemia/lymphoma. Blood. 2008; 111:275–284. [DOI] [PMC free article] [PubMed] [Google Scholar]
- 41. Oaks J.J., Santhanam R., Walker C.J., Roof S., Harb J.G., Ferenchak G., Eisfeld A.K., Van Brocklyn J.R., Briesewitz R., Saddoughi S.A. et al.. Antagonistic activities of the immunomodulator and PP2A-activating drug FTY720 (Fingolimod, Gilenya) in Jak2-driven hematologic malignancies. Blood. 2013; 122:1923–1934. [DOI] [PMC free article] [PubMed] [Google Scholar]
- 42. Saddoughi S.A., Gencer S., Peterson Y.K., Ward K.E., Mukhopadhyay A., Oaks J., Bielawski J., Szulc Z.M., Thomas R.J., Selvam S.P. et al.. Sphingosine analogue drug FTY720 targets I2PP2A/SET and mediates lung tumour suppression via activation of PP2A-RIPK1-dependent necroptosis. EMBO Mol. Med. 2013; 5:105–121. [DOI] [PMC free article] [PubMed] [Google Scholar]
- 43. Havens C.G., Ho A., Yoshioka N., Dowdy S.F.. Regulation of late G1/S phase transition and APC Cdh1 by reactive oxygen species. Mol. Cell. Biol. 2006; 26:4701–4711. [DOI] [PMC free article] [PubMed] [Google Scholar]
- 44. Deng X., Gao F., May W.S. Jr.. Bcl2 retards G1/S cell cycle transition by regulating intracellular ROS. Blood. 2003; 102:3179–3185. [DOI] [PubMed] [Google Scholar]
- 45. Burdak-Rothkamm S., Short S.C., Folkard M., Rothkamm K., Prise K.M.. ATR-dependent radiation-induced gamma H2AX foci in bystander primary human astrocytes and glioma cells. Oncogene. 2007; 26:993–1002. [DOI] [PubMed] [Google Scholar]
- 46. Burhans W.C., Weinberger M.. DNA replication stress, genome instability and aging. Nucleic Acids Res. 2007; 35:7545–7556. [DOI] [PMC free article] [PubMed] [Google Scholar]
- 47. Dickey J.S., Baird B.J., Redon C.E., Avdoshina V., Palchik G., Wu J., Kondratyev A., Bonner W.M., Martin O.A.. Susceptibility to bystander DNA damage is influenced by replication and transcriptional activity. Nucleic Acids Res. 2012; 40:10274–10286. [DOI] [PMC free article] [PubMed] [Google Scholar]
- 48. Kadigamuwa C., Choksi S., Xu Q., Cataisson C., Greenbaum S.S., Yuspa S.H., Liu Z.G.. Role of retinoic acid Receptor-γ in DNA damage-induced necroptosis. iScience. 2019; 17:74–86. [DOI] [PMC free article] [PubMed] [Google Scholar]
- 49. Zhang Y., Su S.S., Zhao S., Yang Z., Zhong C.Q., Chen X., Cai Q., Yang Z.H., Huang D., Wu R. et al.. RIP1 autophosphorylation is promoted by mitochondrial ROS and is essential for RIP3 recruitment into necrosome. Nat. Commun. 2017; 8:14329. [DOI] [PMC free article] [PubMed] [Google Scholar]
- 50. Redza-Dutordoir M., Averill-Bates D.A.. Activation of apoptosis signalling pathways by reactive oxygen species. Biochim. Biophys. Acta. 2016; 1863:2977–2992. [DOI] [PubMed] [Google Scholar]
- 51. Roos W.P., Kaina B.. DNA damage-induced cell death by apoptosis. Trends Mol. Med. 2006; 12:440–450. [DOI] [PubMed] [Google Scholar]
- 52. Sun L., Tan R., Xu J., LaFace J., Gao Y., Xiao Y., Attar M., Neumann C., Li G.M., Su B. et al.. Targeted DNA damage at individual telomeres disrupts their integrity and triggers cell death. Nucleic Acids Res. 2015; 43:6334–6347. [DOI] [PMC free article] [PubMed] [Google Scholar]
- 53. Wang H., Sun L., Su L., Rizo J., Liu L., Wang L.F., Wang F.S., Wang X.. Mixed lineage kinase domain-like protein MLKL causes necrotic membrane disruption upon phosphorylation by RIP3. Mol. Cell. 2014; 54:133–146. [DOI] [PubMed] [Google Scholar]
- 54. Kang J., Chong S.J., Ooi V.Z., Vali S., Kumar A., Kapoor S., Abbasi T., Hirpara J.L., Loh T., Goh B.C. et al.. Overexpression of Bcl-2 induces STAT-3 activation via an increase in mitochondrial superoxide. Oncotarget. 2015; 6:34191–34205. [DOI] [PMC free article] [PubMed] [Google Scholar]
- 55. Tao S., Wang S., Moghaddam S.J., Ooi A., Chapman E., Wong P.K., Zhang D.D.. Oncogenic KRAS confers chemoresistance by upregulating NRF2. Cancer Res. 2014; 74:7430–7441. [DOI] [PMC free article] [PubMed] [Google Scholar]
- 56. Dhar S.K., Tangpong J., Chaiswing L., Oberley T.D., St Clair D.K.. Manganese superoxide dismutase is a p53-regulated gene that switches cancers between early and advanced stages. Cancer Res. 2011; 71:6684–6695. [DOI] [PMC free article] [PubMed] [Google Scholar]
- 57. Huttemann M., Helling S., Sanderson T.H., Sinkler C., Samavati L., Mahapatra G., Varughese A., Lu G., Liu J., Ramzan R. et al.. Regulation of mitochondrial respiration and apoptosis through cell signaling: cytochrome c oxidase and cytochrome c in ischemia/reperfusion injury and inflammation. Biochim. Biophys. Acta. 2012; 1817:598–609. [DOI] [PMC free article] [PubMed] [Google Scholar]
- 58. Kirkland R.A., Windelborn J.A., Kasprzak J.M., Franklin J.L.. A Bax-induced pro-oxidant state is critical for cytochrome c release during programmed neuronal death. J. Neurosci. 2002; 22:6480–6490. [DOI] [PMC free article] [PubMed] [Google Scholar]
- 59. Brimmell M., Mendiola R., Mangion J., Packham G.. BAX frameshift mutations in cell lines derived from human haemopoietic malignancies are associated with resistance to apoptosis and microsatellite instability. Oncogene. 1998; 16:1803–1812. [DOI] [PubMed] [Google Scholar]
- 60. Wei Y., Pattingre S., Sinha S., Bassik M., Levine B.. JNK1-mediated phosphorylation of Bcl-2 regulates starvation-induced autophagy. Mol. Cell. 2008; 30:678–688. [DOI] [PMC free article] [PubMed] [Google Scholar]
- 61. Ludwig J.A., Weinstein J.N.. Biomarkers in cancer staging, prognosis and treatment selection. Nat. Rev. Cancer. 2005; 5:845–856. [DOI] [PubMed] [Google Scholar]
- 62. Trachootham D., Alexandre J., Huang P.. Targeting cancer cells by ROS-mediated mechanisms: a radical therapeutic approach. Nat. Rev. Drug Discov. 2009; 8:579–591. [DOI] [PubMed] [Google Scholar]
- 63. Huang P., Feng L., Oldham E.A., Keating M.J., Plunkett W.. Superoxide dismutase as a target for the selective killing of cancer cells. Nature. 2000; 407:390–395. [DOI] [PubMed] [Google Scholar]
- 64. Magda D., Miller R.A.. Motexafin gadolinium: a novel redox active drug for cancer therapy. Semin. Cancer Biol. 2006; 16:466–476. [DOI] [PubMed] [Google Scholar]
- 65. Tevaarwerk A.J., Holen K.D., Alberti D.B., Sidor C., Arnott J., Quon C., Wilding G., Liu G.. Phase I trial of 2-methoxyestradiol NanoCrystal dispersion in advanced solid malignancies. Clin. Cancer Res. 2009; 15:1460–1465. [DOI] [PMC free article] [PubMed] [Google Scholar]
- 66. Redman B.G., Esper P., Pan Q., Dunn R.L., Hussain H.K., Chenevert T., Brewer G.J., Merajver S.D.. Phase II trial of tetrathiomolybdate in patients with advanced kidney cancer. Clin. Cancer Res. 2003; 9:1666–1672. [PubMed] [Google Scholar]
- 67. Lowndes S.A., Adams A., Timms A., Fisher N., Smythe J., Watt S.M., Joel S., Donate F., Hayward C., Reich S. et al.. Phase I study of copper-binding agent ATN-224 in patients with advanced solid tumors. Clin. Cancer Res. 2008; 14:7526–7534. [DOI] [PubMed] [Google Scholar]
- 68. Lee K., Hart M.R., Briehl M.M., Mazar A.P., Tome M.E.. The copper chelator ATN-224 induces caspase-independent cell death in diffuse large B cell lymphoma. Int. J. Oncol. 2014; 45:439–447. [DOI] [PMC free article] [PubMed] [Google Scholar]
- 69. Lee K., Briehl M.M., Mazar A.P., Batinic-Haberle I., Reboucas J.S., Glinsmann-Gibson B., Rimsza L.M., Tome M.E.. The copper chelator ATN-224 induces peroxynitrite-dependent cell death in hematological malignancies. Free Radical Biol. Med. 2013; 60:157–167. [DOI] [PMC free article] [PubMed] [Google Scholar]
- 70. Lakhani N.J., Sarkar M.A., Venitz J., Figg W.D.. 2-Methoxyestradiol, a promising anticancer agent. Pharmacotherapy. 2003; 23:165–172. [DOI] [PubMed] [Google Scholar]
- 71. Harrison M.R., Hahn N.M., Pili R., Oh W.K., Hammers H., Sweeney C., Kim K., Perlman S., Arnott J., Sidor C. et al.. A phase II study of 2-methoxyestradiol (2ME2) NanoCrystal(R) dispersion (NCD) in patients with taxane-refractory, metastatic castrate-resistant prostate cancer (CRPC). Invest. New Drugs. 2011; 29:1465–1474. [DOI] [PMC free article] [PubMed] [Google Scholar]
- 72. Brewer G.J., Dick R.D., Grover D.K., LeClaire V., Tseng M., Wicha M., Pienta K., Redman B.G., Jahan T., Sondak V.K. et al.. Treatment of metastatic cancer with tetrathiomolybdate, an anticopper, antiangiogenic agent: phase I study. Clin. Cancer Res. 2000; 6:1–10. [PubMed] [Google Scholar]
- 73. Deng X., Gao F., Flagg T., May W.S. Jr.. Mono- and multisite phosphorylation enhances Bcl2’s antiapoptotic function and inhibition of cell cycle entry functions. PNAS. 2004; 101:153–158. [DOI] [PMC free article] [PubMed] [Google Scholar]
- 74. Haldar S., Chintapalli J., Croce C.M.. Taxol induces bcl-2 phosphorylation and death of prostate cancer cells. Cancer Res. 1996; 56:1253–1255. [PubMed] [Google Scholar]
- 75. Ren X., Zhao B., Chang H., Xiao M., Wu Y., Liu Y.. Paclitaxel suppresses proliferation and induces apoptosis through regulation of ROS and the AKT/MAPK signaling pathway in canine mammary gland tumor cells. Mol. Med. Rep. 2018; 17:8289–8299. [DOI] [PMC free article] [PubMed] [Google Scholar]
- 76. Davids M.S., Brander D.M., Kim H.T., Tyekucheva S., Bsat J., Savell A., Hellman J.M., Bazemore J., Francoeur K., Alencar A. et al.. Ibrutinib plus fludarabine, cyclophosphamide, and rituximab as initial treatment for younger patients with chronic lymphocytic leukaemia: a single-arm, multicentre, phase 2 trial. Lancet Haematol. 2019; 6:e419–e428. [DOI] [PMC free article] [PubMed] [Google Scholar]
- 77. Davids M.S., Fisher D.C., Tyekucheva S., McDonough M., Hanna J., Lee B., Francoeur K., Montegaard J., Odejide O., Armand P. et al.. A phase 1b/2 study of duvelisib in combination with FCR (DFCR) for frontline therapy for younger CLL patients. Leukemia. 2020; doi:10.1038/s41375-020-01010-6. [DOI] [PMC free article] [PubMed] [Google Scholar]
Associated Data
This section collects any data citations, data availability statements, or supplementary materials included in this article.
Supplementary Materials
Data Availability Statement
Gene expression dataset and corresponding clinical information of tumor and normal samples were arranged by and downloaded from UCSC Xena (https://xenabrowser.net/datapages/).
Dataset in Affymetrix U133A2 and U133 Plus 2 platforms were downloaded from Gene Expression Omnibus1 (http://www.ncbi.nlm.nih.gov/gds) and ArrayExpress2 (http://www.ebi.ac.uk/arrayexpress/). All other data are available from the authors on reasonable request.