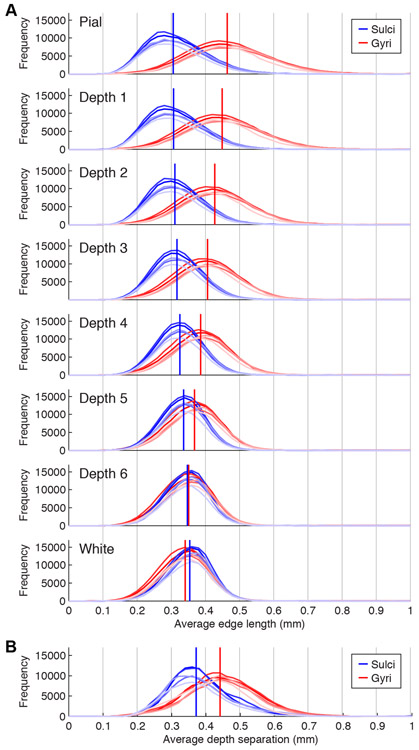
Figure 3. Resolution of cortical surface representations.
A, Histogram of edge lengths. For each vertex, we computed the average length of the edges involving that vertex. Different shades of red and blue indicate different subjects, and vertical lines indicate medians after aggregating across subjects. At outer depths, sulci exhibit decrease in edge length while gyri exhibit increase in edge length. B, Histogram of depth separations. For each vertex, we computed the distance between the locations of that vertex in adjacent surfaces (Depth 1 to 2, Depth 2 to 3, etc.) and averaged the five resulting values. Results are shown in the same format as panel A. Due to increased cortical thickness, gyri exhibit somewhat greater depth separation than sulci. All of the depicted distributions (edge lengths, depth separations) lie well below 0.8 mm, indicating that the resolution of the cortical surfaces used in this study are sufficient to support 0.8-mm fMRI measurements.

