Abstract
Optical Coherence Tomography angiography (OCTA) is a widespread tool for depth-resolved imaging of chorioretinal vasculature with single microvessel resolution. To improve the clinical interpretation of OCTA, the conditions affecting visualization of microvessels must be defined. Here we inject a scattering plasma tracer (Intralipid) during OCTA imaging of the anesthetized rat eye. In the retina, we find that interlaminar (vertical) vessels that connect laminae have one-fourth to one-third the OCTA red blood cell to tracer (RBC-to-tracer) signal ratio of intralaminar (horizontal) vessels. This finding suggests that the OCTA signal from microvessels depends on angular orientation, making vertically-oriented vessels more difficult to visualize using intrinsic contrast alone. Clinicians should be aware of this potential artifact when interpreting OCTA.
Keywords: optical coherence tomography; angiography, angular dependence, retina; choroid, scattering, vasculature
Graphical Abstract

1 ∣. INTRODUCTION
Optical coherence tomography angiography (OCTA) is widely used in ophthalmology to image chorioretinal vasculature [1, 2]. OCTA forms images based on intrinsic contrast, arising mainly from the motion of scattering red blood cells (RBCs) [3, 4], as well as other scattering cells and particles in blood [5]. Correct interpretation of OCTA requires defining the conditions under which OCTA detects microvessels. To this end, in ophthalmology, OCTA has been validated against fluorescence angiography [6], which is not depth-resolved, and endothelial labeling and ex vivo histology [7], which cannot assess RBC perfusion, the basis of OCTA contrast. Importantly, rheological phenomena are known to affect the OCTA signal. For instance, in OCTA of macrovessels, an “hourglass” pattern can be attributed to the orientation-dependent backscattering of RBCs and their alignment under external stress [8, 9], both of which are a consequence of particle asymmetry. Likewise, in OCTA of microvessels, the orientation of elongated RBCs could affect visualization; however, to date, validation studies have been unable to assess this possibility. Therefore, a depth-resolved, coregistered and in vivo validation of OCTA is needed.
Here, we provide such a validation, by injecting a highly scattering plasma tracer that fills and visualizes perfused retinal and choroidal vessels of rats in OCTA. The tracer provides a useful reference signal that enables us to assess RBC signals more quantitatively. By comparing OCTA before and after tracer filling, we assess the ability of conventional OCTA to visualize microvessels with different angular orientations. Since we use a single imaging system and contrast mechanism to validate OCTA in vivo, we avoid limitations of other complex validation studies that must co-register multiple modalities.
2 ∣. MATERIALS AND METHODS
2.1 ∣. Animal experiments and data acquisition
One Sprague-Dawley (#1) and two Long-Evans (#2, #3) rats (male, 8 weeks, Charles River) were imaged under isoflurane anesthesia by an OCTA ophthalmoscope with a center wavelength of 1300 nm, an axial resolution of 5.2 μm in tissue, and a 1/e2 beam diameter of 1.1 mm on the pupil [10]. Intralipid-20% (IL-20), a highly scattering fat emulsion which can serve as a plasma tracer [11], was injected intravenously via the tail vein (3 mL/kg) [11, 12]. RBCs form the largest cellular component of blood by volume and are assumed to account for most of the intrinsic OCTA signal. Unlike RBCs, Intralipid particles are spherically symmetric and do not produce orientation-dependent OCTA signal [10]. Volumes were acquired both before injection and at steady state (3-4 minutes after injection), at an A-scan rate of 91 kHz with 1500 axial scans at 1500 y-locations with three repeats per y-location, over a 2.9 mm (X) by 2.9 mm (Y) field. This protocol enabled us to compare OCTA images before and after contrast enhancement, by analyzing an enhancement factor (EF), to characterize the orientation-dependent OCTA signal. All animal experimental procedures and protocols were approved by the Institutional Animal Care and Use Committee at UC Davis.
2.2 ∣. OCT angiogram processing
OCTA was performed by complex OCT signal subtraction, with subsequent angiogram intensity averaging [13]. Angiograms were then layer segmented. For the choriocapillaris, the OCT angiogram data was masked with a Gaussian function in the axial direction, centered on the choriocapillaris, with a width approximately equal to the choriocapillaris layer thickness. Angiograms were weighted by the similarly masked OCT intensity data (i. e., the conventional OCT image) [13]. Then, the mean value of the weighted angiogram along the axial direction was taken as the en face projection. For the inner retina, a maximum intensity projection (MIP) of the angiogram was taken along the axial direction as the en face projection. For the enhancement factor analysis (see below), which focused on the inner retina, the background was corrected by subtracting the mean value of the lowest 20 percent of voxels in the inner retina.
2.3 ∣. Vessel angle calculation
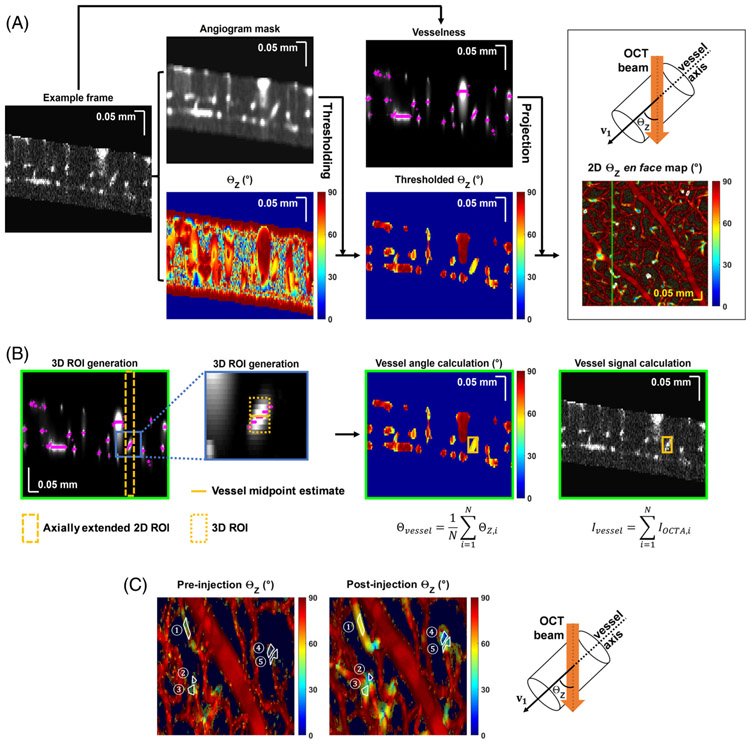
To investigate the relationship between tracer vessel enhancement and vessel orientation in the inner retina, angiograms were processed using the Frangi filter [14, 15]. Vesselness, a voxel-wise metric of likeness to a vessel lumen, was calculated in three dimensions (3D). Vessel orientation was determined by multi-scale eigen-decomposition of the local Hessian matrix, which yielded three eigenvalues (λ1, λ2 and λ3) for each angiogram voxel, with ∣λ1∣ ≤ ∣λ2∣ ≤ ∣λ3∣. Eigenvector v1 = [v1x,v1y,v1z], which corresponds to eigenvalue λ1, was regarded as the local vessel orientation, where the orientation angle relative to the incident beam (ΘZ, Figure 1A top right) was calculated as ΘZ = cos−1(∣v1z∣/∣v1∣). Note that ΘZ is noisy in regions with low OCTA signal (static tissue); therefore, ΘZ volumes were thresholded based on a blurred angiogram mask to confine analysis of ΘZ values to vessel lumens (Figure 1A).
FIGURE 1.
Data processing. (A) 2D ΘZ en face map generation. An example frame from the inner retina angiogram volume is shown, after background correction and elimination of non-inner retinal tissue. The volume is blurred to generate the angiogram mask volume, eigen-decomposed to generate vessel orientation relative to the incident OCT beam, ΘZ, and Frangi filtered to generate the vesselness volume. Vessel angle ΘZ (top right) is defined as the angle between OCT incident beam (Z axis) and vessel axis (eigenvector). The ΘZ volume is thresholded by the angiogram mask volume to remove static tissue. ΘZ values at maximum vesselness locations (magenta crosses) are projected to create the 2D en face (X and Y) ΘZ map. A 2D ROI (white polygon), selected from the en face ΘZ map (A), is then converted to a 3D ROI. (B) Starting from the vesselness frames, the axial positions (magenta crosses) of the maximum vesselness values within the 2D ROI are averaged to estimate the vessel midpoint (gold line). Then, a 7 pixel range (+/− 3 pixels, ~25.8 μm, gold box) centered on this midpoint, is used as the depth (Z) range for the final 3D ROI (the original 2D ROI delimits the 3D ROI in X and Y). Within this 3D ROI, thresholded ΘZ and angiogram values for each voxel (indexed by i) are averaged and summed, respectively, to yield the vessel orientation (Θvessel) and vessel signal (Ivessel). (C) Zoom showing corresponding 2D ROIs on pre- and post-injection en face ΘZ maps
2.4 ∣. Quantifying a tracer-referenced RBC signal through the enhancement factor
In order to quantify RBC-specific OCTA signal in microvessels of varying orientation, an enhancement factor due to Intralipid was extracted from individual microvessels in the inner retina. Specifically, two-dimensional (2D) regions of interest (ROIs), shown as white polygons in Figure 1A, were drawn to select vessels from 2D ΘZ en face maps, which displayed ΘZ values at maximum intensity locations (Z, magenta crosses in Figure 1A) of vesselness at each (X, Y) coordinate. Next, the 2D ROIs were converted to 3D ROIs. First, the average of the MIP depths across the 2D ROI was designated as the vessel midpoint. Next, the 2D ROI was extended axially three pixels above and below the midpoint (seven pixels in total, corresponding to ~25.8 μm) to create a 3D ROI (Figure 1B). Vessel signal (Ivessel) within the 3D ROI was obtained by summing the background corrected angiogram over all voxels, and vessel orientation (Θvessel) was obtained by averaging thresholded ΘZ over all voxels. Identical 2D ROIs at corresponding locations were selected in pre- and post-ΘZ en face maps (Figure 1C). The raw enhancement factor (EFRaw), defined as the ratio of the post- (Ivessel,Post) to pre- (Ivessel,Pre) injection vessel signal, was computed:
| (1) |
To remove EF modulation due to floater shadowing or alignment changes that were not a direct consequence of the injection, the raw enhancement factor was then locally normalized by a “reference” OCT inner retinal intensity (Iref) ratio:
| (2) |
The “reference” inner retinal intensity was assumed to represent mostly nonvascular tissue, whose intrinsic reflectance is not expected to change after injection. After this normalization, we assumed that the enhancement factor provided an accurate relative measurement of backscattering after and before the injection. The EF was plotted vs vessel angle to assess the impact of orientation on microvessel visibility in OCTA. To directly assess the ratio of RBC and tracer signals, an RBC-to-tracer backscattering signal ratio was computed as follows and plotted vs vessel angle:
| (3) |
3 ∣. RESULTS
3.1 ∣. Tracer injection aids visualization of retinal and choriocapillary microvessels
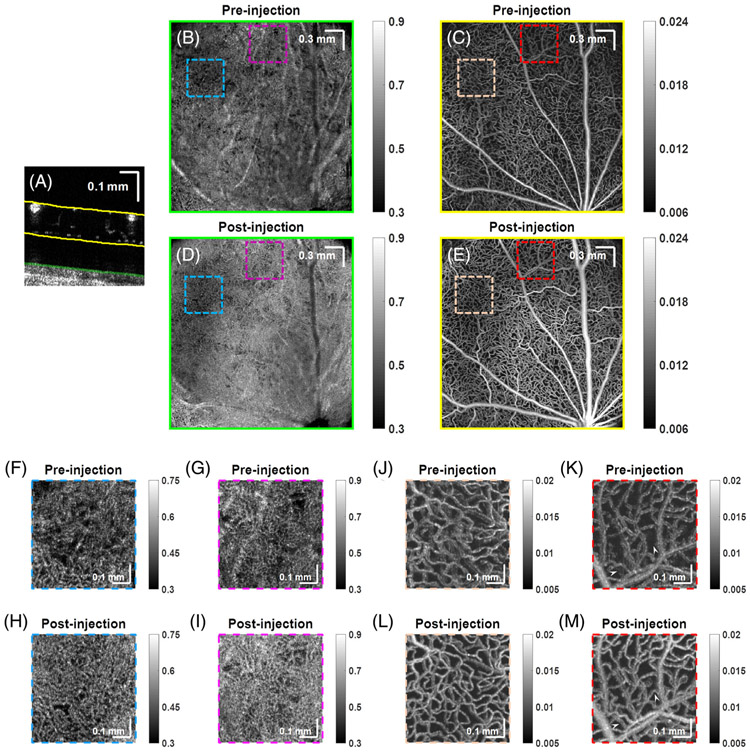
OCTA images of the choriocapillaris and inner retina (with projections based on segmentation lines in Figure 2A) of rat #1 before (Figure 2B,C) and after (Figure 2D,E) Intralipid tracer injection are shown. Detailed comparisons of regions of choriocapillaris and the inner retina (delimited by colored boxes) are shown in Figure 2F-I and Figure 2J-M. Note that dynamic range varied for Figure 2B-M, but remained consistent between pre- and post-injection images.
FIGURE 2.
Tracer injection improves visualization of microvessels. OCTA depicts the choriocapillaris and retinal microvasculature (projection depths shown in A), in rat #1 before, (B, C) and after (D, E) Intralipid tracer injection, respectively. Comparison of choriocapillaris (F-I) and inner retina (J-M) before and after injection. Arrowheads point to microvessels that are only visualized after Intralipid tracer injection
Though not the focus of our study, we first remark on the choriocapillaris. Clearly, the overall choriocapillaris signal increased after the injection. While in some regions, more vasculature was visualized (Figure 2F,H), in others, vasculature was less clearly delineated (Figure 2G,I). Differences between RBC and plasma perfusion, physiological changes and segmentation differences may all contribute to these divergent observations. We also cannot exclude the possibility of extravasation of smaller tracer particles from the fenestrated choriocapillaris.
In the inner retina, the main focus of this study, signal from microvessels increased after the injection and remained well-localized to the lumen (Figure 2J-M). Upon close inspection, some microvessel segments which lacked signal prior to injection were visualized only after the injection (Figure 2K,M, arrowheads).
3.2 ∣. Tracer injection reveals connecting (ascending or diving) vessels in retina
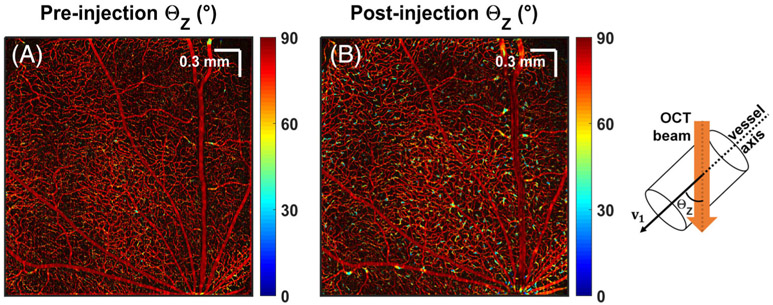
To assess the orientation dependence of the OCTA signal on RBC back scattering, microvessel angles were color-coded from ΘZ = 0° (parallel to the incident OCT beam) to 90° (en face), and shown before and after Intralipid injection (Figure 3). Microvessels mainly lie in en face laminae (red), while diving or ascending microvessels connect layers (yellow and blue). Importantly, connecting vessels were better visualized after Intralipid injection, and some were only seen afterwards (i.e. they were below the noise level before injection).
FIGURE 3.
Tracer injection reveals more ascending or diving vessels in the inner retina. Vessel orientations relative to the OCT incident beam are color-coded and shown pre- (A) and post- (B) Intralipid injection. Angles range from 0° (parallel to the incident beam) to 90° (perpendicular to the incident beam)
3.3 ∣. Vessel angular orientation determines angiogram enhancement
Enhancement factor was assessed versus microvessel angle to quantify the observations in the previous section. For all rats, enhancement factor consistently increased with decreasing vessel angle relative to the incident light (Figure 4A-C). Specifically, for rat #1, EF was ~2.0 for an ~80° vessel angle, and increased to ~5.0 for a 20 to 30° vessel angle. For rat #2 and #3, EF increased from 1.5 to 2.3, and 1.6 to 3.3, respectively, for a similar decrease in angle. Consequently, the RBC-to-tracer backscattering ratio [Equation (3)] also increased with vessel angle (Figure 4D). Assuming equal concentration of Intralipid filled vessels at different orientations and no RBC shadowing effects, the increased backscattering ratio indicates that ascending or diving microvessels have less “intrinsic” OCTA RBC signal than en face microvessels. The absolute RBC-to-tracer ratio differs between rats, likely due to variable dosages and imaging time points relative to the injection. However, trends with microvessel angle are consistent across animals (Figure 4D). Based on the backscattering ratio, assuming tracer contributions are independent of angle, our results imply signal from RBCs in 80 to 90° vessels is 3.4 ± 0.6 (mean ± SD) times that of 20 to 30° connecting vessels.
FIGURE 4.
Vessel angular orientation determines angiogram enhancement. (A-C) Enhancement factor versus vessel orientation. The line in each panel depicts a rolling average over 45 angles, and the shaded area represents the corresponding standard error. (D) RBC-to-tracer backscattering ratio changes with vessel orientation are consistent across animals
4 ∣. DISCUSSION AND CONCLUSION
Ascending and descending microvessels connecting laminae are rarely visualized [15] and have not been rigorously studied with OCTA. Our results suggest that the orientation of these microvessels with respect to the incident light may render them intrinsically more challenging to visualize with intrinsic contrast in OCTA.
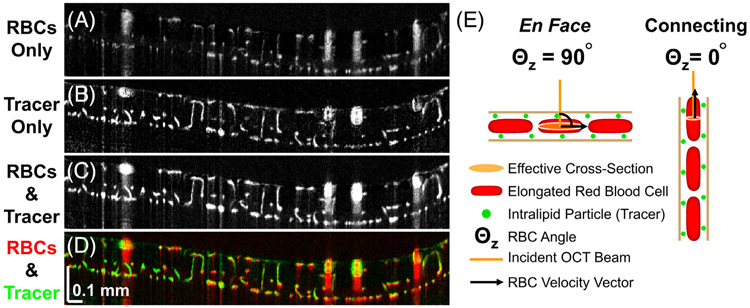
To show our results in the context of previous findings [16] and to provide a physical explanation, we refer to Figure 5, which overlays signal contributions of tracer (green) and RBCs (red) in cross section (Figure 5D). In the macrovessels, as previously described, RBCs align with respect to the shear direction, orienting their flat face parallel to the vessel wall [8]. The orientation dependence of RBC backscattering leads to higher signal at the top and bottom of vessels relative to the sides. Intralipid tracer particles are ~3000 to 5000 times smaller by volume, on average, and spherically symmetric [10, 17], leading to relatively orientation independent tracer backscattering. This explains the hourglass appearance of macrovessels; red (dominated by RBC backscattering) on top and bottom transitioning to green (dominated by tracer backscattering) on the sides, as described previously [16].
FIGURE 5.
Visual summary (A-D) and proposed explanation (E) for study results. (A-D) After Intralipid injection, signals in connecting microvessels are preferentially enhanced, as shown in overlay (D) of signal contributions from RBCs (red) and Intralipid tracer (green). (E) Intralipid particles are smaller than RBCs and spherically symmetric. Thus, Intralipid backscattering in OCTA does not depend on microvessel orientation, and Intralipid signal serves as a convenient reference. We propose that longitudinal RBC elongation contributes to the lower relative RBC signal in connecting microvessels. Due to this elongation, incident light sees a smaller effective cross section for RBCs in diving or ascending microvessels than for RBCs in en face capillaries, resulting in relatively less OCTA signal
Turning attention to the inner retinal microvessels, the focus of the present study, the overlay illustrates that connecting vessels (green) enhance more than en face capillaries (red and yellow). Assuming no differences in tracer signal, these vertical microvessels must possess less baseline OCTA signal. We propose that this microvascular finding is also explained by the orientation dependence of RBC backscattering, though the rheological explanation for RBC deformation in microvessels is different from that of macrovessels. In microvessels, theoretical [18] and experimental [19, 20] studies have shown that RBCs elongate longitudinally. Therefore, we propose that RBCs in connecting microvessels present a smaller effective cross section to the incident light than RBCs in perpendicular microvessels (Figure 5E), resulting in lower backscattering and rendering these vessels less visible in OCTA. Thus, while some microvessels connecting laminae can be detected by intrinsic contrast OCTA (Figure 3A and Figure 5A), these diving or ascending microvessels are generally less visible than en face capillaries (Figure 4A-C) and more likely to fall below the OCTA detection limit (Figure 5A,D). Increased averaging [15, 21] could help in visualizing these vessels.
Across rats (Figure 4A-C), different absolute EF values and RBC-to-tracer signal ratios are observed. This might be due to differences in Intralipid tracer dosages, or variable elapsed time between injection and post-injection data acquisition. However, allowing for potential differences in baseline tracer signal, the RBC-to-tracer signal ratio changes with vessel angle were remarkably consistent between animals. For a given animal, we assume that the tracer can serve as an orientation independent reference to quantify orientation dependent RBC signal (Figure 5E). Thus, we attribute 2.8- to 4-fold higher RBC-to-tracer signal ratio at large angles relative to small angles to differences in RBC backscattering. The Born approximation, which relates the scattering amplitude to the Fourier transform of the scattering potential, implies that an oblong scattering particle should be oriented perpendicular to the incident light to maximize backscattering [22]. Finite difference time domain simulations should be performed in the future to provide more accurate orientation-dependent backscattering calculations for elongated RBCs.
While this work is primarily intended to draw attention to the orientation dependence of OCTA signal from RBCs, it also suggests potential approaches to overcome this problem. The most obvious approach, employed here, is tracer injection. If tracer injection is not possible, more aggressive averaging strategies might detect weak RBC backscattering signal in vertical vessels [15]. Yet another potential solution is multi-angle illumination and detection [23].
Finally, we note that while orientation dependence of RBC backscattering can explain our observations (Figures 4A-C and 5A,D), hematocrit differences and sporadic RBC flow through capillaries may also contribute. In fact, in a different study [24] we attributed enhancement factor differences among different microvessel populations, all with similar angular orientation distributions, to hematocrit differences. Of note, we found no evidence either for or against hematocrit differences (or variations in any hemodynamic parameter, for that matter) in interlaminar and intralaminar retinal vessels in the literature. Another limitation of this study is the ROI selection bias; only ROIs with sufficiently high signals in both pre- and post-injection data were selected, which rules out small angle connecting vessels that only show up after injection. However, we hypothesize that inclusion of such high enhancement factor vessels at small angles would actually have strengthened the main study conclusion. Other limitations of this study are the longer OCTA wavelength compared to clinical practice, isoflurance anesthesia and differences in RBC size, microvessel diameter and rheology between rats and humans.
In spite of these limitations, this study clearly demonstrates and quantifies the orientation dependence of microvessels in OCTA for the first time. This orientation dependence should always be considered when interpreting OCTA in ophthalmology.
ACKNOWLEDGMENTS
We acknowledge funding resources from Glaucoma Research Foundation Catalyst for a Cure and National Institutes of Health (R01NS094681, R01EB029747, R21NS105043, R01EY028287 and R01EY030361).
Funding information
National Institutes of Health, Grant/Award Numbers: R01EY028287, R01EY030361, R01EY031469, R01NS094681, R01EB029747, R21NS105043
Footnotes
DISCLOSURE STATEMENT
Vivek J. Srinivasan receives royalties from Optovue, Inc.
REFERENCES
- [1].Kim DY, Fingler J, Zawadzki RJ, Park SS, Morse LS, Schwartz DM, Fraser SE, Werner JS, Proc. Natl. Acad. Sci 2013, 110, 14354. [DOI] [PMC free article] [PubMed] [Google Scholar]
- [2].Jia Y, Bailey ST, Hwang TS, McClintic SM, Gao SS, Pennesi ME, Flaxel CJ, Lauer AK, Wilson DJ, Hornegger J, Proc. Natl. Acad. Sci 2015, 112, E2395. [DOI] [PMC free article] [PubMed] [Google Scholar]
- [3].Tan AC, Tan GS, Denniston AK, Keane PA, Ang M, Milea D, Chakravarthy U, Cheung CMG, Eye 2018, 32, 262. [DOI] [PMC free article] [PubMed] [Google Scholar]
- [4].Kashani AH, Chen C-L, Gahm JK, Zheng F, Richter GM, Rosenfeld PJ, Shi Y, Wang RK, Prog. Retin. Eye Res 2017, 60, 66. [DOI] [PMC free article] [PubMed] [Google Scholar]
- [5].Tam J, Tiruveedhula P, Roorda A, Biomed. Opt. Express 2011, 2, 781. [DOI] [PMC free article] [PubMed] [Google Scholar]
- [6].Spaide RF, Klancnik JM, Cooney MJ, JAMA Ophthalmol. 2015, 133, 45. [DOI] [PubMed] [Google Scholar]
- [7].An D, Balaratnasingam C, Heisler M, Francke A, Ju M, McAllister IL, Sarunic M, Yu D-Y, Exp. Eye Res 2018, 170, 13. [DOI] [PubMed] [Google Scholar]
- [8].Cimalla P, Walther J, Mittasch M, Koch E, J. Biomed. Opt 2011, 16, 116020. [DOI] [PubMed] [Google Scholar]
- [9].Muraoka Y, Tsujikawa A, Murakami T, Ogino K, Kumagai K, Miyamoto K, Uji A, Yoshimura N, Ophthalmology 2013, 120, 91. [DOI] [PubMed] [Google Scholar]
- [10].Bernucci MT, Merkle CW, Srinivasan VJ, Biomed. Opt. Express 2018, 9, 1020. [DOI] [PMC free article] [PubMed] [Google Scholar]
- [11].Merkle CW, Srinivasan VJ, NeuroImage 2016, 125, 350. [DOI] [PMC free article] [PubMed] [Google Scholar]
- [12].Pan Y, You J, Volkow ND, Park K, Du C, NeuroImage 2014, 103, 492. [DOI] [PMC free article] [PubMed] [Google Scholar]
- [13].Srinivasan VJ, Jiang JY, Yaseen MA, Radhakrishnan H, Wu W, Barry S, Cable AE, Boas DA, Opt. Lett 2010, 35, 43. [DOI] [PMC free article] [PubMed] [Google Scholar]
- [14].Frangi AF, Niessen WJ, Vincken KL, Viergever MA, International Conference on Medical Image Computing and Computer-Assisted Intervention, Springer, Boston, USA: 1998, p. 130. [Google Scholar]
- [15].Leahy C, Radhakrishnan H, Weiner G, Goldberg JL, Srinivasan VJ, Invest. Ophthalmol. Vis. Sci 2015, 56, 5785. [DOI] [PMC free article] [PubMed] [Google Scholar]
- [16].Merkle CW, Leahy C, Srinivasan VJ, Biomed. Opt. Express 2016, 7, 4289. [DOI] [PMC free article] [PubMed] [Google Scholar]
- [17].Zhou W, Kholiqov O, Chong SP, Srinivasan VJ, Optica. 2018, 5, 518. [DOI] [PMC free article] [PubMed] [Google Scholar]
- [18].Secomb TW, Hsu R, Pries A, Am. J. Phys. Heart Circ. Phys 2001, 281, H629. [DOI] [PubMed] [Google Scholar]
- [19].Chaigneau E, Oheim M, Audinat E, Charpak S, Proc. Natl. Acad. Sci 2003, 100, 13081. [DOI] [PMC free article] [PubMed] [Google Scholar]
- [20].Li B, Esipova TV, Sencan I, Kih K, Fu B, Desjardins M, Moeini M, Kura S, Yaseen MA, Lesage F, eLife 2019, 8, e42299 https://elifesciences.org/articles/42299. [DOI] [PMC free article] [PubMed] [Google Scholar]
- [21].Gorczynska I, Migacz JV, Zawadzki RJ, Capps AG, Werner JS, Biomed. Opt. Express 2016, 7, 911. [DOI] [PMC free article] [PubMed] [Google Scholar]
- [22].Wax A, Backman V, Biomedical Applications of Light Scattering, McGraw Hill Professional, New York: 2010. [Google Scholar]
- [23].Zhou KC, Qian R, Degan S, Farsiu S, Izatt JA, Nat. Photonics 2019, 13, 794. [DOI] [PMC free article] [PubMed] [Google Scholar]
- [24].Merkle CW, Zhu J, Bernucci MT, Srinivasan VJ, NeuroImage 2019, 202, 116067. [DOI] [PMC free article] [PubMed] [Google Scholar]


