

SUMMARY
Phenotypic and functional plasticity of brain immune cells contribute to brain tissue homeostasis and disease. Immune cell plasticity is profoundly influenced by tissue microenvironment cues and systemic factors. Aging and gut microbiota dysbiosis that reshape brain immune cell plasticity and homeostasis has not been fully delineated. Using Cellular Indexing of Transcriptomes and Epitopes by sequencing (CITE-seq), we analyze compositional and transcriptional changes of the brain immune landscape in response to aging and gut dysbiosis. Discordance between canonical surface-marker-defined immune cell types and their transcriptomes suggest transcriptional plasticity among immune cells. Ly6C+ monocytes predominate a pro-inflammatory signature in the aged brain, while innate lymphoid cells (ILCs) shift toward an ILC2-like profile. Aging increases ILC-like cells expressing a T memory stemness (Tscm) signature, which is reduced through antibiotics-induced gut dysbiosis. Systemic changes due to aging and gut dysbiosis increase propensity for neuroinflammation, providing insights into gut dysbiosis in age-related neurological diseases.
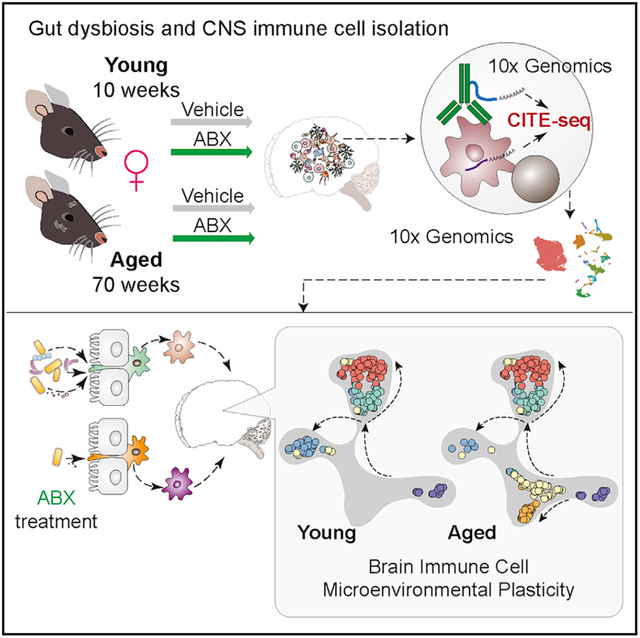
Graphical Abstract
In Brief
Golomb et al. perform cellular indexing of transcriptomes and epitopes by sequencing on immune cells from the brains of young and aged female mice with and without antibiotics-induced gut dysbiosis. Single-cell analyses reveal transcriptional plasticity of canonically identified monocytes and innate lymphoid cells in the aged brain.
INTRODUCTION
The level of immune privilege within the steady-state brain varies depending on age and neurological health (Mrdjen et al., 2018). The compositional and transcriptional heterogeneity of brain-resident and peripherally derived immune cells in the central nervous system (CNS) enables a highly dynamic and plastic immune milieu to maintain CNS homeostasis. Dysregulation of such homeostasis significantly contributes to age-related neurodegenerative diseases, neuroinflammation, and brain tumors (Dulken et al., 2019; Keren-Shaul et al., 2017; Mrdjen et al., 2018; Quail and Joyce, 2017; Tabula Muris Consortium, 2020; Ximerakis et al., 2019).
Aging contributes to the decline of tissue and immune system functionality and leads to natural perturbations of microbial composition, namely, gut microbiota dysbiosis (gut dysbiosis), which is believed to contribute to systemic inflammation (Franceschi et al., 2018; Langille et al., 2014; Levy et al., 2017; O’Toole and Jeffery, 2015; Thaiss et al., 2016). The gut microbiota engages in crosstalk with both innate and adaptive immune systems through either direct engagement of the mucosal innate immune system or commensal-derived metabolites (Belkaid and Hand, 2014). Gut dysbiosis significantly alters circulating metabolites and plasma cytokine composition, leading to dysregulation of the peripheral immune system (Arpaia et al., 2013; Bachem et al., 2019; Lehallier et al., 2019). Dysbiosis also indirectly regulates CNS immunity and neuroinflammation through microbiota-derived signaling molecules (Dinan and Cryan, 2017; Erny et al., 2015; Ma et al., 2019; Sampson et al., 2016).
Maintaining homeostasis of CNS immunity under systemic change requires CNS-resident and infiltrating immune cells to execute functional plasticity in response to both microenvironmental and systemic stimuli, such as aging and dysbiosis. Age-associated compositional and transcriptional shifting of various CNS-resident immune cells, such as microglia and border-associated macrophages (BAMs), and peripheral immune cells have been observed (Dulken et al., 2019; Mrdjen et al., 2018; Ximerakis et al., 2019). However, the age-related immune plasticity of peripherally derived brain infiltrating innate immune cells, such as Ly6C+ monocytes and innate lymphoid cells (ILCs), have not been fully delineated.
Cellular indexing of transcriptomes and epitopes by sequencing (CITE-seq) enables comprehensive single-cell immunophenotyping by connecting canonical immune cell lineage identity to the cellular transcriptional status. Here, we mapped brain immune cell plasticity in response to systemic perturbations of aging and gut dysbiosis. Using CITE-seq, our study characterizes the compositional and transcriptional plasticity of brain immunity, exemplified in the transcriptional changes among inflammatory/patrolling Ly6C+ monocytes and CNS-associated ILCs. Revealing such immune cell plasticity during aging and gut dysbiosis sheds light on critical components governing brain immunity in aging and the onset of age-related neurodegenerative disease.
RESULTS
CITE-Seq Delineates the Global Immune Cell Diversity in the Brain
To explore dynamics of the brain immune cell landscape in response to systemic changes imposed by aging and gut dysbiosis, we isolated whole brains from 12 young adult (13 weeks old, human equivalent ~20 years old) and 12 aged (73 weeks old, human equivalent ~56 years old) female mice for CITE-seq analysis (Figure 1A). Antibiotics-treated (ABX) and control groups received an antibiotic cocktail (metronidazole 0.25 g/L, vancomycin 1 g/L, neomycin 1 g/L, and ampicillin 0.5 g/L) or vehicle by oral gavage daily for 3 weeks to induce gut microbiota depletion, respectively. This cocktail was adapted from previous studies evaluating gut-brain and gut-cancer dynamics (Buchta Rosean et al., 2019; Erny et al., 2015). After 3 weeks of treatment, fecal samples were processed for 16S analysis, and brains were collected, digested, and enriched for immune cells. The immune cells were stained with a panel of 31 antibodies (Table S1) before 10X Genomics Chromium Single Cell Gene Expression analysis. The anti-bacterial efficacy of the ABX treatment strategy as well as naturally occurring gut dysbiosis in aged animals was confirmed by Illumina sequencing of the 16S rRNA V3-V4 regions of microbial DNA extracted from fecal pellets. 16S sequencing revealed that ABX treatment caused significant shifting in bacterial phyla composition and reduction in alpha diversity measured by Shannon’s diversity index, with the exception of one young control replicate with relatively low alpha diversity (Figures S1A and S1B). With ABX treatment, young and aged mice shifted from Bacteroidetes and Firmicutes being the predominant bacterial phyla, respectively, to an enrichment of Proteobacteria (Figure S1A).
Figure 1. CITE-Seq Delineates the Global Immune Cell Diversity in the Brain.
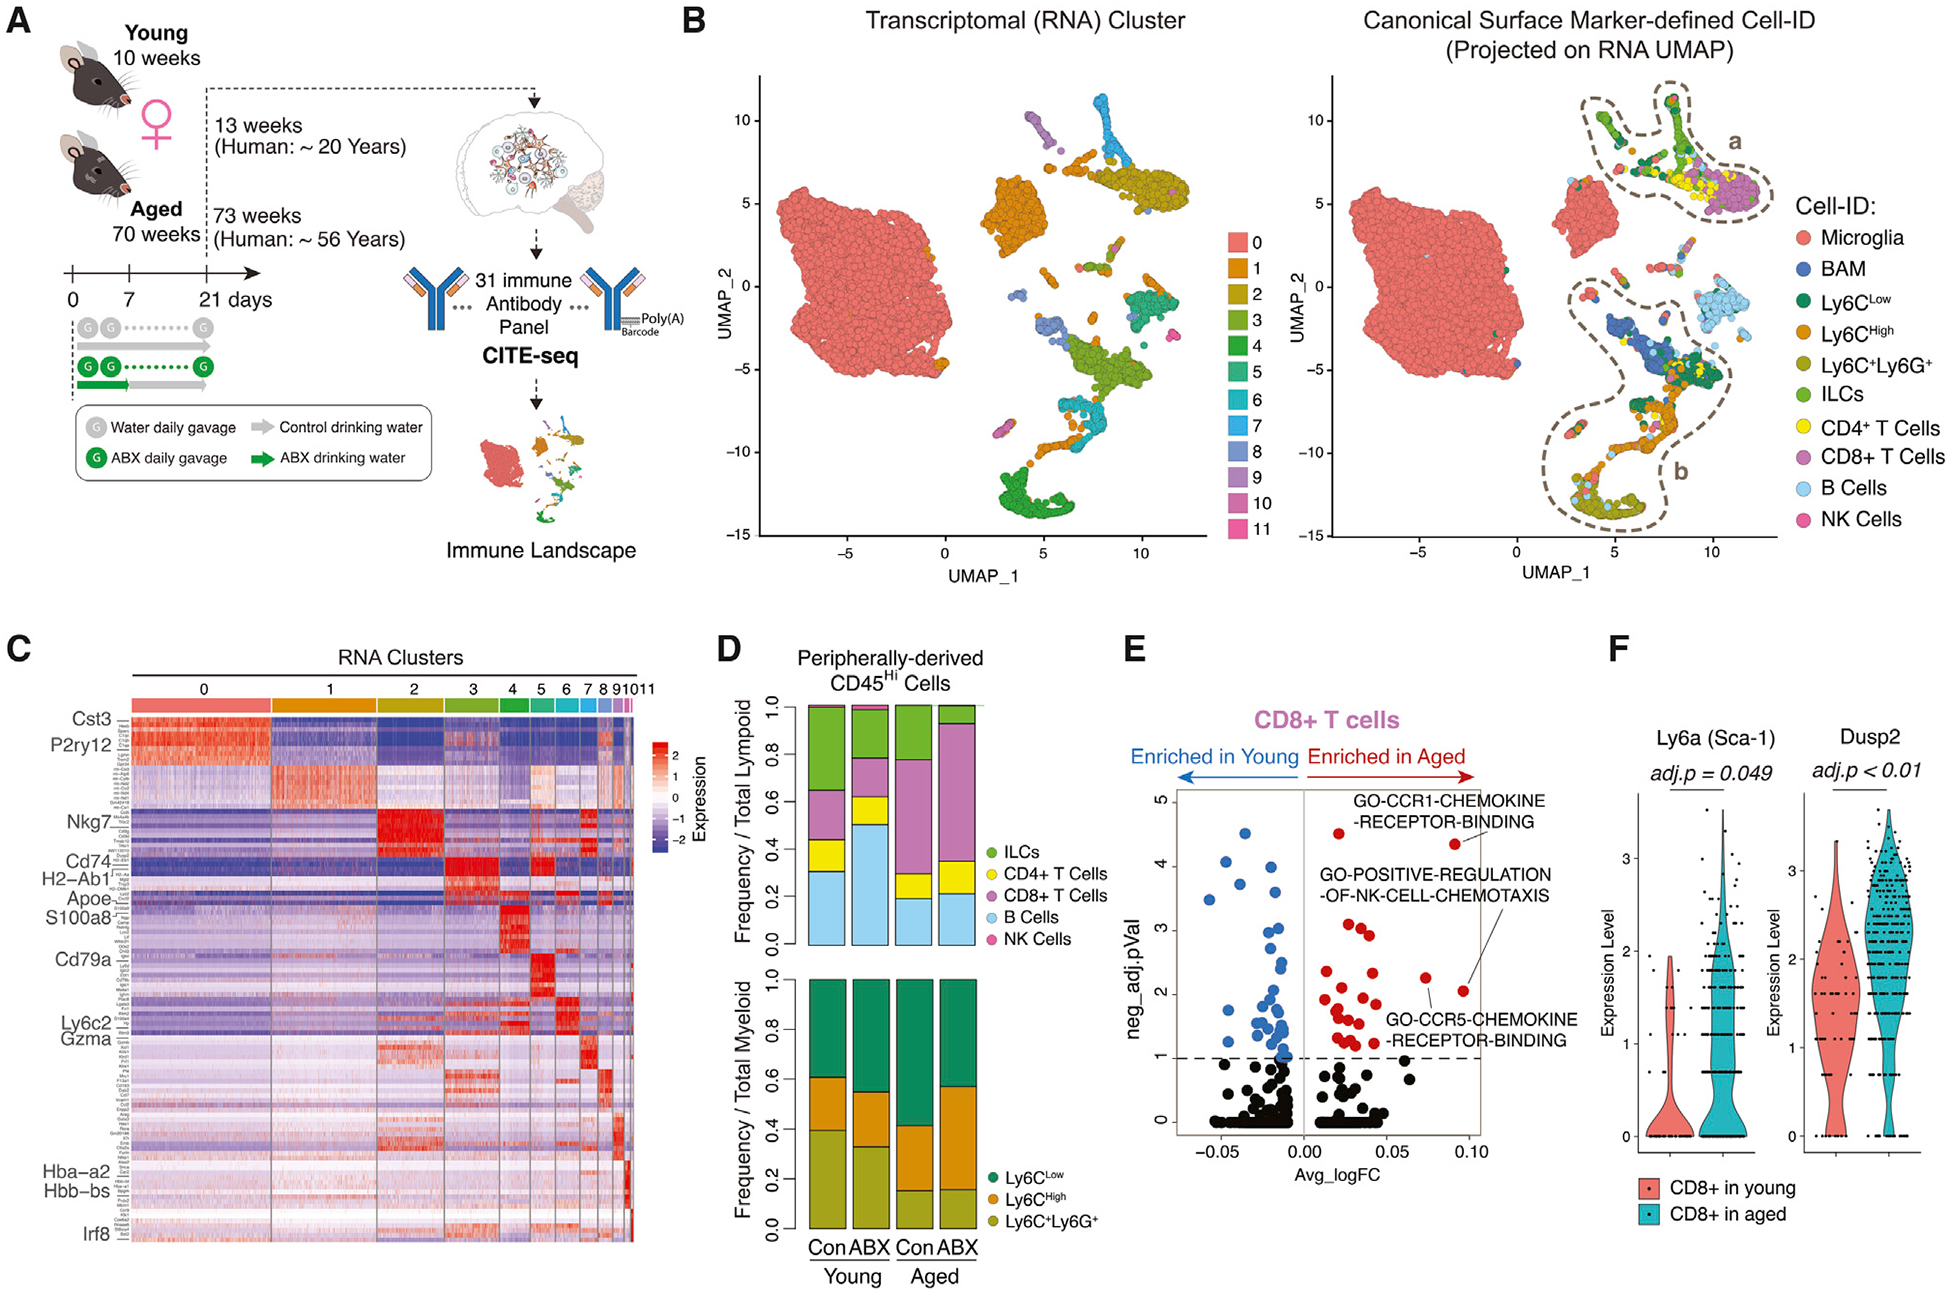
(A) Schematic of experimental approach.
(B) Single cells projected onto UMAP with cells color coded by transcriptional cluster ID (left). UMAP clustering as in left plot with cells color coded by canonical Cell-ID (right). Dashed circle (a) on peripheral lymphoid cell populations and dashed circle (b) on non-microglia myeloid cells are shown.
(C) Heatmap of top differentially expressed genes (DEGs) per transcriptional cluster.
(D) Stacked bar charts of peripheral lymphoid cells (top) and peripheral myeloid cells (bottom) frequencies (n = 3 biological replicates per group).
(E) Volcano plot of differentially enriched gene pathways (DEGPs) in CD8+ T cells between aged and young.
(F) Violin plots of Ly6a and Dusp2 expression in CD8+ T cells in young and aged (n = 3 biological replicates per group).
All plots were derived from pooling three biological replicates per experimental condition. Data in (E) and (F) were analyzed by Wilcoxon rank-sum test. Also see Tables S1, S2, S3 and S4.
To analyze the transcriptional similarities and profiles among the immune cells, single cells were clustered using a principal-component analysis (PCA)-based approach and projected by Uniform Manifold Approximation and Projection (UMAP) onto a two-dimensional plot (Figure 1B left). Clustering revealed 11 transcriptionally distinct clusters of cells present in all samples. Gene signatures for each cell cluster were generated by differential gene expression analyses to comparing one cluster to the other clusters in the dataset (Figure 1C; Table S2). CITE-seq enabled a joint analysis in which we performed traditional canonical surface-marker-based gating using CITE-seq antibodies (Figure S1C) followed by projection of the canonically identified cell (Cell-ID) distribution on the transcriptome-based UMAP plot (Figure 1B, right). Canonically identified cells segregated into different clusters that were generally mutually exclusive; however, it was noted that there was increased heterogeneity among the peripherally derived lymphoid and myeloid populations (dashed lines a and b) (Figure 1B, right; Figure S2A). The majority (72%) of brain immune cells consisted of CNS-native microglia (CD45Low,CD11b+,CD38Low,MHC-IILow, Tmem119+,Mrc1−). BAMs made up 3.9% of all collected immune cells (Table S3). BAMs were distinguished from microglia by expression of CD38, MHC-II, and Mrc1 and lack of Tmem119 expression (Mrdjen et al., 2018).
Peripherally derived CD45Hi innate and adaptive immune cells were present at lower frequencies (24%) among all of the collected leukocytes but exhibited variability in lymphoid and myeloid subset proportions among the four conditions (Figure 1D; Table S3). Peripherally derived CD45Hi immune cells were segregated into lymphoid and myeloid categories. There was more variable shifting among B cells (between young control and young ABX), CD8+ T cells (between young and aged), and ILCs (across all groups). Compared to young controls, young ABX mice had slightly increased frequency of B cells within the lymphoid compartment, from 2.6% in young control to 4.3% in young ABX. B cells were relatively stable in maintaining the RNA cluster 5 gene signature (Cd79a, Ly6d, and Iglc2) but displayed ABX-associated dispersion into other transcriptional clusters (clusters 1, 3, 4, and 11). Dispersion away from the main cluster was apparent by the slight decrease in Cell-ID B cell abundance within RNA cluster 5 (young control: 75%, young ABX: 68%, aged control: 68%, aged ABX: 54%) (Table S3).
T cells identified by CD3 surface protein expression and Thy1+/Itga2+/Klrb1- mRNA expression (Figure S1C) were further segregated into CD4+ T cells (1.7% of leukocytes) and CD8+ T cells (5.7% of leukocytes) (Table S3). Consistent with previous reports, there was increased frequency of CD8+ T cells in aged control (8.3%) and aged ABX (11%) compared to young control (1.6%) and young ABX (1.6%) mice (Dulken et al., 2019) (Figure 1D; Table S3). We explored the age-dependent transcriptional differences in the CD8+ T cell population using gene set variation analysis (GSVA) (Hänzelmann et al., 2013). CD8+ T cells in aged mice were enriched in gene pathway components associated with immune cell chemotaxis (Figure 1E; Table S4). CD8+ T cells from aged mice overexpressed Ly6a (average log fold change [FC] = 0.646, adjusted p < 0.05), a stem cell marker, and Dusp2 (average log FC = 0.639, adjusted p = 5.89E-05) (Figure 1F; Table S2). The upregulation of numerous ribosomal proteins (Rpl38, Rpl37, Rpl39) as well as Dusp2 (Figure S2B; Table S2) in the CD8+ T cells suggests they are actively proliferating or expanding within the aged brain (Dulken et al., 2019; Lang and Raffi, 2019; Zhou et al., 2015). Young and aged mice with gut dysbiosis did not experience further changes in the expression of these genes (Figure S2C; Table S2), suggesting the observed phenotype is primarily age dependent.
CD45Hi peripherally derived innate myeloid cells were segregated from lymphoid cells on the basis of Itga2 and Thy1 expression (Figure S1C). Ly6C+ myeloid cells, largely present in RNA clusters 1, 3, 4, and 6, globally expressed Ifitm3, Lgals3, and Vim (Figures 1B and 1C; Table S2). Ly6C+ cells were further segregated into three subpopulations typically described as (1) Ly6CHigh monocytes (3.1% of leukocytes, expressing Plac8, Fn1, and S100a4), (2) Ly6CLow patrolling monocytes (4.9% of leukocytes, expressing H2-Aa, H2-Eb1, and Cd74), and (3) Ly6C+Ly6G+ neutrophils (2.5% of leukocytes, expressing S100a9, S100a8, Retnlg, and Lcn2) (Figure 1C; Table S2 and S3). Among these myeloid cells, there was an age-associated shift of neutrophil frequency; however, neutrophils did not exhibit obvious signs of plasticity in the aging or gut dysbiosis contexts by maintaining the RNA cluster 4 gene signature (S100a9, S100a8, and Retnlg) (young control: 99%, young ABX: 98%, aged control: 98%, aged ABX: 98%) (Figure 1C; Table S3). In comparison to aged control and aged ABX mice, there was an increased frequency of Ly6CHigh and reduced abundance of Ly6CLow cells in the aged ABX group (Figure 1D; Table S3).
Aged Brain Is Enriched for Inflammation-Prone Brain-Resident Myeloid Cells
We identified two major CD45LoCD11b+ CNS native myeloid cell types—microglia (72% of leukocytes, expressing Cx3cr1, Tmem119, P2ry12, Hexb, and Cst3) and BAMs (3.9% of leukocytes, expressing Cd74, Apoe, H2-Aa, H2-Ab1, and Mrc1) (Table S3). Cell-ID microglia segregated into two transcriptionally distinct clusters (RNA clusters 0 and 1) (Figures 2A and 2B) but predominantly expressed the RNA cluster 0 gene signature. However, there was increased frequency of microglia within the RNA cluster 1 signature in the aged control (15%) and even higher in aged ABX (17%) in contrast to young control (11%) and young ABX (10%) (Figure 2B, top; Table S3). Compared to RNA cluster 0, cluster 1 was enriched with gene pathways involved in MHC-II protein binding, dendritic cell interaction, and macrophage cytokine production, suggesting microglia with the cluster 1 signature are in a more pro-inflammatory state (Figure 2B, bottom; Table S4). This is further supported with upregulation of mitochondrial genes (e.g., mt-Co3) and decreased expression of microglia homeostatic genes (e.g., Trem2, Cst3, and Hexb) (Figure 2C). The slight increase of cluster 1 microglia in both the aged brain and aged ABX groups implies gut dysbiosis may increase the propensity for neuroinflammatory development in the aged brain.
Figure 2. Aged Brain Is Enriched for Inflammation-Prone Brain-Resident Myeloid Cells.
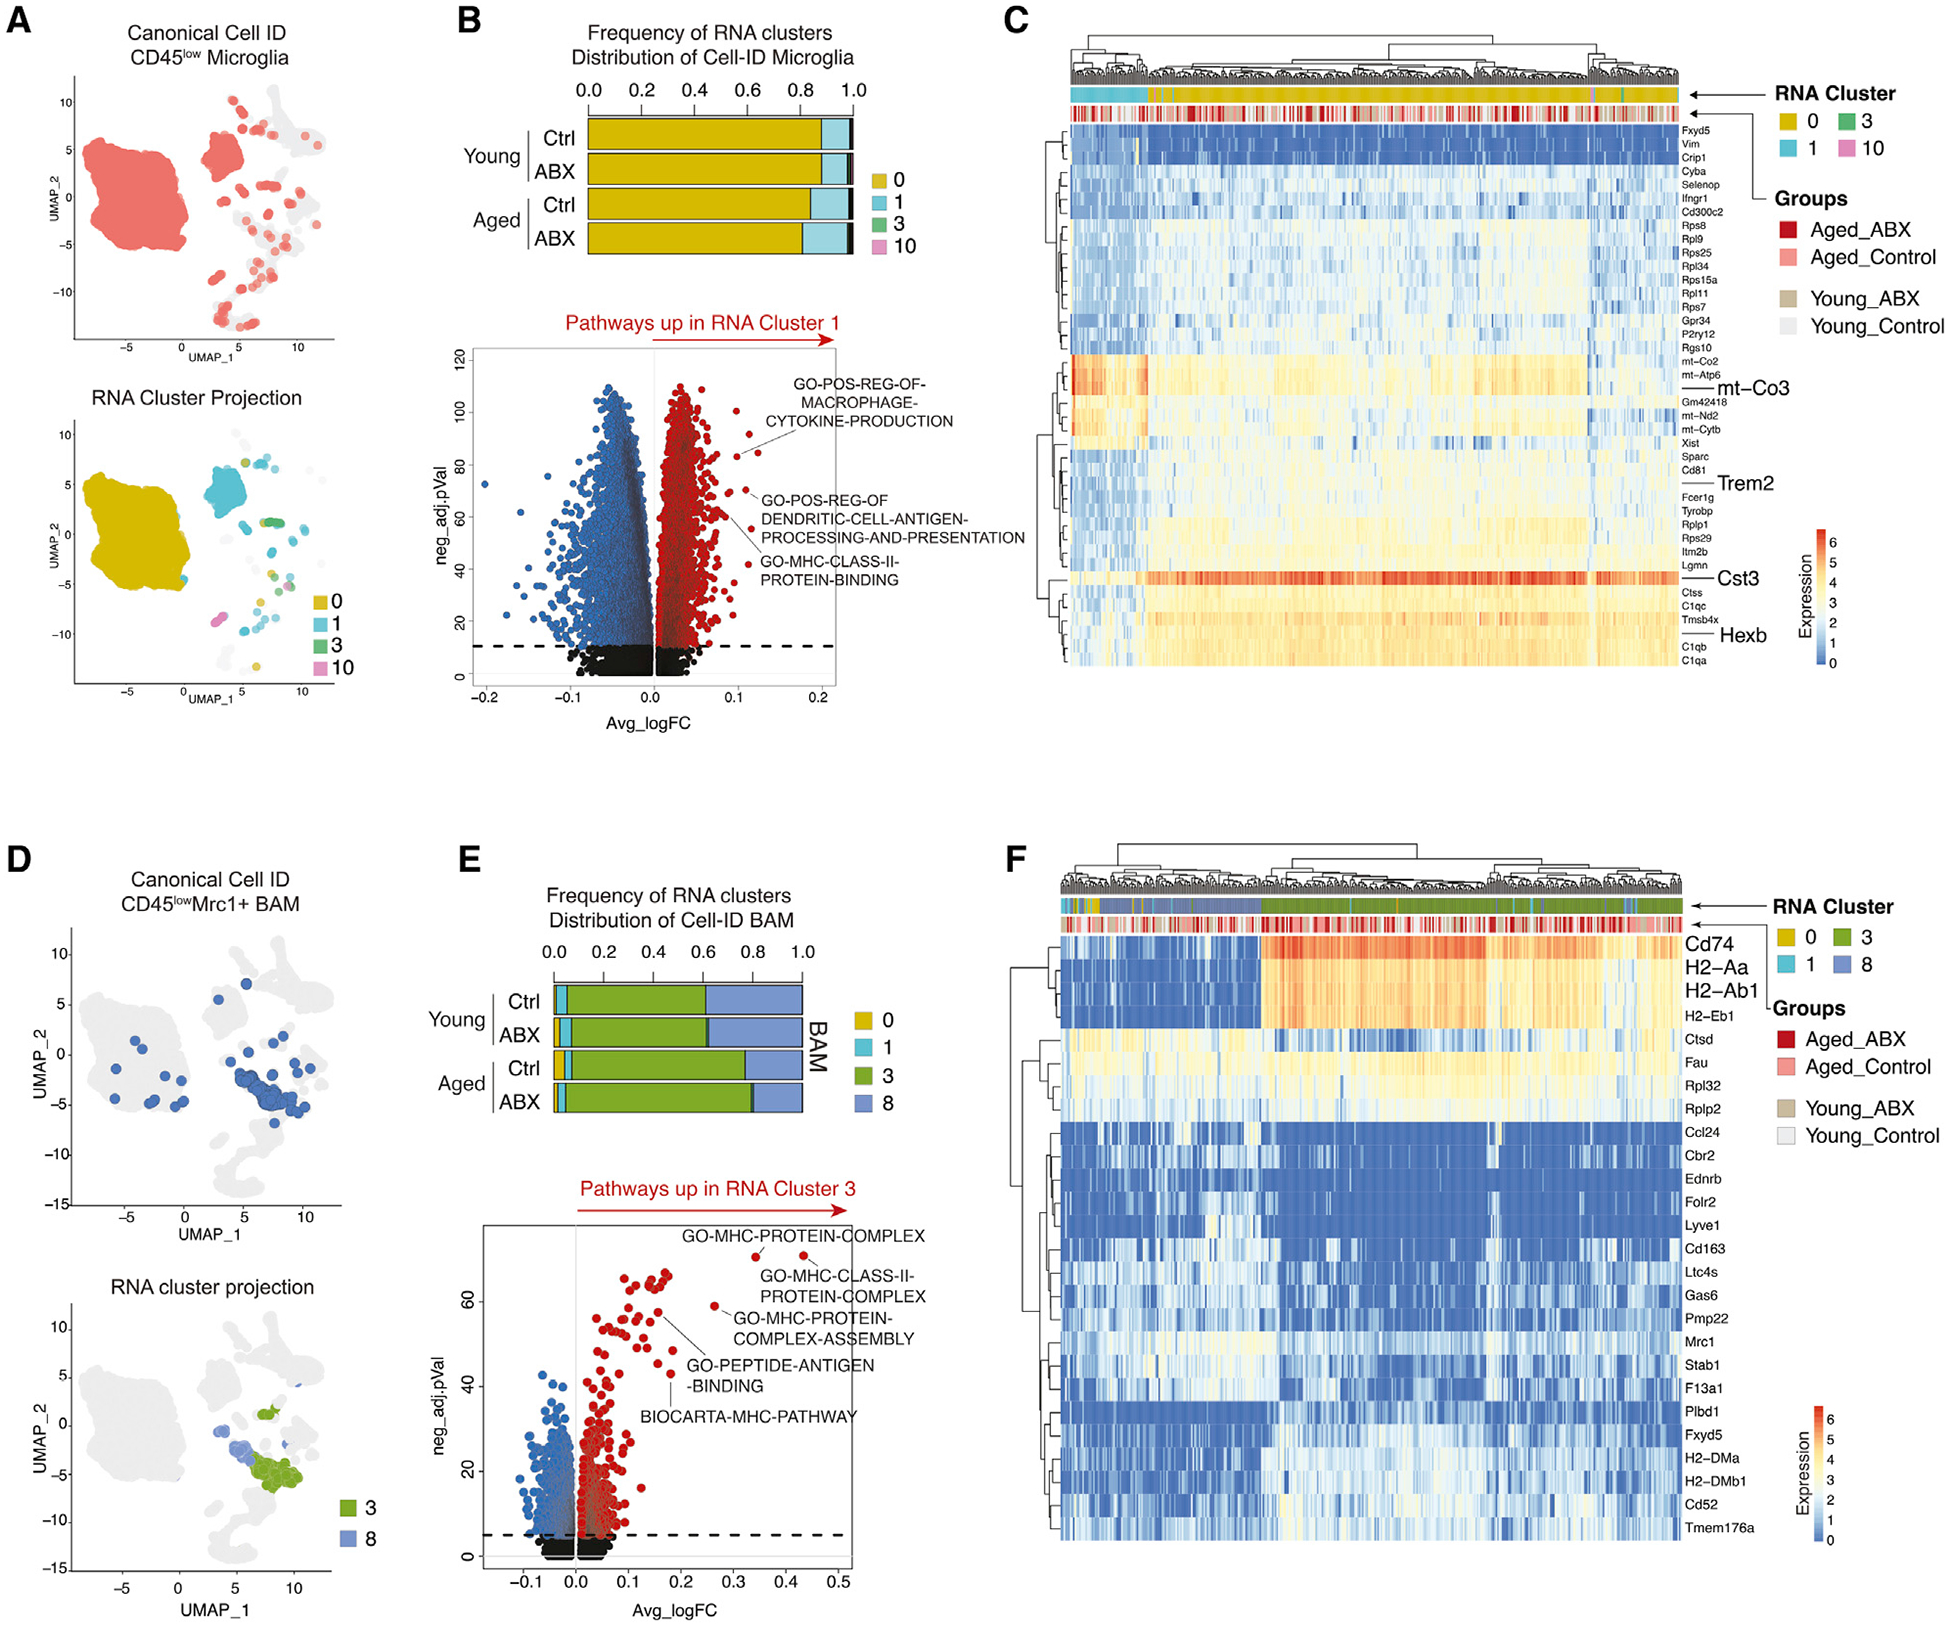
(A) UMAP clustering as in Figure 1B with Cell-ID microglia colored in pink (top) and with Cell-ID microglia colored by transcriptional clusters (bottom).
(B) Stacked bar charts of Cell-ID microglia frequencies within transcriptional clusters (n = 3 biological replicates per group) (top). Volcano plot of DEGPs between RNA cluster 1 and RNA cluster 0 (bottom) is shown.
(C) Heatmap with top 40 DEGs in Cell-ID microglia.
(D) UMAP clustering as in Figure 1B with Cell-ID BAMs in blue (top) and with Cell-ID BAMs colored by transcriptional cluster ID (bottom).
(E) Stacked bar charts of Cell-ID BAMs frequencies within transcriptional clusters (n = 3 biological replicates per group) (top). Volcano plot of DEGPs between RNA cluster 3 and RNA cluster 8 (bottom) is shown.
(F) Heatmap with top 26 DEGs in Cell-ID BAMs.
All plots were derived from pooling three biological replicates per experimental condition. Data in (B) and (E) were analyzed by Wilcoxon rank-sum test. Also see Tables S2, S3, and S4.
Cell-ID BAMs were predominantly present in RNA clusters 3 and 8 (Figures 2D and 2E). BAMs with the RNA cluster 3 gene profile from the aged control and aged ABX were in higher proportion (70% and 75%, respectively) compared to BAMs with RNA cluster 8 gene profile (23% and 20%, respectively). On the other hand, BAMs in young control and young ABX groups were split ~60% to 40% between RNA cluster 3 and 8 gene profiles, respectively (Figure 2E, top). Compared to RNA cluster 8, cluster 3 was enriched for gene pathways involved in MHC-II protein complex assembly and antigen peptide binding, which resembles a transcriptional profile described for disease-associated BAMs (Jordão et al., 2019) (Figure 2E, bottom; Table S4). Marker genes for cluster 3 (Cd74, H2-Aa, and H2-Ab1) further support MHC-II pathway enrichment and potential antigen presentation activity of BAMs (Figure 2F; Table S2). The increased proportion of BAMs with the “disease-associated” signature in aged mice suggests that BAMs in the aged CNS shift transcriptional status to adapt to an inflammation-prone CNS environment during aging.
Innate Ly6CHigh Monocytes Show Microenvironment-Dependent Plasticity in Aged Brain
Monocytes with high Ly6C surface protein expression (Ly6CHigh) are categorized as innate pro-inflammatory responders. Upon recruitment to sites of injury or infection, these cells often mature into inflammatory macrophages, secrete pro-inflammatory cytokines, and cause T cell activation but consequently elicit tissue degradation (Yang et al., 2014). Compared to CNS-native myeloid cells, we observed relatively increased transcriptional plasticity among the Ly6C+ compartment in response to aging (Figure 3A). In young mice, Cell-ID Ly6CHigh cells largely centered around RNA cluster 6 core signature (Figure 3A, left), but in aged control and aged ABX mice these cells exhibited a more diverse transcriptome status by spreading across several RNA clusters (Figure 3A, right). Such transcriptional heterogeneity suggests a plastic nature of this cell type in response to the aging process and gut dysbiosis. Cell-ID Ly6CHigh cells were subsetted and re-clustered into four transcriptionally distinct subclusters that varied in frequency between young and aged (Figure 3B, top). Subcluster 0 expressed inflammatory genes, including Ifitm3, Lyz2, and Cxcl2, and subcluster 3 expressed proliferation markers Mki67 and Top2a (Figure 3B, bottom; Table S2). In aged mice, there was an increased frequency of Ly6CHigh subcluster 1 and emergence of subcluster 2 with high expression of Cstg, Mpo, and Elane (Figure 3B, bottom). RNA velocity analysis of the re-clustered Ly6CHigh cells based on RNA splicing showed a prevalent continuous pattern of cell velocity vector field arrows connecting subclusters, which suggested the subclusters are closely related with potentially continuous cellular statuses (Figure S2D). Trajectory inference analysis using Slingshot through the Dyno package indicated that Ly6CHigh subclusters shift from subcluster 3 (as the root) toward subclusters 0 and 1, ending at subcluster 2 (Figure 3C, top). The trajectory analysis infers a transcriptional level relationship of dynamic cellular processes (Saelens et al., 2019). Ly6CHigh subcluster 3 had a prominent proliferative signature marked by expression of Mki67, anti-apoptotic gene, Birc5, and DNA and nucleosome structural genes (Top2a, Hist1h1b, H2afz) (Figure 3B, bottom). Ly6CHigh subcluster 0 had a pro-inflammatory signature marked by expression of interferon response genes (Ifitm3, Lyz, Ifi27l2a, Ccl6, Cxcl2, and Il1b) (Figures 3B and 3C, heatmaps). There was also a significant increase of subcluster 1 and subcluster 2 cells in the aged mouse brain. Subcluster 2 appeared unique to the aged brain with higher expression of MPO, which is associated with Alzheimer disease (Gellhaar et al., 2017; Giri et al., 2017). Ly6CHigh subcluster 1 was enriched for MHC-II complex pathways, while Ly6CHigh subcluster 2 was enriched for both MHC-II and neutrophil-mediated cytotoxicity, indicating that Ly6CHigh monocytes may experience transcriptional plasticity in response to an inflamed environment in the aged CNS (Figure 3D; Figure S2E; Table S4). A tailored query for age-related gene set variance in the Ly6CHigh population revealed that some aging brain and Alzheimer disease gene sets were dysregulated in aged Ly6CHigh cells compared to young (Figure S2F). Some of the overall changes in enrichment of these gene sets were attributed to Ly6CHigh subcluster 1, which was in higher abundance in aged mice (Figure 3B; Table S4). Evaluating covariance among bacterial families and Ly6CHigh subtype gene expression in young and aged mice revealed that the Oscillospiraceae family positively correlated with Ly6CHigh cells derived from aged mice and expression of Ctsf, Serpine2, Arhgap5, Tmem119, and Crybb1 (Figures 3E, PCA, and 3F, correlation plot, p < 0.01). Interestingly, these genes were highly expressed in Ly6CHigh subcluster 1 in the trajectory analysis, suggesting a positive correlation between the Oscillospiraceae family and Ly6CHigh cells undergoing differentiation or transcriptional shifting in the aged mouse brain, potentially promoting the emergence of subcluster 2 (Figures 3C, heatmap, and 3F). Re-clustering and subcluster proportion analyses in young and aged mice compared to their ABX-treated counterparts revealed minimal shifting of the Ly6CHigh population due to gut dysbiosis (Figure S2G). This suggests that the Ly6CHigh plasticity is more greatly affected by age-dependent changes.
Figure 3. Innate Ly6CHigh Monocytes Show Microenvironment-Dependent Plasticity in Aged Brain.
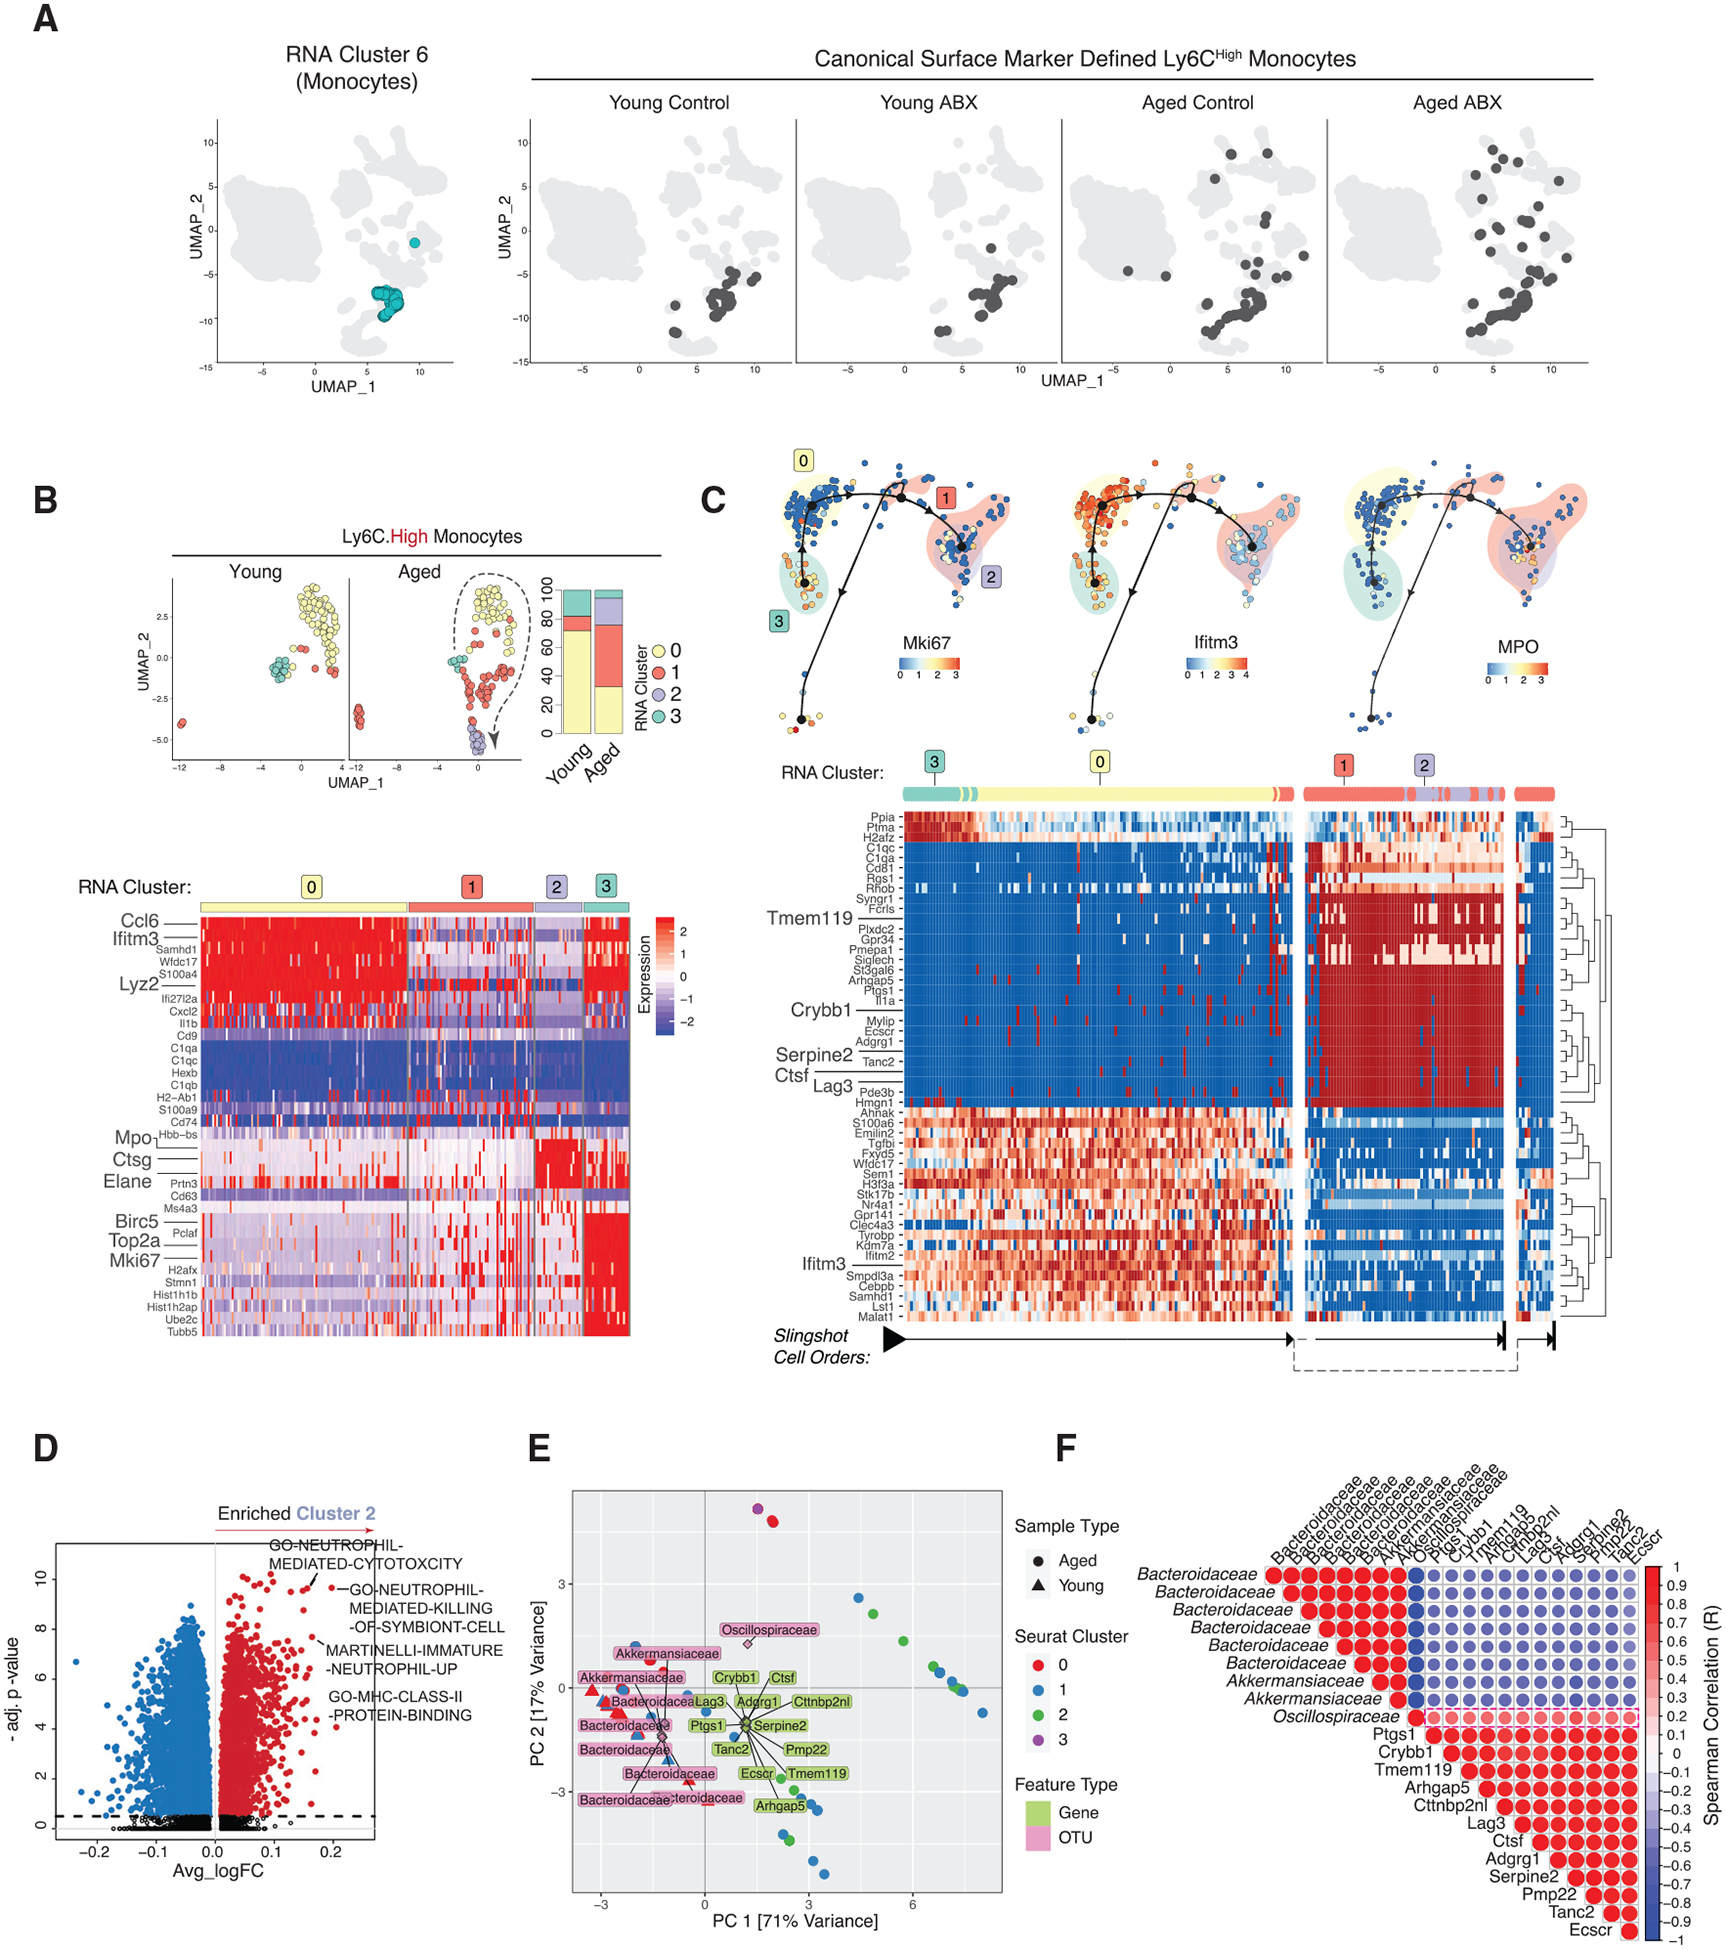
(A) UMAP clustering as in Figure 1B with RNA cluster 6 in turquoise (left) and with Cell-ID Ly6CHigh darkened (right, split by conditions).
(B) Re-clustered young and aged Ly6CHigh cells on UMAP (top left) and stacked bar charts of cluster frequencies (n = 3 biological replicates per group) (top right) and heatmap of Ly6CHigh subcluster DEGs (bottom).
(C) Trajectory of Ly6CHigh subclusters overlaid with indicated genes (top). Heatmap of trajectory DEGs in cluster ordering (bottom). Ordering is denoted by arrows at the bottom.
(D) Volcano plot of DEGPs in Ly6CHigh subcluster 2 versus all other Ly6CHigh subclusters.
(E) PCA triplot of sparse canonical correlation analysis (CCA) of microbiota families and Ly6CHigh DEGs in young and aged. Dots represent cells from aged and triangles represent cells from young. Ly6CHigh subclusters are represented by different colors. Gene names are in green and OTUs are in pink.
(F) Gene-microbial family correlation plot. Red indicates positive and blue indicates negative correlation. All correlations have corr.test p < 0.01.
All plots were derived from pooling three biological replicates per experimental condition. Data in (D) were analyzed by Wilcoxon rank-sum test. Also see Tables S2, S3, and S4.
Aged Brain Increases Ly6CLow Patrolling Monocyte Plasticity
Similar to Ly6CHigh monocytes, we explored the plastic nature of Cx3cr1HighCCR2−Ly6CLow (Ly6CLow) monocytes, which are an anti-inflammatory immune population that patrol within the lumen of blood vessels and promote tissue repair (Auffray et al., 2009). In relation to neurodegenerative disease, Ly6CLow monocytes are reported to be recruited to inflammation in the brain by vascular amyloid-beta (Aβ) microaggregates (Thériault et al., 2015). Upon recruitment, Ly6CLow monocytes perform tissue repair by internalizing and transporting Aβ microaggregates from the brain tissue into circulating blood (Michaud et al., 2013). As natural eliminators of Aβ from brain tissue, Ly6CLow immune cells serve an important role in maintaining brain tissue integrity in patients with Alzheimer disease (Saresella et al., 2014).
The Cell-ID Ly6CLow population exhibited a shifted transcriptional program associated with aging. At the RNA transcriptome level, Ly6C+ monocytes were most abundant in RNA cluster 3, marked by expression of MHC-II genes (Cd74, H2-Ab1, and H2-Aa), Lyz2, and Cxcl2 (Figures 1C and 4A, left). Visualization of Cell-ID Ly6CLow cells on the transcriptome-based UMAP revealed that these cells spread into varying transcriptional signatures and dispersion was increased in both the aged control and aged ABX conditions (Figure 4A, right). Re-clustering of these cells revealed six distinct subclusters (Figure 4B, top left). Only aged brains had Ly6CLow cells with the subcluster 5 signature and had a higher abundance of subcluster 1 (Figure 4B, top right). Young and aged mice with gut dysbiosis did not exhibit significant shifting in Ly6CLow subclusters in comparison to their counterparts with intact microbiomes (Figure S3A).
Figure 4. Aged Brain Increases Ly6CLow Patrolling Monocyte Plasticity.
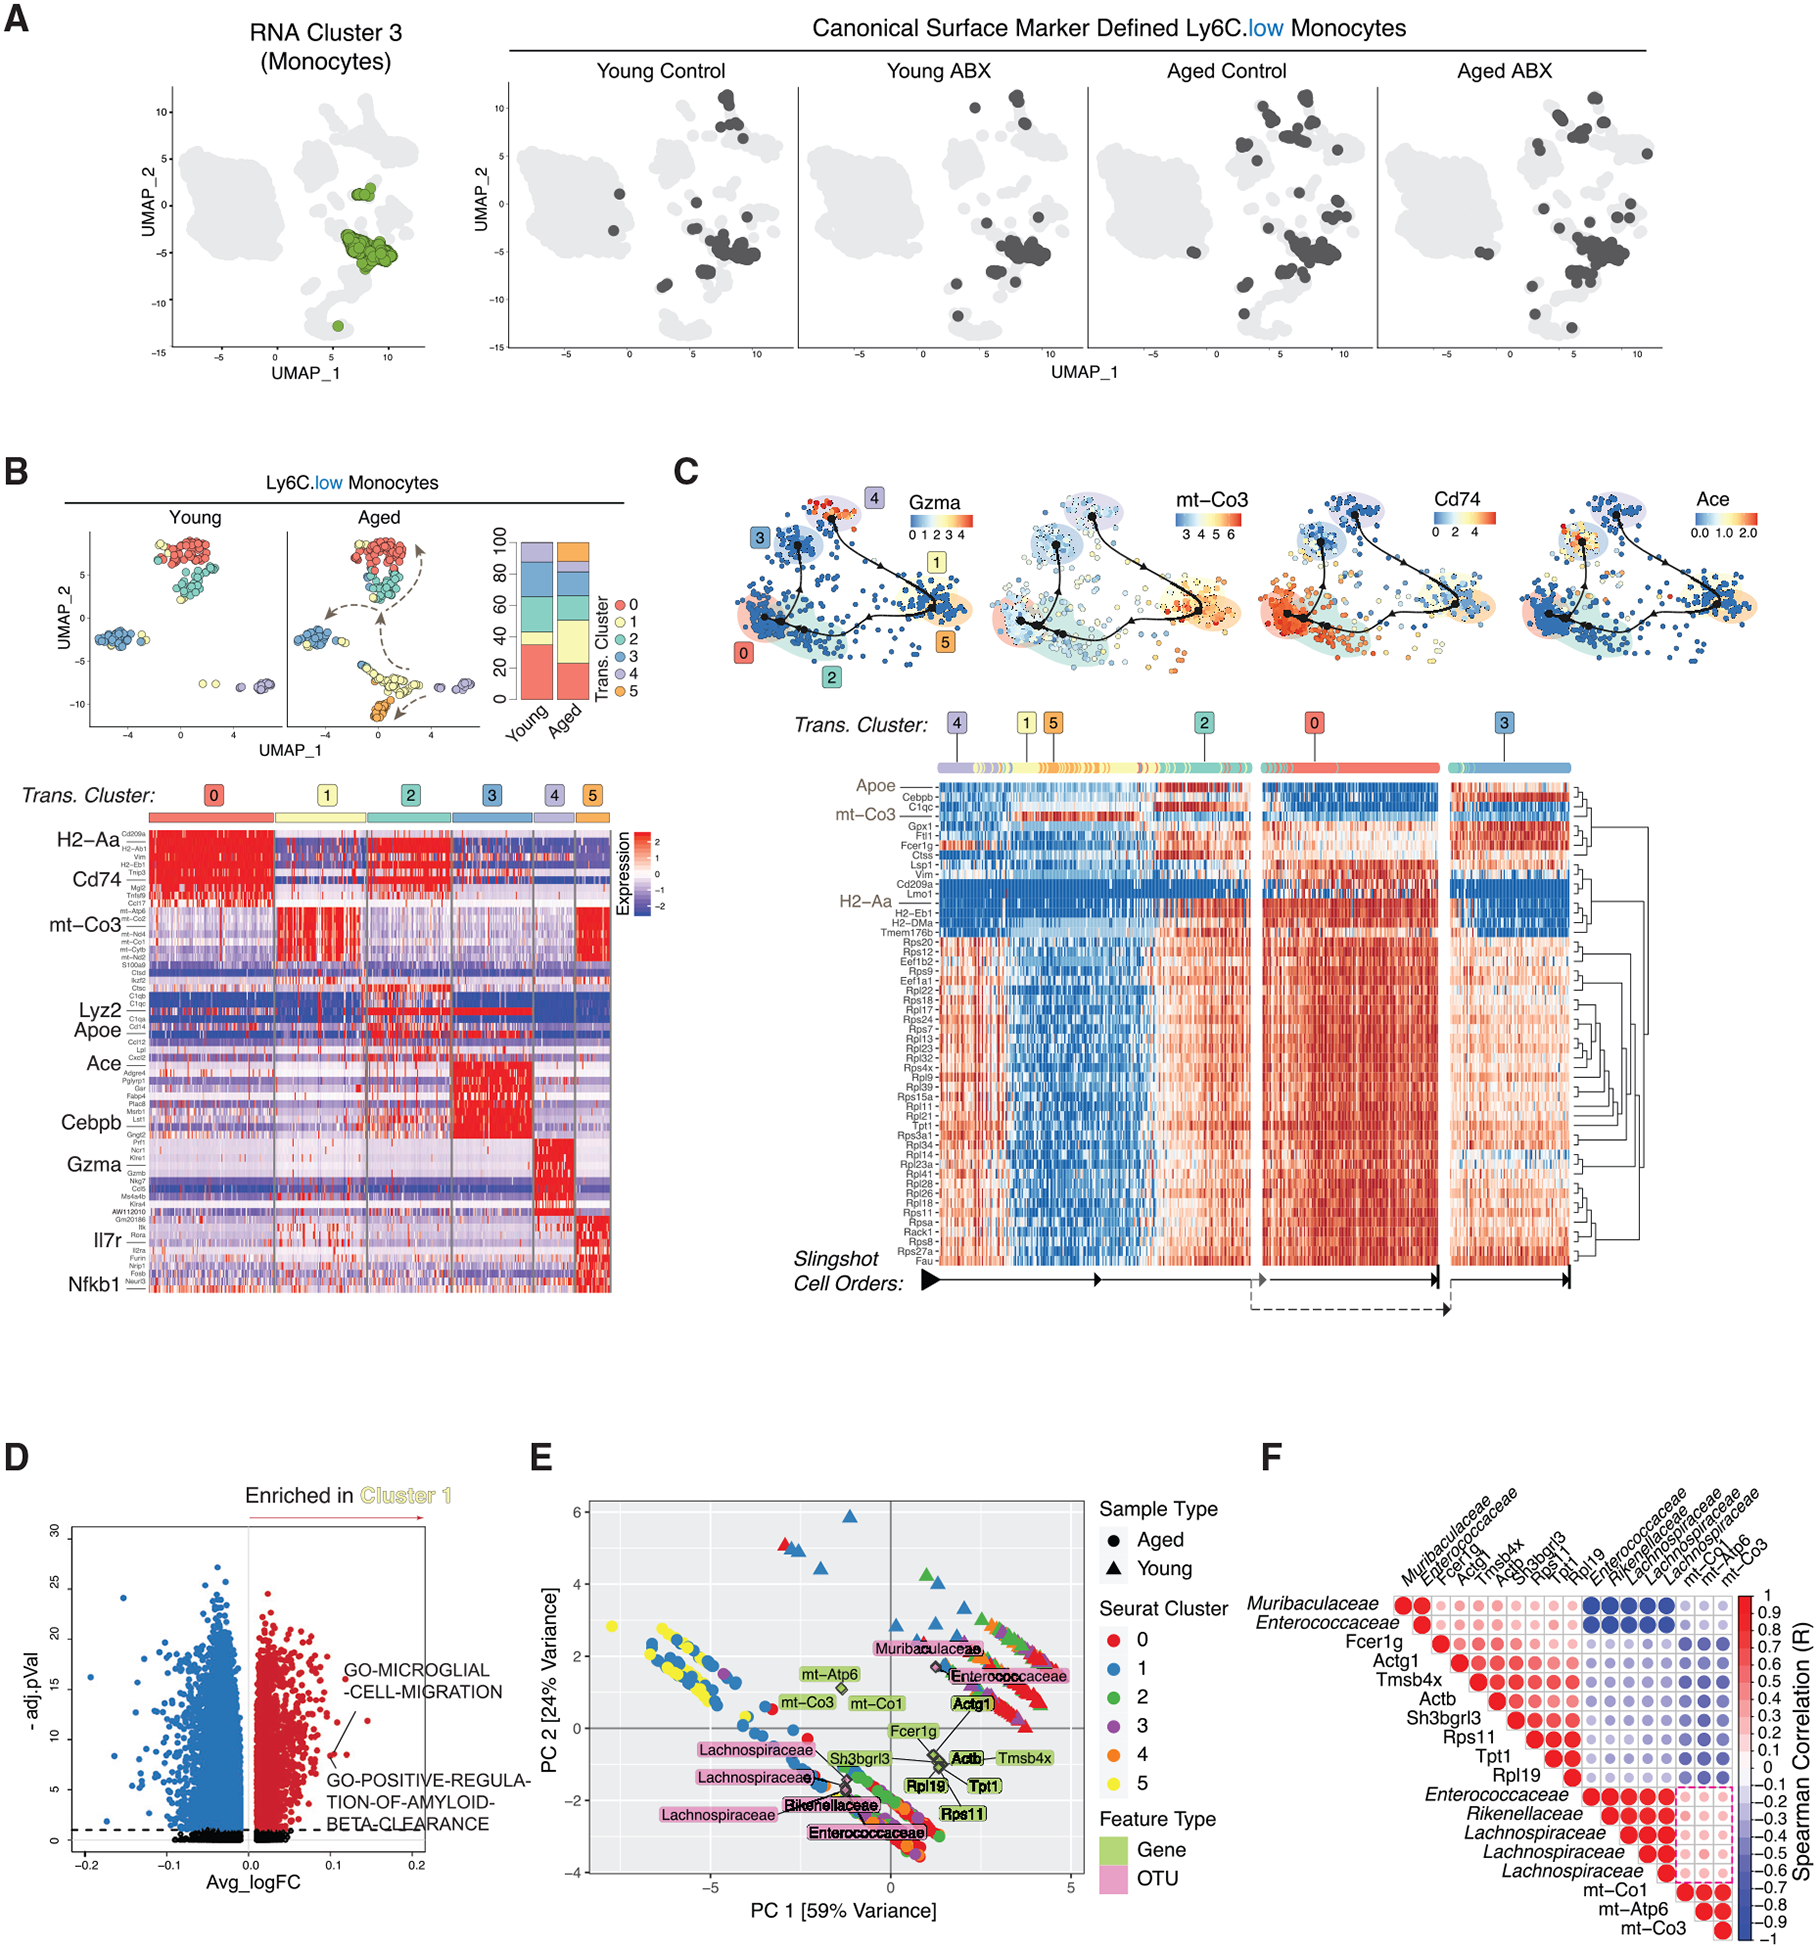
(A) UMAP clustering as in Figure 1B with RNA cluster 3 in green (left) and with Cell-ID Ly6CLow darkened (right, split by conditions).
(B) Re-clustered young and aged Ly6CLow cells on UMAP (top left) and stacked bar charts of cluster frequencies (n = 3 biological replicates per group) (top right). Heatmap of Ly6CLow subcluster DEGs (bottom) is shown.
(C) Trajectory of Ly6CLow subclusters overlaid with indicated genes (top). Heatmap of trajectory DEGs in cluster ordering (bottom) is shown. Ordering is denoted by arrows at the bottom.
(D) Volcano plot of DEGPs in Ly6CLow subcluster 1 versus all other Ly6CLow subclusters.
(E) PCA triplot of sparse CCA of microbiota families and Ly6CLow DEGs in young and aged. Dots represent cells from aged and triangles represent cells from young. Ly6CLow subclusters are represented by different colors. Gene names are in green and OTUs are in pink.
(F) Gene-microbial family correlation plot. Red indicates positive and blue indicates negative correlation. All correlations have corr.test p < 0.01.
All plots were derived from pooling three biological replicates per experimental condition. Data in (D) were analyzed by Wilcoxon rank-sum test. Also see Tables S2, S3, and S4.
Ly6CLow subclusters 1 and 5 had overlapping marker genes and shared high levels of mitochondrial gene expression (mt-Atp6, mt-Co2, and mt-Co3) (Figure 4B, bottom; Table S2). Trajectory inference analysis and RNA velocity analysis projected the ordering of the Ly6CLow subcluster shifting in transcriptional signature to the next cellular status (Figures 4C and S3B). Slingshot analysis predicted subcluster 4 as the root, marked by high levels of cytotoxic genes (Gzma and Gzmb), and that these cells shifted into closely related subclusters 1 and 5 (Figures 4B, bottom, and 4C, top). With highly expressed mitochondrial genes (e.g., mt-Co3), subclusters 1 and 5 seemingly serve as a transitory state before further evolving into subcluster 2, wherein the cells then branch into either subclusters 0 or 3 (Figure 4C). Ly6CLow subcluster 2 had overlapping marker genes with subclusters 0 and 3 with a high expression of Cd74 and Lyz2, suggesting that this cluster serves as a transition state between differentiation into either subcluster 0 or 3 transcriptomic profiles (Figure 4B, bottom). Subcluster 0 was marked by expression of MHC-II genes (H2-Aa, H2-Ab1, and Cd74), suggesting that these cells upregulated antigen presentation possibly due to increased phagocytosis in response to tissue damage (Figure 4B, bottom). Subcluster 3 showed a differentiated signature with high Ace and Cebpb expression (Figures 4B, bottom, and 4C, top). Marked expression of Cebpb and Ace in subcluster 3 suggests that these Ly6CLow cells are actively differentiating into mature monocytes (Mildner et al., 2017; Shen et al., 2014). The increased proportion of subclusters 1 and 5 in the aged brain suggests that Ly6C+ cells have an increased active differentiation and response to the microenvironment changes. Distinct from subcluster 1, subcluster 5 had high expression of Il7r and Nfkb1, suggesting that these cells may be responding to increased neuroinflammation in the aged brain and could be involved in regulating a T cell response (Al-Mossawi et al., 2019) (Figure 4B, bottom). Both subclusters 1 and 5 were enriched for pathways involved in microglia cell migration, which may be indicative of more general macrophage migration toward sites of injury and response to inflammatory stimuli (Figure 4D; Table S4). Notably, subcluster 1 was also enriched for gene pathways in amyloid-beta clearance (Figure 4D), which have been observed in CNS phagocytic cells in response to neuroinflammation and Alzheimer disease (Saresella et al., 2014; Thériault et al., 2015). Integrative analysis with our 16S rRNA microbiota data and CITE-seq data identified that Ly6CLow subclusters from aged mice positively correlated with the Rickenellaceae, Enterococcaceae, and Lachnospiraceae families (Figure 4E, PCA analysis). mt-Co3 expression, which was correlated with aged Ly6CLow subclusters and the aforementioned bacterial families, was also highly expressed in Ly6CLow subclusters 1 and 5 on the trajectory heatmap (Figures 4C, 4E, and 4F). With Ly6CLow subclusters 1 and 5 having increased abundance in the aged mice, these data suggest that the Rickenellaceae, Enterococcaceae, and Lachnospiraceae families are potentially correlated with Ly6CLow differentiation in the aged mouse brain.
CNS Innate Lymphoid Cell Plasticity Reflects Chronic Neuroinflammation in the Aged Brain
ILCs originate from the same lymphoid progenitor as B and T lymphocytes but lack antigen-specific receptors and play important regulatory functions in organ-specific immunity (Colonna, 2018). The plasticity among ILC subtypes in peripheral tissues has become increasingly appreciated (Bal et al., 2020; Colonna, 2018), and recent studies have started to demonstrate the role of ILCs in CNS diseases and neuroinflammation (Kwong et al., 2017; Romero-Suárez et al., 2019). How ILCs respond to systemic factors, such as aging and gut dysbiosis, has not been thoroughly investigated. To begin to delineate the plastic nature of ILCs derived from CNS tissue, we distinguished Cell-ID ILCs (ILC-like cells) from T cells by CD117 surface expression (CD117+) and low CD3 surface expression (Figure S1C, ILC Gating). ILC-like cells made up 2.5% of the total leukocytes we sequenced and predominantly exhibited transcriptome signatures of RNA-based clusters 7 and 9 (Figure 5A, left; Table S3). We observed increased dispersion of ILC-like cells into several RNA-based clusters (Figure 5A, right). Interestingly, there was elevated dispersion of ILC-like cells from the aged control group into RNA cluster 3, primarily representing a CD8+ T cell-like transcriptome signature. This was not observed in the aged ABX group indicating that gut microbiota-immune signaling may mediate ILC transcriptome plasticity within the aged brain.
Figure 5. CNS Innate Lymphoid Cell Plasticity Reflects Chronic Neuroinflammation in the Aged Brain.
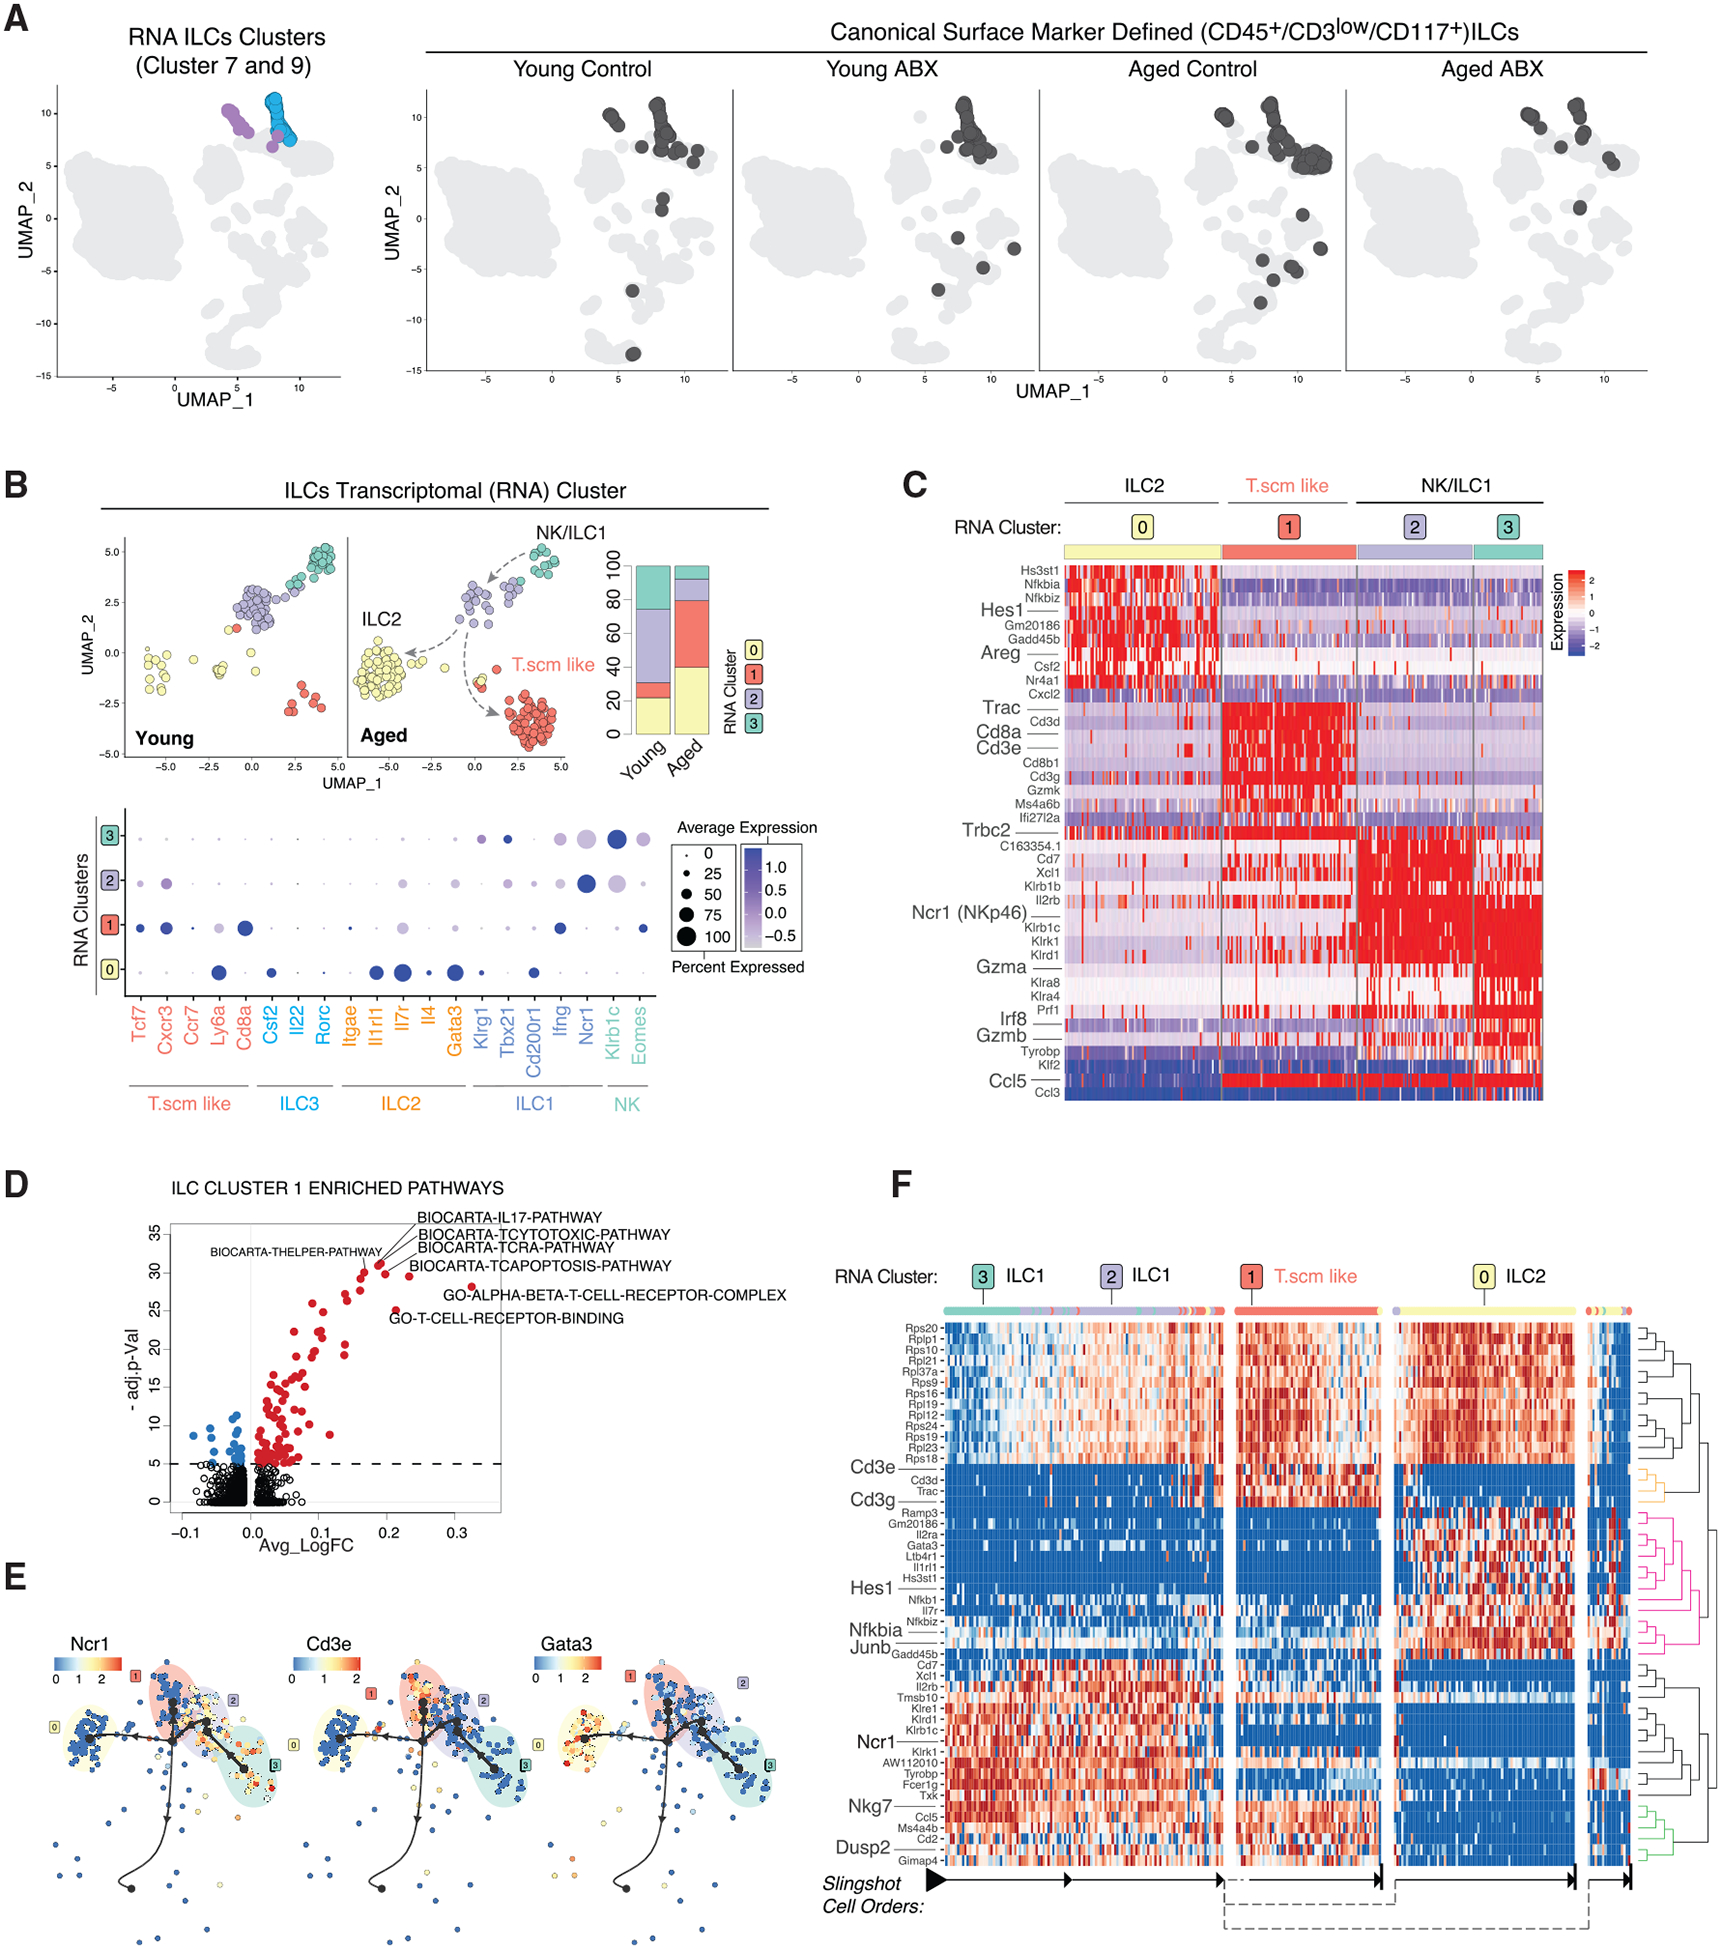
(A) UMAP clustering as in Figure 1B highlighting RNA-based clusters 7 (blue) and 9 (purple) (left) and with Cell-ID ILCs darkened (right, split by conditions).
(B) Re-clustered young and aged ILCs on UMAP. Plots split by young and aged (top left) and stacked bar charts of cluster frequencies (n = 3 biological replicates per group) (top right). Dot plot of ILC subcluster expression level (color scale) and percentage (size of dot) for indicated cell types and associated marker genes (bottom).
(C) Heatmap of ILC subcluster DEGs.
(D) Volcano plot of DEGPs in ILC subcluster 1 versus all other ILC subclusters.
(E) Trajectory of ILC subclusters overlaid with indicated genes.
(F) Heatmap of trajectory DEGs in cluster ordering. Ordering is denoted by arrows at the bottom.
All plots were derived from pooling three biological replicates per experimental condition. Data in (D) were analyzed by Wilcoxon rank-sum test. Also see Tables S2 and S3.
To further discern the nature of ILC plasticity, we subsetted and re-clustered the ILC-like cells based on their individual transcriptomes (Figure 5B). We first focused on ILC-like cells from young and aged brains and found that they segregated into four transcriptionally distinct clusters (Figure 5B, top left). Aged ILC-like cells had significantly higher proportions of subclusters 0 and 1 (Figure 5B, top right). Using previously described ILC subtype marker genes, we identified ILC and lymphoid subtypes present among the ILC-like subclusters (Bal et al., 2020; Colonna, 2018; Gury-BenAri et al., 2016). Subcluster 0 was marked by a higher expression of Gata3, Il1rl1, Itgae, and Areg, resembling the ILC2 subtype (Figures 5B, bottom, 5C; Table S2). Interestingly, subcluster 1 cells did not express previously defined ILC subtype marker genes. Instead, they showed a T cell-like signature with expression of Cd3e, Cd8a, Tcf7, and Trac (Figures 5B, bottom, and 5C; Table S2). Of note, this T cell-like subcluster had significantly lower CD3 surface expression and negative to low expression levels of Cd8a and Cd3e relative to canonical T cells (Figure S1C, ILC gating; S4A). We also noted that most of Cd3e+ or Cd5+ cells lacked expression of Tbx21 (T-bet), an ILC marker gene (Colonna, 2018) (Figure S3C). The ILC T cell-like subcluster 1 expressed T memory stem cells (Tscm) marker genes (Tcf7, Cxcr3, and Ly6a) (Gattinoni et al., 2017), T memory cell transcription factor, Eomes (Figure 5B, bottom; Table S2), and brain-resident memory T cell marker Ccl5 (Knox et al., 2014; Steinbach et al., 2019) (Figure S3D). Compared to the other ILC subclusters, the Tscm-like cells were also enriched with T helper, interleukin-17 (IL-17), and T-cytotoxic pathways (Figure 5D; Table S4). Subclusters 2 and 3 had some overlapping expression of natural killer (NK)-like genes (Klrb1c, Klrk1, and Ncr1) (Figure 5C; Table S2). However, a higher expression of T-bet transcription factor, Tbx21, in subcluster 2 indicates this cluster resembled an ILC1 status, whereas expression of Eomes in subcluster 3 designates an NK-like status (Bal et al., 2020; Romero-Suárez et al., 2019). There were no cells expressing the ILC3 marker gene Rorc (Figure 5B, bottom). Lack of ILC3s in the CNS has previously been observed (Romero-Suárez et al., 2019). Next, we used RNA velocity (Figure S3E) and slingshot trajectory analyses to order the cellular states and assign a potential inter-lineage transition path of the ILC-like subclusters. Based on cell velocity analysis and Slingshot trajectory, subcluster 3 with the NK-like transcriptome was assigned as the cell type of origin and appears to shift into the closely related subcluster 2 (ILC1). From there, differentiation was projected to split into subcluster 1 with Tscm-like signature and subcluster 0 (ILC2) (Figures 5E and 5F). The trajectory projections indicated potential transdifferentiation of NK-like cells into ILC1s, which then branched into either ILC2 or brain-resident Tscm-like cells in the aged brain (Figure 5B, indicated by arrows). The enrichment of ILC2 and Tscm-like cells suggests an increased prevalence of type 2/chronic inflammatory response occurring in the aged brain tissue environment (Steinbach et al., 2019; Zaiss et al., 2015).
Single-cell Regulatory Network Interference and Clustering (SCENIC) analysis identified that the Eomes transcription factor recognition motif and regulon activity was enriched in the Tscm-like ILCs (subcluster 1) (average Log FC 0.056, adjusted p = 4.60 × 10⁻¹¹) and partially in ILC1/NK clusters (subclusters 2 and 3) (Aibar et al., 2017) (Figure S3F; Table S2). Compared to young, the ILC1 subcluster in aged mice was enriched for Eomes (average Log FC 0.027, adjusted p = 0.007) (Figure S3G; Table S2). Eomes is an important transcription factor in the differentiation of lymphoid cells including CD8+ T cell memory and effector subtypes as well as NK cells (Intlekofer et al., 2005; Romero-Suárez et al., 2019; Shimizu et al., 2019). These findings and our result suggest that Eomes transcription factor activity may potentially drive the shifting of ILC1/NK-like cells to Tscm-like cells in the aged mouse brain, as observed in our trajectory analysis (Figure 5F). Integrative analysis of 16S rRNA microbiota composition data with ILCs from young and aged mice showed positive correlation for Lachnospiraceae and Rikenellaceae bacterial families with the Tscm-like and ILC2 subclusters, which were most abundant in aged mice (Figure S3H). Marker genes for ILC1 and NK-like cells (subclusters 2 and 3), Ncr1 and Tyrobp, were positively correlated with the young mice and negatively correlated with the Lachnospiraceae and Rikenellaceae bacterial families (Figures S3H and S3I). The emergence of Tscm-like and ILC2 subtypes in aged mice may be associated with age-associated shifting of the microbiome composition.
ABX Treatment Alters ILC Plasticity Pattern in Aged Mice but Not in Young Mice
Peripheral ILCs are known to have the ability to recognize both self and pathogenic molecules and respond to systemic cues, for example, gut dysbiosis (Bal et al., 2020; Colonna, 2018; Gury-BenAri et al., 2016). Upon gut dysbiosis, intestinal ILCs underwent extensive epigenetic and transcriptional changes, which led to the expansion of ILC3s in either germ-free or ABX-treated mice (Gury-BenAri et al., 2016). To further investigate the impact of ABX treatment on CNS-derived ILC transcriptome plasticity, we re-clustered ILC-like cells from the young control versus young ABX and aged control versus aged ABX groupings. For both young and aged groups, the ILC-like cells separated into three transcriptionally distinct clusters (Figure 6A, left). ABX treatment led to a significant decrease in the frequency of subcluster 1 only in aged mice, while subcluster distributions in young mice with gut dysbiosis remained relatively stable (Figure 6A, right). Subcluster 2 resembled the ILC1 signature (Ncr1, Tbx21, and Gzma), while subcluster 0 resembled ILC2s with the expression of Hes1, Areg, and Gata3 (Figure 6B; Table S2). Subcluster 1 closely mirrored the Tscm-like cluster previously described in the aged control mice expressing Ly6a, Cd8a, and Cxcr3 (Figure 6B; Table S2). Slingshot analysis ordered the subclusters and projected differentiation similarly to ILC-like cells compared between young and aged mice, with the ILC1 subcluster projected to differentiate and split into the Tscm-like cells and ILC2s (Figures 6C and 6D). Of note, while ABX treatment prevented the transdifferentiation path from ILC1 to Tscm-like cells in the aged brain microenvironment, ABX treatment had no impact on Cell-ID CD8+ T cells at both compositional and transcriptional levels (Figures S4B–S4D), highlighting the unique identity of Tscm-like cells in the aged brain. While potential transdifferentiation between ILC1 and Tscm-like cells in the aged brain requires further functional validation, our data provide evidence that ILC plasticity associated with gut microbiota depletion is not restricted to intestinal ILCs but affects ILCs found in the brain as well.
Figure 6. ABX Treatment Alters ILC Plasticity Pattern in the Aged Mice.
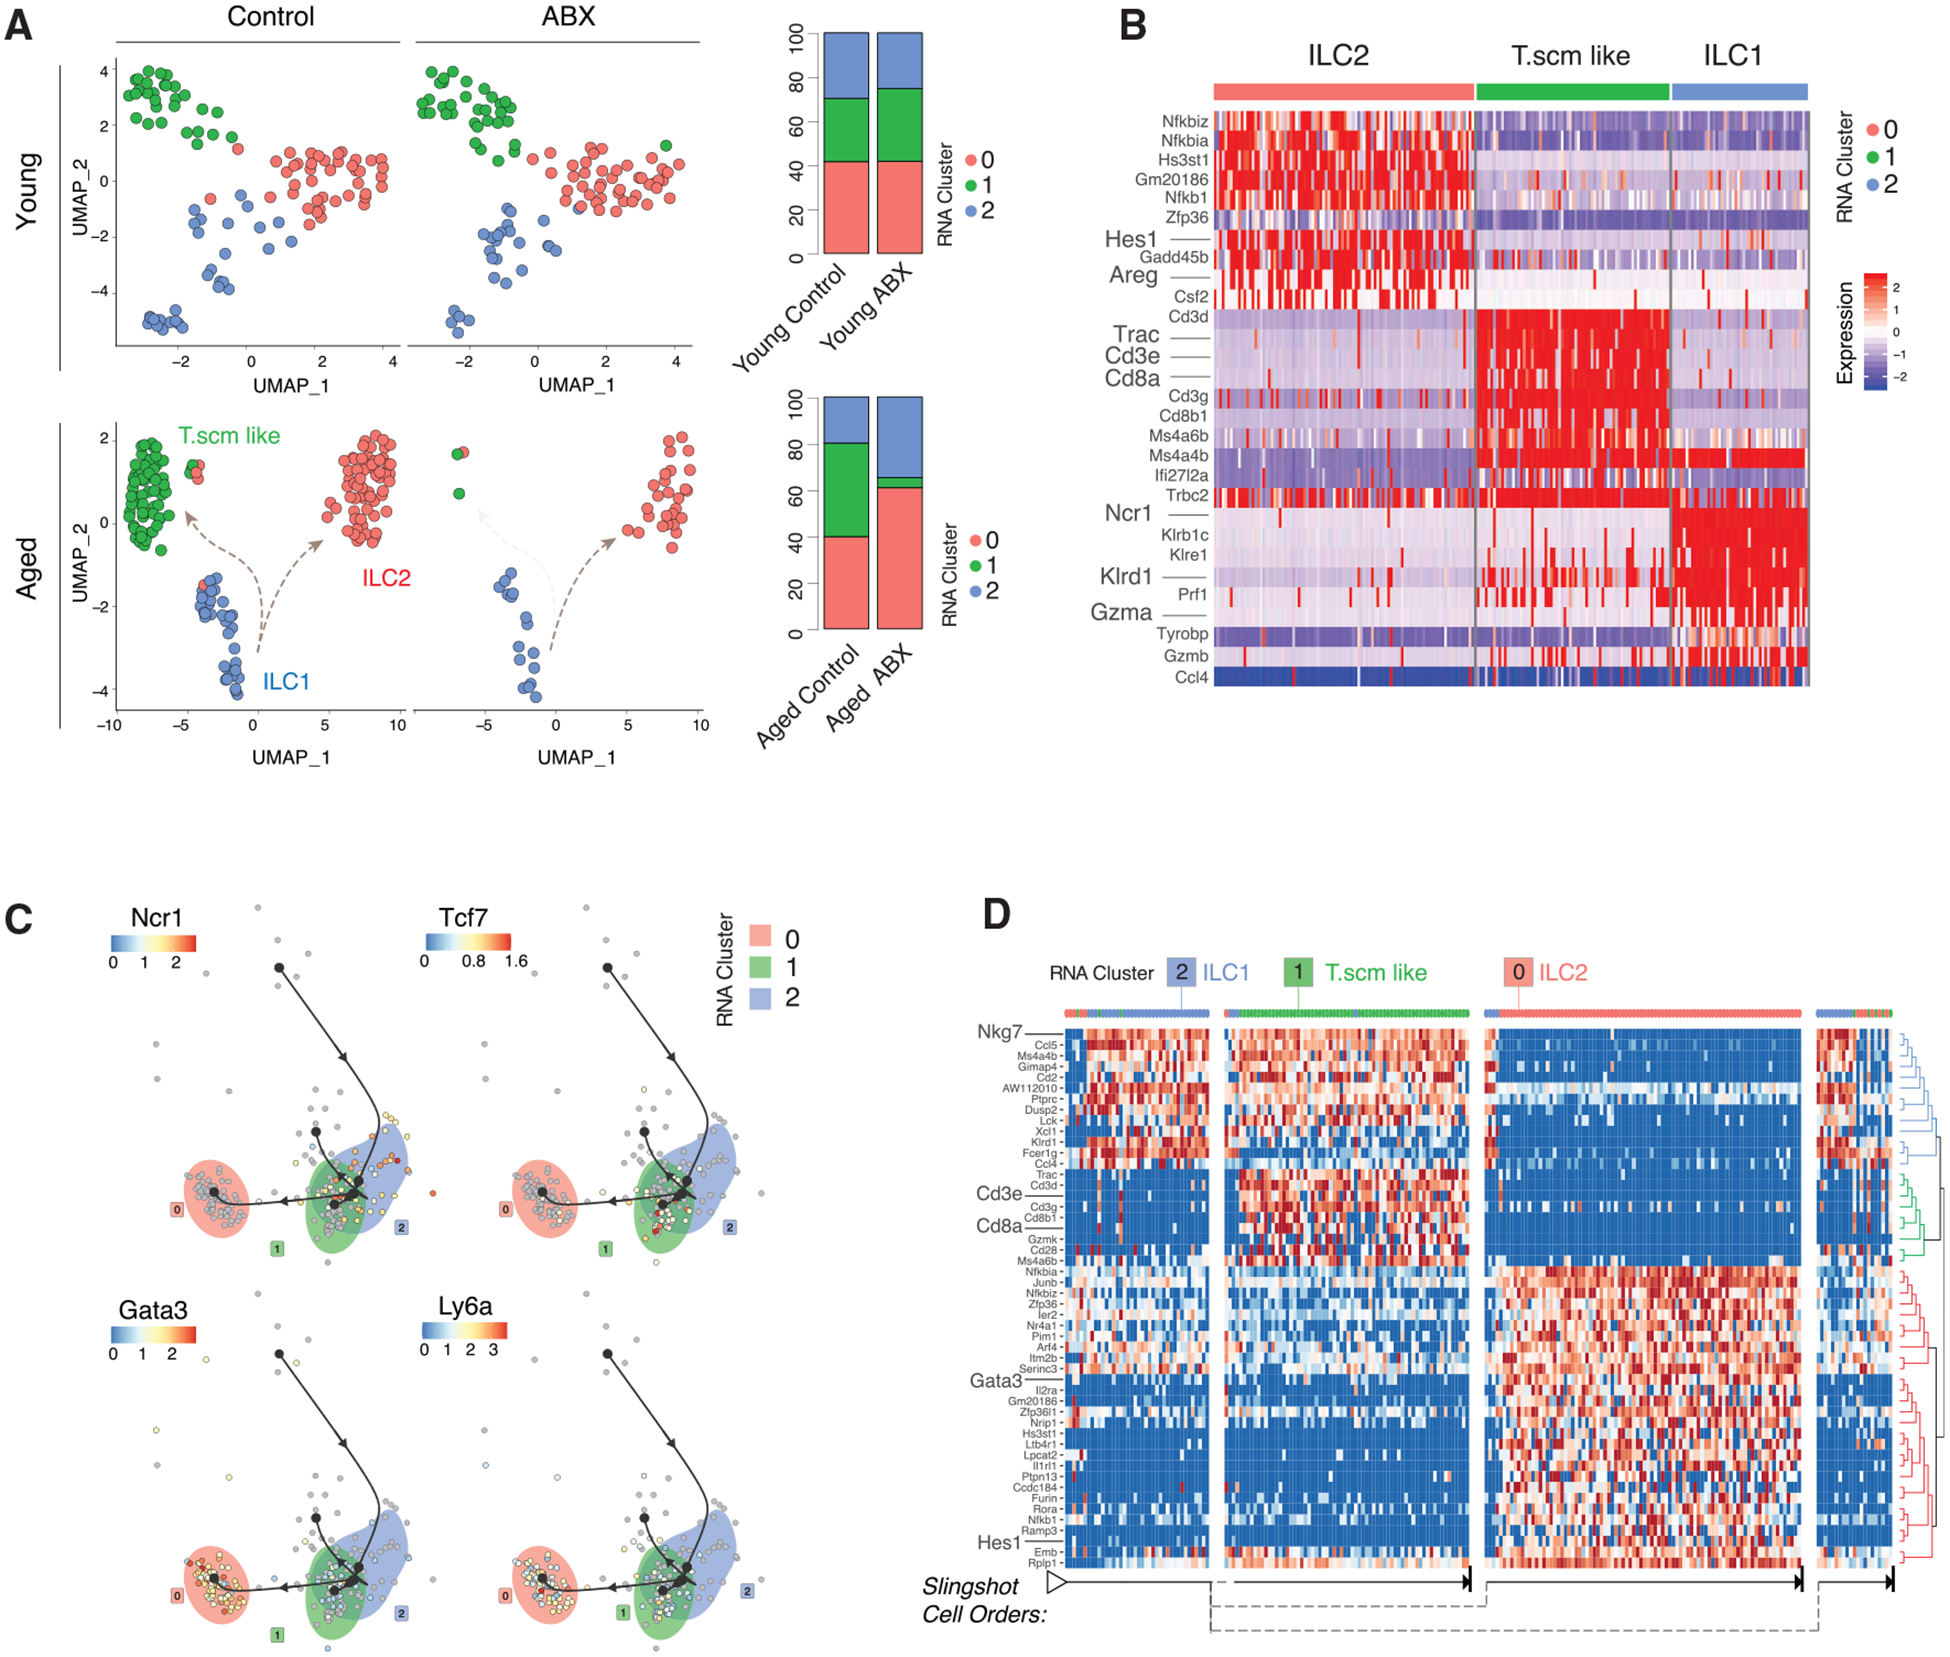
(A) Re-clustered young control and young ABX ILCs on UMAP (top left) and stacked bar charts of cluster frequencies (n = 3 biological replicates per group) (top right). Re-clustered aged control and aged ABX ILCs on UMAP (bottom left) and stacked bar charts of cluster frequencies (n = 3 biological replicates per group) (bottom right).
(B) Heatmap of aged control and aged ABX ILC subcluster DEGs.
(C) Trajectory of aged control and aged ABX ILC subclusters overlaid with indicated genes.
(D) Heatmap of trajectory DEGs in cluster ordering. Ordering is denoted by arrows at the bottom.
All plots were derived from pooling three biological replicates per experimental condition. Also see Tables S2, S3, and S4.
ABX-Associated ILC Plasticity Is Not Fully Induced in Intestinal Tissue
Intestinal ILC subtype diversity is controlled through constant signaling from gut microbiota, suggesting that changes in ILC subtype frequencies observed in the aged brain may be initiated at the intestinal tissue in close proximity to the gut dysbiosis (Gury-BenAri et al., 2016). We conducted CITE-seq on gut-derived immune cells from aged mice to investigate the possible correlation between gut and brain ILCs. Aged mice were fed vehicle or ABX cocktail in an identical manner and timing as previously described (Figure 1A). At the completion of ABX or vehicle treatment, we collected and enriched for CD45+ small intestinal immune cells for single-cell isolation and sequencing (10X Genomics) as previously described. Gut ILCs were identified by a gating strategy similar to that which we used for brain ILCs (Figure S5A). Gut ILCs were re-clustered and separated into seven transcriptome-based subclusters (Figures S5B and S5C). We identified canonical ILC1, ILC2, and ILC3 subtypes (Bal et al., 2020; Colonna, 2018; Gury-BenAri et al., 2016) (Figures S5B, right dotplot, and S5C). Subcluster 2 of the gut-derived ILCs resembled the Tscm-like signature similar to CNS-derived ILCs (Gattinoni et al., 2017) (Figure S5C; Table S2). Fewer ILCs were present in the gut of aged ABX mice compared to aged control, and gut-derived Tscm-like ILCs were only slightly decreased in the aged ABX (16%) compared to aged control (21%) (Figure S5D; Table S3). While the decreasing trend in Tscm-like ILCs remained detectable in gut tissue, the reduction in Tscm frequency was not nearly as stark in the gut as observed in the brain. ILC subcluster 2 (Tscm cluster) largely overlapped with ILC1 and ILC2 subclusters on the Slingshot trajectory analysis plot, suggesting that, in the gut tissue, the Tscm-like cells had more transcriptional overlap and similarity with ILC1 and ILC2 cells (Figure S5E). The significant decrease of Tscm-like cells in the CNS compartment is unlikely to be explained in full by the slight compositional and transcriptional changes happening in the gut tissue.
DISCUSSION
Canonical identity of immune cells is traditionally defined by surface protein expression, whereas the functional status in response to stimuli is often well defined by transcriptional signature (Papalexi and Satija, 2018). CITE-seq was developed as a multi-modal sequencing tool to track transcriptional changes happening within a specific cell type by directly coupling surface marker expression with single-cell transcriptome profiling (Stoeckius et al., 2017). Using CITE-seq, we examined the transcriptional plasticity of canonically identified immune cells in the brain in response to the systemic influence of aging and gut dysbiosis.
Compositional changes among the CNS-resident immune populations in response to aging and neuroinflammation have been observed (Mrdjen et al., 2018). Aged mice had increased frequency of MHC-II+CCR2− BAMs and microglia that expressed higher levels of phagocytosis-associated surface markers (Mrdjen et al., 2018). Small subsets of chemokine-enriched inflammatory microglia have also been discovered in the aged mouse brain (Hammond et al., 2019). Although microglia and BAM transcriptomes in our study were relatively stable and less plastic compared to monocytes and ILCs, consistent with the above observations, CNS-resident cells were shifted toward a pro-inflammatory and antigen presentation program under the influence of aging, and marginally so by gut dysbiosis (Figures 2B and 2E). We suspect that such shifting of microglia and BAMs toward a pro-inflammatory profile is reflective of a more inflamed environment within the aged brain (Erickson and Banks, 2019; Plaza-Zabala et al., 2017).
ILC-like cells displayed transcriptional plasticity in response to both aging and gut dysbiosis stimuli (Figures 5A, 5B, and 6A). Peripheral ILCs mirrored the T helper cell signature and can mediate induction and resolution of inflammation as well as maintain tissue homeostasis and mucosal barriers (Bal et al., 2020; Colonna, 2018; Derecki et al., 2019). Compared to young mice, ILC-like cells in aged mice were shifted into ILC2 and T.scm-like subtypes (Figure 5B). With high expression of amphiregulin (AREG), ILC2s may be critical in type-2-mediated resistance and tolerance to maintain tissue integrity following damage or in chronically inflamed environments, such as the aged brain (Zaiss et al., 2015) (Figure 5C). CNS-associated ILCs have also played a role in guiding T cell CNS infiltration and engagement in response to neuroinflammation (Kwong et al., 2017). ILC shifting toward ILC2 subtypes within the aged brain potentially regulates the CD8+ T cell infiltration in the aged brain observed in our study (Figure 1D) as well as in recent reports (Dulken et al., 2019; Mrdjen et al., 2018).
In the experimental autoimmune encephalomyelitis (EAE) mouse model of multiple sclerosis, CNS-derived ILC1s and NK cell transcriptional programs were controlled through the Eomes and T-bet transcription factors in response to the CNS inflamed environment (Romero-Suárez et al., 2019). Age-associated neuroinflammation may drive Eomes+ NK/ILC1s to differentiate into the Tscm-like cells dominated by the Eomes regulon (Figure S3F), a phenomenon that may not occur in the young non-inflamed brain. The molecular underpinning of the significant reduction of the Tscm-like population in aged mice with gut dysbiosis still remains elusive, as differential regulon activity analysis did not reveal significant changes in Eomes or T-bet activity in ILCs between aged control and aged ABX mice and was not fully explained by shifting occurring within gut tissue (Figure S5). The functional significance of the Tscm-like ILCs in the aging brain and how their plasticity is influenced by dysbiosis in the aged tissue environment warrant further research.
Last, our ABX cocktail included absorbable ABX, which raises questions regarding the relative contributions of the altered microbiota versus direct effects of ABX on immune cells (Clarke et al., 2010; Erny et al., 2017). In addition to understanding the effects of ABX in a given scientific research study, it is pertinent that the physiological impact is clear prior to clinical use. With widespread use of ABX in the clinic, particularly in older populations, it is a relevant area of study that warrants further investigation.
In summary, our study provides a holistic map of the brain immune plasticity in response to aging and gut dysbiosis. The molecular characterization of the impact of aging on both innate and adaptive immune systems in the brain will guide further mechanistic studies on age-associated neuroinflammation and neurological diseases.
STAR★METHODS
RESOURCE AVAILABILITY
Lead Contact
Further information and requests for resources and reagents should be directed to and will be fulfilled by the Lead Contact, Siyuan Zhang (szhang8@nd.edu).
Materials Availability
This study did not generate unique reagents.
Data and Code Availability
The accession number for the CITE-seq data reported in this paper is GEO: GSE148127. The accession number for the 16S gut microbiome data reported in this paper is GEO: GSE160628. All other data and code used to analyze data are available upon reasonable request for Lead Contact/corresponding author.
EXPERIMENTAL MODEL AND SUBJECT DETAILS
All animal studies were performed ethically and in compliance with IACUC protocol approved by the University of Notre Dame IACUC committee. C57BL/6 (000664/Black 6) mice were purchased from Jackson Lab (Ben Harbor, ME). Mice were acclimated and randomized within age groups for two weeks in the Friemann Life Science Center (FLSC) at the University of Notre Dame prior to experimental use. All mice used in the study were females at either 10 weeks or 70 weeks of age.
METHOD DETAILS
Gut Microbiota Dysbiosis and ABX Treatment Strategy
8-week old and 68-week old SPF C57BL/6 female were acclimated in the animal facility for 2 weeks and randomized within age groups to normalize the gut microbiota. 10-week and 70-week old female mice were assigned to either vehicle or antibiotics (ABX) treatment groups. The ABX groups received an ABX cocktail containing metronidazole (MedChem Express, 0.25 g/L), vancomycin hydrochloride (BioVision, 1 g/L), neomycin sulfate (VWR, 1 g/L), and ampicillin sodium salt (Sigma, 0.5 g/L) which was dissolved into grape flavored Kool-Aid water as a vehicle. Initially, the ABX or vehicle was delivered in the cage water bottles and by oral gavage every other day to all mice for the first week of treatment. Then, all mice in the study received vehicle in cage water bottles and received oral gavage of either vehicle or ABX cocktail twice daily for an additional two weeks of treatment. Mice were weighed every 3–4 days during treatment to check that healthy body weight was maintained. Fresh ABX cocktail was prepared every 3 days for oral gavage. Water bottles were refreshed every 3–4 days to ensure mice received active antibiotics each dose. Mouse fecal samples were collected on day 0 and day 21 (endpoint) of treatment for 16S analysis. After ABX pretreatment was completed, mice were sacrificed to collect brain tissue for 10X Genomics Chromium Single Cell Gene Expression analysis. All animal studies were performed ethically and in accordance with the IACUC protocol approved by the University of Notre Dame IACUC committee.
16S rRNA sequencing and analysis
Mouse fecal DNA extraction was performed using the ZymoBIOMICS DNA Miniprep Kit (Cat# D4300). 16S V3/V4 region amplification, sample indexing and library preparation were performed following the Illumina 16S Metagenomic Sequencing Library Preparation (PN 15044223 Rev. B). Amplicons were indexed using the Nextera XT Index Kit (FC-131-1096). Libraries were submitted to the University of Notre Dame Genomics & Bioinformatics Core Facility (GBCF) for Illumina sequencing. GBCF normalized and multiplexed the libraries into a single pool prior to validation by Qubit High-Sensitivity dsDNA, Agilent Bioanalyzer DNA 7500 Chip, and Kapa Illumina Library Quantification qPCR analyses. The final library (8.5pM) and PhiX (0.7pM) were sequenced on the MiSeq System using MiSeq V2 500 cycle kit (250-PE with 8-bp dual indexing). Base calling and demultiplexing were performed by MiSeq Controller Software. After quality control filtering; a total of 2,734,528 reads were processed with an average of 171,159 reads per sample. We used the Divisive Amplicon Denoising Algorithm version 2 (DADA2) R package to analyze the 16S amplicon reads and construct the operational taxonomic units (OTUs). This package incorporates a quality-aware model of Illumina amplicon errors to improve the identification of real variants and minimize false positives (Callahan et al., 2016). DADA2 utilizes the Silva taxonomic database: http://doi.org/10.5281/zenodo.3986799.
Tissue collection and single cell preparation
For CITE-seq brain tissue collection, mice were anesthetized with isoflurane and transcardially perfused with cold 1x PBS. Cells were isolated from mouse brain tissue by digesting the brains into single cell suspensions and then enriched from other neural cells by density gradient centrifugation as follows: Brains from mice transcardially perfused with 1x PBS were extracted, minced with scissors and triturated with a P1000 micropipette. The resulting brain tissue slurry was centrifuged at 300 g for 2 minutes. The supernatant was removed and the pellet resuspended and processed as directed by the Multi-tissue Dissociation Kit I (Miltenyi Biotec, 130-110-201). Brains were enzymatically digested into a single cell suspension by rotating at 37°C for approximately 25 minutes with trituration halfway through incubation. The resulting cell suspension was strained through a 100 μm cell filter as needed, diluted in 1x HBSS, and centrifuged at 300 g for 10 minutes. The resulting supernatant was discarded and the pellet resuspended in 3mL 70% Percoll (GE Healthcare, 17-0891-02). The Percoll gradient and density layering were prepared (from bottom to top: 70%, 37%, 30%). Density gradient centrifugation was performed for 20 minutes at 2000rpm with no break. Mononucleated cells were isolated from the buffy layer between the interface of the clear Percoll and red-colored Percoll. Following washing in 1x HBSS, the resultant cell suspension was processed as required for CITE-seq.
For isolation of lymphocytes from the mouse small intestinal tissue, we adapted a tissue digestion procedure as previously published (Couter and Surana, 2016). Briefly, mice were anesthetized with isoflurane and transcardially perfused with cold 1X PBS. The small intestine was transected from the stomach and peritoneum while teasing away mesenteric fat until reaching the juncture of the cecum and large intestine. The small intestine was cut into 1 inch segments and Peyer’s patches were removed. Tissue was turned inside out using forceps to cannulate the tissue and fecal matter was washed away with cold media containing 10% fetal bovine serum (FBS). Next, epithelial cells were extracted from the tissue segments through vigorous shaking in media (1.6% FBS, 5% (w/v) dithiothreitol (DTT) and 1 mM EDTA). Tissue segments were passed over a gauze filter to remove intraepithelial lymphocytes. Tissue segments were then minced with scissors, triturated with a P1000 micropipette and vigorously shaken in a digestion buffer containing Dispase II (Sigma-Aldrich, D4693) (0.5 mg/mL) and Collagenase IV (Thermo Fisher Scientific, 17104019) (1.5 mg/mL) to dissociate remaining tissue from immune cells. After digestion, the suspension was filtered through a 40 mm cell strainer and washed with media containing 10% FBS. The isolated cells were then enriched for CD45+ immune cells using CD45 Microbeads (Miltenyi Biotec, 130-052-301) before being subjected to CITE-seq analysis.
CITE-seq antibodies and cell staining
Following gradient centrifugation for brain immune cells or CD45+ enrichment for gut immune cells, samples were prepared for 10X Genomics Chromium Single Cell Gene Expression analysis as described in the CITE-seq and cell hashing protocol on the CITE-seq website (https://citeseq.files.wordpress.com/2019/02/cite-seq_and_hashing_protocol_190213.pdf). Briefly, samples were blocked by incubation with TruStain fcX in a 50 μL cell staining buffer for 20 minutes on ice. Following the blocking step, samples were stained with Total-seq antibodies purchased from BioLegend: CCR2/CD192 (SA203G11, 150625), CD117/c-kit (2B8, 105843), CD11c (N418, 117355), CD172a/SIRPɑ (P84, 144033), CD38 (90, 102733), CD44 (IM7, 103045), CD45R/B220 (RA3-6B2, 103263), CD8a (53-6.7, 10073), CD90.1 (OX-7, 202547), Cx3cr1 (SA011F11, 149041), F4/80 (BM8, 123153), I-A/I-E (M5/114.15.2, 107653), Ly6C (HK1.4, 128047), Ly6G (1A8, 127655), NK1.1 (PK136, 108755), PD-1 (RMP1-30, 109123), PD-L1 (MIH6, 153604), CD169/Siglec-1 (3D6.112, 142425), Siglec-H (551, 129615), TMEM119 (A16075D, 853303), XCR1 (Zet, 148227), CD24 (M1/69, 101841), CD103 (2E7, 121437), CD64 (X54-5/7.1, 139325), CD83 (Michel-19, 121519), CD45 (30-F11, 103159), Cd11b (M1/70,101265), CD86 (GL-1, 105047), CD3 (17-A2, 100251), CD4 (RM4-5,100569), and CD25 (PC61, 102055). For gut immune cell CITE-seq, in addition to the antibodies listed above the following Total-seq antibodies purchased from BioLegend were also included in the cocktail: CD335 (29A1.4, 137633) and CD127 (A7R34, 135045). Additionally, each sample was stained with one unique hashing antibody purchased from BioLegend: HTO1 (M1/42; 30-F11, 155801), HTO2 (M1/42; 30-F11, 155803), HTO3 (M1/42; 30-F11, 155805), HTO4 (M1/42; 30-F11, 155807), HTO5 (M1/42; 30-F11, 155809), HTO6(M1/42; 30-F11, 155811), HTO7(M1/42; 30-F11, 155813), HTO8 (M1/42; 30-F11, 155815). After 25 minutes of staining, samples were washed 4 times prior to delivering the prepared samples to the University of Notre Dame Genomics & Bioinformatics Core Facility (GBCF) for 10X Genomics Chromium Single Cell Gene Expression analysis.
CITE-seq Library Preparation and Illumina sequencing
For CITE-seq experiments, GBCF prepared cells for 10X Genomics Chromium single cell capture. cDNA libraries were prepared according to the standard CITE-seq (https://citeseq.files.wordpress.com/2019/02/cite-seq_and_hashing_protocol_190213.pdf) and 10x Genomics standard protocols. Kits necessary for library preparation included Chromium Single Cell 3′ Library and Gel Bead Kit v3 (10x Genomics, PN-10000092); Chromium Next GEM Single Cell 3′ GEM Library and Gel Bead Kit v3.1 (10x Genomics, PN-1000121); Chromium Chip B Single Cell Kit (10x Genomics, PN-1000074); Chromium i7 Multiplex Kit (10x Genomics, PN-120262). Primers required for library preparation include:
ADT_TruSeq_i7_UDI01 - CAAGCAGAAGACGGCATACGAGAACCGCGGGTGACTGGAGTTCCTTGGCACCCGAGAATTCCA
ADT_TruSeq_i7_UDI02 - CAAGCAGAAGACGGCATACGAGGGTTATAAGTGACTGGAGTTCCTTGGCACCCGAGAATTCCA
HTO_Nextera_i7_UDP01 - CAAGCAGAAGACGGCATACGAGATCGCTCAGTGTGACTGGAGTTCAGACGTGTGC
HTO_Nextera_i7_UDP04 - CAAGCAGAAGACGGCATACGAGATCTTATGGAGTGACTGGAGTTCAGACGTGTGC
HTO-N701 - CAAGCAGAAGACGGCATACGAGATTCGCCTTAGTGACTGGAGTTCAGACGTGTGC
HTO-N702 - CAAGCAGAAGACGGCATACGAGATCTAGTACGGTGACTGGAGTTCAGACGTGTGC
ADT-RPI-1 - CAAGCAGAAGACGGCATACGAGATCGTGATGTGACTGGAGTTCCTTGGCACCCGAGAATTCCA
ADT-RPI-2 - CAAGCAGAAGACGGCATACGAGATACATCGGTGACTGGAGTTCCTTGGCACCCGAGAATTCCA
Libraries (cDNA-, ADT-, and HTO-derived) were validated by Qubit High Sensitivity ds DNA and Agilent Bioanalyzer DNA High-Sensitivity Chip analyses. After which, libraries were submitted to Indiana University School of Medicine Center for Medical Genomics for multiplexing into a single pool and Illumina sequencing. The multiplex pool contained cDNA library, ADT-derived library, and HTO-derived library by molarity as reported by Agilent TapeStation System to achieve final reads ~50,000–70,000 cDNA reads/cells, ~3,000–5,000 ADT reads/cells and ~2,000 HTO reads/cell. The final library pool was sequenced on the NovaSeq6000 System using NovaSeq XP kit and NovaSeq S2 flow cell (100 cycle) kit (Read1 26-bp, Read2 91-bp and Index1 8-bp). The raw base sequence calls were demultiplexed into sample-specific cDNA, ADT and HTO FASTQ files with bcl2fastq2 Conversion Software v2.20 through Cell-Ranger V3.1.0.
QUANTIFICATION AND STATISTICAL ANALYSIS
CITE-seq analysis and statistical analysis
Raw FASTQ files were processed using the Cellranger V3.1.0 software package (10X genomics Inc.) for RNA expression matrix and CITE antibody counts matrix. The data from young and aged generated from two GEM wells were combined using a cellranger aggr pipeline (10X genomics Inc.). Cells were sequenced to comparable sequencing depths (50,084–69,026 reads/cell) and had a similar median unique molecular identifier (UMI) count and median gene number in all conditions. We performed most filtering/normalization/scaling and dimensional reduction, clustering, and differential expression analyses using the R Studio and R package Seurat_3.1.1 (Ihaka and Gentleman, 1996; Satija et al., 2015). Filtering, normalizing and demultiplexing at the cell and gene levels resulted in a final set of 22,278 cells with 1,128–3,515 cells per sample. After pre-filtering and quality control based on minimum gene and cell observance frequency cut-offs, SCTransform function was applied to normalize and scale the data. Dimensionality reduction by principal component analysis and UMAP embedding was performed for cell cluster visualization. Cells were demultiplexed to their original sample groups using the Cell Hashing tags (HTOs). Gene expression was analyzed by Wilcoxon rank sum test unless otherwise noted in figure legend. The trajectory inference (TI) analysis was conducted using the Dyno package (https://dynverse.org/) (Saelens et al., 2019). The most appropriate method (Slingshot) was selected based on Dyno recommendations. RNA velocity was performed based on a previous publication (http://velocyto.org/) (La Manno et al., 2018). When conducting TI analysis, we also cross-referenced with RNA velocity analysis results to ensure biological meaningful interpretations. SCENIC analysis was performed on subsets of innate lymphoid cells as described here: https://rawcdn.githack.com/aertslab/SCENIC/0a4c96ed8d930edd8868f07428090f9dae264705/inst/doc/SCENIC_Running.html
We conducted this analysis as previously described (Aibar et al., 2017; Davie et al., 2018). Briefly, a gene regulatory network (GRN) is first built by identifying potential targets for transcription factors (TF) based on co-expression. Next, potential direct-binding targets (regulons) are selected through a DNA-motif analysis. Network activity is then analyzed for each individual cell by calculating area under the curve (AUC).
Gating Strategy
Canonical cell gating was performed as described previously (Mrdjen et al., 2018) and shown in Figure S2 based on the CITE-antibody reads, and in instances when a CITE antibody was not available or the reads were not clear, RNA reads for particular markers were used as a substitute and/or a filter to increase confidence. Briefly, CD45 expression level was used to segregate brain-resident (CD45Low) and peripherally-derived (CD45High) immune cells. CD45Low immune cells were further segregated on the basis of CD38, MHC-II, Tmem119, and Mrc1 into microglia (CD38-,MHC-II-/Low/Tmem119+,Mrc1−/Low) or BAM (CD38+,MHC-II+Tmem119−,Mrc1+). Within the CD45High peripheral immune populations, B cells were first identified on the basis of high CD45R-B220 and Cd19 expression. The remaining CD45High cells were segregated into potential NK and T cell populations or BMDM populations based on moderate to high or low expression of Thy1 (pan t cell marker) and Itga2 (highly expressed in T cells and NK cells), respectively. From the Thy1+Itga2+ population, NK cells were identified on the basis of Klrb1 positivity, ILCs were identified based on CD3-CD117+, and T cell subsets were identified based on CD3+ and CD4+ or CD8+. The potential BMDM population was filtered to exclude cells with low CD11b and Itgam expression and then gated based on Ly6C and Ly6G expression to identify Ly6CLow/NegLy6G- patrolling monocytes, Ly6CHighLy6G- inflammatory monocytes, and Ly6C+Ly6G+ neutrophils. We verified the accuracy of the gating by examining the RNA expression of CNS native myeloid marker genes; Tmem119, and Mrc1 and BMDM-specific genes; Itga2, Thy1, and Itgam in the identified cell populations.
Integrative gene expression and microbiota analysis
Integrated analysis evaluating correlations between gut microbiota composition and cluster specific gene expression changes were analyzed by following a specific workflow that uses sparse Canonical Correlation Analysis (sparse CCA) (https://f1000research.com/articles/5-1492/v2). Differentially expressed genes (only with adj p value < 0.05) of a given Cell-ID type (i.e., Ly6CHigh) between young mice (3 samples) and aged mice (3 samples) were compared with their respective host microbial operational taxonomic units (OTUs). OTU tables were filtered to remove rare taxa. OTU tables only include taxa that have a minimum of 4 reads and have constant read counts across 6 samples. Sparse CCA analysis was performed based on the best sparsity penalties value selected through CCA.permute() provided in the PMA R package. The sparse CCA result reflecting the selected feature’s ability to best explain covariation was used as input to further PCA analysis. The PCA result was then presented as PCA triplots. The CCA result was also analyzed using Spearman correlation using the cor.test() function with two-sided alternative hypothesis. Representative gene-taxa correlations were visualized using the corrplots R package, where the strength of the correlation is indicated by the color scale bar.
Supplementary Material
KEY RESOURCES TABLE
| REAGENT or RESOURCE | SOURCE | IDENTIFIER |
|---|---|---|
| Antibodies | ||
| CITE-seq: rat anti-CCR2/CD192 (SA203G11) | Biolegend | Cat#150625; RRID:AB_2783122 |
| CITE-seq: rat anti-CD117/c-kit (2B8) | Biolegend | Cat#105843; RRID:AB_2749960 |
| CITE-seq: rat anti-CD11b (M1/70) | Biolegend | Cat#101265; RRID:AB_2734152 |
| CITE-seq: armenian hamster anti-CD11c (N418) | Biolegend | Cat#117355; RRID:AB_2750352 |
| CITE-seq: rat anti-CD172a/SIRPα (P84) | Biolegend | Cat#144033; RRID:AB_2800670 |
| CITE-seq: rat anti-CD25 (PC61) | Biolegend | Cat#102055; RRID:AB_2749982 |
| CITE-seq: rat anti-CD3 (17A2) | Biolegend | Cat#100251; RRID:AB_2750533 |
| CITE-seq: rat anti-CD38 (90) | Biolegend | Cat#102733; RRID:AB_2750556 |
| CITE-seq: rat anti-CD4 (RM4–5) | Biolegend | Cat#100569; RRID:AB_2749956 |
| CITE-seq: rat anti-CD44 (IM7) | Biolegend | Cat#103045; RRID:AB_2734154 |
| CITE-seq: rat anti-CD45 (30-F11) | Biolegend | Cat#103159; RRID:AB_2734156 |
| CITE-seq: rat anti-CD45R/B220 (RA3-6B2) | Biolegend | Cat#103263; RRID:AB_2734158 |
| CITE-seq: rat anti-CD86 (GL-1) | Biolegend | Cat#105047; RRID:AB_2750348 |
| CITE-seq: rat anti-CD8a (53-6.7) | Biolegend | Cat#100773; RRID:AB_2734151 |
| CITE-seq: mouse anti-CD90.1 (OX-7) | Biolegend | Cat#202547; RRID:AB_2783141 |
| CITE-seq: mouse anti-Cx3cr1 (SA011F11) | Biolegend | Cat#149041; RRID:AB_2783121 |
| CITE-seq: rat anti-F4/80 (BM8) | Biolegend | Cat#123153; RRID:AB_2749986 |
| CITE-seq: rat anti-I-A/I-E (M5/114.15.2) | Biolegend | Cat#107653; RRID:AB_2750505 |
| CITE-seq: rat anti-Ly6C (HK1.4) | Biolegend | Cat#128047; RRID:AB_2749961 |
| CITE-seq: rat anti-Ly6G (1A8) | Biolegend | Cat#127655; RRID:AB_2749962 |
| CITE-seq: mouse anti-NK1.1 (PK136) | Biolegend | Cat#108755; RRID:AB_2750536 |
| CITE-seq: rat anti-PD-1 (RMP1–30) | Biolegend | Cat#109123; RRID:AB_2734169 |
| CITE-seq: rat anti-PD-L1 (MIH6) | Biolegend | Cat#153604; RRID:AB_2783125 |
| CITE-seq: rat anti-CD169/Siglec-1 (3D6.112) | Biolegend | Cat#142425; RRID:AB_2783106 |
| CITE-seq: rat anti-Siglec-H (551) | Biolegend | Cat#129615; RRID:AB_275053 |
| CITE-seq: mouse anti-TMEM119 (A16075D) | Biolegend | Cat#853303; RRID:AB_2801201 |
| CITE-seq: mouse anti-XCR1 (Zet) | Biolegend | Cat#148227; RRID:AB_2783120 |
| CITE-seq: rat anti-CD24 (M1/69) | Biolegend | Cat#101841; RRID:AB_2750380 |
| CITE-seq: rat armenian hamster anti-CD103 (2e7) | Biolegend | Cat#121437; RRID:AB_2750349 |
| CITE-seq: mouse anti-CD64 (X54-5/7.1) | Biolegend | Cat#139325; RRID:AB_2750367 |
| CITE-seq: mouse anti-CD83 (Michel-19) | Biolegend | Cat#121519; RRID:AB_2783061 |
| CITE-seq: rat anti-mouse Hashtag 1 antibody (M1/42; 30-F11) | Biolegend | Cat#155801; RRID:AB_2750032 |
| CITE-seq: rat anti-mouse Hashtag 2 antibody (M1/42; 30-F11) | Biolegend | Cat#155803; RRID:AB_2750033 |
| CITE-seq: rat anti-mouse Hashtag 3 antibody (M1/42; 30-F11) | Biolegend | Cat#155805; RRID:AB_2750034 |
| CITE-seq: rat anti-mouse Hashtag 4 antibody (M1/42; 30-F11) | Biolegend | Cat#155807; RRID:AB_2750035 |
| CITE-seq: rat anti-mouse Hashtag 5 antibody (M1/42; 30-F11) | Biolegend | Cat#155809; RRID:AB_2750036 |
| CITE-seq: rat anti-mouse Hashtag 6 antibody (M1/42; 30-F11) | Biolegend | Cat#155811; RRID:AB_2750037 |
| Chemicals, Peptides, and Recombinant Proteins | ||
| FcR Block Reagent, mouse | Miltenyi Biolec | Cat#130-092-575 RRID: N/A |
| Hanks Balanced Salt Solution (HBSS), 1x, -Ca, -Mg, Phenol Red | Cytiva Life Sciences | Cat#SH30588.01 RRID: N/A |
| Percoll | GE Healthcare | Cat#17-0891-02 RRID: N/A |
| Metronidazole | MedChem Express | Cat#HY-B0318 RRID: N/A |
| Vancomycin Hydrochloride | BioVision | Cat#B1507 RRID: N/A |
| Neomycin Sulfate | VWR | Cat#97061-906 RRID: N/A |
| Ampicillin Sodium Salt | Sigma Aldrich | Cat#A9518 RRID: N/A |
| Critical Commercial Assays | ||
| Chromium Single Cell 3’ Library and Gel Bead Kit v3 | 10x Genomics | PN-10000092 RRID: N/A |
| Single Cell 3’ GEM Library and Gel Bead Kit v3.1 | 10x Genomics | PN-10000092 RRID: N/A |
| Chromium Chip B Single Cell Kit | 10x Genomics | PN-1000074 RRID: N/A |
| Chromium i7 Multiplex Kit | 10x Genomics | PN-120262 RRID: N/A |
| Multi-tissue Dissociation Kit I | Miltenyi Biotec | 130-110-201 RRID: N/A |
| CD45 Microbeads | Miltenyi Biotec | 130-052-301 RRID: N/A |
| ZymoBIOMICS DNA Miniprep Kit | Zymo Research | D4300 RRID: N/A |
| MiSeq V2 500 cycle Kit | Illumina | MS-102-2003 RRID: N/A |
| Nextera XT Index Kit | Illumina | FC-131-1096 |
| Deposited Data | ||
| Mouse CITE-seq data | This paper | GSE148127 |
| 16S Gut Microbiome data | This paper | GSE160628 |
| Experimental Models: Organisms/Strains | ||
| C57BL/6 | Jackson Laboratories | Stock#:000664 RRID: N/A |
| Oligonucleotides | ||
| Primer: ADT_TruSeq_i7_UDI01 - CAAGCAGAAGACGGCATACGAGAACCGCGGGTGACTGGAGTTCCTTGGCACCCGAGAATTCCA | This Paper | N/A |
| Primer: ADT_TruSeq_i7_UDI02 - CAAGCAGAAGACGGCATACGAGGGTTATAAGTGACTGGAGTTCCTTGGCACCCGAGAATTCCA | This Paper | N/A |
| Primer: ADT-RPI-1 - CAAGCAGAAGACGGCATACGAGATCGTGATGTGACTGGAGTTCCTTGGCACCCGAGAATTCCA | This Paper | N/A |
| Primer: ADT-RPI-2 - CAAGCAGAAGACGGCATACGAGATACATCGGTGACTGGAGTTCCTTGGCACCCGAGAATTCCA | This Paper | N/A |
| Primer: HTO_Nextera_i7_UDP01 - CAAGCAGAAGACGGCATACGAGATCGCTCAGTGTGACTGGAGTT CAGACGTGTGC | This Paper | N/A |
| Primer: HTO_Nextera_i7_UDP04 - CAAGCAGAAGACGGCATACGAGATCTTATGGAGTGACTGGAGTTCAGACGTGTGC | This Paper | N/A |
| Primer: HTO-N701 - CAAGCAGAAGACGGCATACGAGATTCGCCTTAGTGACTGGAGTTCAGACGTGTGC | This Paper | N/A |
| Primer: HTO-N702 - CAAGCAGAAGACGGCATACGAGATCTAGTACGGTGACTGGAGTTCAGACGTGTGC | This Paper | N/A |
| Recombinant DNA | ||
| Software and Algorithms | ||
| R studio | (Ihaka and Gentleman, 1996) | https://rstudio.com |
| CellRanger 3.1.0 | 10x Genomics | https://support.10xgenomics.com/single-cell-gene-expression/software/downloads/latest |
| Seurat_3.1.1 | (Satija et al., 2015) | https://satijalab.org/seurat/ |
| SCENIC/AU Cell | (Aibaretal., 2017) | https://aertslab.org/#scenic |
| DYNO | (Saelens et al., 2019) | https://dynverse.org |
| GSVA | (Hanzelmann et al., 2013) | https://rdrr.io/bioc/GSVA/ |
| DADA2 | (Callahan et al., 2016) | https://benjjneb.github.io/dada2/ |
| RNA Velocity | (La Manno et al., 2018) | http://velocyto.org |
| Other | ||
| Illumina NovaSeq 6000 | Illumina | N/A |
| Illumina MiSeq | Illumina | N/A |
| 10x Chromium Controller and Accessory Kit | 10x Genomics | PN-120223 |
Highlights.
CNS native immune cells exhibit age-associated inflammatory qualities
Ly6C+ monocytes display transcriptional plasticity in the aged mouse brain
Innate lymphoid cell plasticity reflects age-associated chronic neuroinflammation
Gut dysbiosis affects innate lymphoid cell plasticity only in aged mice
ACKNOWLEDGMENTS
This work was partially funded by NIH R01 CA194697-01 (S.Z.), NIH R01 CA222405 - 01A1 (S.Z.), the University of Notre Dame CRND Catalyst Award (S.Z.), and the Walther Cancer Foundation Harper Cancer Research Institute Award (S.M.G.). We acknowledge and thank the Dee Family endowment (S.Z.) and are additionally grateful for the technical support of the following core facilities: Notre Dame Genomics and Bioinformatics Core Facility, Notre Dame Freimann Life Sciences Center, Indiana University School of Medicine Center for Medical Genomics, and Indiana University Simon Cancer Center CTSI Center for Medical Genomics Core Facility.
Footnotes
SUPPLEMENTAL INFORMATION
Supplemental Information can be found online at https://doi.org/10.1016/j.celrep.2020.108438.
DECLARATION OF INTERESTS
The authors declare no competing interests.
REFERENCES
- Aibar S, González-Blas CB, Moerman T, Huynh-Thu VA, Imrichova H, Hulselmans G, Rambow F, Marine J-C, Geurts P, Aerts J, et al. (2017). SCENIC: single-cell regulatory network inference and clustering. Nat. Methods 14, 1083–1086. [DOI] [PMC free article] [PubMed] [Google Scholar]
- Al-Mossawi H, Yager N, Taylor CA, Lau E, Danielli S, de Wit J, Gilchrist J, Nassiri I, Mahe EA, Lee W, et al. (2019). Context-specific regulation of surface and soluble IL7R expression by an autoimmune risk allele. Nat. Commun 10, 4575. [DOI] [PMC free article] [PubMed] [Google Scholar]
- Arpaia N, Campbell C, Fan X, Dikiy S, van der Veeken J, deRoos P, Liu H, Cross JR, Pfeffer K, Coffer PJ, and Rudensky AY (2013). Metabolites produced by commensal bacteria promote peripheral regulatory T-cell generation. Nature 504, 451–455. [DOI] [PMC free article] [PubMed] [Google Scholar]
- Auffray C, Sieweke MH, and Geissmann F (2009). Blood monocytes: development, heterogeneity, and relationship with dendritic cells. Annu. Rev. Immunol 27, 669–692. [DOI] [PubMed] [Google Scholar]
- Bachem A, Makhlouf C, Binger KJ, de Souza DP, Tull D, Hochheiser K, Whitney PG, Fernandez-Ruiz D, Dähling S, Kastenmüller W, et al. (2019). Microbiota-Derived Short-Chain Fatty Acids Promote the Memory Potential of Antigen-Activated CD8+ T Cells. Immunity 51, 285–297. [DOI] [PubMed] [Google Scholar]
- Bal SM, Golebski K, and Spits H (2020). Plasticity of innate lymphoid cell subsets. Nat. Rev. Immunol 20, 552–565. [DOI] [PubMed] [Google Scholar]
- Belkaid Y, and Hand TW (2014). Role of the microbiota in immunity and inflammation. Cell 157, 121–141. [DOI] [PMC free article] [PubMed] [Google Scholar]
- Buchta Rosean C, Bostic RR, Ferey JCM, Feng T-Y, Azar FN, Tung KS, Dozmorov MG, Smirnova E, Bos PD, and Rutkowski MR (2019). Pre-existing commensal dysbiosis is a host-intrinsic regulator of tissue inflammation and tumor cell dissemination in hormone receptor-positive breast cancer. Cancer Res. Published July 2019. 10.1158/0008-5472.CAN-18-3464. [DOI] [PMC free article] [PubMed] [Google Scholar]
- Callahan BJ, McMurdie PJ, Rosen MJ, Han AW, Johnson AJA, and Holmes SP (2016). DADA2: High-resolution sample inference from Illumina amplicon data. Nat. Methods 13, 581–583. [DOI] [PMC free article] [PubMed] [Google Scholar]
- Clarke TB, Davis KM, Lysenko ES, Zhou AY, Yu Y, and Weiser JN (2010). Recognition of peptidoglycan from the microbiota by Nod1 enhances systemic innate immunity. Nat. Med 16, 228–231. [DOI] [PMC free article] [PubMed] [Google Scholar]
- Colonna M (2018). Innate Lymphoid Cells: Diversity, Plasticity, and Unique Functions in Immunity. Immunity 48, 1104–1117. [DOI] [PMC free article] [PubMed] [Google Scholar]
- Couter CJ, and Surana NK (2016). Isolation and Flow Cytometric Characterization of Murine Small Intestinal Lymphocytes. J. Vis. Exp Published online May 8, 2016. 10.3791/54114. [DOI] [PMC free article] [PubMed] [Google Scholar]
- Davie Kristofer, Janssens Jasper, Koldere Duygu, Waegeneer Maxime De, Pech Uli, Kreft Łukasz, Aibar Sara, Makhzami Samira, Christiaens Valerie, et al. (2018). A Single-Cell Transcriptome Atlas of the Aging Drosophila Brain. Cell 174, 982–998. [DOI] [PMC free article] [PubMed] [Google Scholar]
- Derecki NC, Aleman-Muench GR, Lewis G, Banie H, Eckert W, He Y, Fourgeaud L, Rao S, Ma JY, Carreira V, et al. (2019). Meningeal Type-2 Innate Lymphoid Cells Emerge as Novel Regulators of Microglial Activation and Blood-Brain Barrier Stability: A Central Role for IL-10 (Social Science Research Network). [Google Scholar]
- Dinan TG, and Cryan JF (2017). Gut instincts: microbiota as a key regulator of brain development, ageing and neurodegeneration. J. Physiol 595, 489–503. [DOI] [PMC free article] [PubMed] [Google Scholar]
- Dulken BW, Buckley MT, Navarro Negredo P, Saligrama N, Cayrol R, Leeman DS, George BM, Boutet SC, Hebestreit K, Pluvinage JV, et al. (2019). Single-cell analysis reveals T cell infiltration in old neurogenic niches. Nature 571, 205–210. [DOI] [PMC free article] [PubMed] [Google Scholar]
- Erickson MA, and Banks WA (2019). Age-Associated Changes in the Immune System and Blood−Brain Barrier Functions. Int. J. Mol. Sci 20, 1632. [DOI] [PMC free article] [PubMed] [Google Scholar]
- Erny D, Hrabě de Angelis AL, Jaitin D, Wieghofer P, Staszewski O, David E, Keren-Shaul H, Mahlakoiv T, Jakobshagen K, Buch T, et al. (2015). Host microbiota constantly control maturation and function of microglia in the CNS. Nat. Neurosci 18, 965–977. [DOI] [PMC free article] [PubMed] [Google Scholar]
- Erny D, Hrabě de Angelis AL, and Prinz M (2017). Communicating systems in the body: how microbiota and microglia cooperate. Immunology 150, 7–15. [DOI] [PMC free article] [PubMed] [Google Scholar]
- Franceschi C, Garagnani P, Parini P, Giuliani C, and Santoro A (2018). Inflammaging: a new immune-metabolic viewpoint for age-related diseases. Nat. Rev. Endocrinol 14, 576–590. [DOI] [PubMed] [Google Scholar]
- Gattinoni L, Speiser DE, Lichterfeld M, and Bonini C (2017). T memory stem cells in health and disease. Nat. Med 23, 18–27. [DOI] [PMC free article] [PubMed] [Google Scholar]
- Gellhaar S, Sunnemark D, Eriksson H, Olson L, and Galter D (2017). Myeloperoxidase-immunoreactive cells are significantly increased in brain areas affected by neurodegeneration in Parkinson’s and Alzheimer’s disease. Cell Tissue Res. 369, 445–454. [DOI] [PMC free article] [PubMed] [Google Scholar]
- Giri M, Shah A, Upreti B, and Rai JC (2017). Unraveling the genes implicated in Alzheimer’s disease. Biomed. Rep 7, 105–114. [DOI] [PMC free article] [PubMed] [Google Scholar]
- Gury-BenAri M, Thaiss CA, Serafini N, Winter DR, Giladi A, Lara-Astiaso D, Levy M, Salame TM, Weiner A, David E, et al. (2016). The Spectrum and Regulatory Landscape of Intestinal Innate Lymphoid Cells Are Shaped by the Microbiome. Cell 166, 1231–1246. [DOI] [PubMed] [Google Scholar]
- Hammond TR, Dufort C, Dissing-Olesen L, Giera S, Young A, Wysoker A, Walker AJ, Gergits F, Segel M, Nemesh J, et al. (2019). Single-Cell RNA Sequencing of Microglia throughout the Mouse Lifespan and in the Injured Brain Reveals Complex Cell-State Changes. Immunity 50, 253–271. [DOI] [PMC free article] [PubMed] [Google Scholar]
- Hänzelmann S, Castelo R, and Guinney J (2013). GSVA: gene set variation analysis for microarray and RNA-seq data. BMC Bioinformatics 14, 7. [DOI] [PMC free article] [PubMed] [Google Scholar]
- Ihaka R, and Gentleman R (1996). R: A Language for Data Analysis and Graphics. J. Comput. Graph. Stat 5, 299–314. [Google Scholar]
- Intlekofer AM, Takemoto N, Wherry EJ, Longworth SA, Northrup JT, Palanivel VR, Mullen AC, Gasink CR, Kaech SM, Miller JD, et al. (2005). Effector and memory CD8+ T cell fate coupled by T-bet and eomesodermin. Nat. Immunol 6, 1236–1244. [DOI] [PubMed] [Google Scholar]
- Jordão MJC, Sankowski R, Brendecke SM, Sagar, Locatelli G, Tai Y-H, Tay TL, Schramm E, Armbruster S, Hagemeyer N, et al. (2019). Single-cell profiling identifies myeloid cell subsets with distinct fates during neuroinflammation. Science 363, eaat7554. [DOI] [PubMed] [Google Scholar]
- Keren-Shaul H, Spinrad A, Weiner A, Matcovitch-Natan O, Dvir-Szternfeld R, Ulland TK, David E, Baruch K, Lara-Astaiso D, Toth B, et al. (2017). A Unique Microglia Type Associated with Restricting Development of Alzheimer’s Disease. Cell 169, 1276–1290. [DOI] [PubMed] [Google Scholar]
- Knox JJ, Cosma GL, Betts MR, and McLane LM (2014). Characterization of T-bet and eomes in peripheral human immune cells. Front. Immunol 5, 217. [DOI] [PMC free article] [PubMed] [Google Scholar]
- Kwong B, Rua R, Gao Y, Flickinger J Jr., Wang Y, Kruhlak MJ, Zhu J, Vivier E, McGavern DB, and Lazarevic V (2017). T-bet-dependent NKp46+ innate lymphoid cells regulate the onset of TH17-induced neuroinflammation. Nat. Immunol 18, 1117–1127. [DOI] [PMC free article] [PubMed] [Google Scholar]
- La Manno G, Soldatov R, Zeisel A, Braun E, Hochgerner H, Petukhov V, Lidschreiber K, Kastriti ME, Lönnerberg P, Furlan A, et al. (2018). RNA velocity of single cells. Nature 560, 494–498. [DOI] [PMC free article] [PubMed] [Google Scholar]
- Lang R, and Raffi FAM (2019). Dual-Specificity Phosphatases in Immunity and Infection: An Update. Int. J. Mol. Sci 20, 2710. [DOI] [PMC free article] [PubMed] [Google Scholar]
- Langille MG, Meehan CJ, Koenig JE, Dhanani AS, Rose RA, Howlett SE, and Beiko RG (2014). Microbial shifts in the aging mouse gut. Microbiome 2, 50. [DOI] [PMC free article] [PubMed] [Google Scholar]
- Lehallier B, Gate D, Schaum N, Nanasi T, Lee SE, Yousef H, Moran Losada P, Berdnik D, Keller A, Verghese J, et al. (2019). Undulating changes in human plasma proteome profiles across the lifespan. Nat. Med 25, 1843–1850. [DOI] [PMC free article] [PubMed] [Google Scholar]
- Levy M, Kolodziejczyk AA, Thaiss CA, and Elinav E (2017). Dysbiosis and the immune system. Nat. Rev. Immunol 17, 219–232. [DOI] [PubMed] [Google Scholar]
- Ma Q, Xing C, Long W, Wang HY, Liu Q, and Wang R-F (2019). Impact of microbiota on central nervous system and neurological diseases: the gut-brain axis. J. Neuroinflammation 16, 53. [DOI] [PMC free article] [PubMed] [Google Scholar]
- Michaud J-P, Bellavance M-A, Préfontaine P, and Rivest S (2013). Real-time in vivo imaging reveals the ability of monocytes to clear vascular amyloid beta. Cell Rep. 5, 646–653. [DOI] [PubMed] [Google Scholar]
- Mildner A, Schönheit J, Giladi A, David E, Lara-Astiaso D, Lorenzo-Vivas E, Paul F, Chappell-Maor L, Priller J, Leutz A, et al. (2017). Genomic Characterization of Murine Monocytes Reveals C/EBPβ Transcription Factor Dependence of Ly6C− Cells. Immunity 46, 849–862. [DOI] [PubMed] [Google Scholar]
- Mrdjen D, Pavlovic A, Hartmann FJ, Schreiner B, Utz SG, Leung BP, Lelios I, Heppner FL, Kipnis J, Merkler D, et al. (2018). High-Dimensional Single-Cell Mapping of Central Nervous System Immune Cells Reveals Distinct Myeloid Subsets in Health, Aging, and Disease. Immunity 48, 380–395. [DOI] [PubMed] [Google Scholar]
- O’Toole PW, and Jeffery IB (2015). Gut microbiota and aging. Science 350, 1214–1215. [DOI] [PubMed] [Google Scholar]
- Papalexi E, and Satija R (2018). Single-cell RNA sequencing to explore immune cell heterogeneity. Nat. Rev. Immunol 18, 35–45. [DOI] [PubMed] [Google Scholar]
- Plaza-Zabala A, Sierra-Torre V, and Sierra A (2017). Autophagy and Microglia: Novel Partners in Neurodegeneration and Aging. Int. J. Mol. Sci 18, 598. [DOI] [PMC free article] [PubMed] [Google Scholar]
- Quail DF, and Joyce JA (2017). The Microenvironmental Landscape of Brain Tumors. Cancer Cell 31, 326–341. [DOI] [PMC free article] [PubMed] [Google Scholar]
- Romero-Suárez S, Del Rio Serrato A, Bueno RJ, Brunotte-Strecker D, Stehle C, Figueiredo CA, Hertwig L, Dunay IR, Romagnani C, and Infante-Duarte C (2019). The Central Nervous System Contains ILC1s That Differ From NK Cells in the Response to Inflammation. Front. Immunol 10, 2337. [DOI] [PMC free article] [PubMed] [Google Scholar]
- Saelens W, Cannoodt R, Todorov H, and Saeys Y (2019). A comparison of single-cell trajectory inference methods. Nat. Biotechnol 37, 547–554. [DOI] [PubMed] [Google Scholar]
- Sampson TR, Debelius JW, Thron T, Janssen S, Shastri GG, Ilhan ZE, Challis C, Schretter CE, Rocha S, Gradinaru V, et al. (2016). Gut Microbiota Regulate Motor Deficits and Neuroinflammation in a Model of Parkinson’s Disease. Cell 167, 1469–1480. [DOI] [PMC free article] [PubMed] [Google Scholar]
- Saresella M, Marventano I, Calabrese E, Piancone F, Rainone V, Gatti A, Alberoni M, Nemni R, and Clerici M (2014). A complex proinflammatory role for peripheral monocytes in Alzheimer’s disease. J. Alzheimers Dis 38, 403–413. [DOI] [PubMed] [Google Scholar]
- Satija R, Farrell JA, Gennert D, Schier AF, and Regev A (2015). Spatial reconstruction of single-cell gene expression data. Nat. Biotechnol 33, 495–502. [DOI] [PMC free article] [PubMed] [Google Scholar]
- Shen XZ, Okwan-Duodu D, Blackwell W-L, Ong FS, Janjulia T, Bernstein EA, Fuchs S, Alkan S, and Bernstein KE (2014). Myeloid expression of angiotensin-converting enzyme facilitates myeloid maturation and inhibits the development of myeloid-derived suppressor cells. Lab. Invest 94, 536–544. [DOI] [PMC free article] [PubMed] [Google Scholar]
- Shimizu K, Sato Y, Kawamura M, Nakazato H, Watanabe T, Ohara O, and Fujii SI (2019). Eomes transcription factor is required for the development and differentiation of invariant NKT cells. Commun. Biol 2, 150. [DOI] [PMC free article] [PubMed] [Google Scholar]
- Steinbach K, Vincenti I, Egervari K, Kreutzfeldt M, van der Meer F, Page N, Klimek B, Rossitto-Borlat I, Di Liberto G, Muschaweckh A, et al. (2019). Brain-resident memory T cells generated early in life predispose to autoimmune disease in mice. Sci. Transl. Med 11, eaav5519. [DOI] [PubMed] [Google Scholar]
- Stoeckius M, Hafemeister C, Stephenson W, Houck-Loomis B, Chattopadhyay PK, Swerdlow H, Satija R, and Smibert P (2017). Simultaneous epitope and transcriptome measurement in single cells. Nat. Methods 14, 865–868. [DOI] [PMC free article] [PubMed] [Google Scholar]
- Tabula Muris Consortium (2020). A single-cell transcriptomic atlas characterizes ageing tissues in the mouse. Nature 583, 590–595. [DOI] [PMC free article] [PubMed] [Google Scholar]
- Thaiss CA, Zmora N, Levy M, and Elinav E (2016). The microbiome and innate immunity. Nature 535, 65–74. [DOI] [PubMed] [Google Scholar]
- Thériault P, ElAli A, and Rivest S (2015). The dynamics of monocytes and microglia in Alzheimer’s disease. Alzheimers Res. Ther 7, 41. [DOI] [PMC free article] [PubMed] [Google Scholar]
- Ximerakis M, Lipnick SL, Innes BT, Simmons SK, Adiconis X, Dionne D, Mayweather BA, Nguyen L, Niziolek Z, Ozek C, et al. (2019). Single-cell transcriptomic profiling of the aging mouse brain. Nat. Neurosci 22, 1696–1708. [DOI] [PubMed] [Google Scholar]
- Yang J, Zhang L, Yu C, Yang X-F, and Wang H (2014). Monocyte and macrophage differentiation: circulation inflammatory monocyte as biomarker for inflammatory diseases. Biomark. Res 2, 1. [DOI] [PMC free article] [PubMed] [Google Scholar]
- Zaiss DMW, Gause WC, Osborne LC, and Artis D (2015). Emerging functions of amphiregulin in orchestrating immunity, inflammation, and tissue repair. Immunity 42, 216–226. [DOI] [PMC free article] [PubMed] [Google Scholar]
- Zhou X, Liao W-J, Liao J-M, Liao P, and Lu H (2015). Ribosomal proteins: functions beyond the ribosome. J. Mol. Cell Biol 7, 92–104. [DOI] [PMC free article] [PubMed] [Google Scholar]
Associated Data
This section collects any data citations, data availability statements, or supplementary materials included in this article.
Supplementary Materials
Data Availability Statement
The accession number for the CITE-seq data reported in this paper is GEO: GSE148127. The accession number for the 16S gut microbiome data reported in this paper is GEO: GSE160628. All other data and code used to analyze data are available upon reasonable request for Lead Contact/corresponding author.