Abstract
Acquired therapy resistance is a major problem for anticancer treatment, yet the underlying molecular mechanisms remain unclear. Using an established breast cancer cellular model, we show that endocrine resistance is associated with enhanced phenotypic plasticity, indicated by a general downregulation of luminal/epithelial differentiation markers and upregulation of basal/mesenchymal invasive markers. Consistently, similar gene expression changes are found in clinical breast tumors and PDX samples that are resistant to endocrine therapies. Mechanistically, the differential interactions between ERα and other oncogenic transcription factors (TFs), exemplified by GATA3 and AP1, drive global enhancer gain/loss reprogramming, profoundly altering breast cancer transcriptional programs. Our functional studies in multiple culture and xenograft models reveal a coordinate role of GATA3 and AP1 in re-organizing enhancer landscapes and regulating cancer phenotypes. Collectively, our study suggests that differential high-order assemblies of TFs on enhancers trigger genome-wide enhancer reprogramming, resulting in transcriptional transitions that promote tumor phenotypic plasticity and therapy-resistance.
Keywords: enhancer, enhancer reprogramming, high-order assemblies, transcription factors, phenotypic plasticity, E2/ERα signaling, endocrine resistance
INTRODUCTION
Cancer progression, by which cancer cells adjust themselves to achieve resistance to targeted therapies, is a persistent challenge in treatments of cancers, including breast cancer. The luminal subtype cancers consist of 75% of all breast cancers1, 2 and typically benefit from targeted endocrine therapies with drugs that impinge on E2/ERα signaling, such as tamoxifen, fulvestrant or aromatase inhibitors3, 4. However, endocrine resistance and disease recurrence are common. Despite recent advances, the mechanisms responsible for this therapy resistance remain elusive.
Enhancers control temporal- or spatial-specific gene expression patterns during development and other biological processes5–7. Dysregulation of enhancer function is involved in many diseases, particularly in cancers. Various TFs bind to enhancers and trigger the recruitment of chromatin remodeling enzymes, resulting in open chromatins and a stereotypical pattern of histone modification on the adjacent nucleosomes, including H3K27ac and H3K4me16. Many enhancers are bound by Pol II and actively transcribed, generating noncoding enhancer RNAs (eRNA)8–10, which are widely used to indicate enhancer activity and target gene induction. Our previous ChIP-seq studies have revealed that E2/ERα regulates its target gene expression program primarily through binding at distal enhancers to dictate cell growth and endocrine response11–13. Differential ERα binding has been linked to breast cancer endocrine resistance and clinical outcome14, 15. But the mechanisms governing the alterations of ERα cistrome and their roles in regulating breast cancer invasive progression are not fully understood. Here we leverage culture models and patient samples to show that changes in TF-TF and TF-enhancer interactions can reorganize the landscape of ERα-bound enhancers, resulting in gene program transitions that promote plasticity and cancer progression to therapy resistance.
RESULTS
Genomic analyses identify phenotypic plasticity-related transcriptional changes in breast cancer cells with endocrine resistance.
We initiated our study on the mechanisms underlying therapy resistance with a tamoxifen-resistant (TamR) cell model that was established through long-term culture of ER+ luminal MCF7 parental (MCF7P) cell line in the presence of tamoxifen16–18. We confirmed their morphology and sensitivity to 4-OHT (Extended Data Fig. 1a, b), and verified that ERα protein levels were comparable between the two lines and that no mutations were detected in ERα gene in TamR (Extended Data Fig. 1c, d). Thus, tamoxifen resistance in TamR is not due to altered expression or mutations of ERα.
To evaluate the phenotypic differences at the gene expression level, we performed RNA-seq and identified 1,928 upregulated and 1,899 downregulated genes in TamR when compared to MCF7P (Fig. 1a). We further performed GRO-seq to detect nascent transcripts12. GRO-seq identified 1,377 upregulated genes and 1,416 downregulated genes in TamR cells (Fig. 1a). As shown in the volcano plot, majority of the differentially expressed genes detected by GRO-seq were also captured by RNA-seq (Fig. 1a). This result reinforces the notion that transcription regulation accounts for tamoxifen resistance-associated changes in gene expression.
Fig. 1. Genomic analyses identify phenotypic plasticity-related transcriptional changes in breast cancer cells with endocrine resistance.
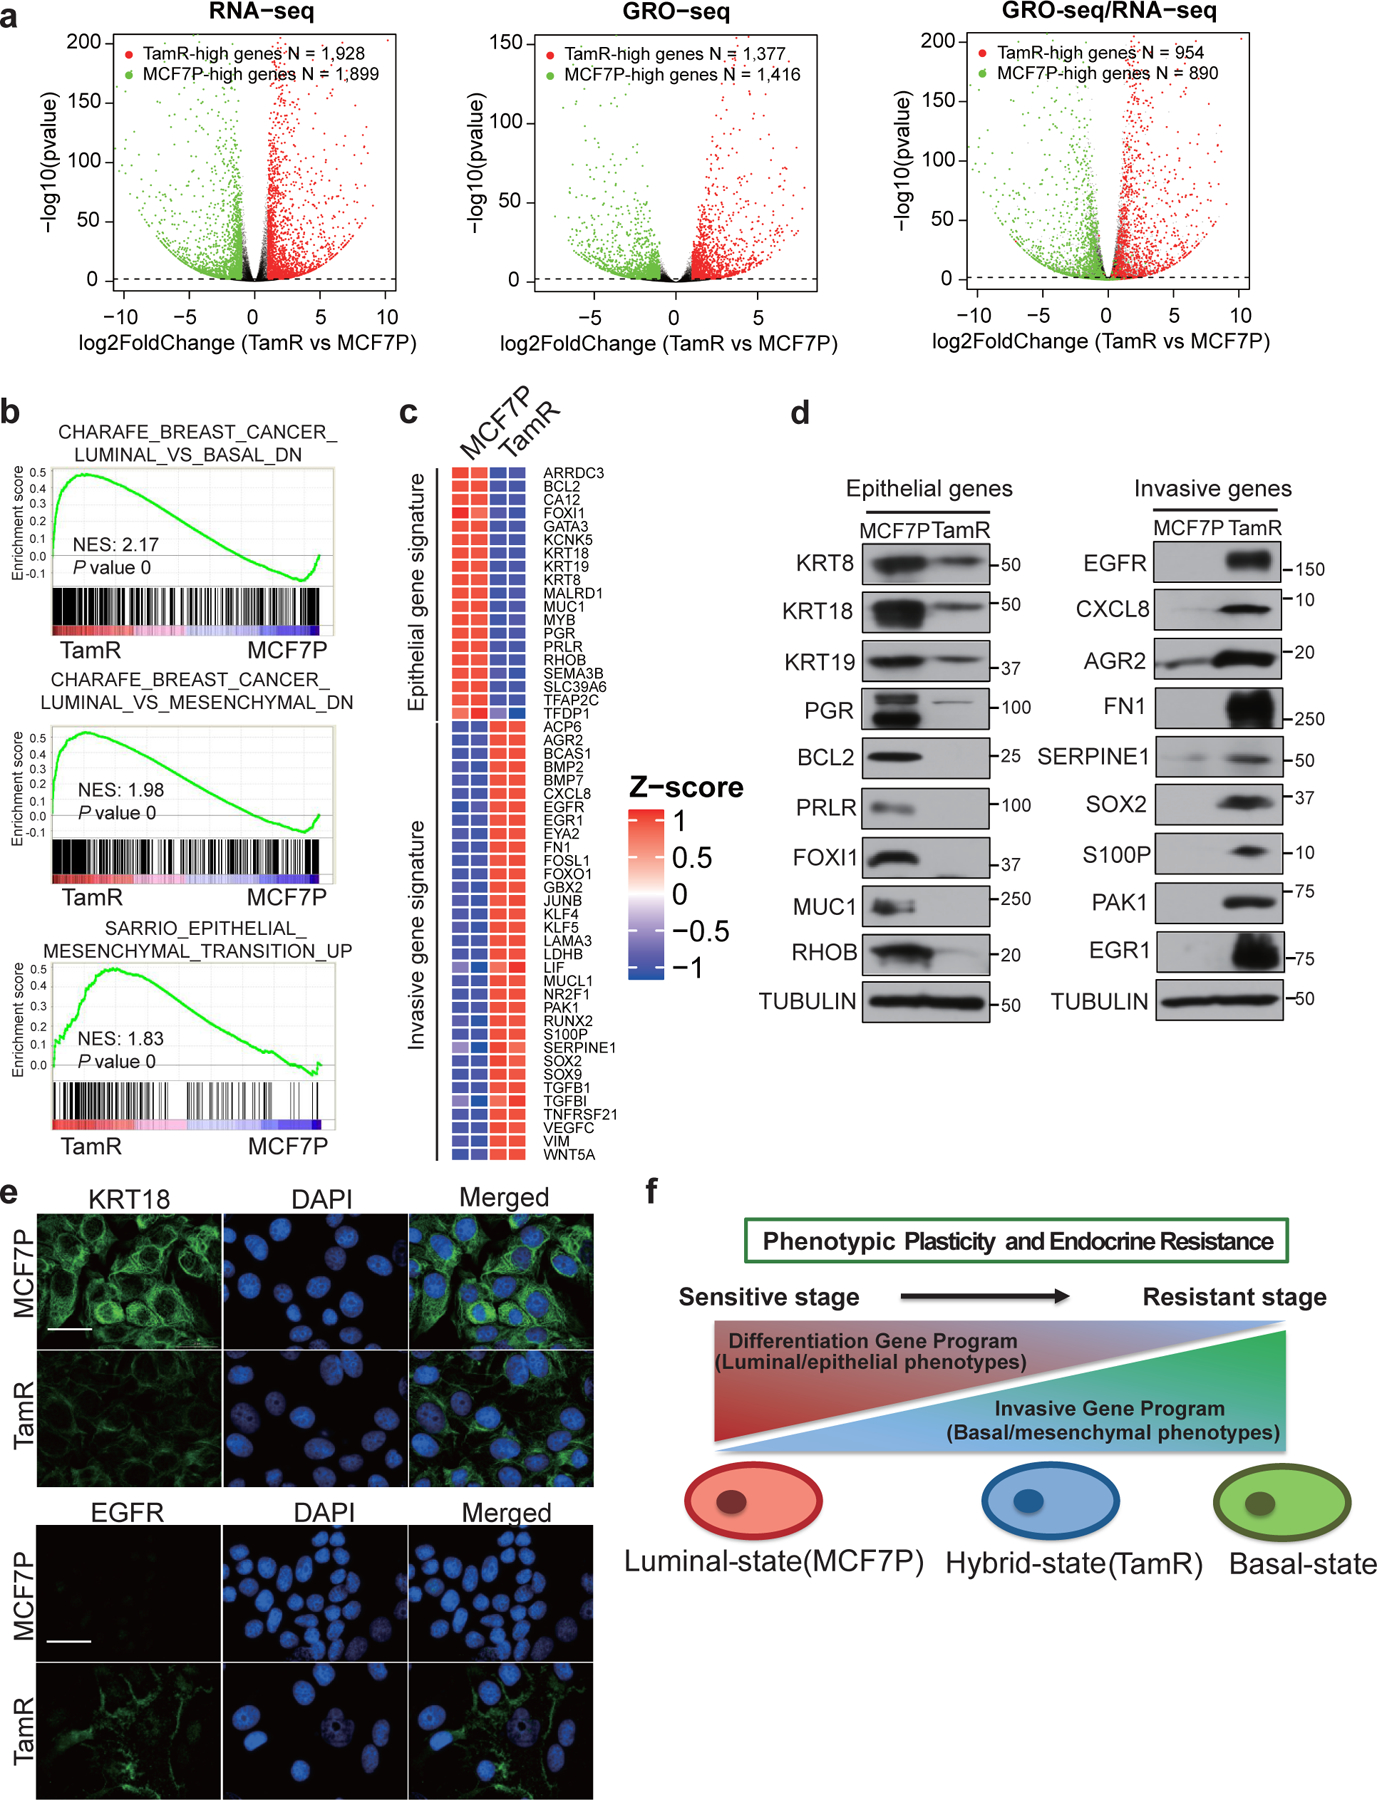
a, Volcano plots showing the genes with differential expression levels in MCF7P and TamR lines detected by RNA-seq (left panel) or GRO-seq (middle panel), and the comparison of their distributions detected by both GRO-seq and RNA-seq (right panel). Each dot represents a gene. In all panels, the green dots are genes significantly downregulated in TamR cells, and the red dots are genes significantly upregulated in TamR cells. In the right panel, the differential genes detected by GRO-seq were re-plotted based on their expressional changes measured by RNA-seq. n=2 biologically independent experiments, and P values were determined by Wald test with Benjamini-Hochberg adjustment.
b, Gene Set Enrichment Analyses (GSEA) of RNA-seq data for MCF7P and TamR revealing the association of the gene program in TamR cells with the basal/mesenchymal and EMT gene signatures. The nominal P values were determined by empirical gene-based permutation test.
c, RNA-seq heatmap depiction of selected epithelial marker genes and invasive mesenchymal genes that are differentially expressed in MCF7P and TamR lines. n=2 biologically independent experiments.
d, Western blot detection of the protein levels of selected epithelial markers and invasive genes using total cell lysates from MCF7P and TamR lines. Tubulin was used as a loading control.
e, Immunofluorescence staining for KRT18 and EGFR in MCF7P and TamR lines. Cell nuclei were stained with DAPI (blue). Scale bar, 30 μm. n= 3 wells × 2 independent experiments.
f, Schematic diagram demonstrating the plasticity-elevating phenotypic transition during the development of endocrine resistance. The luminal breast cancer cells undergo transcriptome transition by reducing differentiation gene program and enhancing invasiveness gene program to achieve resistance.
Immunoblots are representative of two independent experiments. Unprocessed immunoblots are shown in Source Data Fig. 1.
GSEA19 revealed that the upregulated genes in TamR cells were significantly enriched for the basal, mesenchymal, and epithelial-to-mesenchymal-transition (EMT) gene sets (Fig. 1b), consistent with the invasive phenotype observed in TamR cells18, 20, 21. Conversely, many luminal/epithelial marker genes were downregulated in TamR (Fig. 1c and Extended Data Fig. 1e, f). These expressional changes were confirmed with RT-qPCR (Extended Data Fig. 1g, h), Western blotting (Fig. 1d) and immunofluorescence staining (Fig. 1e). Therefore, TamR cells displayed a gene expression profile featured for EMT and hybrid epithelial/mesenchymal phenotypes (Fig. 1f).
Analyses using patient tumor tissues and PDX samples revealed phenotypic plasticity-enhancing transcriptional changes associated with therapy resistance
To examine the relevance of our findings to endocrine therapy resistance in breast cancer patients, we performed RNA-seq with paired patient biospecimens from 21 breast cancer cases before and after receiving a neoadjuvant chemoendocrine therapy (NCET) that was combined with chemotherapy and estrogen deprivation treatment using aromatase inhibitor (AI) letrozole. These ER-positive and HER2-negative patients initially responded to therapy but later developed therapy resistance and disease recurrence. GSVA revealed that NCET therapy was associated with an upregulation of EMT gene set and a downregulation of “Estrogen Response Early/Late” gene sets (Fig. 2a). The treatment-associated gene expression changes were further demonstrated by the line plot comparisons of GSVA scores of the gene sets (Fig. 2b, c), and representative luminal/epithelial and basal/mesenchymal marker genes before and after treatment (Fig. 2d and Extended Data Fig. 2a–d). These data from clinical samples add to the evidence that EMT signature and enhanced phenotypic plasticity are associated with therapy resistance in breast cancers.
Fig. 2. Analyses using patient tumor tissues and PDX samples revealed phenotypic plasticity-enhancing transcriptional changes associated with therapy resistance.
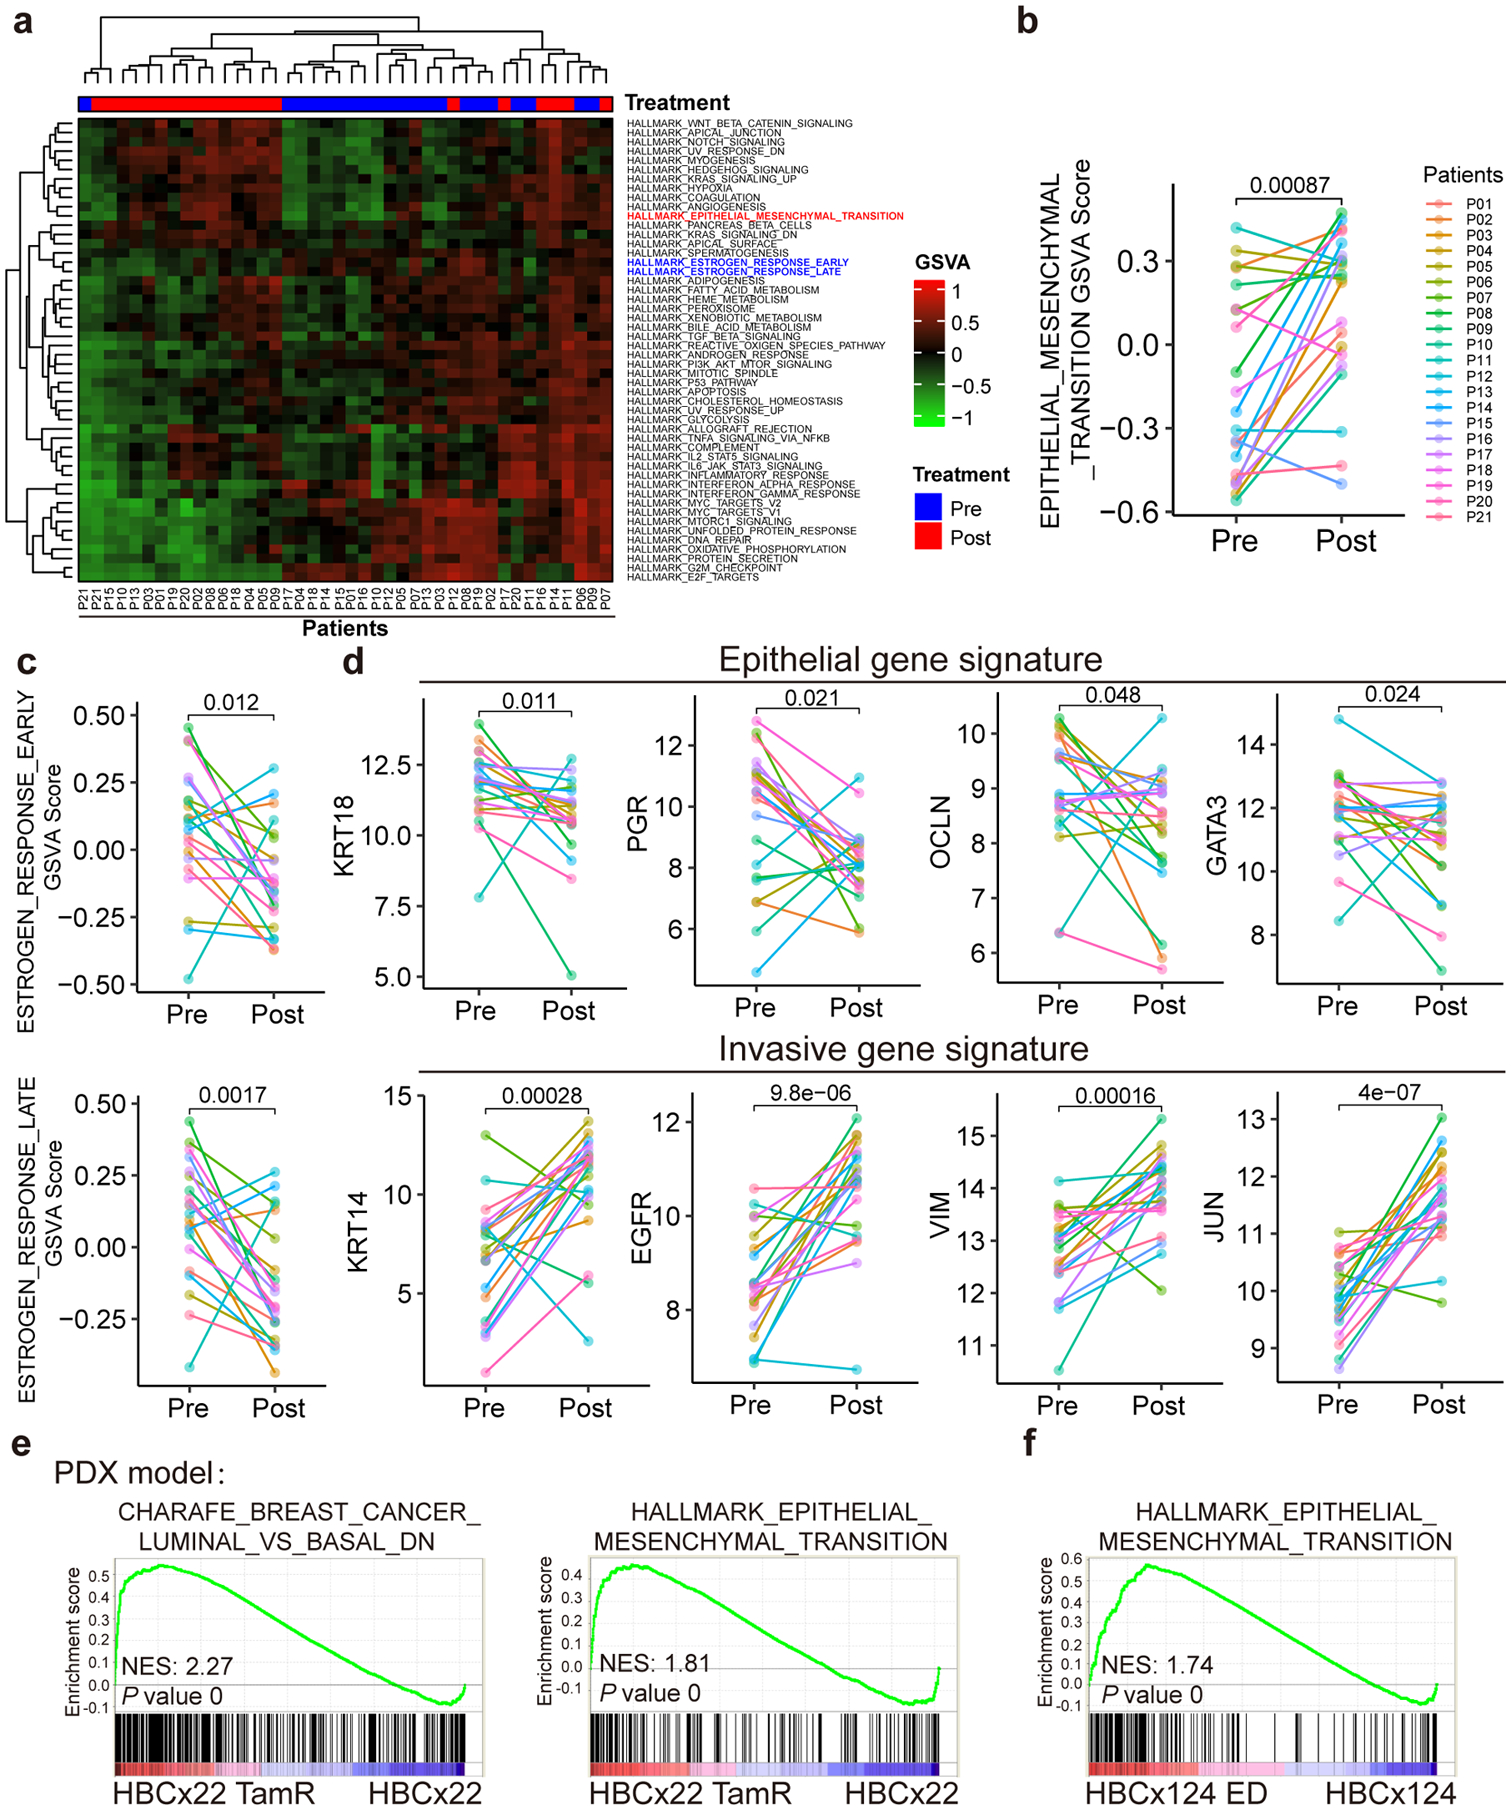
a, Heatmap of unsupervised clustering of 21 pairs of RNA-seq data (before and after receiving chemoendocrine treatment) from 21 ER+ and HER2× breast cancer patients using Gene Set Variation Analysis (GSVA) analyses for the 50 cancer hallmark gene sets from the Molecular Signature Database (MsigDB). The results demonstrate that EMT gene signature is upregulated and estrogen response early/late gene signatures are downregulated post-treatment.
b-d, Line plot comparison of GSVA scores of EMT signature (b), estrogen response early/late signatures (c), and representative epithelial and invasive genes (d) for the paired RNA-seq data (pre- and post-treatment) from the 21 patients. The results show the downregulation of luminal/epithelial genes (including estrogen response early/late signatures) and the upregulation of EMT signature and representative invasive genes at post-treatment condition. n=21 biologically independent patient samples, and P values were determined by two-sided paired t-test.
e, GSEA analysis of microarray data for paired parental (HBCx22) vs tamoxifen-resistant (HBCx22 TamR) PDX tumor samples showing the downregulation of luminal markers and upregulation of EMT markers in tamoxifen-resistant PDX samples. n=2 independent samples and the nominal P values were determined by empirical gene-based permutation test.
f, GSEA analysis of RNA-seq data for paired parental (HBCx124) vs estrogen deprivation derived resistant (HBCx124 ED) PDX tumor samples showing that the EMT gene signatures were upregulated in hormone-independent PDX samples. n=2 independent samples and the nominal P values were determined by empirical gene-based permutation test.
Statistical source data are available in Statistical Source Data Fig. 2.
We next performed gene expression profiling studies in paired patient-derived xenograft (PDX) models (parental vs tamoxifen-resistant)22. Consistent with our findings in the culture models and the patient specimens, we found a downregulation of epithelial markers and an upregulation of EMT signature genes during the acquisition of resistance (Fig. 2e and Extended Data Fig. 2e). Data derived from another pair of PDX samples after and before estrogen deprivation also support the association between endocrine resistance and EMT signature (Fig. 2f and Extended Data Fig. 2f). Consistently, cancer cells at a hybrid epithelial/mesenchymal state often acquire therapy resistance or are more invasive23, 24. Altogether, these data suggest that during resistance progression, cancer cells might undergo gene expression transition to enhance phenotypic plasticity, resulting in a more aggressive EMT-like phenotype.
Endocrine resistance accompanies global enhancer reprogramming that drives plasticity-related gene transcription
To evaluate whether the transcriptome changes in endocrine resistance are caused by altered enhancer landscape, we performed ChIP-seq in the paired MCF7P and TamR cell lines. Approximately 50% of the H3K27ac peaks were located at active gene promoters in both MCF7P and TamR (Extended Data Fig. 3a). The promoters with stronger H3K27ac peaks in TamR than in MCF7P were primarily those of the upregulated genes identified in RNA-seq and GRO-seq. Conversely, the promoters with weaker H3K27ac peaks corresponded to the downregulated genes in TamR cells (Extended Data Fig. 3b), further supporting that transcriptional regulation is a major cause of the altered gene expression in TamR cells.
With ChIP-seq of H3K4me1 and H3K27ac, we identified 7,533 MCF7P-specific enhancers that are lost in TamR (LOSS enhancers), 10,679 TamR-specific enhancers (GAIN enhancers), and 9,896 enhancers shared in both cell lines (COMMON enhancers) (Extended Data Fig. 3c). A large portion of these enhancers were ERα-bound enhancers (3,317/7,533 for LOSS; 4,450/10,679 for GAIN; 6,729/9,896 for COMMON) (Fig. 3a), suggesting that ERα enhancers are the major contributors for tamoxifen resistance-associated epigenetic changes. Thus, our subsequent studies focused on ERα-bound LOSS and GAIN enhancers. P300 ChIP-seq and ATAC-seq revealed that ERα-bound GAIN enhancers had stronger P300 binding and higher chromatin accessibility in TamR cells, whereas ERα-bound LOSS enhancers had stronger P300 binding and higher chromatin accessibility in MCF7P cells (Fig. 3a, b). A similar enhancer reprogramming event was also detected by ATAC-seq in another paired endocrine-sensitive vs -resistant cell lines (see T47DP vs T47D-TamR lines in Fig. 3b).
Fig. 3. Endocrine resistance accompanies global enhancer reprogramming that drives plasticity-related gene transcription.
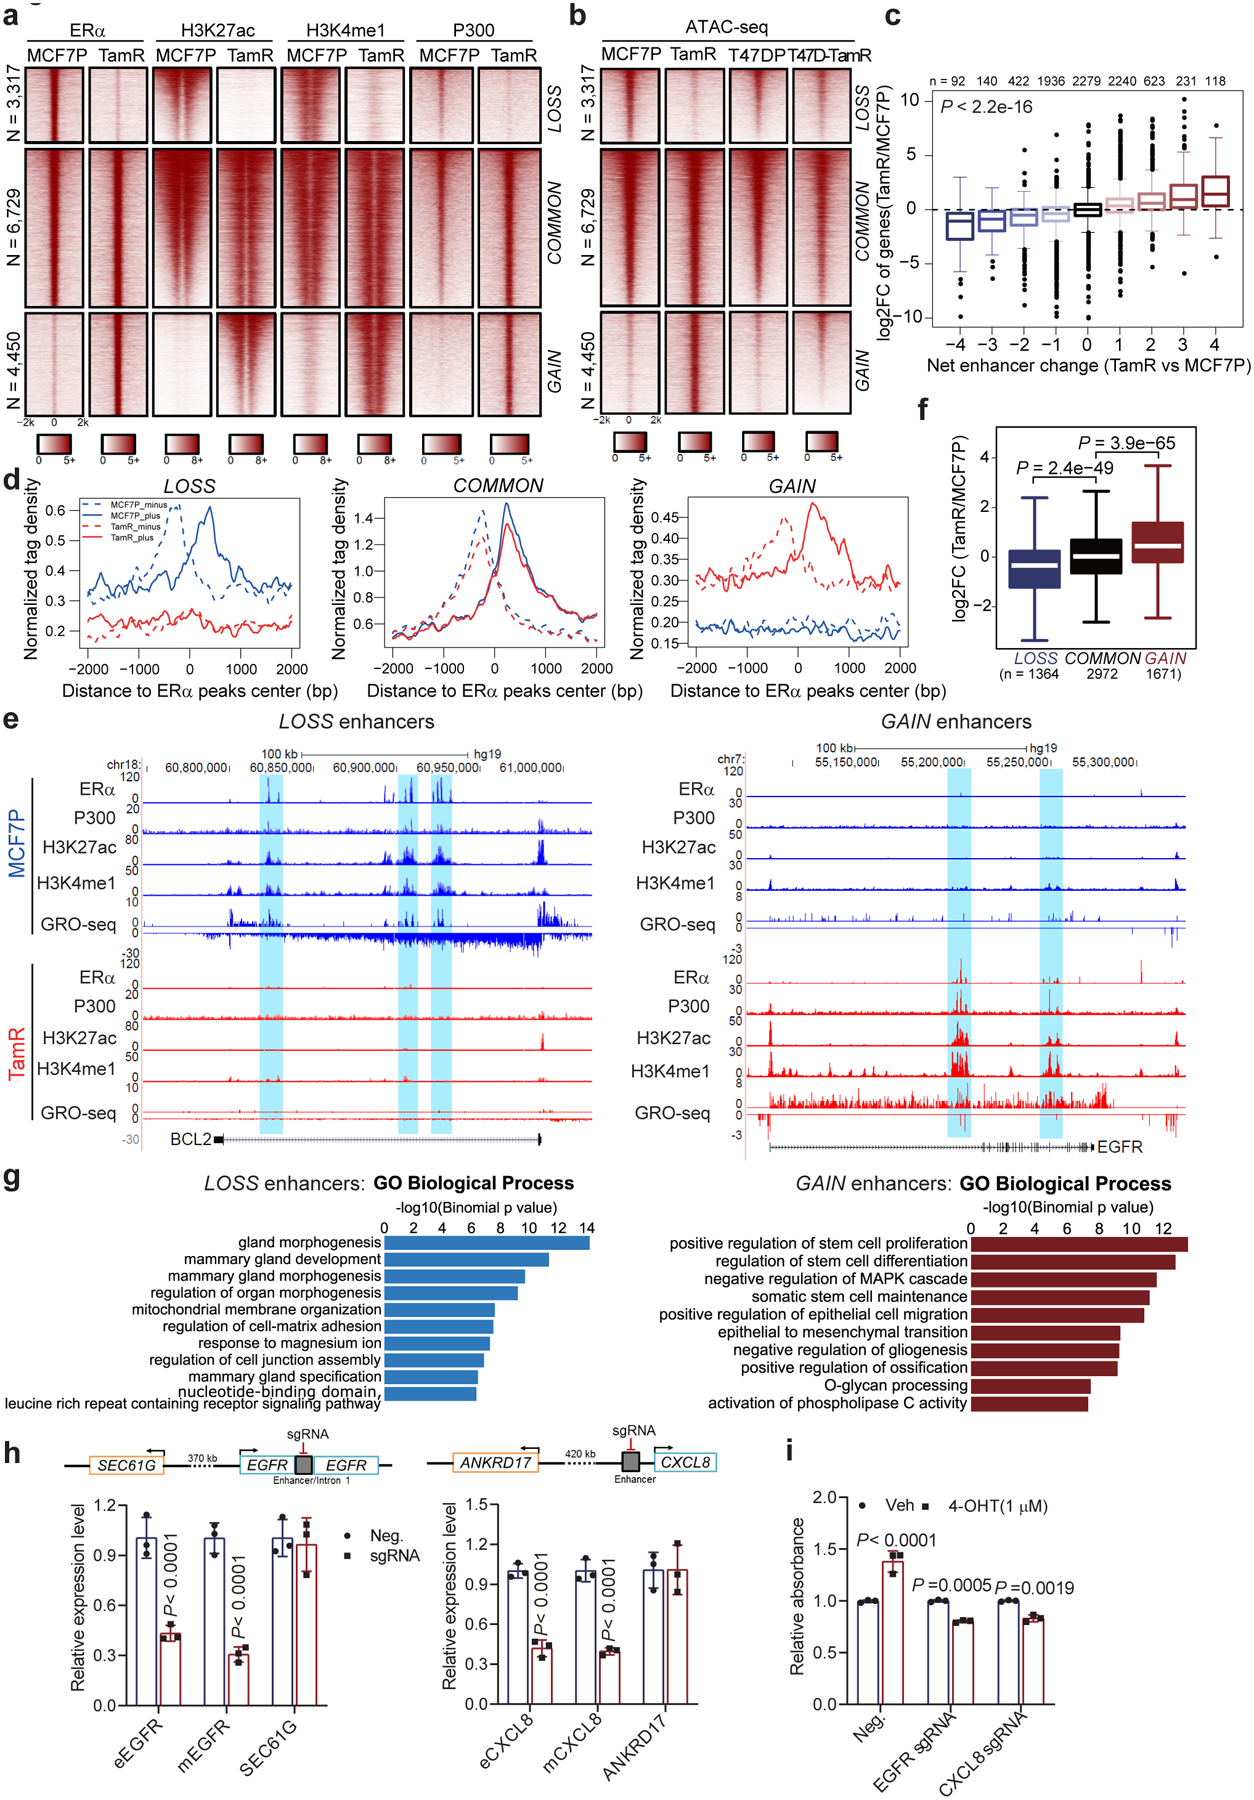
a, Heatmaps of ERα, H3K27ac, H3K4me1, and P300 ChIP-seq data in MCF7P and TamR lines for the three groups of ERα-bound enhancers (LOSS, COMMON and GAIN).
b, Heatmaps of ATAC-seq data in two paired endocrine-resistant cell models (parental vs resistant).
c, Integration of RNA-seq and ChIP-seq data to correlate changes in gene expression with enhancer gain/loss. Box plots showing log2(Fold Change) of gene expression for all the genes stratified by the net enhancer change (total number of TamR-specific enhancers minus total number of MCF7P-specific enhancers) within 200 kb from the TSS site of each gene. Statistics: ANOVA analysis.
d, Aggregate plots of the normalized GRO-seq tag density at LOSS, COMMON and GAIN enhancers in MCF7P and TamR showing the correlation between enhancer activation and the transcription of eRNA (dashed line: minus strand; solid line: plus strand of eRNA).
e, Genome browser views of ChIP-seq and GRO-seq signals at representative ERα LOSS and GAIN enhancers and their target genes BCL2 and EGFR.
f, Box plot of the fold changes in expression level of genes adjacent to LOSS, COMMON and GAIN enhancers. Statistics: two-sided Wilcoxon rank-sum test.
g, GREAT analyses on the annotations of nearby genes of LOSS and GAIN enhancers. Top ten enriched annotations are shown. Statistics: one-sided binomial test.
h, Downregulation of both eRNA and mRNA for EGFR or CXCL8 upon CRISPRi-mediated enhancer repression in TamR cells. The close genes SEC61G and ANKRD17 served as controls.
i, Cell proliferation assays on TamR cells showing the re-sensitization of TamR cells to 4-OHT treatment after CRISPRi-mediated enhancer repression. Cell proliferation was measured by CCK8 after 6 days of treatment.
Statistics for h and i: n=3 independent experiments, mean ± s.d., two-sided t-tests.
For the box plots in c and f, the lower and upper hinges correspond to the first and third quartiles, and the midline represents the median. The upper and lower whiskers extend from the hinge up to 1.5 * IQR (inter-quartile range). Outlier points are indicated if they extend beyond this range.
Statistical source data are available in Statistical Source Data Fig. 3.
Next, we examined whether enhancer gain/loss corresponded to the gene expression changes detected by RNA-seq and GRO-seq. We identified neighboring genes of all the enhancers in both MCF7P and TamR lines and stratified these genes into nine groups based on the net enhancer number change within 200 kb of the TSS of each gene: + (or −) 1 stands for 1 net gained (or lost) enhancer in TamR, and +0 means no enhancer shift. We observed a strong positive correlation between net enhancer change and gene expression change (Fig. 3c). Additionally, our GRO-seq data showed that eRNA transcription matched with enhancer gain/loss events (Fig. 3d) and that the transcriptional activities at enhancers and target gene bodies were positively correlated, exemplified by BCL2 and EGFR gene loci (Fig. 3e). Annotation analysis also revealed that ERα enhancer gain/loss was associated with the expressional changes of their target genes (Fig. 3f). Together, these results suggest that enhancer gain/loss reprogramming accounts for the alterations in gene expression associated with endocrine resistance.
We then used GREAT25 to interpret functions of genes associated with LOSS and GAIN enhancer groups. Genes associated with LOSS enhancer group were highly enriched for signatures of mammary gland development and morphogenesis, while the genes associated with GAIN enhancer group were enriched for functions of stem cell proliferation and EMT (Fig. 3g). Furthermore, GSEA on our RNA-seq data identified enriched terms in TamR cells as MEK1, EGFR and ERBB2 pathways (Extended Data Fig. 3d), which are known to regulate endocrine resistance in breast cancer26, 27. Therefore, these data suggest that enhancer reprogramming triggers gene expression transition and promotes endocrine resistance. To further support this notion, we used a dCas9-KRAB-mediated enhancer perturbation approach28 to target representative GAIN enhancers of EGFR and CXCL8, which have been reported to promote tamoxifen resistance14, 16. Indeed, inhibiting the enhancers of EGFR or CXCL8 genes was sufficient to repress target gene transcription (Fig. 3h) and re-sensitize TamR cells to 4-OHT treatment (Fig. 3i).
Given the critical role of super-enhancers (SEs) in transcriptional regulation5 and the presence of ERα enhancers in SEs12, we examined whether the shifts of ERα-bound enhancers also cause SE reprogramming. We identified 436 SEs in MCF7P cells and 703 SEs in TamR cells (Extended Data Fig. 3e), with 149 LOSS SEs and 158 GAIN SEs. Notably, reorganization of SEs also positively correlated with expressional changes of their nearest target genes (Extended Data Fig. 3f), exemplified by several key luminal/epithelial maker or basal/mesenchymal marker genes (Extended Data Fig. 3g), implicating potential roles of SE reprogramming in gene regulation during cancer progression.
Collectively, our data demonstrate that the acquisition of tamoxifen resistance is associated with global transformation of enhancer chromatin landscapes, rearrangement of ERα occupancy and transition of gene expression.
High-order enhancer component assemblies mediated by differential TF-TF and TF-enhancer interactions correspond with endocrine resistance-associated enhancer reprogramming
We sought to understand the molecular mechanisms underlying enhancer reprogramming during hormone resistance acquisition. We first performed de novo motif searches for the three groups of enhancers (LOSS, COMMON and GAIN). We identified the enrichment of the GATA3 and AP2γ motifs on the LOSS sites, the RUNX2 and JUN motifs on the GAIN sites, and FOXA1 motif in all groups (Fig. 4a). This pattern was verified by ranking all enhancers based on the ratio of ERα binding strength in the two cell lines (TamR vs MCF7P) and allocating motif occurrence frequency for these enhancers ranked from TamR-high (GAIN enhancers) to MCF7P-high (LOSS enhancers) (Fig. 4b). Notably, ERE motif was highly enriched only in the COMMON enhancers (Fig. 4b), suggesting that the GAIN and LOSS enhancers are primarily non-ERE ERα-bound enhancers. As ERα can bind to the chromatin either in cis (directly onto ERE motif) or in trans (through tethering to other TFs)29, 30, ERα might bind to these GAIN/LOSS enhancers in trans independent of ERE.
Fig. 4. High-order enhancer component assemblies mediated by differential TF-TF and TF-enhancer interactions correspond with endocrine resistance-associated enhancer reprogramming.
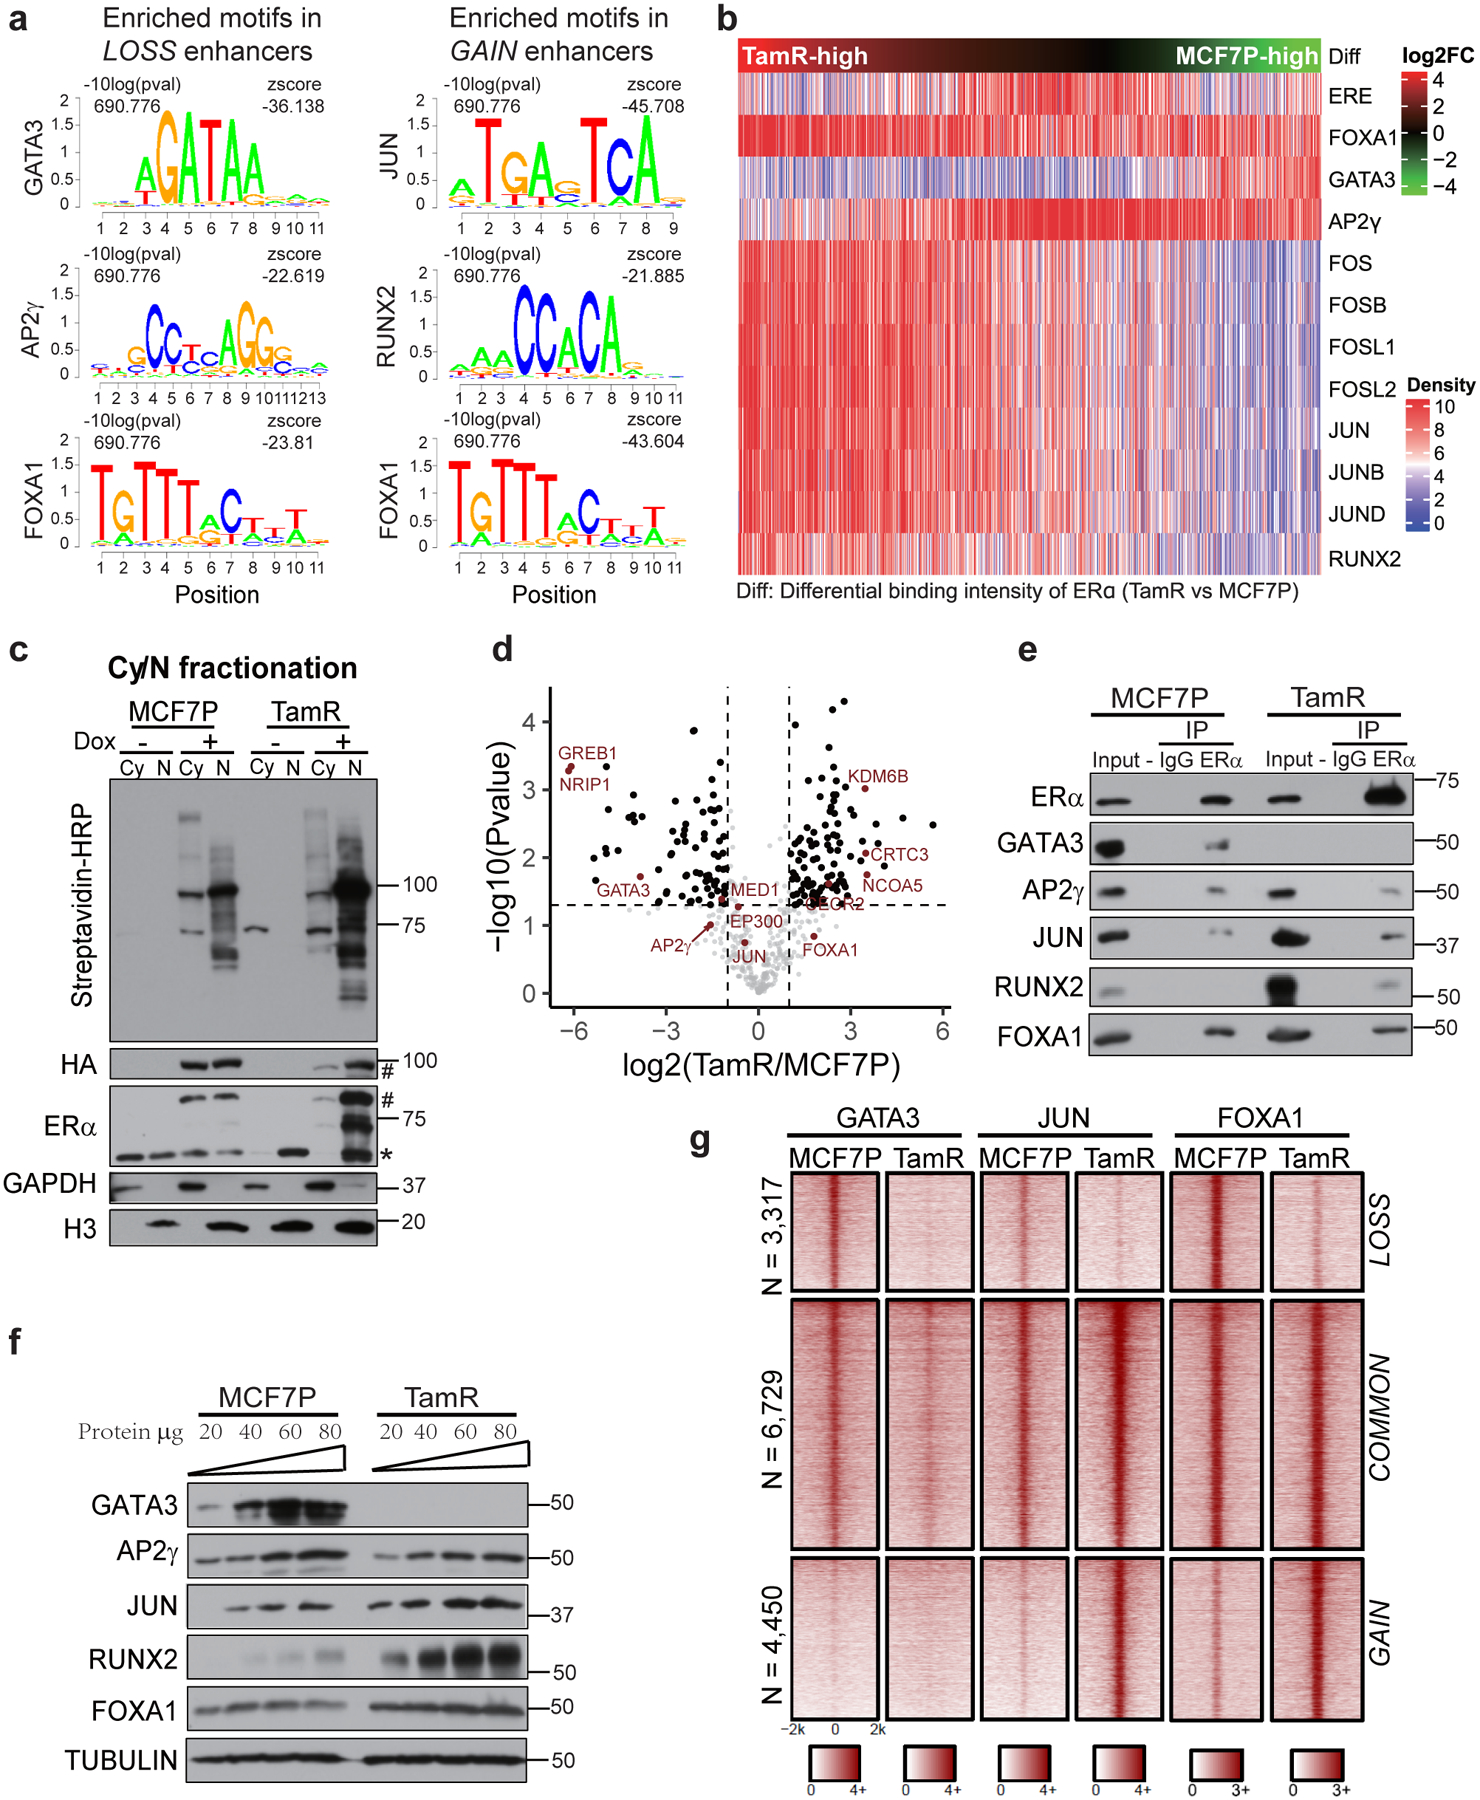
a, Enriched TF-binding motifs in different enhancer groups. P values were determined by one tailed Z-test.
b, Heatmap of motif densities for the listed TFs at all LOSS, COMMON and GAIN enhancers arranged by the binding intensities of ERα measured as the ratio of normalized ERα reads in TamR to MCF7P. A motif is considered occurred in an enhancer if the P value for the region with maximum score is less than 1e-4 by FIMO scanning of this enhancer.
c, Western blots confirming the inducible expression and in vivo biotinylation in the established ERα-BioID tet-on stable cell lines. The fractionation of cytoplasmic (Cy) and nuclear (N) fractions of MCF7P or TamR cells was confirmed with Western blots for GAPDH (cytoplasm-specific marker) and Histone H3 (nucleus-specific marker). The doxycycline-induced ERα-BirA*-HA fusion protein expression was detected by antibodies recognizing HA or ERα. * and # indicate endogenous and tagged exogenous ERα respectively. Proteins biotinylated by ERα-BirA* were detected using streptavidin-HRP blot.
d, Volcano plot showing the log2(LFQ) value for ERα-associated proteins identified in all four BioID replicates. Several ERα-interacting TFs and cofactors are highlighted in red. n=4 biologically independent experiments, and P values were determined by two-sided t-test.
e, Co-IP showing the interactions between ERα and indicated TFs in MCF7P and TamR. Endogenous ERα was immunoprecipitated using anti-ERα antibody, and IgG was used as a negative control.
f, Western blot analyses of the protein levels of indicated TFs in MCF7P and TamR cells. Tubulin was used as a loading control for different samples. (Note: GATA3 is non-detectable at the presented condition, but detectable with longer exposure).
g, Heatmaps of GATA3, JUN and FOXA1 ChIP-seq data in MCF7P and TamR demonstrating their differential occupancy on ERα-bound LOSS, COMMON and GAIN enhancers.
Immunoblots are representative of two independent experiments. Unprocessed immunoblots are shown in Source Data Fig. 4.
We considered whether context-specific TF-TF and TF-enhancer interactions contribute to enhancer gain/loss reprogramming. Using the BioID approach (Extended Data Fig. 4a)31, we identified 475 ERα-associated proteins in MCF7P and TamR cells (Fig. 4c and Supplementary Table 3). Consistent with our hypothesis, we identified context-specific ERα-cofactor interactions: its interactions with GREB1, NRIP1, and GATA3 were only detected in MCF7P cells, whereas its interactions with NCOA5 and FOXA1 were stronger in TamR cells (Fig. 4d). Consistently, loss of interaction between ERα and GREB132 and overexpression of FOXA116, 33 are known to associate with hormone resistance. Several AP1 family TFs were among the identified ERα-interacting proteins (Fig. 4d), we later on chose JUN to study AP1 function on GAIN enhancers, as it is a common component of JUN/FOS and JUN/JUN dimers34. Co-immunoprecipitation confirmed weaker ERα interactions with GATA3 and AP2γ, but stronger interactions with FOXA1, RUNX2 and JUN in TamR (Fig. 4e). This could be partly due to differential expression of the cofactors, as we detected lower level of GATA3 and AP2γ, but higher level of FOXA1, RUNX2 and JUN in TamR (Fig. 4f). In TamR, we also detected higher level of JUN S63/S73 phosphorylation (Extended Data Fig. 4b), which is known to enhance JUN transcriptional activity35. These results suggest that context-specific TFs might bind to different sets of ERα enhancers to promote enhancer reprogramming or control enhancer activities.
Thus, we performed ChIP-seqs to test whether these ERα-interacting TFs could bind to chromatin and regulate enhancer gain/loss reprogramming. While FOXA1 bound to all three groups of enhancers and COMMON enhancers recruited all three TFs, the LOSS enhancers recruited GATA3 and excluded JUN, and conversely, the GAIN enhancers recruited JUN and excluded GATA3 (Fig. 4g and Extended Data Fig. 4c–e). Together, these results suggest that reduced GATA3 expression in TamR might lead to loss of GATA3-bound enhancers, while increased expression and activity of JUN in TamR might trigger de novo establishment of JUN-bound enhancers.
GATA3 is required for the maintenance of LOSS enhancers and expression of epithelial makers
As GATA3 expression was greatly reduced in TamR cells (Fig. 4f), we asked whether DNA methylation contributed to GATA3 downregulation. From published methylation profiles of endocrine-resistant MCF7 cells36, we identified a resistance-associated high methylation level at the 5’ end of GATA3 gene (Extended Data Fig. 5a). Consistently, our pyrosequencing revealed significantly higher level of DNA methylation in the same area of GATA3 in our TamR than MCF7P (Extended Data Fig. 5a). Treatment of DNA methyltransferase inhibitor 5-Aza-2’-deoxycytidine enhanced GATA3 mRNA expression in TamR but not MCF7P (Extended Data Fig. 5b). Furthermore, TCGA methylome data for breast cancers showed that DNA methylation signals at this particular locus negatively correlated with GATA3 expression and positively correlated with invasiveness (Extended Data Fig. 5c). Altogether, these data suggest that DNA methylation-mediated GATA3 silencing might promote endocrine resistance and cancer invasive progression.
So far, our multiple lines of evidence all point to the key role of GATA3 in maintaining the LOSS enhancers. Indeed, GATA3 knockdown (KD) in MCF7P dramatically decreased ERα binding and led to a great reduction in H3K27ac and eRNA transcription on these LOSS enhancers, exemplified by BCL2 and KCNK5 gene loci (Fig. 5a, b and Extended Data Fig. 5d). Conversely, GATA3 overexpression (OE) in TamR cells slightly increased H3K27ac level on LOSS enhancers (Extended Data Fig. 5e).
Fig. 5. GATA3 is required for maintenance of LOSS enhancers and expression of epithelial makers.
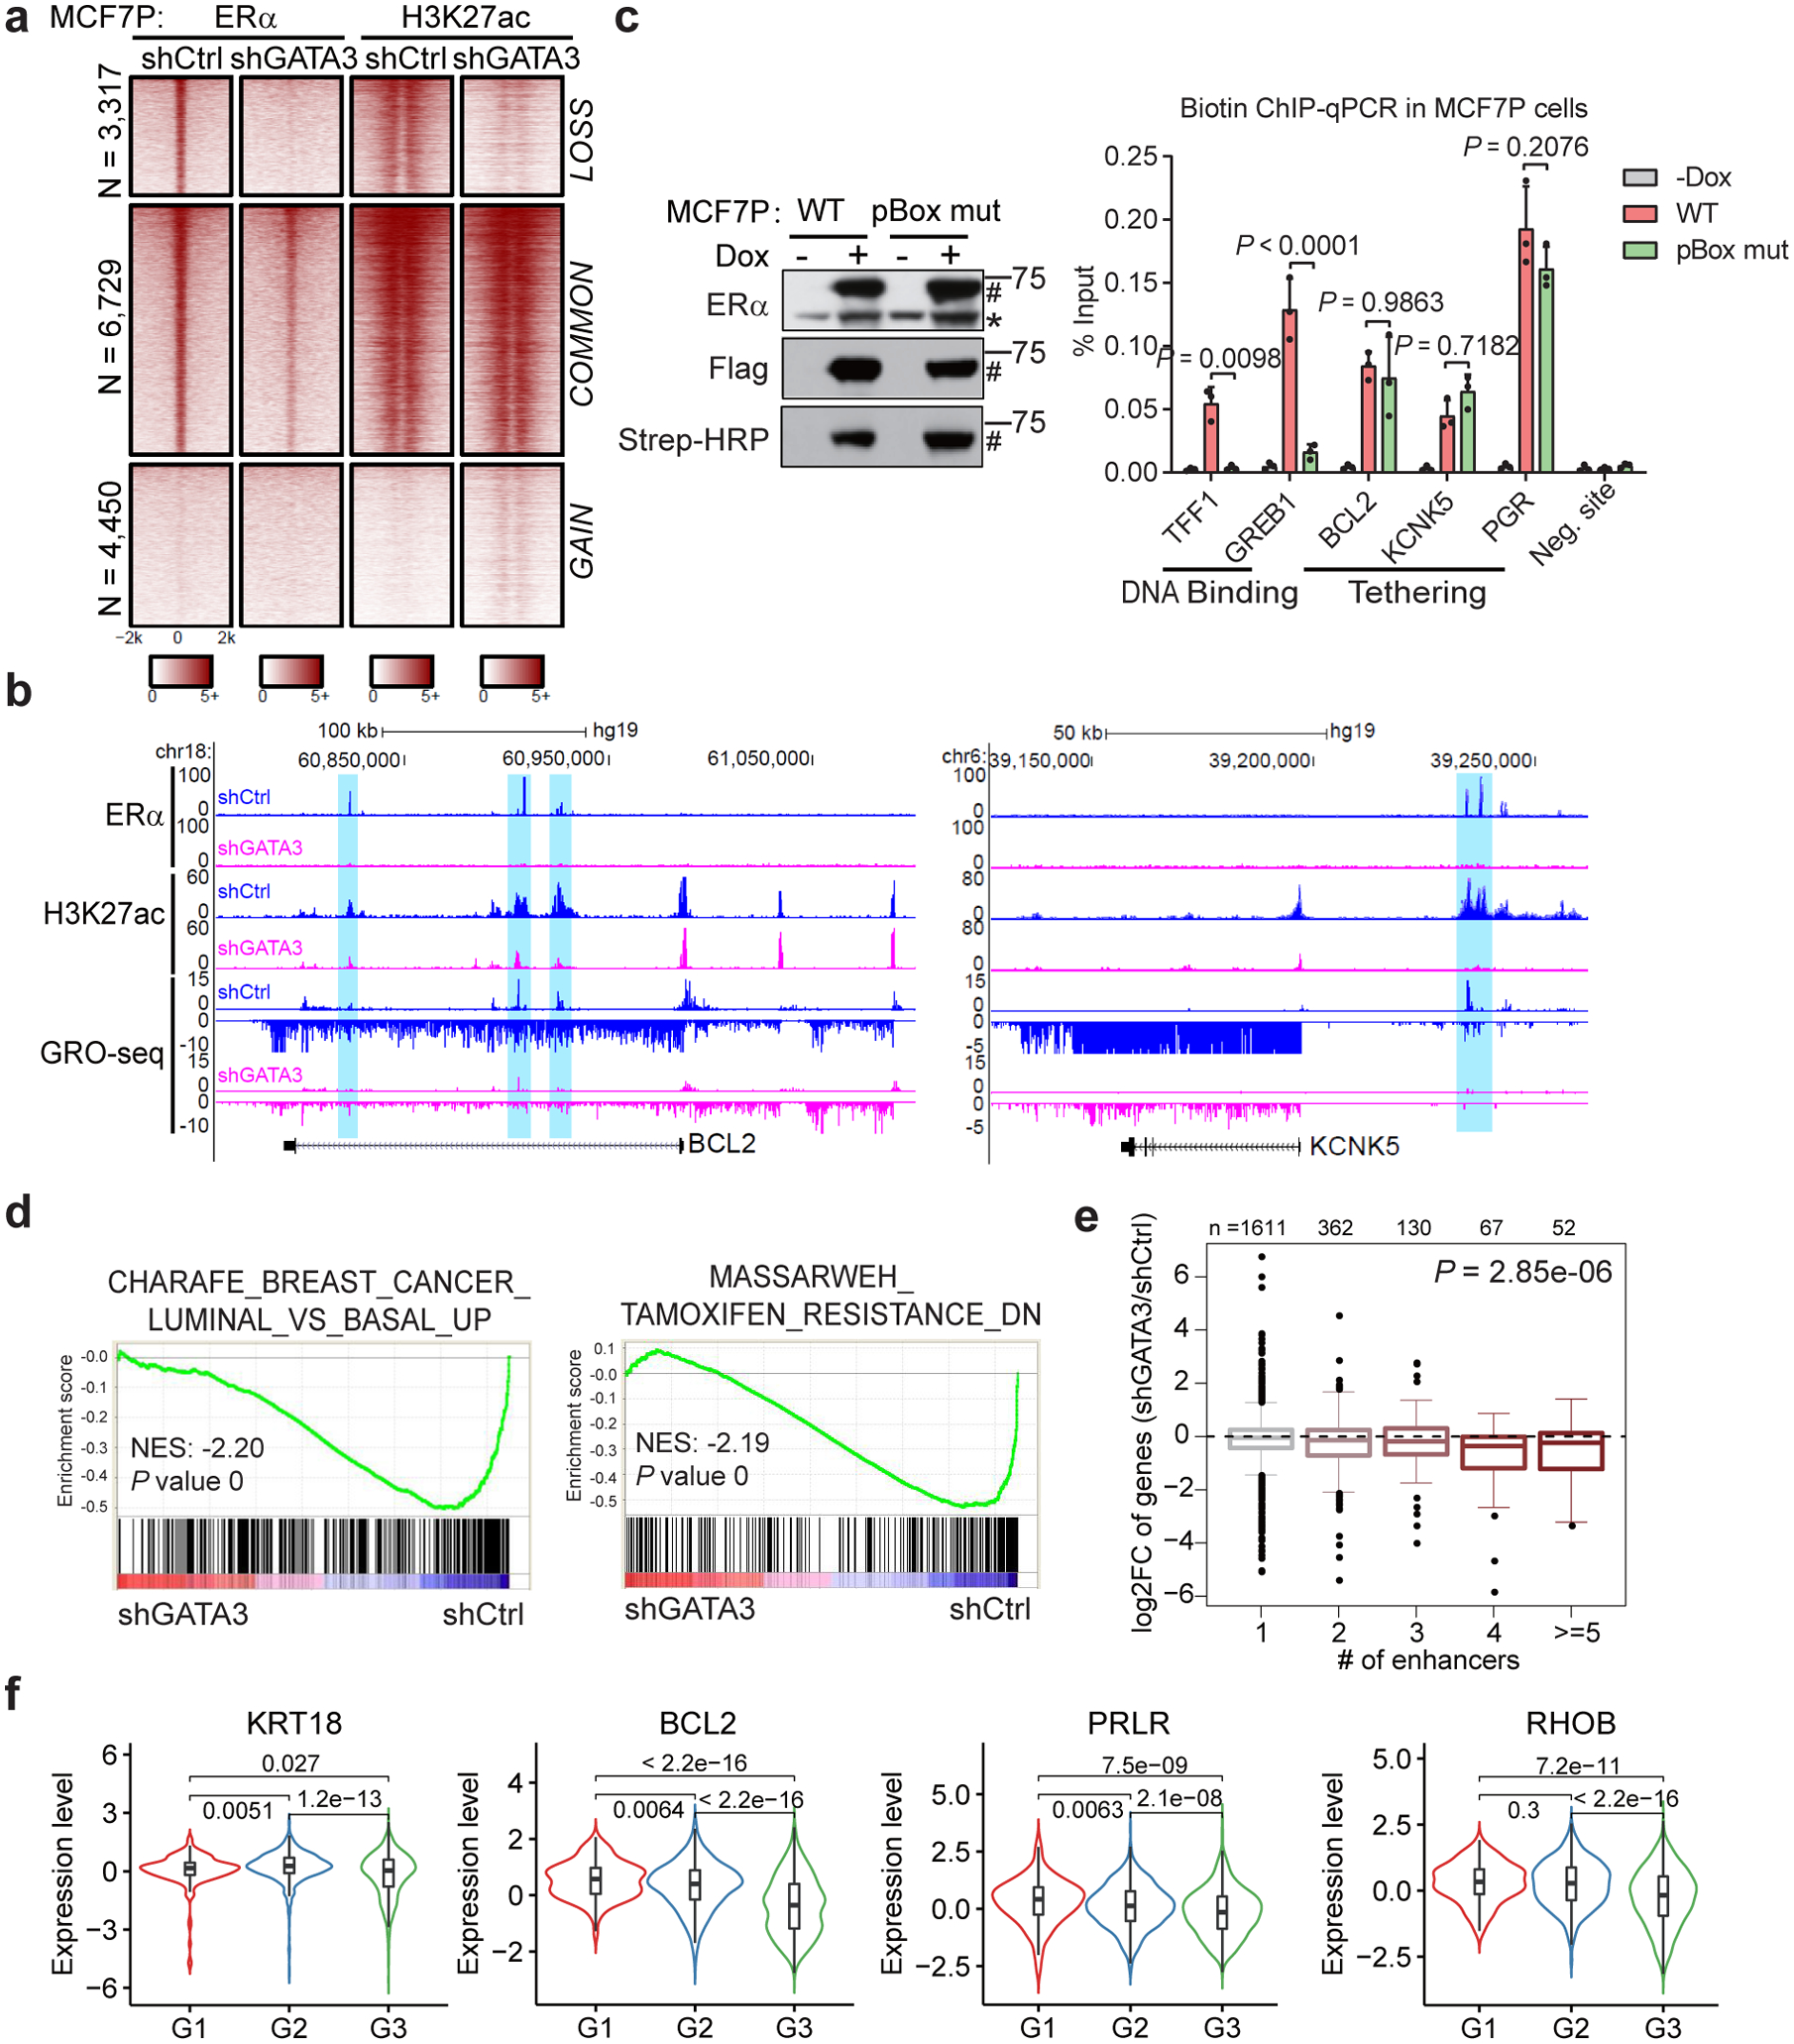
a, Heatmaps of ERα and H3K27ac ChIP-seq demonstrating that knockdown of GATA3 in MCF7P cells results in enhancer inactivation for the LOSS enhancers.
b, Genome browser views of GRO-seq data and ChIP-seq data at BCL2 and KCNK5 gene loci demonstrating enhancer inactivation and downregulation of gene expression upon depletion of GATA3 in MCF7P cells.
c, Western blots (left) showing doxycycline-induction and in vivo biotinylation of BLRP-tagged ERα WT and pBox mutant in MCF7P cells. * and # indicate endogenous and tagged exogenous ERα respectively. ChIP-qPCR showing that ERα binding on the classical ERE-containing enhancers at TFF1 and GREB1 loci was abolished by the mutation in ERα’s pBox DNA-binding domain. However, the recruitment of ERα to LOSS enhancers (on BCL2, KCNK5 and PGR) is not affected by the mutation. Statistics: n = 3 independent experiments, mean ± s.d., two-sided t-tests.
d, GSEA analyses on RNA-seq data for MCF7P cells treated with shCtrl or shGATA3. The nominal P values were determined by empirical gene-based permutation test.
e, Integration of RNA-seq and ChIP-seq data to correlate gene regulation effects by GATA3 knockdown and GATA3-bound LOSS enhancers in MCF7P cells. Box plots showing GATA3 knockdown effects on these genes stratified by the numbers of nearest LOSS enhancers within 200 kb from the TSS site of each gene. P value was determined by ANOVA analysis.
f, Negative correlation between the average gene expression levels of validated GATA3 direct targets and tumor grades (G1, G2 and G3). METABRIC dataset were used in the analyses. n=169, 767 and 951 for G1, G2 and G3 grade samples, respectively. P values were calculated by two-sided Wilcoxon rank-sum test.
For the box plots in e and f, the lower and upper hinges correspond to the first and third quartiles, and the midline represents the median. The upper and lower whiskers extend from the hinge up to 1.5 * IQR (inter-quartile range). Outlier points are indicated if they extend beyond this range.
Immunoblots are representative of two independent experiments. Unprocessed immunoblots are shown in Source Data Fig. 5. Statistical source data are available in Statistical Source Data Fig. 5.
Given the low enrichment of ERE motif but high enrichment of GATA3 motif on LOSS enhancers (Fig. 4b), we reasoned that ERα might be recruited to these GATA3-bound enhancers in trans. Using a BirA-BLRP biotin-tagging approach12 and ChIP-qPCR, we showed that DNA-binding mutation disrupted the binding of ERα on the ERE-containing COMMON enhancers located at TFF1 and GREB1 gene loci, but did not affect its binding to the GATA3 motif-enriched LOSS enhancers at BCL2, KCNK5, and PGR loci (Fig. 5c), suggesting that the recruitment of ERα to LOSS enhancers might be via tethering to TFs such as GATA3.
To evaluate the impact of GATA3-mediated enhancer reprogramming on gene regulation, we performed RNA-seq in MCF7P cells with GATA3 KD. The most dramatically downregulated genes were highly enriched for luminal/epithelial and tamoxifen-sensitive gene signatures (Fig. 5d). Furthermore, the number of LOSS enhancers within 200 kb from the TSS site of a gene correlated with the degree of gene expression downregulation (Fig. 5e). We also confirmed the decreased RNA and protein levels of several key luminal/epithelial genes upon GATA3 KD (Extended Data Fig. 5f, g). More importantly, overexpressing GATA3 in TamR cells was sufficient to re-sensitize the cells to tamoxifen treatment in vitro and in vivo (Extended Data Fig. 5h–j). When we analyzed METABRIC datasets37, we observed a negative correlation between the tumor grades and the expression levels of KRT18, BCL2, PRLR and RHOB, four direct target genes of GATA3-regulated LOSS enhancers (Fig. 5f). In addition, the expression level of BCL2 positively correlated with relapse free survival (RFS) in the breast cancer patients receiving endocrine therapy (Extended Data Fig. 5k). In summary, our data suggest that epigenetic silencing of GATA3 triggers the loss of ERα-bound enhancers and downregulation of a subset of luminal/epithelial genes, resulting in endocrine resistance and invasive phenotypes.
AP1-mediated GAIN enhancer activation promotes endocrine resistance-associated gene program and phenotypes
Given the association of AP1 with the GAIN enhancers (Fig. 4) and its previously reported involvement in tamoxifen resistance38–40, we next investigated AP1 function in GAIN enhancer activation. Dox-induced JUN OE significantly elevated ERα occupancy and H3K27ac level at GAIN regions in MCF7P (Fig. 6a), and upregulated a set of genes with TamR-associated basal/mesenchymal gene signatures (Fig. 6b and Extended Data Fig. 6a–b). Furthermore, we observed a strong correlation between the number of GAIN enhancers within 200 kb from the TSS site of a gene and the degree of gene expression upregulation by JUN OE (Fig. 6c). When JUN was knocked down in TamR, ERα occupancy at the GAIN enhancers was completely diminished, paralleled a reduction in H3K27ac level and in the recruitment of P300 and the BAF chromatin-remodeling complex components BRG1 and ARID1B (Fig. 6d). The effects of JUN KD on GAIN enhancer landscape were exemplified at the EGFR or CXCL8 gene loci (Fig. 6e). Moreover, GRO-seq data revealed a reduction in eRNA transcription from the GAIN enhancers upon JUN KD (Extended Data Fig. 6c). These results support that JUN is a key driver of GAIN enhancer reprogramming and invasive phenotype-associated gene expression. Furthermore, we showed that DNA-binding activity of ERα was not required for its binding to GAIN enhancers (Fig. 6f). Together with the higher enrichment of AP1 motif than ERE motif on GAIN enhancers (Fig. 4b), this suggest that ERα might be recruited to GAIN enhancers via tethering to AP1.
Fig. 6. AP1-mediated GAIN enhancer activation promotes endocrine resistance-associated gene program and phenotypes.
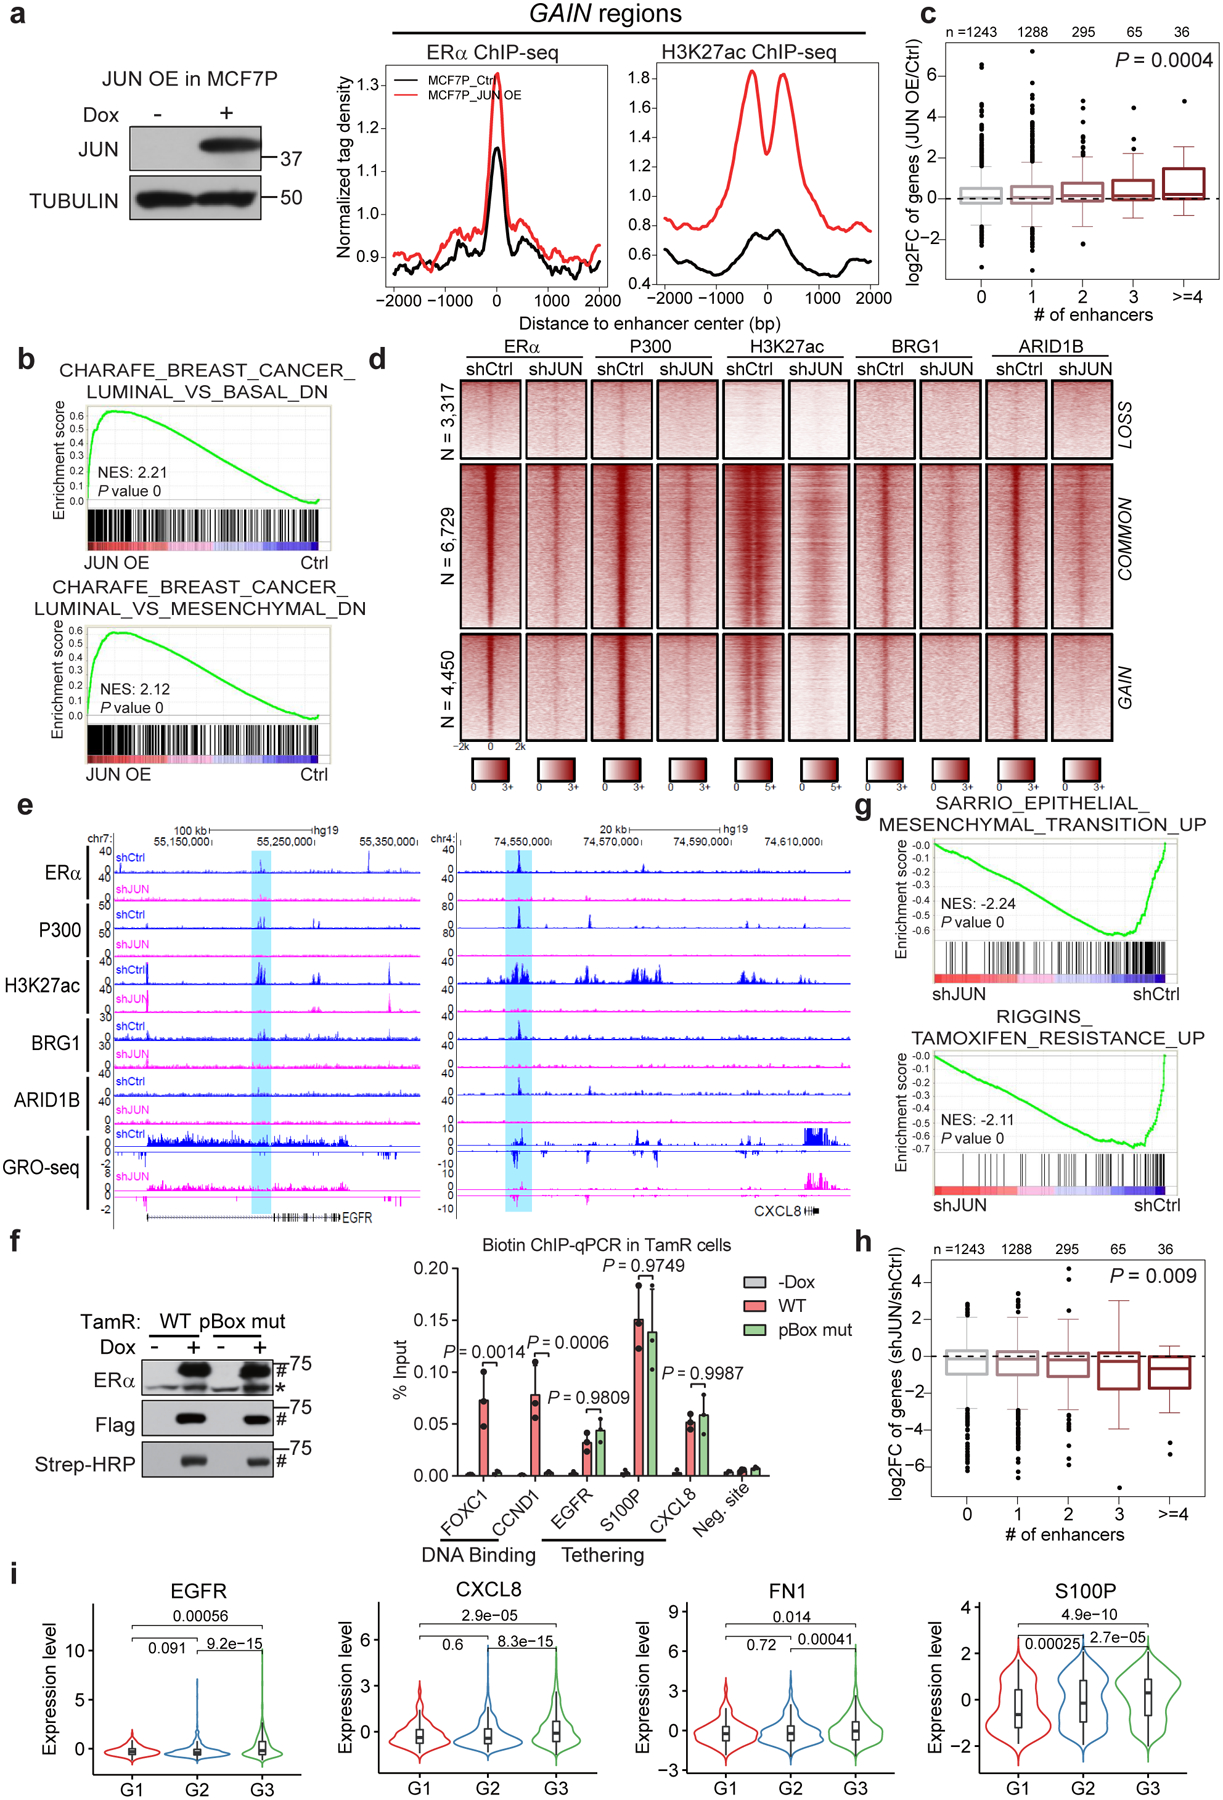
a, Aggregate plots showing the normalized tag density of ERα and H3K27ac ChIP-seq data at GAIN enhancers in MCF7P (right). Western blot confirms the doxycycline-induced JUN expression (left).
b, GSEA analyses of RNA-seq data from MCF7P with or without JUN OE. Empirical gene-based permutation test.
c, Box plots representation of JUN OE effects on expression changes of genes stratified by the numbers of nearest JUN-bound GAIN enhancers within 200 kb from the TSS site of each gene. ANOVA analysis.
d, Heatmaps of ChIP-seq data in TamR cells. JUN KD greatly deactivated GAIN enhancers and caused the loss of chromatin remodeling factors (BRG1 and ARID1B).
e, Genome browser views of GRO-seq and ChIP-seq data. Depleting JUN in TamR cells leads to enhancer inactivation (shaded areas) and transcriptional downregulation at gene bodies.
f, Western blots (left) showing that doxycycline-induction and in vivo biotinylation of BLRP-tagged ERα. *: endogenous ERα, #: tagged exogenous ERα. Biotin ChIP-qPCR (right) shows that ERα binding on GAIN enhancers (EGFR, S100P and CXCL8) was not affected by pBox mutation, unlike the binding to ERE-containing enhancers at FOXC1 and CCND1. n=3 independent experiments, mean ± s.d, two-sided t-tests.
g, GSEA analyses on RNA-seq data. EMT and tamoxifen resistance-related gene signatures were downregulated upon JUN KD in TamR cells. Empirical gene-based permutation test.
h, Box plots showing JUN KD effects on genes stratified by the numbers of nearest JUN-bound GAIN enhancers within 200 kb from the TSS site of each gene. ANOVA analysis.
i, The average gene expression values of the indicated JUN direct targets positively correlate with tumor grades (G1=169, G2=767 and G3=951). METABRIC dataset were used. Two-sided Wilcoxon rank-sum test.
For the box plots in c, h and i, the lower and upper hinges correspond to the first and third quartiles, and the midline represents the median. The upper and lower whiskers extend from the hinge up to 1.5 * IQR (inter-quartile range). Outlier points are indicated if they extend beyond this range.
Immunoblots are representative of two independent experiments. Unprocessed immunoblots are shown in Source Data Fig. 6. Statistical source data are available in Statistical Source Data Fig. 6.
To determine the role of AP1-mediated enhancer reprogramming in regulating gene expression, we performed RNA-seq in TamR cells with JUN KD and found that the downregulated genes were enriched for EMT- and tamoxifen resistance-associated genes (Fig. 6g and Extended Data Fig. 6d), and the degree of downregulation correlated with the number of their neighboring GAIN enhancers (Fig. 6h). Downregulation of key cancer invasiveness marker genes was confirmed at protein level (Extended Data Fig. 6e). Consistent with these changes in gene expression, JUN KD in TamR cells re-sensitized cells to tamoxifen treatment (Extended Data Fig. 6f). Furthermore, the expression levels of several direct target genes of JUN positively correlated with tumor grades (Fig. 6i). Additionally, higher expression of the JUN direct targets FN1 and S100P was associated with worse relapse free survival (RFS) in the breast cancer patients receiving endocrine therapy (Extended Data Fig. 6g). Taken together, these data suggest that JUN-mediated enhancer activation promotes resistance-associated gene program and phenotypes.
GATA3 and AP1 function coordinately to promote TamR-associated enhancer reprogramming and gene expression
Having demonstrated the function of GATA3 and JUN in controlling LOSS and GAIN enhancer activation respectively, we were then interested in testing the combined effect of manipulating GATA3 and JUN simultaneously. We treated MCF7P cells with either shGATA3 or JUN OE vector, or both, and found that double manipulation demonstrated a combined effect in inhibiting epithelial marker expression or in elevating invasiveness-associated genes (Extended Data Fig. 7a, b). RNA-seq data showed that simultaneous GATA3 KD and JUN OE resulted in more dramatic effects on the lost and gained gene expression compared to manipulating individual gene alone (Fig. 7a). Consistently, eRNA transcription from the GAIN enhancers was more profoundly induced by the combined treatments (Extended Data Fig. 7c). As measured by H3K27ac ChIP-seq, GATA3 KD and JUN OE together displayed synergistic effect on both LOSS and GAIN enhancers, resulting in re-organization of enhancer landscape that mimicked the transition from MCF7P to TamR (Fig. 7b, c). This synergistic effect was exemplified by the EGFR gene locus (Fig. 7d, e).
Fig. 7. GATA3 and AP1 function coordinately to promote TamR-associated enhancer reprogramming and gene expression.
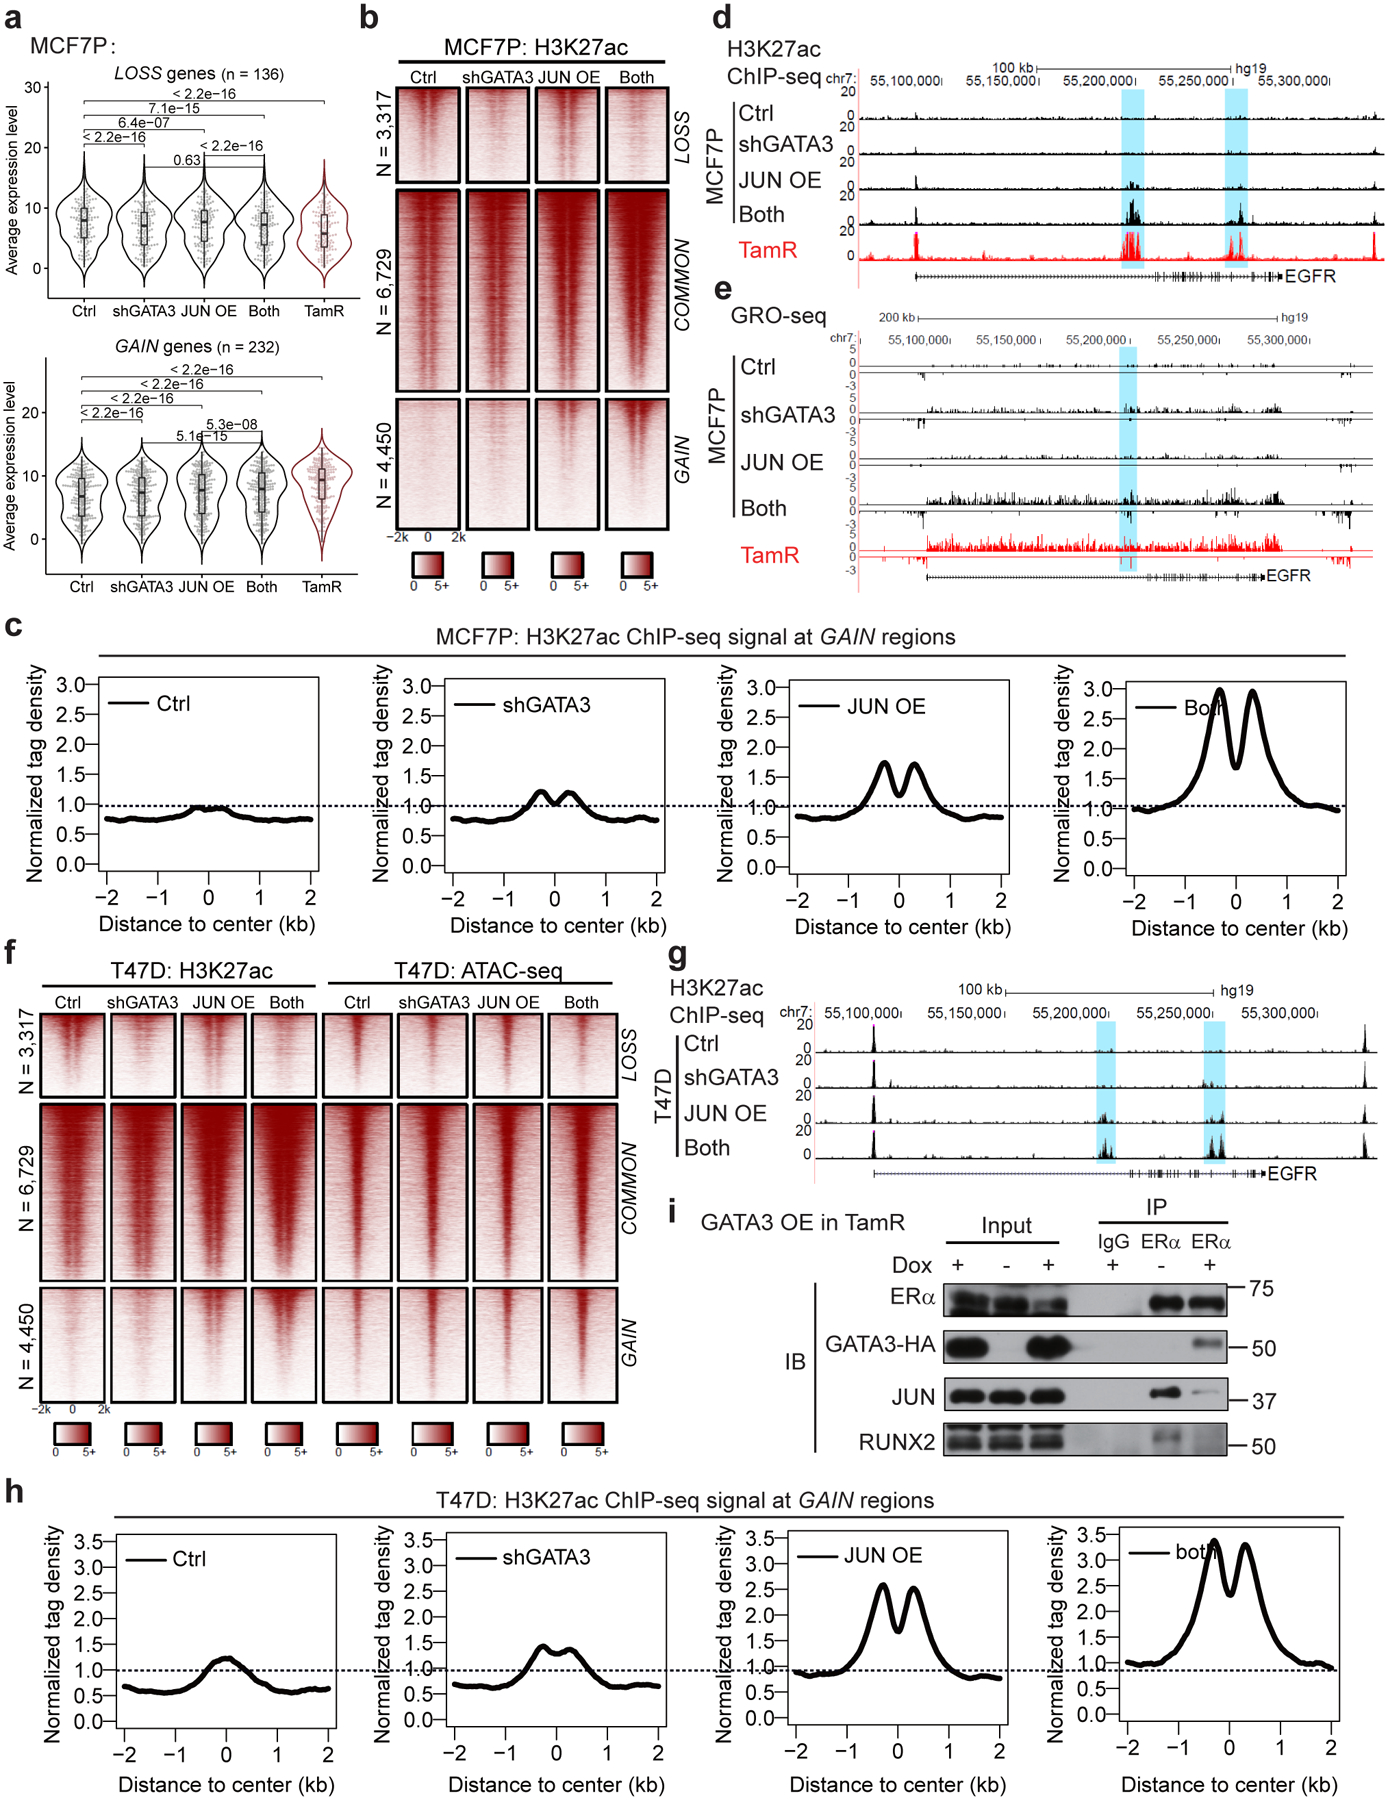
a, Box plots representation of gene expression in MCF7P cells. Simultaneously GATA3 KD and JUN OE (“both”) shows a more dramatic effect on the lost and gained gene expression in MCF7P cells compared to manipulating individual gene alone. P values were calculated by two-sided Wilcoxon signed-rank test. the lower and upper hinges correspond to the first and third quartiles, and the midline represents the median. The upper and lower whiskers extend from the hinge up to 1.5 * IQR (inter-quartile range). Outlier points are indicated if they extend beyond this range.
b, Heatmaps of H3K27ac ChIP-seq data at LOSS, COMMON and GAIN enhancers in MCF7P cells with the indicated treatments.
c, The aggregate plots of the normalized tag densities of H3K27ac ChIP-seq data at GAIN enhancers in MCF7P cells with indicated treatments.
d, Genome browser snapshots of H3K27ac ChIP-seq signals at the EGFR gene locus in MCF7P cells. GATA3 KD and JUN OE show a synergistic effect. The combined treatment in MCF7P cells creates an enhancer landscape similar to that in TamR cells.
e, Genome browser snapshots of GRO-seq signals at the EGFR gene locus in MCF7P cells. GATA3 KD and JUN OE (“both”) render MCF7P cells a TamR-like profile in enhancer landscape and gene expression.
f, Heatmaps of H3K27ac ChIP-seq and ATAC-seq at LOSS, COMMON and GAIN enhancers in T47D cells with the indicated treatments.
g, Genome browser snapshots of H3K27ac ChIP-seq signals at the EGFR gene locus in T47D cells. GATA3 KD and JUN OE show a synergistic effect.
h, Aggregate plots of the normalized tag densities of H3K27ac ChIP-seq data at GAIN enhancers in T47D cells with indicated treatments.
i, Western blots showing that doxycycline-induced GATA3 overexpression in TamR caused a significant decrease of interactions between endogenous ERα and JUN/RUNX2. Endogenous ERα was immunoprecipitated using anti-ERα antibody. IgG was used as a negative control.
Immunoblots are representative of two independent experiments. Unprocessed immunoblots are shown in Source Data Fig. 7.
Similarly, simultaneous manipulation of GATA3 and JUN in T47D cells resulted in more profound changes in gene expression (Extended Data Fig. 7d–f) and in enhancer gain/loss reprogramming (Fig. 7f–h and Extended Data Fig. 7g). This phenomenon was also discovered in another independent ER+ cell system ZR75–1 (Extended Data Fig. 7h). Therefore, the cooperation between GATA3/AP1 and ERα on enhancers might be a common mechanism to reprogram enhancers in different ER+ breast cancer cell lines.
Although GATA3 predominantly regulates LOSS enhancers, GATA3 depletion in MCF7P cells slightly but significantly increased H3K27ac level on the GAIN enhancers (Fig. 5a). Inversely, GATA3 OE in TamR cells reduced H3K27ac signals at GAIN enhancers (Extended Data Fig. 5e). In MCF7P cells with JUN OE, GATA3 KD magnified JUN-mediated enhancer activation effect on GAIN enhancers (Fig. 7b, c), exemplified by the EGFR gene locus (Fig. 7d, e). The effect of GATA3 KD on GAIN enhancers was also observed in T47D cells and ZR75–1 cells (Fig. 7f–h and Extended Data Fig. 7h). Furthermore, GATA3 KD synergized with JUN OE to promote eRNA transcription from GAIN sites in both MCF7 and T47D (Extended Data Fig. 7c, g). These prompted us to test the possibility that GATA3 might have a higher binding affinity than AP1 with ERα and compete for ERα, resulting in lower ERα binding on AP1-bound GAIN enhancers. Indeed, GATA3 OE in TamR cells significantly weakened the interactions between ERα and JUN/RUNX2 (Fig. 7i). Together, these data suggest that GATA3 not only regulates LOSS enhancers by recruiting enhancer components including ERα, but also might compete for ERα from GAIN enhancers to suppress GAIN enhancers activation.
GATA3 and AP1 cooperate to regulate endocrine resistance and tumor growth in vitro and in vivo
We next evaluated whether GATA3 and AP1 cooperated to drive endocrine resistance and tumor growth. Compared to either individual manipulation, simultaneous GATA3 KD and JUN OE in both MCF7P and T47D cells led to more obvious morphological changes, including cellular elongation with a mesenchymal appearance and a dispersed growth pattern (Extended Data Fig. 8a, b), and a stronger resistant phenotype (Fig. 8a, b).
Fig. 8. GATA3 and AP1 cooperate to regulate endocrine resistance and tumor growth in vitro and in vivo.
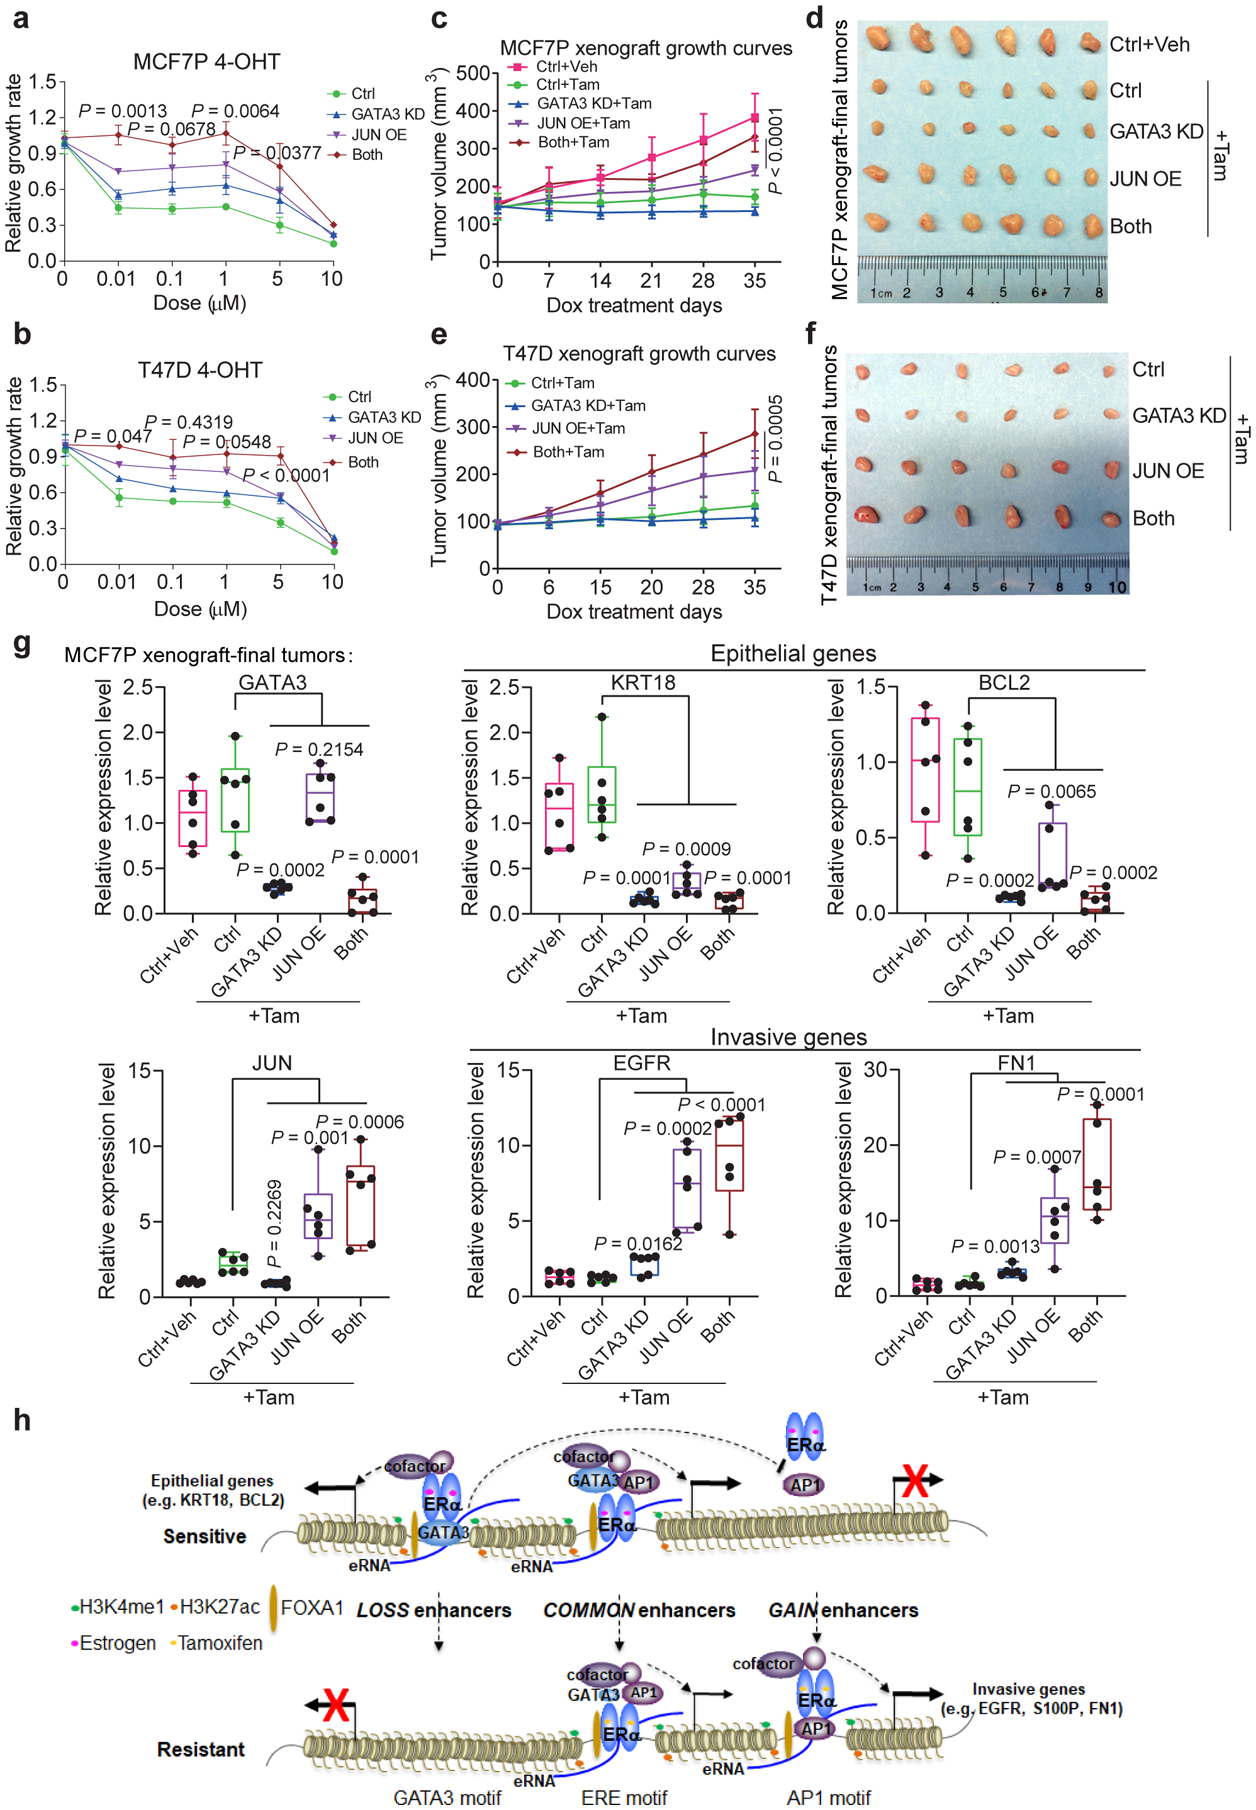
a, b, CCK8 assays using MCF7P (a) or T47D (b) stable cell lines expressing shGATA3 and/or JUN OE construct to measure relative cell viability with indicated treatments for 5 days to show the combined effect of GATA3 KD and JUN OE on the resistance to 4-OHT. n=3 independent experiments, mean ± s.d., two-sided t-tests.
c, e, Tumor growth curves of orthotopic xenografts of manipulated MCF7P (c, n=5 per group) and T47D (e, n=4 per group) cells in nude mice. Cells with JUN OE showed enhanced tumor growth, which was further enhanced by GATA3 KD. Tamoxifen subcutaneously injections were performed right after the graft (1 mg/mouse, three times/week). Tumor sizes were measured once a week upon starting doxycycline (administrated in water). Statistics: mean ± s.d., two-sided t-tests.
Based on the statistical analyses, GATA3 KD alone was not able to significantly promote or inhibit tumor growth in vitro or in vivo. P values from one-way ANOVA were calculated for GATA3 KD alone vs control: p=0.0604 for a, p=0.2007 for b, p=0.0987 for c, and p=0.0831 for e.
d, f, Images of representative MCF7P (d) and T47D (f) xenograft tumors collected at the end points of the experiments in panel c and e.
g, RT-qPCR analyses of selected epithelial markers and invasion-related genes in MCF7P xenograft tumors with indicated treatments, showing the coordinate role of GATA3 and JUN in regulating gene expression in vivo in the xenograft tumors. Data are presented as mean ± s.d. from n=6 independent samples. P values were determined by two-sided t-tests. The box plot elements represent the minimum, 25th percentile, median, 75th percentile, and maximum values.
h, A proposed model of high-order assemblies of TFs in regulating enhancer reprogramming. Enhancer reprogramming mediated by the altered interactions between ERα and other TFs (exemplified by FOXA1, GATA3 and AP1) promote phenotypic plasticity during the acquisition of therapy resistance and invasive progression.
Statistical source data are available in Statistical Source Data Fig. 8.
To test the coordinate role of GATA3 and JUN in regulating endocrine resistance in vivo, we generated orthotopic xenograft tumors using MCF7P cells expressing inducible JUN OE or GATA3 KD vectors. Consistent with the in vitro results, JUN OE resulted in a more rapid mammary tumor growth in the presence of tamoxifen (Fig. 8c, d). GATA3 KO alone was not sufficient to promote tumor growth, but significantly enhanced tumor growth despite tamoxifen treatment when combined with JUN OE (Fig. 8c, d). We further confirmed the combined effect of GATA3 KD and JUN OE in xenografts derived from T47D cells (Fig. 8e, f). Similar to the cultured cells (Extended Data Fig. 7a, d), tumors with GATA3 KD, JUN OE or both had reduced levels of epithelial markers (KRT18 and BCL2) and enhanced levels of invasive markers (EGFR and FN1) (Fig. 8g), further suggesting that enhanced phenotypic plasticity is associated with tamoxifen resistance in vivo. Finally, using RNA-seq data of 34 different cancer types from TCGA database, we performed GSEA analyses on cancer hallmark gene sets. High levels of JUN and GATA3 correlated positively and negatively with EMT pathway in breast cancer respectively (Extended Data Fig. 8c, d). Taken together, our data suggest that loss of GATA3 and elevation of AP1 level/activity together leads to enhancer reprogramming and elevated phenotypic plasticity, resulting in endocrine resistance and a more aggressive cancer phenotype.
DISCUSSION
Phenotypic plasticity, which can be enhanced by epigenetic reprogramming, contributes to therapy resistance in various cancers23, 41–44. In ER+ luminal breast cancer, cell phenotypic transition during cancer progression is associated with the unsuccessful applications of tamoxifen and other endocrine agents that target ERα signaling45. Our study suggests that a global enhancer gain/loss reprogramming driven by differential high-order assemblies of TFs, particularly between ERα and GATA3/AP1, profoundly alters breast cancer transcriptional programs to promote cellular plasticity and therapy resistance (Fig. 8h), raising the possibility of targeting the high-order assemblies of enhancer-binding TFs as a strategy for therapy resistance.
The EMT process is the best-studied example of plasticity in tumor progression23, 24. While transitioning between the two phenotypes - epithelial and mesenchymal, cells can also attain a hybrid epithelial/mesenchymal phenotypes46. When comparing TamR to MCF7P, we observed morphological changes similar to EMT and identified upregulated genes highly enriched for EMT gene signature. It also appeared that TamR cells were at a hybrid epithelial/mesenchymal cell state (Fig. 1f), which is often found to associate with invasiveness and therapy resistance24. Manipulating the expression levels of TF enhancer components was sufficient to cause enhancer reorganization, resulting in gene expression transition and phenotypic switch similar to EMT (Figs. 7 and 8). Therefore, enhancer reprogramming driven by high-order assemblies of enhancer components especially TFs, exemplified by GATA3 and JUN, might be one of the molecular mechanisms to induce cellular plasticity and promote endocrine resistance, in addition to other previously reported epigenetic mechanisms36, 47. Due to the limited materials, it was not feasible to analyze enhancer landscapes in the patient biopsy tissues. However, the therapy-associated downregulation of GATA3 and upregulation of JUN in these clinical therapy-resistant tumor samples (Fig. 2d and Extended Data Fig. 2b, d) is consistent with our findings in the culture models and supports the key roles of these two TFs in regulating resistance-associated enhancer reprogramming.
ERα Enhancers are bound and regulated by a mixture of common and lineage-specific TFs and cofactors through our previously identified MegaTrans mechanism12, 13 to achieve context-specific transcription regulation. Here we identified the high-order assemblies of ERα and its TF cofactors that are associated with specific cell state (i.e. Tam-sensitive vs -resistant). Notably, the context-specific interactions between ERα and TFs correspond to resistance-associated enhancer reprogramming. ERα and these TFs, including FOXA1, AP2γ, GATA3, AP1 and RUNX2, each shows specific binding patterns on ERα enhancers. On COMMON enhancers, ERα binding is in cis through ERE DNA motif, while GATA3 and AP1 likely bind to ERα enhancers in trans through tethering to ERα due to the absence of GATA3 and AP1 DNA motifs on COMMON enhancers. Interestingly, loss of GATA3 (or JUN) not only affects ERα binding on LOSS (or GAIN) enhancers, but also dampens ERα binding on COMMON enhancers (Fig. 5a, 6d). This might be due to the role of GATA3 and JUN as MegaTrans TFs in stabilizing enhancer complex12. Conversely, occupancy of ERα on LOSS enhancers was in trans and mediated by interacting with GATA3. Similarly, ERα was recruited to GAIN enhancers by cis-bound AP1 (Fig. 8h). FOXA1 binds to all enhancers (Fig. 4) as a pioneer factor facilitating ERα and other TFs to achieve enhancer reprogramming, consistent with two recent studies that FOXA1 mediates enhancer reorganization in breast and pancreatic cancers33, 48. Similar to AP1, RUNX2 motif is enriched in GAIN enhancers and its interaction with ERα is enhanced in TamR cells. These observations are consistent with our recent report that RUNX2-ERα interaction regulates a group of invasive genes in TamR cells17. Collectively, our findings suggest high-order enhancer machinery assemblies mediated by differential TF-TF and TF-enhancer interactions as a mechanism by which cancer cells reprogram enhancer landscape and transcription profiles to obtain phenotypic switch.
We have shown that GATA3 and AP1 regulate LOSS and GAIN enhancers respectively, and that they each regulate a different gene program: GATA3 controls the luminal lineage-specific gene program and AP1 regulates cancer invasion-related gene program including basal/mesenchymal marker genes. Furthermore, this study, for the first time, demonstrates the coordinate role of GATA3 and AP1 in enhancer regulation. We found that GATA3 level could negatively affect GAIN enhancer activation (Fig. 7 and Extended Data Fig. 5e, 7), although GATA3 predominantly binds to and regulates LOSS enhancer group (Figs. 4g and 5). Our competition experiments showed that GATA3 overexpression in TamR cells significantly weakened the interactions between ERα and JUN/RUNX2 (Fig. 7i), supporting the notion that GATA3 can compete with GAIN enhancer-associated TFs, such as AP1 and RUNX2, for other enhancer components such as ERα. It was not expected that GATA3 KD alone was not sufficient to promote tumor growth, although it enhanced tumor growth when combined with JUN OE (Fig. 8c–f). These results indicate a role of GATA3 beyond the regulation of ERα enhancers. This is also supported by our ChIP-seq data that GATA3 binds to many non-ERα sites. Consistently, a previous paper reported that targeted deletion of GATA3 in early tumors led to apoptosis of differentiated cells49. Therefore, loss of GATA3 needs to be combined with another trigger, such as elevation of AP1, to achieve cancer phenotypic switch.
At least two possible scenarios can be proposed for the emergence of resistant cancer cells with altered expression in enhancer components and reorganized enhancer landscapes. In the first scenario, aberrant expression of GATA3/JUN might be a pre-existing state in a small proportion of cancer cells. These cells are the ones that survive and become enriched upon anticancer treatment. In the second scenario, a small population of cells might transiently acquire the aberrant expression of GATA3/JUN through epigenetic modifications during treatment and become selected for. These two scenarios are not mutually exclusive. Future studies at the single cell level with new enhancer study tools are required to gain a deeper understanding of how TF assemblies and enhancer reprogramming are involved in the phenotypic switch in this heterogeneous disease.
Extended Data
Extended Data Fig. 1. Genomic analyses identify phenotypic plasticity-related transcriptional changes in breast cancer cells with endocrine resistance.
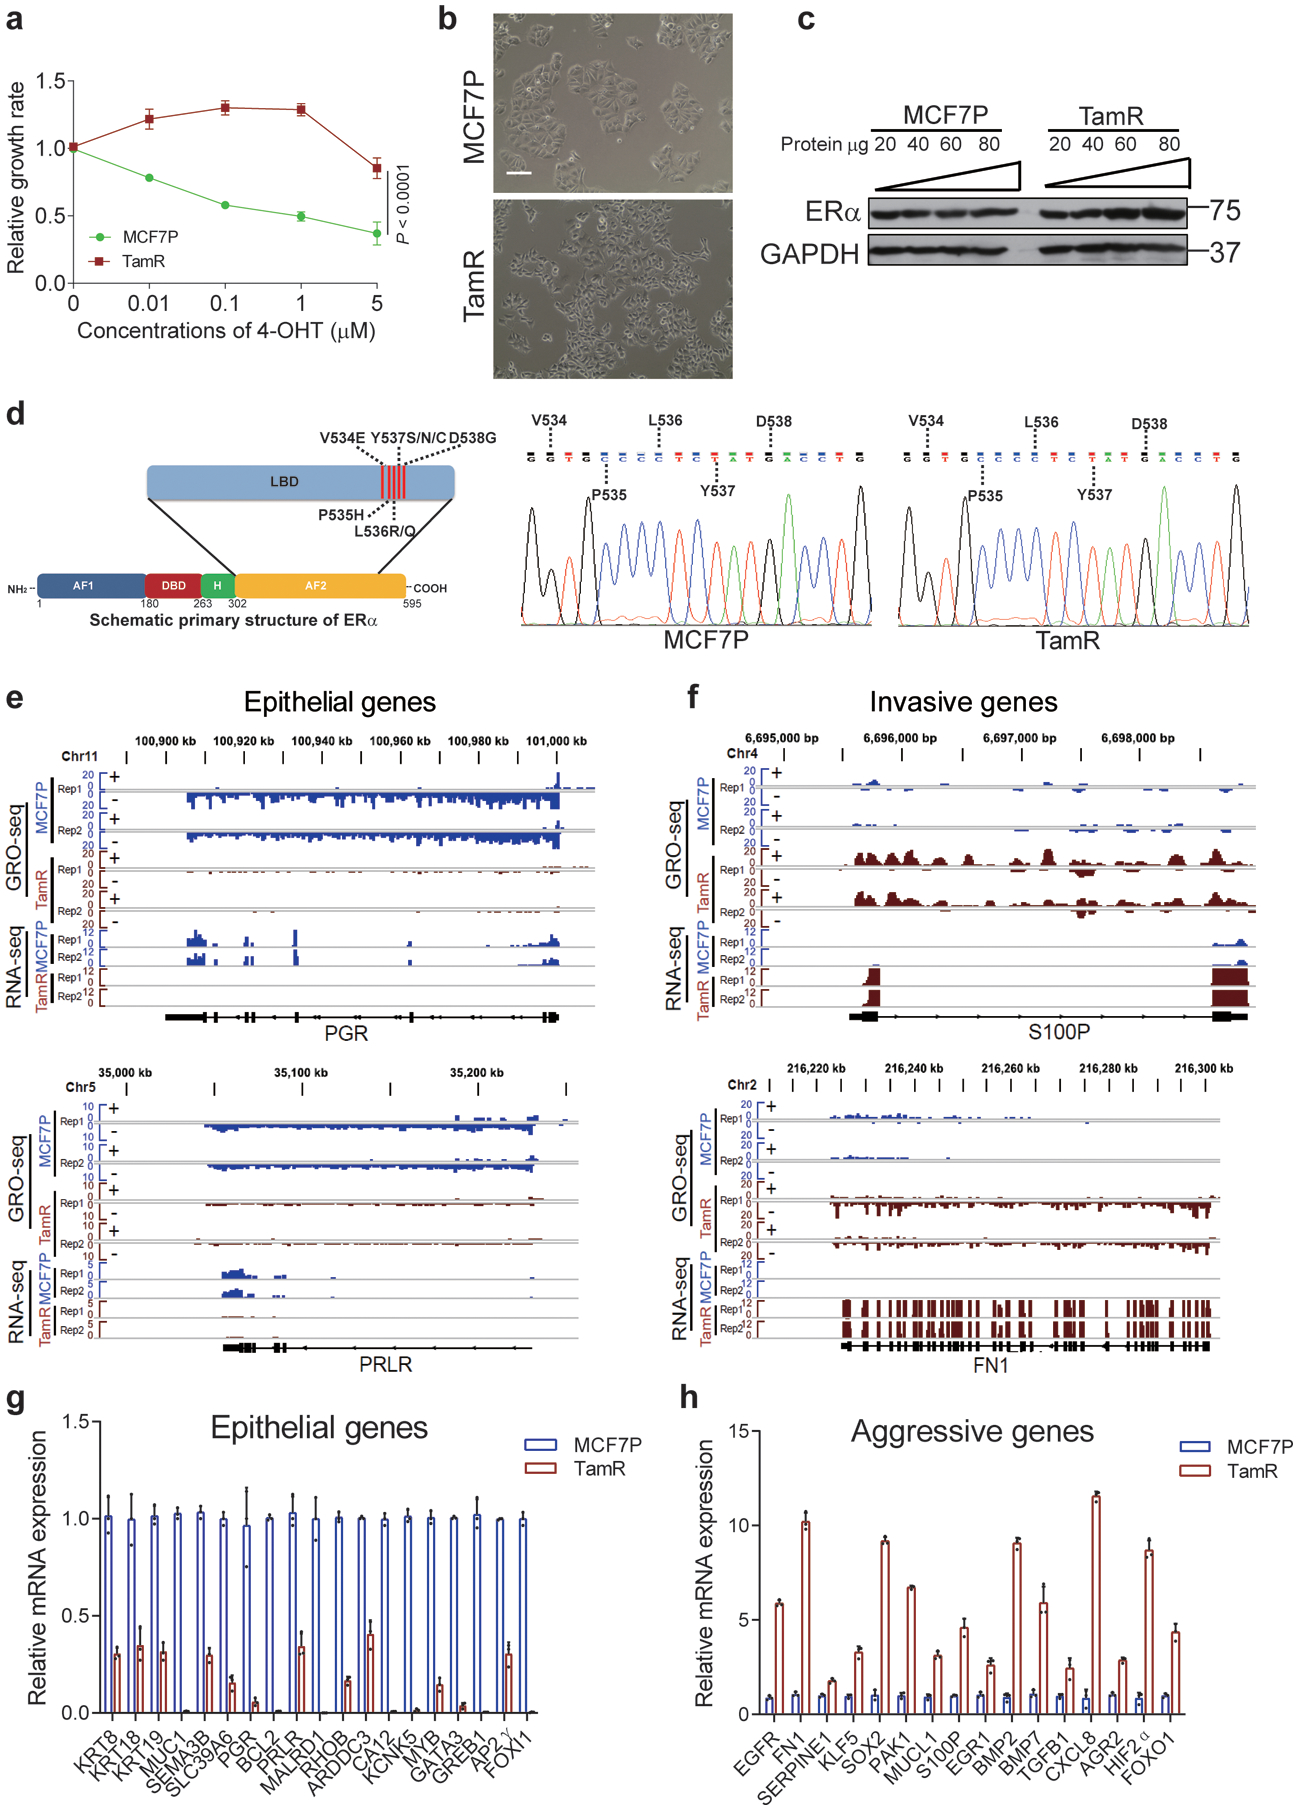
a, Cell growth rate assays of MCF7P and TamR lines in the presence of 4-OHT showing the endocrine resistance of TamR line. P values were determined by two-sided t-tests.
b, Brightfield images of MCF7P and TamR lines at ×100 magnification showing different morphology for these two lines. MCF7P displayed a typical epithelial cell-like morphology and grew in tightly packed cobblestone-like clusters. TamR began spreading as individual cells, a phenotype similar to mesenchymal cells. Scale bar, 100 μm.
c, ERα protein levels in MCF7P and TamR cells detected by Western blots using a serial dilution of whole cell extract for semi quantitative purpose. GAPDH was used as a loading control.
d, Structural diagram of ERα protein showing the positions of point mutations in the ligand-binding domain (LBD) that were reported in endocrine-resistant or metastatic ERα+ breast cancers before (left). No LBD point mutation was detected in this TamR cell line with Sanger sequencing (right).
e, Genome browser snap images of the GRO-seq and RNA-seq signals at PGR and PRLR loci showing a significant downregulation of these two epithelial markers in TamR cells.
f, Genome browser snap images of the GRO-seq and RNA-seq signals at gene body regions for S100P and FN1, showing a significant upregulation of these two cancer invasiveness-associated genes in TamR cells.
g, h, RT-qPCR analyses of mRNA levels of selected epithelial markers (g) or invasive genes (h) in MCF7P and TamR cell lines. The epithelial markers are downregulated and invasiveness-associated genes are upregulated in TamR cells.
For a, g and h, data are presented as mean ± s.d. from n=3 independent experiments. b and c are representative of two independent experiments. Unprocessed immunoblots are shown in Source Data Extended Data Fig. 1. Statistical source data are available in Statistical Source Data Extended Data Fig. 1.
Extended Data Fig. 2. Analyses using patient tumor tissues and PDX samples revealed phenotypic plasticity-enhancing transcriptional changes associated with therapy resistance.
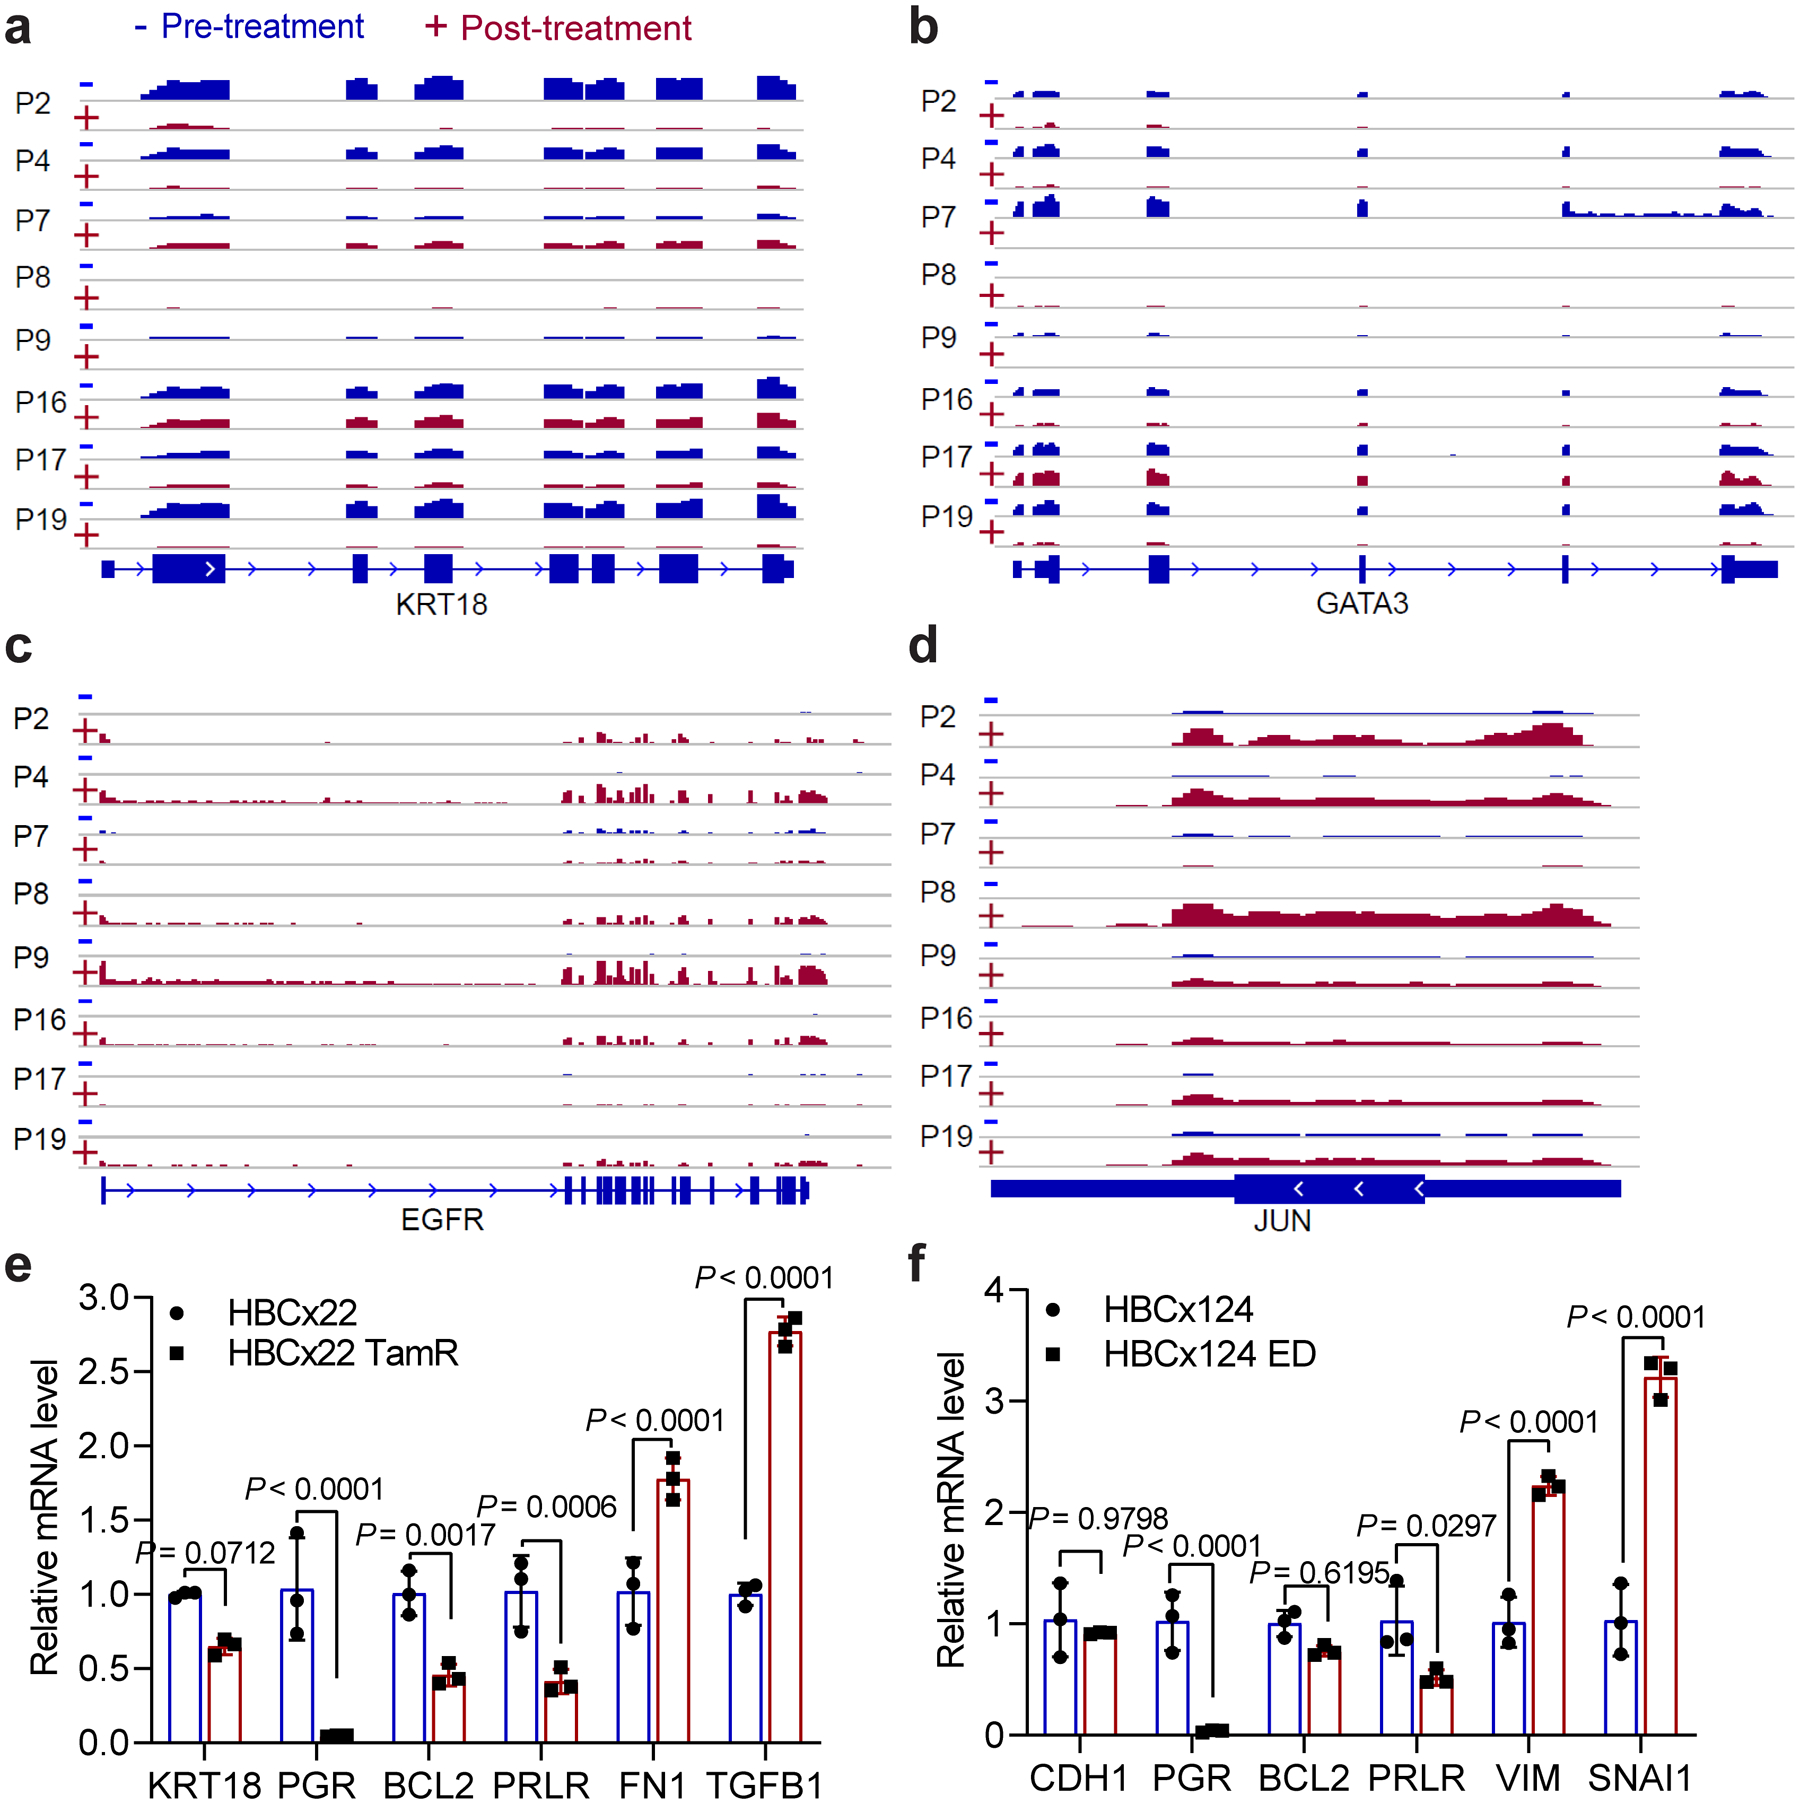
a, b, Genome browser snap images of the RNA-seq signals at gene body regions for KRT18 and GATA3 showing the significant downregulation of these two epithelial markers at post-treatment stage in the 8 randomly picked therapy-resistant patients.
c, d, Genome browser snap images of the RNA-seq signals at gene body regions for EGFR and JUN showing the significant upregulation of these two invasive genes at post-treatment stage in the 8 randomly picked therapy-resistant patients.
e, f, RT-qPCR analyses of mRNA levels of selected epithelial and invasive genes in paired parental (HBCx22) vs tamoxifen-resistant (HBCx22 TamR) PDX tumors (e), and in paired parental (HBCx124) vs estrogen deprivation derived resistant (HBCx124 ED) PDX tumors (f). The results show all of these epithelial markers are downregulated and all of these invasive genes are upregulated in endocrine-resistant PDX tumors. Data are presented as mean ± s.d. from n=3 independent experiments. P values were determined by two-sided t-tests. Statistical source data are available in Statistical Source Data Extended Data Fig. 2.
Extended Data Fig. 3. Endocrine resistance accompanies global enhancer reprogramming that drives plasticity-related gene transcription.
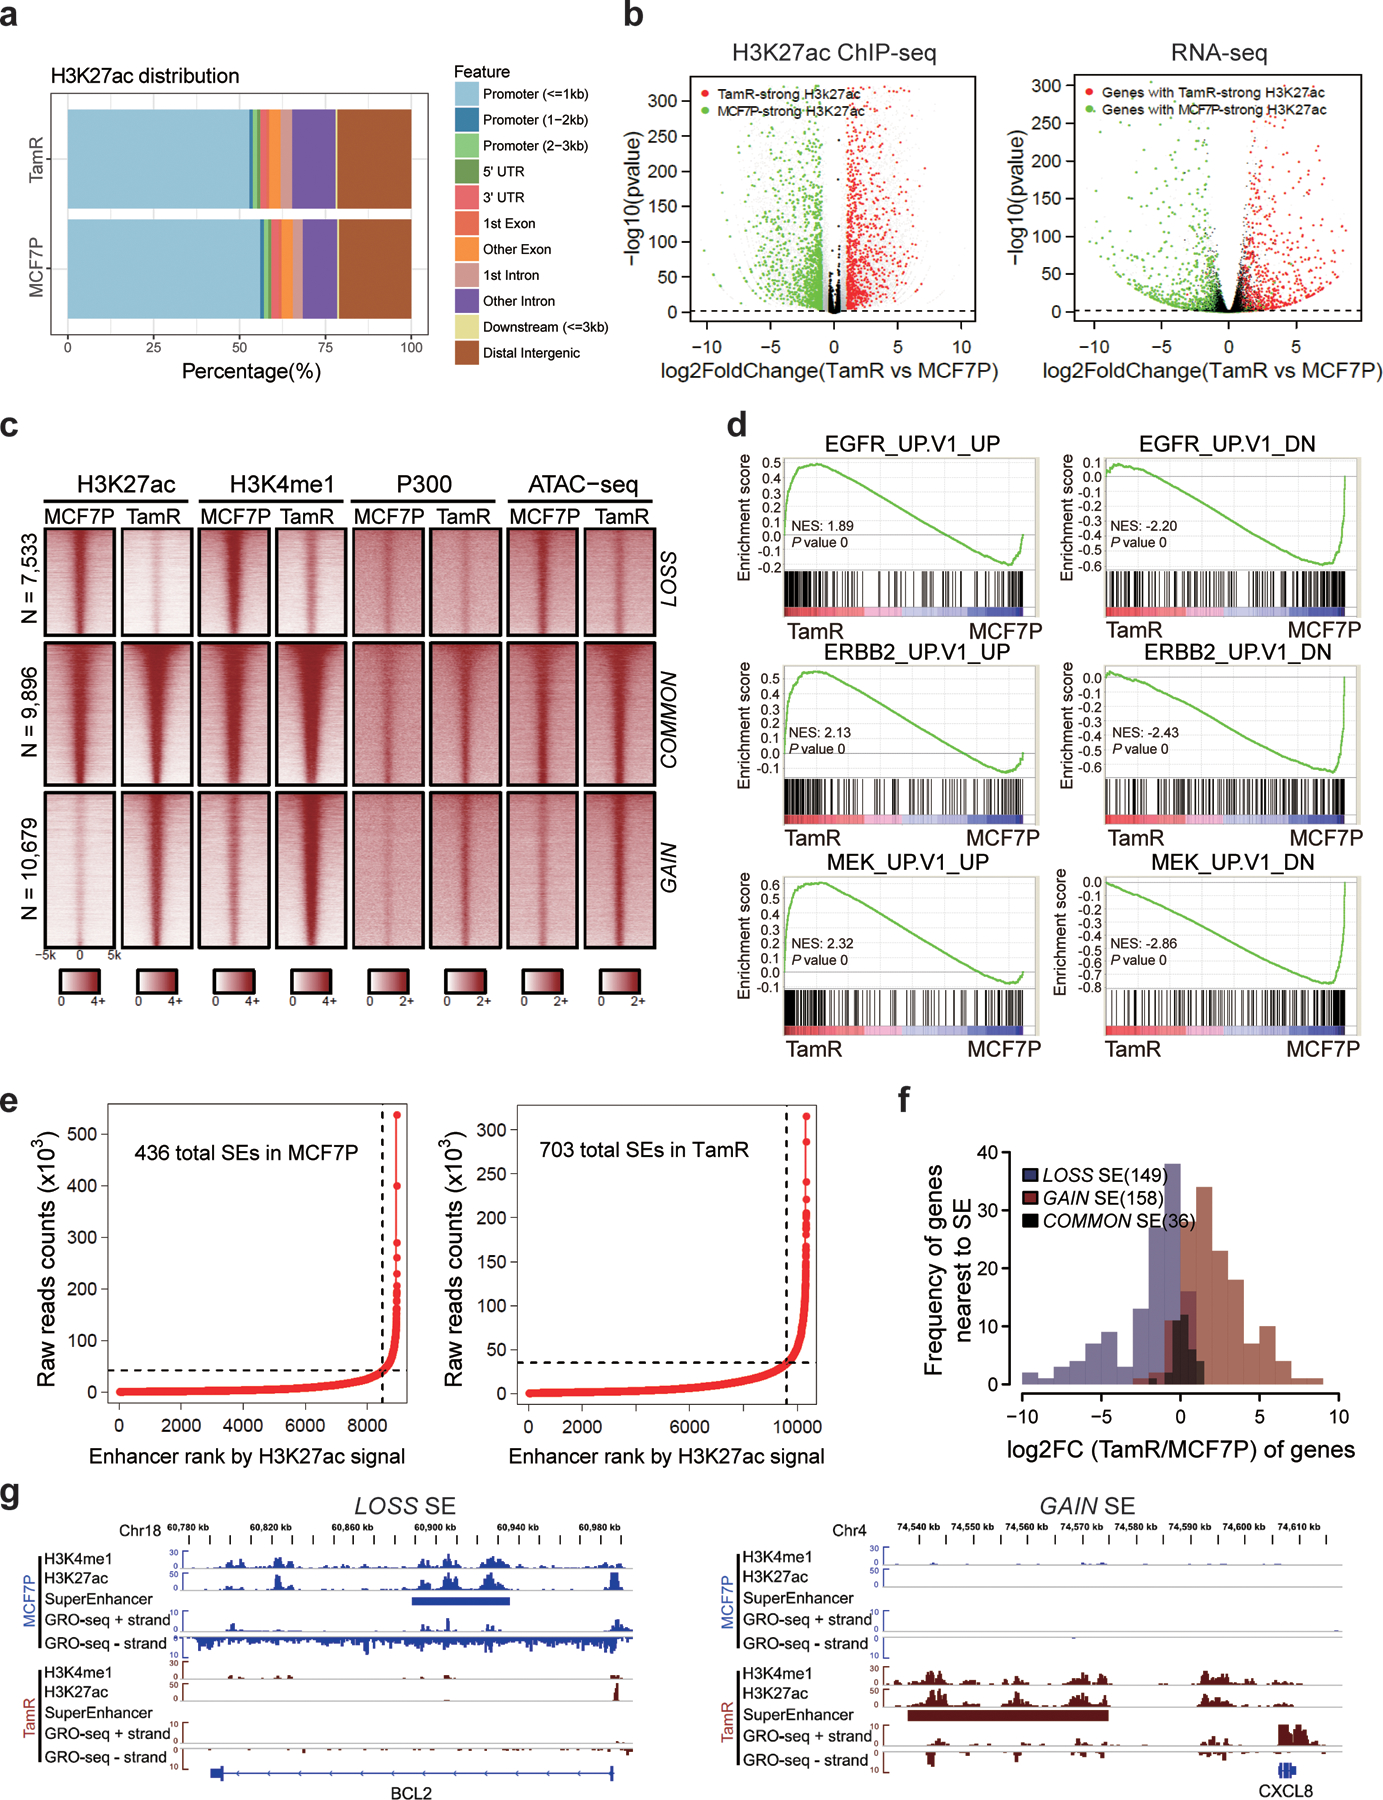
a, Genomic annotations of the H3K27ac ChIP-seq signals in MCF7P and TamR cell lines.
b, Volcano plots showing the changes of H3K27ac signals at promoter regions correlate well with the changes in gene expression detected by RNA-seq in TamR cells. n=2 biologically independent experiments, and P values were determined by Wald test with Benjamini-Hochberg adjustment.
c, Heatmap of H3K27ac, H3K4me1 and P300 ChIP-seq data for all identified lost, common and gained enhancers genome wide. Chromatin accessibility profiled by ATAC-seq at the corresponding genomic regions is also shown on the right.
d, GSEA analyses on RNA-seq data showing the enrichment of oncogenic signatures from MSigDB database in MCF7P or TamR cells. The nominal P values were determined by empirical gene-based permutation test.
e, Total super-enhancers (SEs) in MCF7P and TamR cell lines identified by the ROSE program ranked by H3K27ac signal intensities.
f, Histograms of the log2(Fold Change) of genes nearest to the differential SEs showing that gained SEs correlate with gene upregulation and lost SEs correlate with gene downregulation.
g, Genome browser snap images of lost SE at BCL2 locus and gained SE at CXCL8 locus. The SE gain/loss correlates well with gene upregulation and downregulation detected by GRO-seq.
Extended Data Fig. 4. High-order enhancer component assemblies mediated by differential TF-TF and TF-enhancer interactions correspond with endocrine resistance-associated enhancer reprogramming.
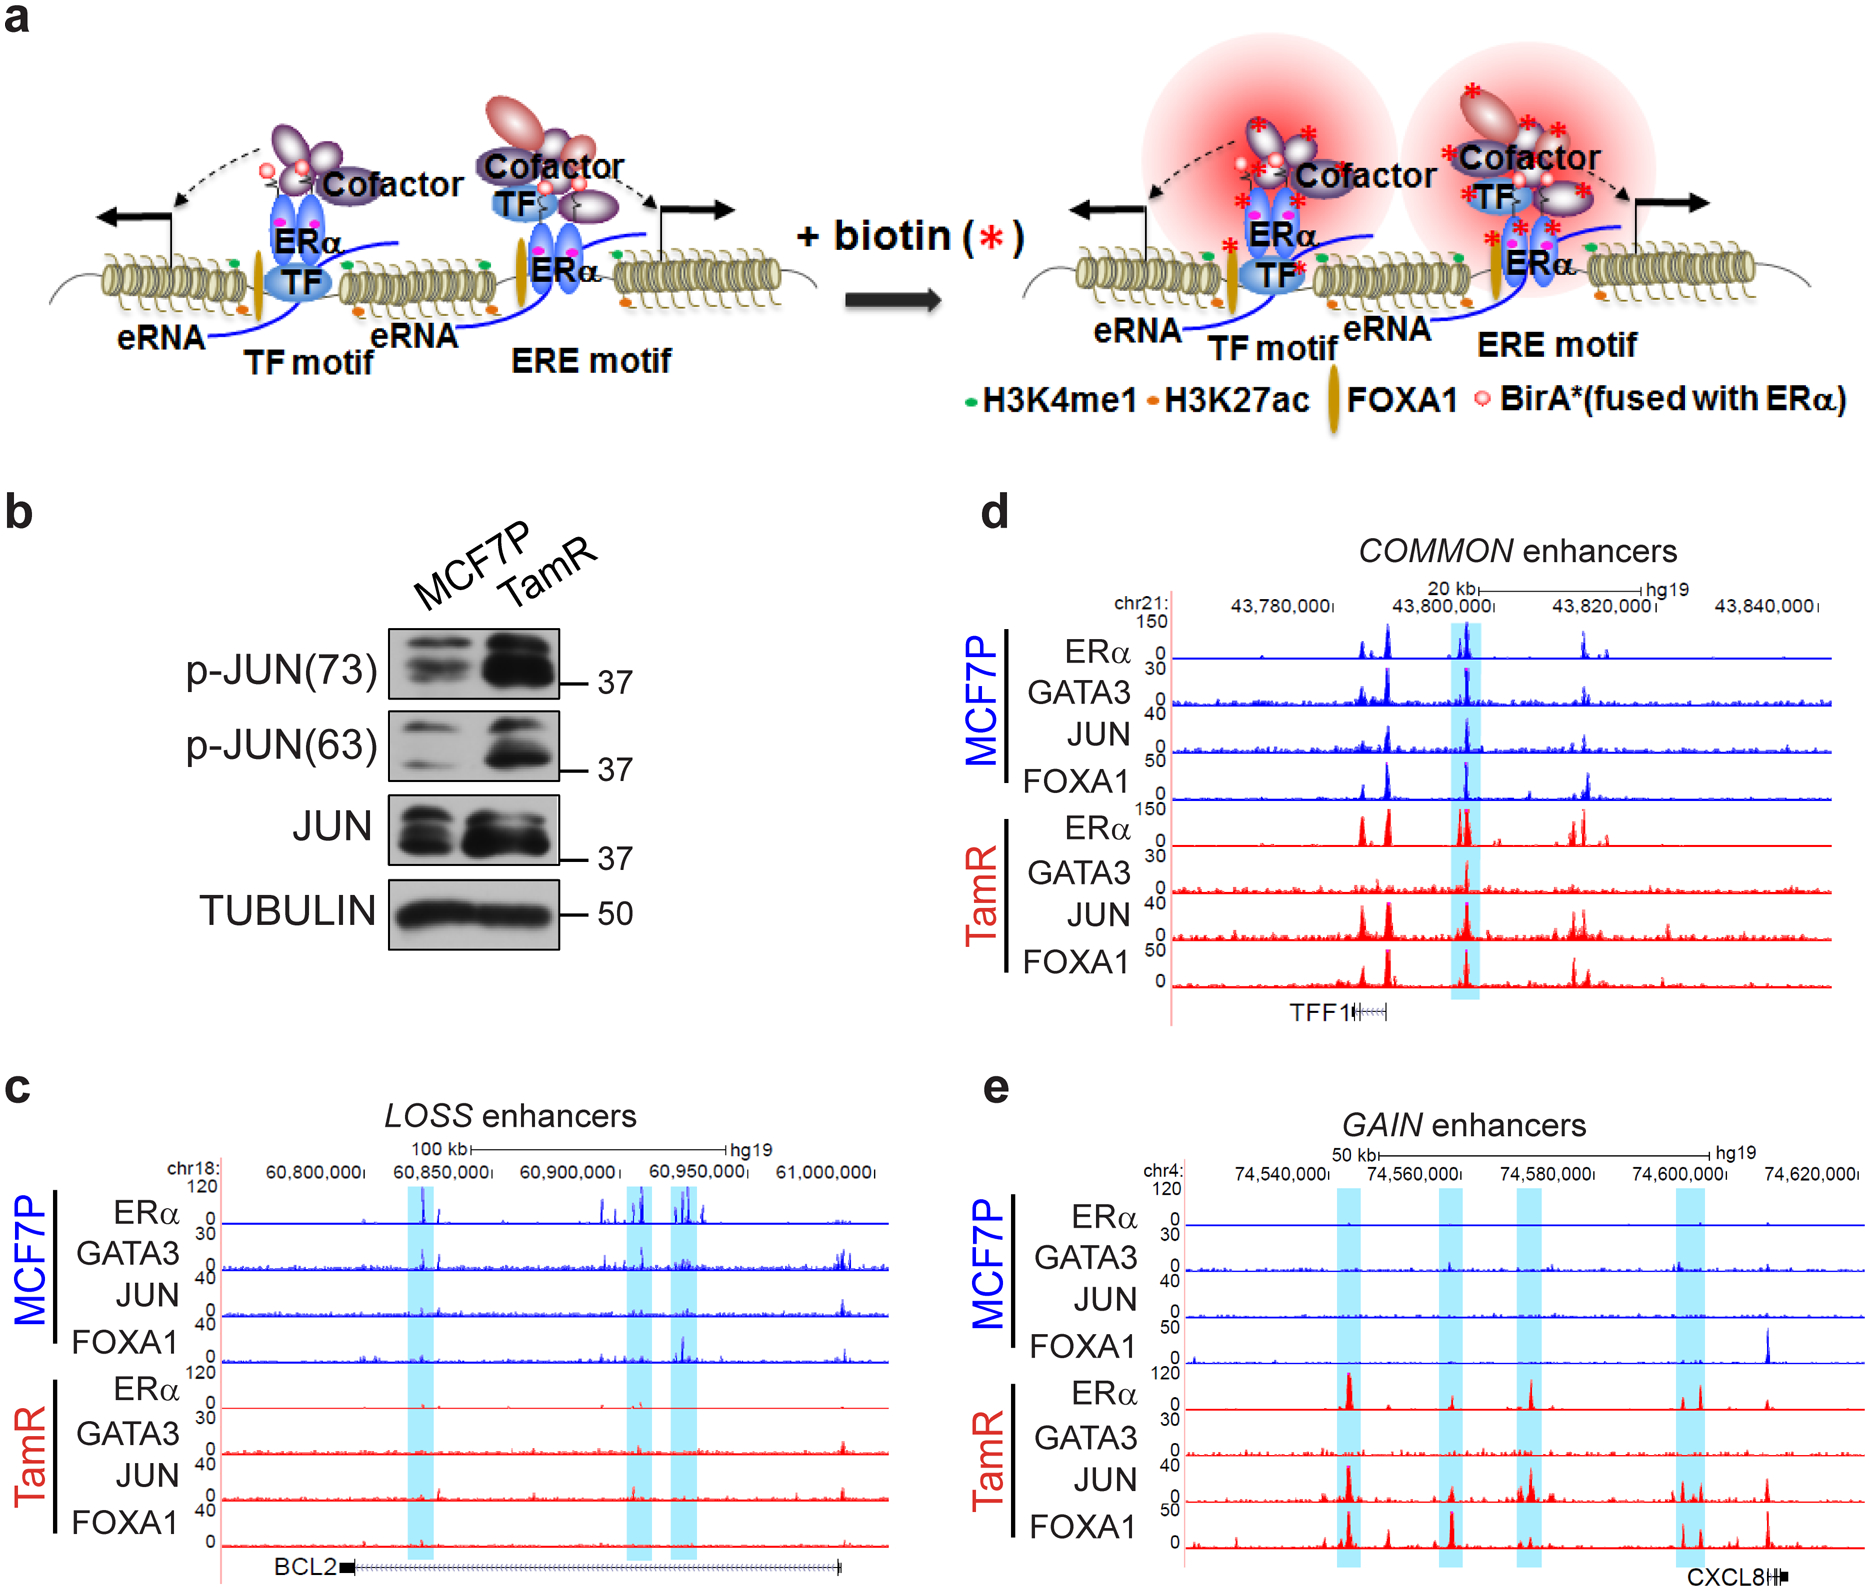
a, Schematic diagram of BioID (in vivo proximity-dependent biotin identification) approach for identification of ERα-interacting nuclear proteins including both TFs and other transcriptional cofactors in alive cells. This technology was used to explore the ERα-interacting (or in the close proximity) enhancer components in either endocrine-sensitive or -resistant cellular context.
b, Western blot analyses of total JUN or phosphorylated JUN protein levels in MCF7P and TamR cells. Tubulin was used as a loading control.
c-e, Genome browser snap images of ChIP-seq data showing the co-binding of GATA3, JUN, FOXA1 and ERα at the LOSS enhancer regions near BCL2 gene (c), the COMMON enhancer regions near TFF1 gene (d), and GAIN enhancer regions near CXCL8 gene (e) in both MCF7P and TamR cell lines.
Immunoblots are representative of two independent experiments. Unprocessed immunoblots are shown in Source Data Extended Data Fig. 4.
Extended Data Fig. 5. GATA3 is required for maintenance of LOSS enhancers and expression of epithelial makers.
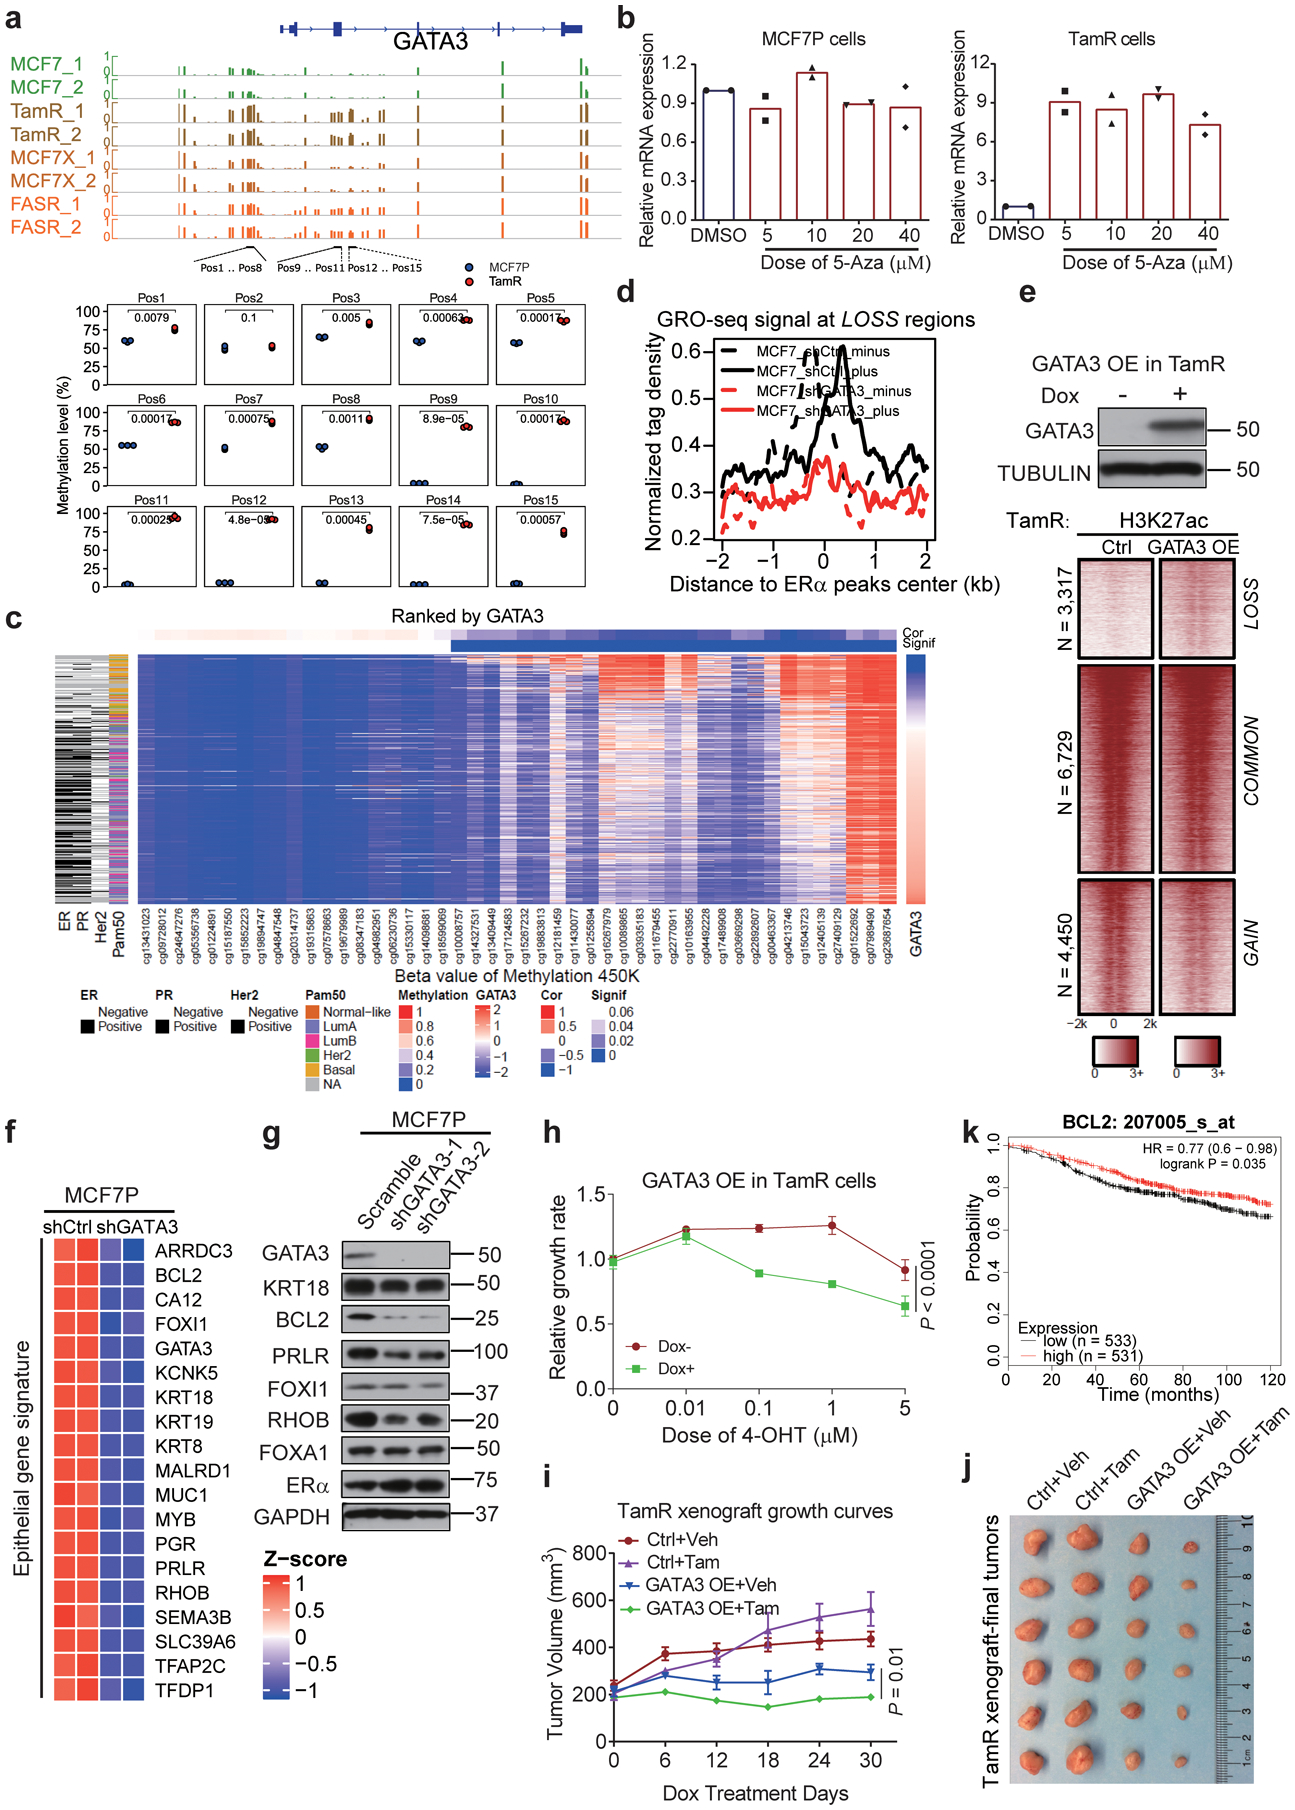
a, Our pyrosequencing analyses (bottom), and published DNA methylation data from three different endocrine-resistant MCF7-derived lines (TamR: tamoxifen-resistant, FASR: fulvestrant-resistant, MCF7X: estrogen deprivation-resistant) (top). DNA methylation level at GATA3 locus is significantly increased in endocrine-resistant lines. n=3 independent experiments, two-sided t-tests.
b, RT-qPCR showing transcript levels of GATA3 in MCF7P and TamR with or without 5-Aza treatment for 100 hours. n=2 independent experiments.
c, Heatmap generated by integrating TCGA data on GATA3 mRNA level, DNA methylation, and breast cancer subtype. High DNA methylation and low GATA3 expression are associated with invasive breast cancers (ER-/PR-/ HER2- and basal subtype).
d, Aggregate plots of normalized GRO-seq tag density in MCF7P with shCtrl or shGATA3.
e, Heatmap of ChIP-seq (bottom) showing that GATA3 OE in TamR can re-activate LOSS enhancers. Western blot confirms GATA3 overexpression (top).
f, Heatmap depiction of the downregulation of epithelial genes after KD GATA3 in MCF7P. n=2 independent experiments.
g, Western blot of the indicated epithelial markers in MCF7P cells upon GATA3 KD.
h, CCK8 assays with 4-OHT treatment for 5 days. Dox-induced GATA3 overexpression in TamR re-sensitizes them to 4-OHT. n=3 independent experiments, mean ± s.d., two-sided t-tests.
i, j, Tumor growth curves (i) and representative tumor images at end point (j) of orthotopic xenografts of manipulated TamR cells in nude mice (n=4/group). After tumors reached ~200mm3, tumor sizes were measured once a week upon starting doxycycline water diet and subcutaneous injections of tamoxifen (1 mg/mouse, three times/week). Mean ± s.d., two-sided t-tests.
k, Relapse free survival (RFS) curves generated from kmplot website according to BCL2 levels in patients receiving endocrine therapy. P values were determined by log-rank test.
Immunoblots are representative of two independent experiments. Unprocessed immunoblots are shown in Source Data Extended Data Fig. 5. Statistical source data are available in Statistical Source Data Extended Data Fig. 5.
Extended Data Fig. 6. AP1-mediated GAIN enhancer activation promotes endocrine resistance-associated gene program and phenotypes.
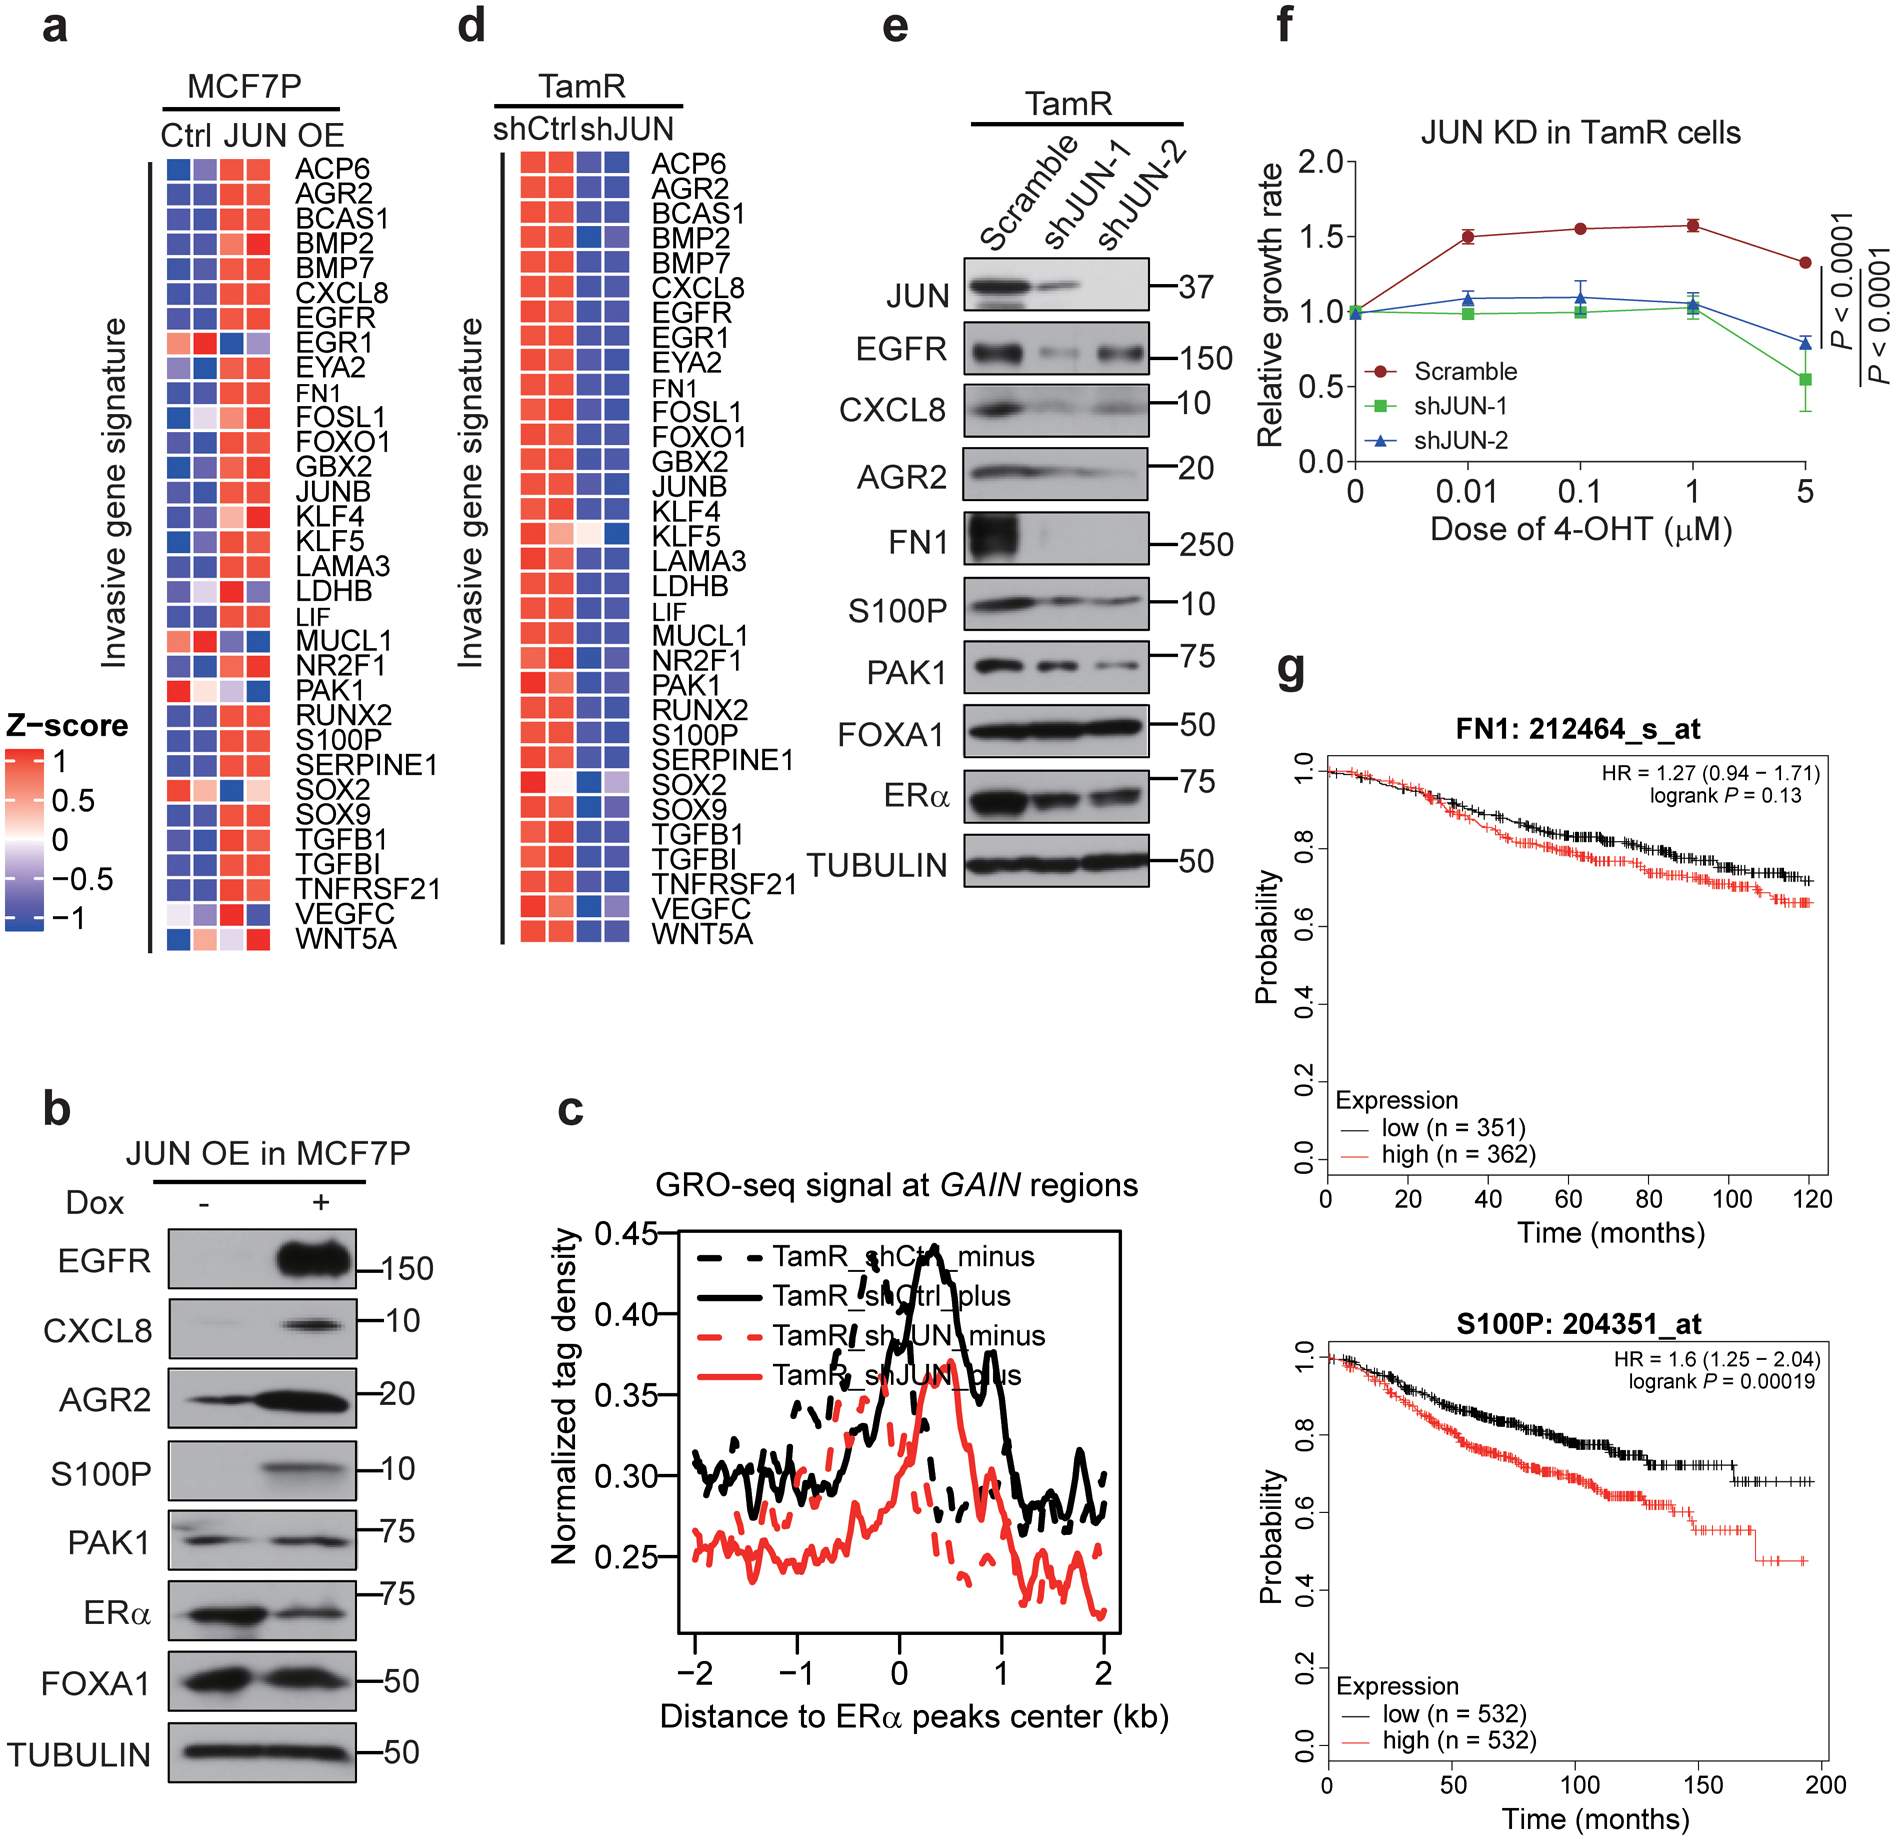
a, Heatmap depiction of the upregulation of indicated invasive genes after JUN overexpression in MCF7P cells. n=2 biologically independent experiments.
b, Western blot images of indicated invasive markers in MCF7P cells with or without JUN overexpression, showing that JUN overexpression is sufficient to activate the expression of these invasive markers.
c, Aggregate plots of the normalized GRO-seq tag density at GAIN enhancers in TamR cells transduced with shCtrl or shJUN lentiviruses showing that knockdown of JUN greatly reduces eRNA transcription due to enhancer inactivation. The dashed and solid lines represent the minus and plus strands of eRNA respectively.
d, Heatmap depiction of the downregulation of indicated invasive genes after JUN knockdown in TamR cells. n=2 biologically independent experiments.
e, Western blot analyses on indicated invasive markers in TamR cells transduced with a scramble control or two different lentiviral shRNAs for JUN, showing that JUN is required for the expression of these invasive markers.
f, Knockdown of JUN in TamR cells re-sensitizes them to 4-OHT. TamR cells were stably knocked down with shJUN (a scramble shRNA was used as control) and CCK8 assays were used to check the relative cell viability of cells after treatment with indicated 4-OHT concentrations for 5 days. Data are presented as mean ± s.d. from n=3 independent experiments. P values were determined by two-sided t-tests.
g, Relapse free survival (RFS) curves according to FN1 and S100P gene expression levels in patients receiving endocrine therapy. The curves were generated using data from kmplot website. P values were determined by log-rank test. n numbers for different groups of patients were listed in the figure.
Immunoblots are representative of two independent experiments. Unprocessed immunoblots are shown in Source Data Extended Data Fig. 6. Statistical source data are available in Statistical Source Data Extended Data Fig. 6.
Extended Data Fig. 7. GATA3 and AP1 function coordinately to promote TamR-associated enhancer reprogramming and gene expression.
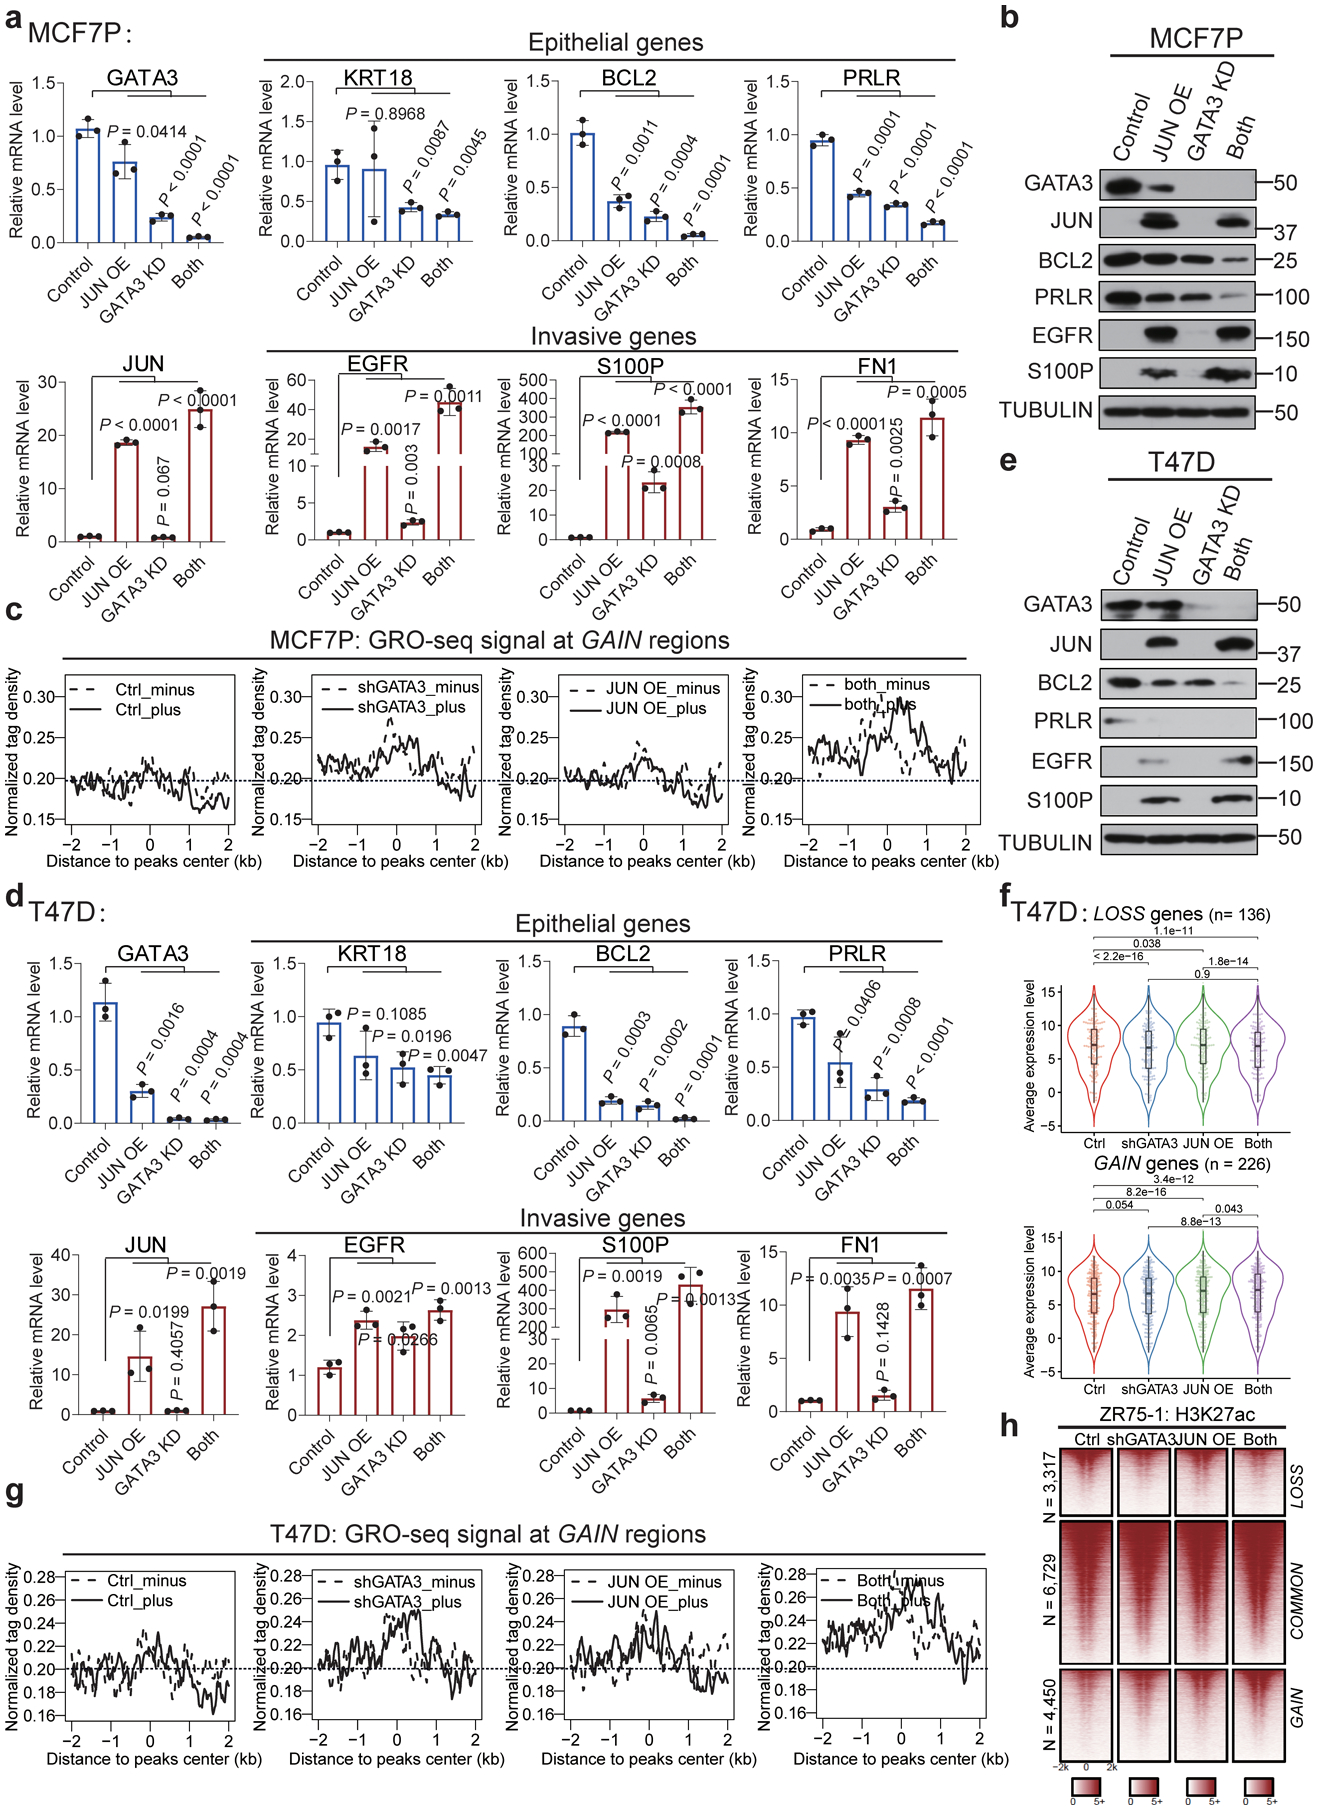
a, d, RT-qPCR analyses of selected epithelial markers and invasion-related genes in MCF7P (a) or T47D (d) cells with indicated manipulations, showing the coordinate gene regulation effects by GATA3 and JUN. Data are presented as mean ± s.d. P values were determined by two-sided t-tests.
b, e, Western blot analyses of selected epithelial markers and invasion-related genes in MCF7P (b) and T47D (e) cells with indicated manipulations, showing the coordinate role of GATA3 and JUN in regulating gene expression.
c, g, The aggregate plots of the normalized GRO-seq tag density at GAIN enhancers in MCF7P (c) and T47D (g) cells under indicated treatments. GATA3 KD and JUN OE demonstrate a synergistic effect on eRNA transcription. The dashed line represents the minus strand and solid line indicates the plus strand of eRNA.
f, Box plots representation of gene expression in T47D cells. Simultaneously depleting GATA3 and overexpressing JUN (“both”) shows a more dramatic effect on the lost and gained gene expression in T47D cells compared to manipulating individual gene alone. P values were calculated by Wilcoxon signed rank test. The lower and upper hinges correspond to the first and third quartiles, and the midline represents the median. The upper and lower whiskers extend from the hinge up to 1.5 * IQR (inter-quartile range). Outlier points are indicated if they extend beyond this range.
h, Heatmaps of H3K27ac ChIP-seq data at LOSS, COMMON and GAIN enhancers in ZR75–1 cells with the indicated treatments.
For a and d, the data are from n=3 independent experiments. Immunoblots are representative of two independent experiments. Unprocessed immunoblots are shown in Source Data Extended Data Fig. 7. Statistical source data are available in Statistical Source Data Extended Data Fig. 7.
Extended Data Fig. 8. GATA3 and AP1 cooperate to regulate endocrine resistance and tumor growth in vitro and in vivo.
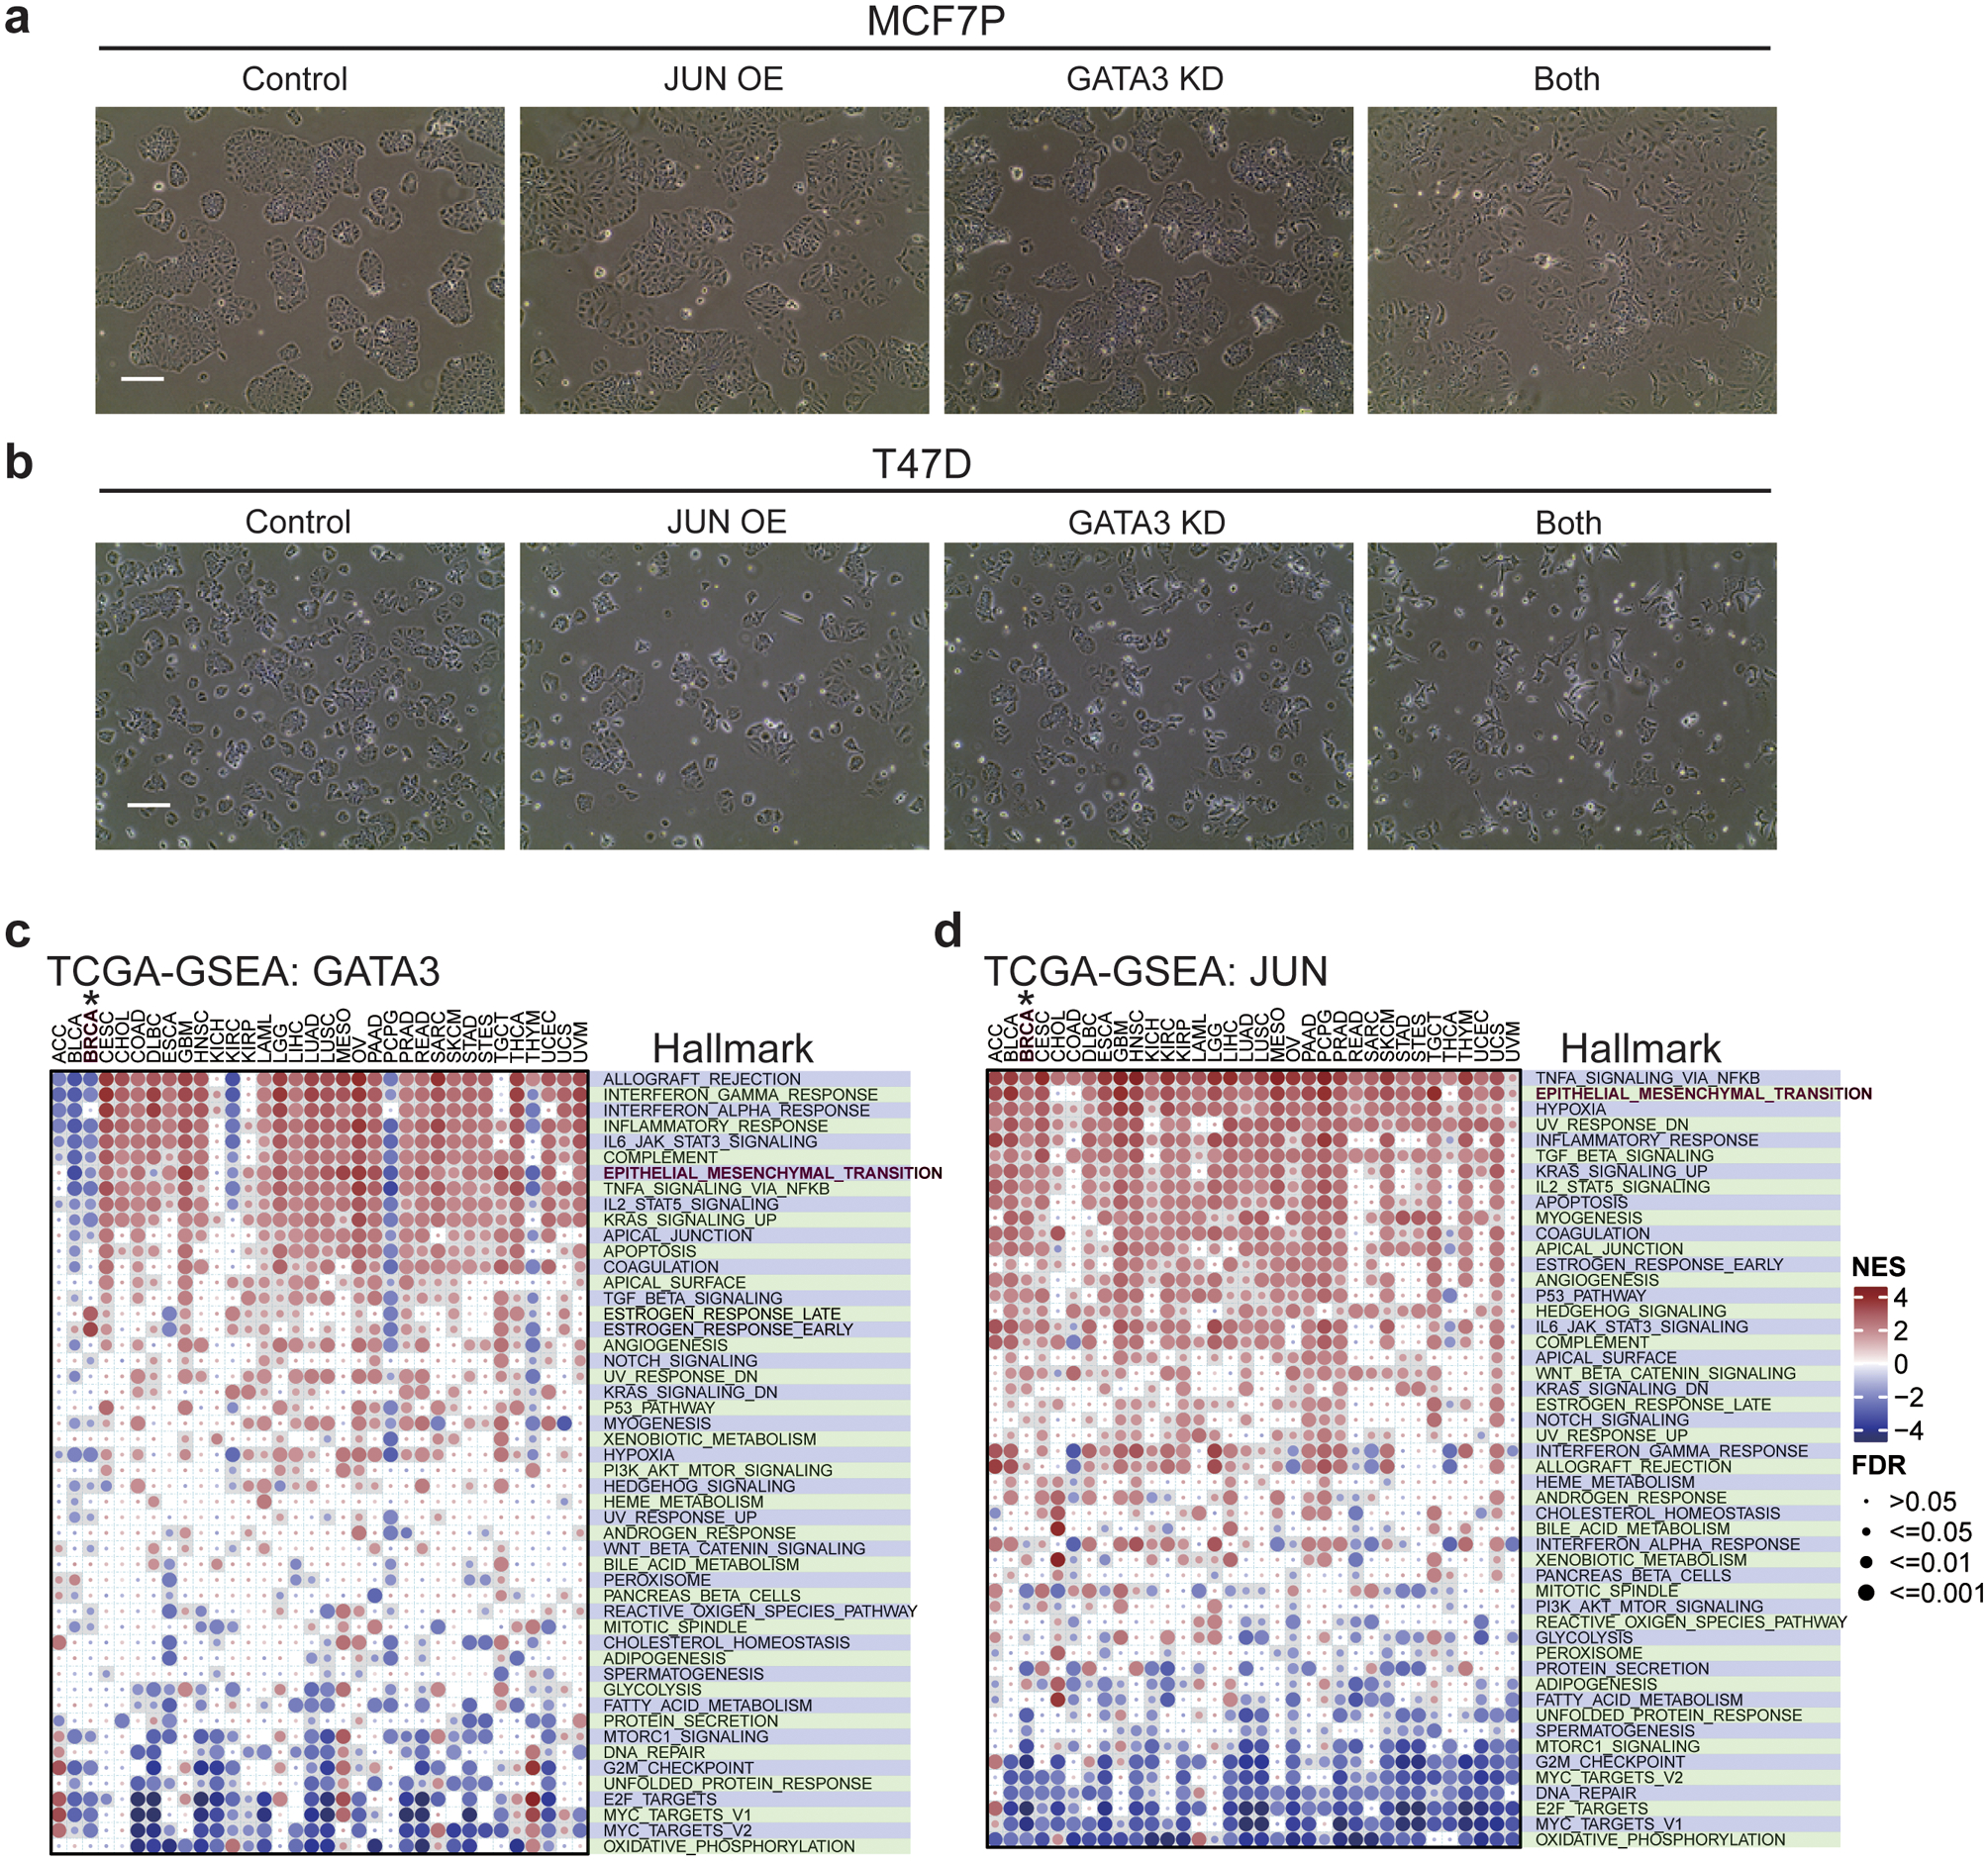
a, b, Representative brightfield pictures of MCF7P cells (a) and T47D cells (b) with indicated manipulations. The control cells display a typical epithelial cell-like morphology and grow in tightly packed clusters. Cells with both GATA3 knockdown and JUN overexpression have become more spread out (a phenotype of more invasive cancer cells) than the control and the cells with individual manipulation. Magnification, ×100. Scale bar, 100 μm. n=2 independent experiments were performed with similar results.
c, d, GSEA analyses of RNA-seq data for 34 different cancer types including breast cancer (BRCA) from TCGA database showing the correlation of GATA3 (c) and JUN (d) expression levels with the enrichment of cancer hallmark gene sets from MSigDb database. We found that high expression level of JUN was positively associated with the enrichment of EMT pathway in breast cancer, however high expression level of GATA3 was negatively correlated with EMT pathway in breast cancer. The circle size indicates significance level; and the color represents the normalized enrichment score (NES). The nominal P values were determined by empirical gene-based permutation test with Benjamini-Hochberg adjustment.
Supplementary Material
Supplementary Table 1: List of Oligonucleotides used.
Supplementary Table 2: List of antibodies used.
Supplementary Table 3: List of ER? BioID mass spectrometry data.
Supplementary Table 4: Information on 21 human research participants.
REFERENCES
- 1.Dai X et al. Breast cancer intrinsic subtype classification, clinical use and future trends. Am J Cancer Res 5, 2929–2943 (2015). [PMC free article] [PubMed] [Google Scholar]
- 2.Fu J & Jeffrey SS Transcriptomic signatures in breast cancer. Mol Biosyst 3, 466–472 (2007). [DOI] [PubMed] [Google Scholar]
- 3.Murphy CG & Dickler MN Endocrine resistance in hormone-responsive breast cancer: mechanisms and therapeutic strategies. Endocr Relat Cancer 23, R337–352 (2016). [DOI] [PubMed] [Google Scholar]
- 4.Musgrove EA & Sutherland RL Biological determinants of endocrine resistance in breast cancer. Nat Rev Cancer 9, 631–643 (2009). [DOI] [PubMed] [Google Scholar]
- 5.Hnisz D et al. Super-enhancers in the control of cell identity and disease. Cell 155, 934–947 (2013). [DOI] [PMC free article] [PubMed] [Google Scholar]
- 6.Long HK, Prescott SL & Wysocka J Ever-Changing Landscapes: Transcriptional Enhancers in Development and Evolution. Cell 167, 1170–1187 (2016). [DOI] [PMC free article] [PubMed] [Google Scholar]
- 7.Visel A, Rubin EM & Pennacchio LA Genomic views of distant-acting enhancers. Nature 461, 199–205 (2009). [DOI] [PMC free article] [PubMed] [Google Scholar]
- 8.De Santa F et al. A large fraction of extragenic RNA pol II transcription sites overlap enhancers. PLoS biology 8, e1000384 (2010). [DOI] [PMC free article] [PubMed] [Google Scholar]
- 9.Kim TK et al. Widespread transcription at neuronal activity-regulated enhancers. Nature 465, 182–187 (2010). [DOI] [PMC free article] [PubMed] [Google Scholar]
- 10.Hah N et al. A rapid, extensive, and transient transcriptional response to estrogen signaling in breast cancer cells. Cell 145, 622–634 (2011). [DOI] [PMC free article] [PubMed] [Google Scholar]
- 11.Li W et al. Functional roles of enhancer RNAs for oestrogen-dependent transcriptional activation. Nature 498, 516–520 (2013). [DOI] [PMC free article] [PubMed] [Google Scholar]
- 12.Liu Z et al. Enhancer activation requires trans-recruitment of a mega transcription factor complex. Cell 159, 358–373 (2014). [DOI] [PMC free article] [PubMed] [Google Scholar]
- 13.Zhu C et al. A Non-canonical Role of YAP/TEAD Is Required for Activation of Estrogen-Regulated Enhancers in Breast Cancer. Mol Cell 75, 791–806 e798 (2019). [DOI] [PMC free article] [PubMed] [Google Scholar]
- 14.Lupien M et al. Growth factor stimulation induces a distinct ER alpha cistrome underlying breast cancer endocrine resistance. Gene Dev 24, 2219–2227 (2010). [DOI] [PMC free article] [PubMed] [Google Scholar]
- 15.Ross-Innes CS et al. Differential oestrogen receptor binding is associated with clinical outcome in breast cancer. Nature 481, 389–393 (2012). [DOI] [PMC free article] [PubMed] [Google Scholar]
- 16.Fu X et al. FOXA1 overexpression mediates endocrine resistance by altering the ER transcriptome and IL-8 expression in ER-positive breast cancer. Proc Natl Acad Sci U S A 113, E6600–E6609 (2016). [DOI] [PMC free article] [PubMed] [Google Scholar]
- 17.Jeselsohn R et al. Embryonic transcription factor SOX9 drives breast cancer endocrine resistance. Proc Natl Acad Sci U S A 114, E4482–E4491 (2017). [DOI] [PMC free article] [PubMed] [Google Scholar]
- 18.Morrison G et al. Therapeutic potential of the dual EGFR/HER2 inhibitor AZD8931 in circumventing endocrine resistance. Breast Cancer Res Treat 144, 263–272 (2014). [DOI] [PMC free article] [PubMed] [Google Scholar]
- 19.Subramanian A et al. Gene set enrichment analysis: a knowledge-based approach for interpreting genome-wide expression profiles. Proc Natl Acad Sci U S A 102, 15545–15550 (2005). [DOI] [PMC free article] [PubMed] [Google Scholar]
- 20.Hiscox S et al. Tamoxifen resistance in breast cancer cells is accompanied by an enhanced motile and invasive phenotype: inhibition by gefitinib (‘Iressa’, ZD1839). Clin Exp Metastasis 21, 201–212 (2004). [DOI] [PubMed] [Google Scholar]
- 21.Creighton CJ et al. Development of resistance to targeted therapies transforms the clinically associated molecular profile subtype of breast tumor xenografts. Cancer Res 68, 7493–7501 (2008). [DOI] [PMC free article] [PubMed] [Google Scholar]
- 22.Cottu P et al. Acquired resistance to endocrine treatments is associated with tumor-specific molecular changes in patient-derived luminal breast cancer xenografts. Clin Cancer Res 20, 4314–4325 (2014). [DOI] [PubMed] [Google Scholar]
- 23.Gupta PB, Pastushenko I, Skibinski A, Blanpain C & Kuperwasser C Phenotypic Plasticity: Driver of Cancer Initiation, Progression, and Therapy Resistance. Cell Stem Cell 24, 65–78 (2019). [DOI] [PMC free article] [PubMed] [Google Scholar]
- 24.Jolly MK et al. Implications of the Hybrid Epithelial/Mesenchymal Phenotype in Metastasis. Front Oncol 5, 155 (2015). [DOI] [PMC free article] [PubMed] [Google Scholar]
- 25.McLean CY et al. GREAT improves functional interpretation of cis-regulatory regions. Nat Biotechnol 28, 495–501 (2010). [DOI] [PMC free article] [PubMed] [Google Scholar]
- 26.Hutcheson IR et al. Oestrogen receptor-mediated modulation of the EGFR/MAPK pathway in tamoxifen-resistant MCF-7 cells. Breast Cancer Res Treat 81, 81–93 (2003). [DOI] [PubMed] [Google Scholar]
- 27.Schiff R et al. Cross-talk between estrogen receptor and growth factor pathways as a molecular target for overcoming endocrine resistance. Clin Cancer Res 10, 331S–336S (2004). [DOI] [PubMed] [Google Scholar]
- 28.Gilbert LA et al. CRISPR-mediated modular RNA-guided regulation of transcription in eukaryotes. Cell 154, 442–451 (2013). [DOI] [PMC free article] [PubMed] [Google Scholar]
- 29.Paech K et al. Differential ligand activation of estrogen receptors ERalpha and ERbeta at AP1 sites. Science 277, 1508–1510 (1997). [DOI] [PubMed] [Google Scholar]
- 30.Saville B et al. Ligand-, cell-, and estrogen receptor subtype (alpha/beta)-dependent activation at GC-rich (Sp1) promoter elements. J Biol Chem 275, 5379–5387 (2000). [DOI] [PubMed] [Google Scholar]
- 31.Roux KJ, Kim DI, Raida M & Burke B A promiscuous biotin ligase fusion protein identifies proximal and interacting proteins in mammalian cells. J Cell Biol 196, 801–810 (2012). [DOI] [PMC free article] [PubMed] [Google Scholar]
- 32.Wu Y et al. Tamoxifen Resistance in Breast Cancer Is Regulated by the EZH2-ERalpha-GREB1 Transcriptional Axis. Cancer Res 78, 671–684 (2018). [DOI] [PMC free article] [PubMed] [Google Scholar]
- 33.Fu X et al. FOXA1 upregulation promotes enhancer and transcriptional reprogramming in endocrine-resistant breast cancer. Proc Natl Acad Sci U S A (2019). [DOI] [PMC free article] [PubMed] [Google Scholar]
- 34.Eferl R & Wagner EF AP-1: A double-edged sword in tumorigenesis. Nature Reviews Cancer 3, 859–868 (2003). [DOI] [PubMed] [Google Scholar]
- 35.Smeal T, Binetruy B, Mercola DA, Birrer M & Karin M Oncogenic and transcriptional cooperation with Ha-Ras requires phosphorylation of c-Jun on serines 63 and 73. Nature 354, 494–496 (1991). [DOI] [PubMed] [Google Scholar]
- 36.Stone A et al. DNA methylation of oestrogen-regulated enhancers defines endocrine sensitivity in breast cancer. Nat Commun 6, 7758 (2015). [DOI] [PMC free article] [PubMed] [Google Scholar]
- 37.Curtis C et al. The genomic and transcriptomic architecture of 2,000 breast tumours reveals novel subgroups. Nature 486, 346–352 (2012). [DOI] [PMC free article] [PubMed] [Google Scholar]
- 38.Johnston SR et al. Increased activator protein-1 DNA binding and c-Jun NH2-terminal kinase activity in human breast tumors with acquired tamoxifen resistance. Clin Cancer Res 5, 251–256 (1999). [PubMed] [Google Scholar]
- 39.Malorni L et al. Blockade of AP-1 Potentiates Endocrine Therapy and Overcomes Resistance. Mol Cancer Res 14, 470–481 (2016). [DOI] [PMC free article] [PubMed] [Google Scholar]
- 40.Schiff R et al. Oxidative stress and AP-1 activity in tamoxifen-resistant breast tumors in vivo. J Natl Cancer Inst 92, 1926–1934 (2000). [DOI] [PubMed] [Google Scholar]
- 41.Boumahdi S & de Sauvage FJ The great escape: tumour cell plasticity in resistance to targeted therapy. Nat Rev Drug Discov 19, 39–56 (2020). [DOI] [PubMed] [Google Scholar]
- 42.Mu P et al. SOX2 promotes lineage plasticity and antiandrogen resistance in TP53- and RB1-deficient prostate cancer. Science 355, 84–88 (2017). [DOI] [PMC free article] [PubMed] [Google Scholar]
- 43.Shaffer SM et al. Rare cell variability and drug-induced reprogramming as a mode of cancer drug resistance. Nature 546, 431–435 (2017). [DOI] [PMC free article] [PubMed] [Google Scholar]
- 44.Viswanathan VS et al. Dependency of a therapy-resistant state of cancer cells on a lipid peroxidase pathway. Nature 547, 453–457 (2017). [DOI] [PMC free article] [PubMed] [Google Scholar]
- 45.Luqmani YA & Alam-Eldin N Overcoming Resistance to Endocrine Therapy in Breast Cancer: New Approaches to a Nagging Problem. Med Princ Pract 25 Suppl 2, 28–40 (2016). [DOI] [PMC free article] [PubMed] [Google Scholar]
- 46.Thiery JP, Acloque H, Huang RY & Nieto MA Epithelial-mesenchymal transitions in development and disease. Cell 139, 871–890 (2009). [DOI] [PubMed] [Google Scholar]
- 47.Patten DK et al. Enhancer mapping uncovers phenotypic heterogeneity and evolution in patients with luminal breast cancer. Nat Med 24, 1469–1480 (2018). [DOI] [PMC free article] [PubMed] [Google Scholar]
- 48.Roe JS et al. Enhancer Reprogramming Promotes Pancreatic Cancer Metastasis. Cell 170, 875–888 e820 (2017). [DOI] [PMC free article] [PubMed] [Google Scholar]
- 49.Kouros-Mehr H et al. GATA-3 links tumor differentiation and dissemination in a luminal breast cancer model. Cancer Cell 13, 141–152 (2008). [DOI] [PMC free article] [PubMed] [Google Scholar]
Associated Data
This section collects any data citations, data availability statements, or supplementary materials included in this article.
Supplementary Materials
Supplementary Table 1: List of Oligonucleotides used.
Supplementary Table 2: List of antibodies used.
Supplementary Table 3: List of ER? BioID mass spectrometry data.
Supplementary Table 4: Information on 21 human research participants.


