Abstract
Background:
Liver hepatocellular carcinoma (LIHC) and cholangiocarcinoma (CHOL) are common primary liver cancers worldwide. Liver stem cells have biopotential to differentiate into either hepatocytes and cholangiocytes, the phenotypic overlap between LIHC and CHOL has been acceptable as a continuous liver cancer spectrum. However, few studies directly investigated the underlying molecular mechanisms between LIHC and CHOL.
Method:
To identify the candidate genes between LIHC and CHOL, three data series including GSE31370, GSE15765 and GSE40367 were downloaded from Gene Expression Omnibus (GEO) database. The differentially expressed genes (DEGs) were identified, and function enrichment analyses were performed. The protein-protein interaction network (PPI) was constructed and the module analysis was performed using STRING and Cytoscape.
Results:
A total of 171 DEGs were identified, consisting of 49 downregulated genes and 122 upregulated genes. Compared with CHOL, the enriched functions of the DEGs mainly included steroid metabolic process, acute inflammatory response, coagulation. Meanwhile, the pathway of KEGG enrichment analyses showed that the upregulated gene(s) were mainly enriched complement and coagulation cascades, cholesterol metabolism and PPAR signaling pathway, while the downregulated gene(s) were mainly enriched in ECM-receptor interaction, focal adhesion, bile secretion. Similarly, the most significant module was identified and biological process analysis revealed that these genes were mainly enriched in regulation of blood coagulation, acute inflammatory response, complement and coagulation cascades. Finally, two (ITIH2 and APOA2) of 10 hub genes had been screened out to help differential diagnosis.
Conclusion:
171 DEGs and two (ITIH2 and APOA2) of 10 hub genes identified in the present study help us understand the different molecular mechanisms between LIHC and CHOL, and provide candidate targets for differential diagnosis.
Keywords: cholangiocarcinoma (CHOL), differentially expressed genes (DEGs), gene expression omnibus (GEO), liver hepatocellular carcinoma (LIHC)
1. Introduction
The major primary liver cancers in adults consists of 3 main pathological patterns: liver hepatocellular carcinoma (LIHC), cholangiocarcinoma (CHOL), and combined hepatocellular-cholangiocarcinoma (CHC). As the second most common primary liver, CHOL is widely considered as a heterogeneous group of cancers with pathologic features of biliary tract differentiation.[1] But there are some different viewpoints from other literatures, which indicated CHOL originated in transdifferentiation of hepatocytes.[2,3] Because liver stem cells have biopotential to differentiate into either hepatocytes or cholangiocytes, the phenotypic overlap between LIHC and CHOL has been acceptable as a continuous liver cancer spectrum.[4–6] Consistent with this opinion, the study of Farshidfar et al indicated LIHC and CHOL lie along a spectrum of primary liver carcinomas, through analysis of 600 genes that are most enriched in these tumors.[6] However, there were etiologic, biological heterogeneity, therapeutic plan, even survival and prognosis differences between them.[5] When it comes to etiology, risk factors like viral hepatitis and alcoholic as we as non-alcoholic steatohepatitis are much stronger for LIHC, while history of gallstones, liver fluke infestation, and primary sclerotic cholangitis are associated with higher risk of CHOL.[7] The distinction between them is important clinically as treatment considerations differ for LIHC and CHOL. In early stage, surgery, liver transplantation, and localized ablative techniques can be regarded as radical treatments for LIHC. On the other hand, CHOL is not a widely accepted indication for liver transplantation.[8] In advanced LIHC, the multi-kinase inhibitors sorafenib, levatinib, and combination immunotherapy are standard first-line therapy options,[9–11] while unresectable CHOL are typically treated with gemcitabine combined with cisplatin therapy.[12] Although a significant amount of time and efforts have been taken on understanding primary liver cancer, there is still an incomplete appreciation of the exact mechanisms between LIHC and CHOL requiring urgent consideration.
Dynamic CT scanning and magnetic resonance imaging can help distinguish between LIHC and CHOL. However, some small mass-forming CHOL may mimic hepatocellular carcinoma, leading lack of specificity. Differential diagnosis of LIHC and CHOL represents a current clinical challenge. With the advancement of gene chips and high-throughput second-generation sequencing technologies widely used for understanding gene functions and biological patterns, identifying biomarkers for disease classification and diagnosis, increasingly more genetic data in public databases is stored to mine.[13] Microarray technology may help us to understanding the molecular basis between LIHC and CHOL. In this study, we aimed to identify DEGs between LIHC and CHOL from the Gene Expression Omnibus (GEO) database (https://www.ncbi.nlm.nih.gov/gds). Subsequently, Gene Ontology (GO) terminology and Kyoto Encyclopedia of Genes and Genomes (KEGG) pathway enrichment analysis, and protein–protein interaction (PPI) analysis were performed to screen for key genes and biological pathways. Finally, analysis and compare the level of hub gene expression level between LIHC/CHOL samples and normal samples. These analysis results can provide new perspective about their cellular origins and differential diagnosis.
2. Material and methods
2.1. Data source
GEO database is a public functional genomics data repository of high throughout gene expression data, chip, and microarrays. We obtained gene expression profile data from the GEO database based on the keywords “hepatocellular carcinoma”, “cholangiocarcinoma”, and “homo sapiens”. Three GEO series (GSE31370, GSE15765, GSE40367) were retrieved. GSE31370 was retrieved from platform GPL10558 (Illumina HumanHT-12 V4.0 expression beadchip), while GSE15765 and GSE40367 were obtained from GPL571 ([HG-U133A_2] Affymetrix Human Genome U133A 2.0 Array) and GPL570 ([HG-U133_Plus_2] Affymetrix Human Genome U133 Plus 2.0 Array) respectively. First, we excluded mixed hepatocellular cell carcinoma like combined hepatocellular-cholangiocarcinoma, because it has intermediate characteristics between experimental group including LIHC samples and control group including CHOL samples. Subsequently, all tissue samples came from primary tumor (liver) not metastasis tumor (lung, adrenal gland, and lymph node) to reduce the potential influence of spatial heterogeneity. Finally, we included the GSE31370 dataset contained 6 CHOL samples and 15 LIHC samples. The GSE15765 contained 13 CHOL samples and 70 LIHC samples. The GSE40367 contained 4 CHOL samples and 15 LIHC samples (Table 1). Ethical approval was waived since this study used only publicly available data, and did not involve any experiment on humans.
Table 1.
Statistics of 3 data series derived from GEO database.
| GEO series | CHOL | LIHC | Total | Tissue source |
| GSE31370 | 6 | 15 | 26 | liver |
| GSE15765 | 13 | 70 | 90 | liver |
| GSE40367 | 4 | 15 | 61 | liver |
CHOL = cholangiocarcinoma, GEO = Gene Expression Omnibus, GSE = GEO series, LIHC = liver hepatocellular carcinoma.
2.2. Data processing and DEGs analysis
The DEGs of GSE31370, GSE15765 and GSE40367 were obtained by GEO2R online tool (https://www.ncbi.nlm.nih.gov/geo/geo2r).[14] Screening of DEGs between iCCA and HCC as well as volcano mapping were performed using SangerBox. And the gene met the statistically significant criteria of | log FC (fold change) | > = 1.0 and P value <.05 were considered the presence of DEGs. Then, The Venn diagram web tool (http://bioinformatics.psb.ugent.be/webtools/Venn/) was performed to identify the common DEGs shared among these 3 GSEs.
2.3. GO function and KEGG pathway enrichment analyses of DEGs
To analyze the function of these DEGs, using a biological analysis tool called DAVID online database (version 6.7) (http://david.ncifcrf.gov) provides a comprehensive set of functional annotation information of genes. GO is a major bioinformatics tool to annotate genes and analyze biological functions, which consists of 3 parts including biological process (BP), cellular component (CC), and molecular function (MF). After that, Enrichr database (http://amp.pharm.mssm.edu/Enrichr/) was used to perform KEGG pathway enrichment analysis between the LIHC group and CHOL group. KEGG is a database resource for understanding high-level functions and biological systems from large-scale molecular datasets generated by high-throughput experimental technologies.[15]P < .05 was considered statistically significant.
2.4. PPI network construction and module analysis
The PPI network among the common DEGs was predicted by Search Tool for the Retrieval of Interacting Genes (STRING; http://string-db.org/) (version 11.0) online database. Analyzing the functional interactions between proteins may provide insights into the mechanisms of generation or development of diseases. The PPI networks were constructed using Cytoscape software (version 3.8.0) and the most significant module in the PPI networks was identified using a plugin called Molecular Complex Detection (MCODE) (version 1.6.1). We set the criteria for selection as follows: MCODE scores >5, degree cutoff = 2, node score cutoff = 0.2, Max depth = 100 and k-score = 2.
2.5. Hub genes selection and analysis of hub genes
The top 10 nodes with highest degree of PPI network connectivity were identified as hub genes, using CytoHubba plugin in Cytoscape. We use GEPIA as a web server for analyzing the RNA sequencing expression data from the Cancer Genome Atlas (TCGA) and the Genotype-Tissue Expression (GTEx) projects to compare these identified the top 10 hub genes between LIHC/CHOL with normal samples including differential expression analysis and patient survival analysis.[16]
3. Results
3.1. Identification of common DEGs across 3 GSEs between LIHC and CHOL
In our study, 3 data series were selected from GEO database (Table 1). According to the selection criteria of DGEs, these DGEs (381 in GSE31370, 3137 in GSE15765 and 3846 in GSE40367) were identified (Fig. 1). The overlap among the 3 data series contained 171 DEGs as shown in the Venn diagram, containing 123 upregulated genes and 48 downregulated genes (Fig. 2A).
Figure 1.

The DEGs between LIHC and CHOL as well as volcano mapping were performed using SangerBox.
Figure 2.
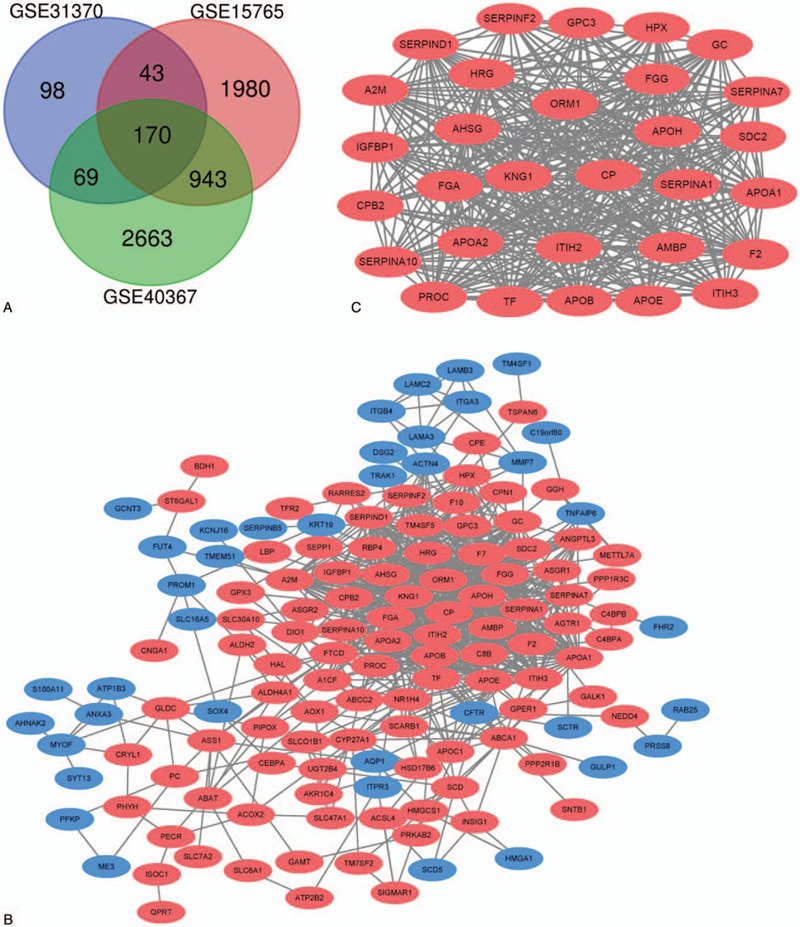
A. Venn diagram of the common DEGs shared by 3 GSEs. DEGs were selected with | log FC (fold change) | > = 1.0 and P value < .05 among the GSE31370, GSE15765, GSE40367. The 3 datasets showed an overlap of 171 genes. B. The PPI network of DEGs was constructed using Cytoscape. C. The most significant module was obtained from PPI network with 30 nodes and 369 edges. Upregulated genes are marked in red; downregulated genes are marked in blue.
3.2. GO term and KEGG pathway enrichment analyses of the common DEGs
Functional and pathway enrichment analyses were performed using DAVID and Enrichr. GO analysis results showed that changes in BP of DEGs were mainly enriched in steroid metabolic process, response to wounding, cholesterol metabolic process, acute inflammatory response, regulation of response to external stimulus, wound healing, blood coagulation (Table 2). Changes in MF were significantly enriched in endopeptidase inhibitor activity serine-type endopeptidase inhibitor activity, peptidase inhibitor activity, enzyme inhibitor activity (Table 2). Changes in CC of DEGs were mainly enriched in extracellular space, integral and intrinsic to plasma membrane (Table 2). KEGG pathway analysis showed that the upregulated DEGs were mainly enriched in complement and coagulation cascades, cholesterol metabolism, and PPAR signaling pathway, while the downregulated DEGs enriched in ECM-receptor interaction, focal adhesion, and bile secretion (Fig. 3A and 3B).
Table 2.
GO analysis of DEGs between LIHC and CHOL.
| Category | Term | Pathway description | Count in gene set | Adjusted P |
| Upregulated | ||||
| BP term | GO:0008202 | steroid metabolic process | 19 | 4.58E-11 |
| BP term | GO:0009611 | response to wounding | 25 | 2.68E-09 |
| BP term | GO:0016125 | sterol metabolic process | 13 | 1.25E-08 |
| BP term | GO:0008203 | cholesterol metabolic process | 12 | 6.16E-08 |
| BP term | GO:0002526 | acute inflammatory response | 12 | 9.87E-08 |
| BP term | GO:0032101 | regulation of response to external stimulus | 14 | 1.04E-07 |
| BP term | GO:0042060 | wound healing | 14 | 8.55E-07 |
| BP term | GO:0007596 | blood coagulation | 11 | 1.55E-06 |
| BP term | GO:0050817 | coagulation | 11 | 1.55E-06 |
| BP term | GO:0030193 | regulation of blood coagulation | 8 | 1.97E-06 |
| CC term | GO:0005615 | extracellular space | 33 | 1.17E-13 |
| CC term | GO:0005576 | extracellular region | 50 | 2.31E-11 |
| CC term | GO:0044421 | extracellular region part | 33 | 3.88E-10 |
| MF term | GO:0004866 | endopeptidase inhibitor activity | 13 | 8.73E-07 |
| MF term | GO:0004867 | serine-type endopeptidase inhibitor activity | 11 | 7.23E-07 |
| MF term | GO:0030414 | peptidase inhibitor activity | 13 | 5.38E-07 |
| MF term | GO:0004857 | enzyme inhibitor activity | 16 | 4.87E-07 |
| downregulated | ||||
| CC term | GO:0005887 | integral to plasma membrane | 12 | 0.043720371 |
| CC term | GO:0031226 | intrinsic to plasma membrane | 12 | 0.035406774 |
BP = biological process, CC = cellular component, DEGs = differentially expressed genes, GO = Gene Ontology, MF = molecular function.
Figure 3.
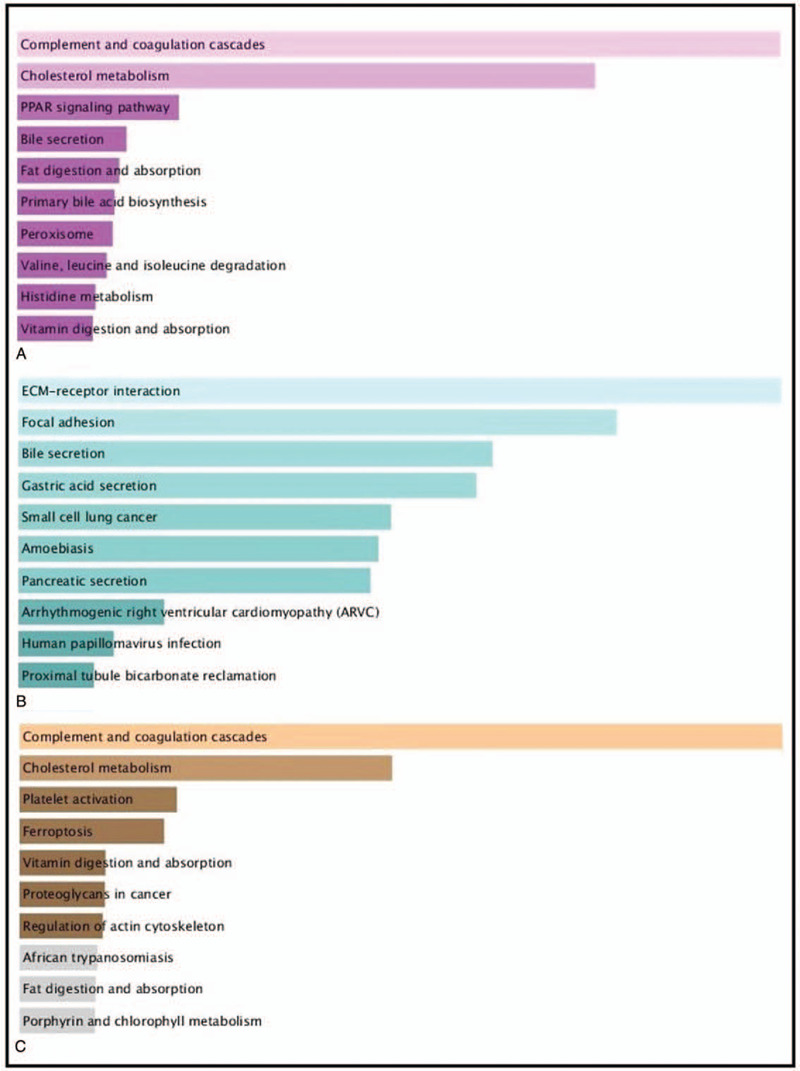
KEGG pathway enrichment analysis between LIHC and CHOL. A KEGG pathway enrichment analysis of upregulated expressed genes between LIHC and CHOL (pink bars). B KEGG pathway enrichment analysis of downregulated expressed genes between LIHC and CHOL (green bars). C KEGG pathway enrichment analysis of DEGs in the most significant module (yellow bars).
3.3. PPI network construction and module analysis
The PPI network of DEGs and the most significant module were predicted by STRING and constructed by Cytoscape (Fig. 2B and Fig. 2C). In the most significant module from PPI network, there are 30 nodes and 369 edges. Functional analysis results of genes in this module indicated that this module was enriched in complement and coagulation cascades, regulation of blood coagulation, acute inflammatory response. (Fig. 3C and Table 3)
Table 3.
GO and KEGG pathway enrichment analysis of DEGs in the most significant module.
| Category | Term | Pathway description | Count in gene set | Adjusted P |
| BP term | GO:0009611 | response to wounding | 16 | 1.06E-11 |
| BP term | GO:0030193 | regulation of blood coagulation | 8 | 2.04E-10 |
| BP term | GO:0050818 | regulation of coagulation | 8 | 3.64E-10 |
| BP term | GO:0032101 | regulation of response to external stimulus | 10 | 3.43E-09 |
| BP term | GO:0042060 | wound healing | 10 | 1.43E-08 |
| BP term | GO:0006953 | acute-phase response | 7 | 1.91E-08 |
| BP term | GO:0030195 | negative regulation of blood coagulation | 6 | 8.61E-08 |
| BP term | GO:0002526 | acute inflammatory response | 8 | 7.76E-08 |
| BP term | GO:0050817 | coagulation | 8 | 9.16E-08 |
| BP term | GO:0007596 | blood coagulation | 8 | 9.16E-08 |
| BP term | GO:0050819 | negative regulation of coagulation | 6 | 1.17E-07 |
| BP term | GO:0007599 | hemostasis | 8 | 1.12E-07 |
| CC term | GO:0005615 | extracellular space | 29 | 5.54E-20 |
| CC term | GO:0005576 | extracellular region | 22 | 1.77E-19 |
| CC term | GO:0044421 | extracellular region part | 22 | 1.29E-16 |
| MF term | GO:0004857 | enzyme inhibitor activity | 14 | 3.38E-13 |
| MF term | GO:0004866 | endopeptidase inhibitor activity | 12 | 2.47E-13 |
| MF term | GO:0030414 | peptidase inhibitor activity | 12 | 2.99E-13 |
| KEGG pathway | hsa04610 | Complement and coagulation cascades | 10 | 4.97E-14 |
BP = biological process, CC = cellular component, DEGs = differentially expressed genes, GO = Gene Ontology, KEGG = Kyoto Encyclopedia of Genes and Genomes, MF = molecular function.
3.4. Hub genes and analysis of hub genes
Using CytoHubba identified hub genes, which satisfied top 10 of PPI network connectivity (Fig. 4). The names and abbreviations of the top 10 genes are shown in Table 4. Subsequently, we use GEPIA to compare the expression of the top 10 hub genes between cholangiocarcinoma /liver hepatocellular carcinoma with normal samples (Fig. 5). Finally, the prognostic value of APOA2 and ITIH2 were evaluated by Kaplan–Meier analysis using GEPIA (Fig. 6 and Fig. 7).
Figure 4.
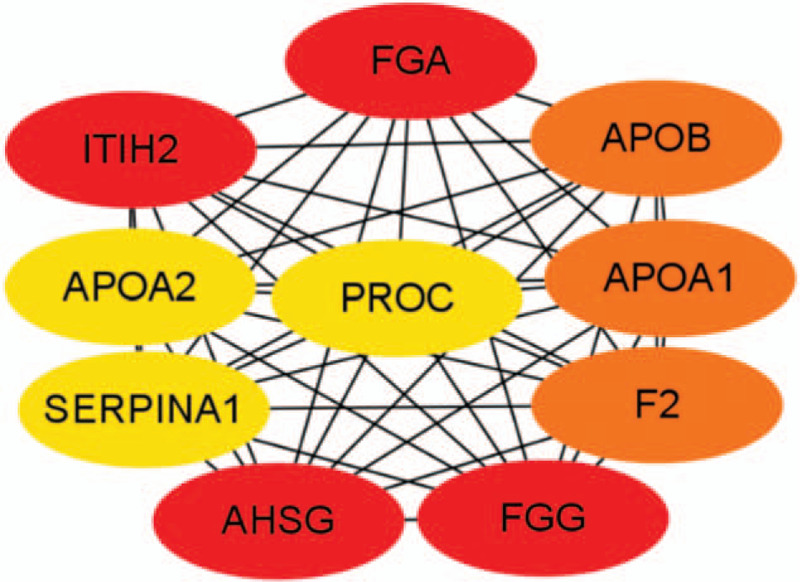
Top 10 hub genes of connectivity in the PPI network.
Table 4.
The description of top 10 hub genes.
| Gene symbol | Gen description | Degree |
| FGA | fibrinogen alpha chain | 29 |
| FGG | fibrinogen gamma chain | 29 |
| ITIH2 | inter-alpha-trypsin inhibitor heavy chain 2 | 29 |
| AHSG | alpha 2-HS glycoprotein | 29 |
| APOA1 | apolipoprotein A1 | 28 |
| APOB | apolipoprotein B | 28 |
| F2 | coagulation factor II | 28 |
| APOA2 | apolipoprotein A2 | 27 |
| PROC | protein C | 27 |
| KNG1 | kininogen 1 | 27 |
Figure 5.
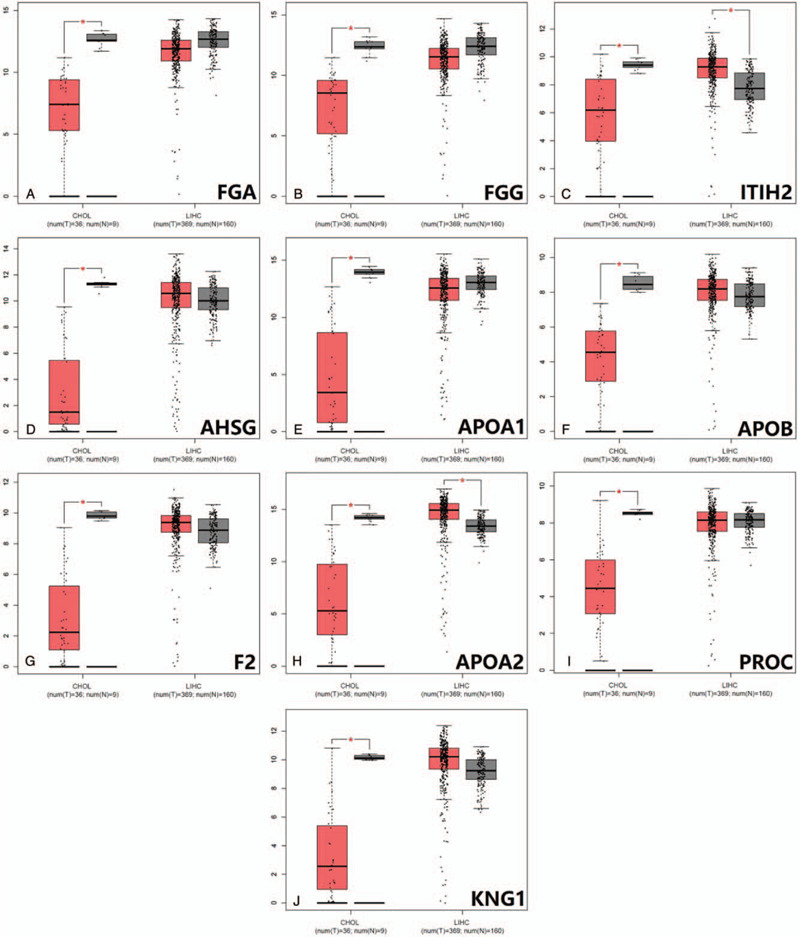
Expression analysis of top 10 hub genes between LIHC/CHOL and corresponding normal tissues by GEPIA. (A)FGA expression between CHOL/LIHC and normal tissues; (B)FGG expression between CHOL/LIHC and normal tissues; (C)ITIH2 expression between CHOL/LIHC and normal tissues; (D)AHSG expression between CHOL/LIHC and normal tissues; (E) APOA1 expression between CHOL/LIHC and normal tissues; (F)APOB expression between CHOL/LIHC and normal tissues; (G)F2 expression between CHOL/LIHC and normal tissues; (H)APOA2 expression between CHOL/LIHC and normal tissues; (I)PROC expression between CHOL/LIHC and normal tissues; (J)KNG1 expression between CHOL/LIHC and normal tissues.(∗P < .05).
Figure 6.
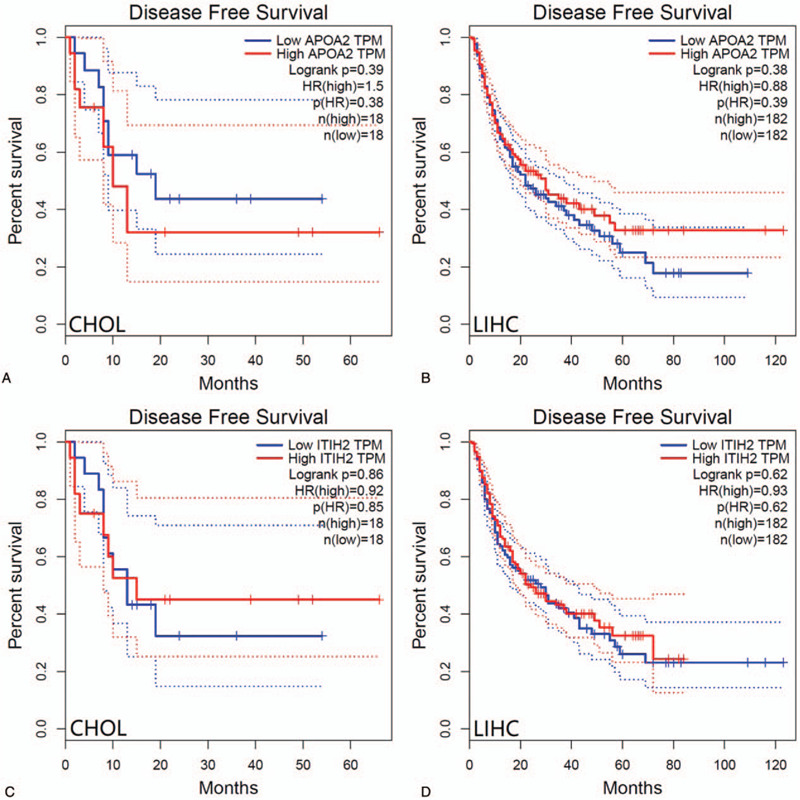
Disease-free survival analysis of CHOL patients and LIHC patients with respect to APOA2 and ITIH2 expression status.
Figure 7.
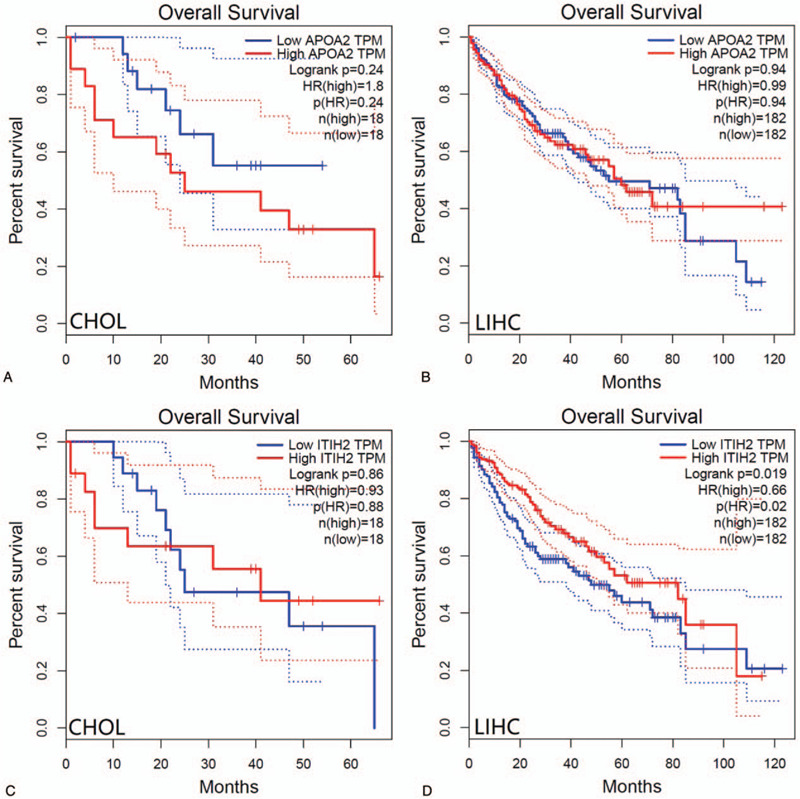
Overall survival analysis of CHOL patients and LIHC patients with respect to APOA2 and ITIH2 expression status.
4. Discussion
Previous studies considered that liver stem cells have bipotential capacity to differentiate into hepatocytes and cholangiocytes. Additionally, the existence of combined hepatocellular-cholangiocarcinoma cases also reinforce liver progenitor cell might be the origin both entities.[5] Therefore, there is some truth to the view that LIHC and CHOL showed partial homology in the tumorigenesis and progression. Microarray technology may help us to understanding the substantial differences in the molecular mechanisms between LIHC and CHOL.
In this study, 3 mRNA microarray datasets of LIHC tissues and CHOL tissues were analyzed to obtain common potential DGEs, containing 123 upregulated genes and 48 downregulated genes. Compared with CHOL, the BP of GO enrichment analyses of LIHC were mainly enriched in steroid metabolic process, response to wounding, acute inflammatory response and coagulation (Table 2). Meanwhile, the pathway of KEGG enrichment analyses showed that the upregulated gene were mainly enriched complement and coagulation cascades, cholesterol metabolism and PPAR signaling pathway, while the downregulated gene were mainly enriched in ECM-receptor interaction, focal adhesion, bile secretion (Fig. 3). Previous studies have indicated complement activation can be regard as a tumor-promoting factor.[17] Moreover, PPAR signaling pathway regulates the expression of various including fatty acid degradation, glycerophospholipid metabolism, which often involved in carcinogenesis, progression, and metabolic state of LIHC.[18,19] The results are consistent with experimental results reported by Chen, whose hypothesis indicated that the aberrant lipid metabolic pathway play a significant role in LIHC, while high serum level of bile acids founded in patients with CHOL.[20–22] From clinicopathological, steatosis as a common finding was detectable in LIHC, while CHOL differentiation is characterized by mucin-producing biliary epithelium forming true glandular structures and surrounding desmoplastic stroma.[23] Additionally, none of the LIHC samples showed intracellular mucin, whereas all of the CHOL showed mucin formation.[24] Extracellular matrix (ECM) is composed of several macromolecules associated in a complex network. Hyaluronic acid (HA) is a major representative of ECM. ECM-receptor interactions lead to a direct or indirect control of cellular activities, which is associated with adhesion, migration, and differentiation.[25] The KEGG enrichment analyses of LIHC indicated significant down-regulation of ECM-receptor interaction and focal adhesion, suggesting less aggressive phenotype than CHOL to some extent. Our finding is consistent with the previous findings that CHOL showed poorer clinical outcome than LIHC.[24,26]
Similarity, through the most significant module, GO enrichment analysis of these up-regulation genes were mainly enriched in response to wounding, acute inflammatory response, and coagulation, while changes in KEGG were mainly enriched in complement and coagulation cascades, compared to that of CHOL. The results may have possibly related with etiology. Risk factors for LIHC are condition of continuous liver injure and chronic inflammation. In the PPI network constructed by STRING and Cytoscape, the upregulated top 10 hub genes of distinction between LIHC and CHOL were identified, including FGA, FGG, ITIH2, AHSG, APOA1, APOB, F2, APOA2, PROC, KNG1. However, only the expression of ITIH2 and APOA2 were able to distinguish between LIHC and CHOL significantly (Fig. 5).
ITIH2, as inter-alpha-trypsin inhibitor heavy chain 2, is one of heavy chain in the inter-alpha-trypsin inhibitors (ITI), which are a family of plasma protease inhibitors. The family of heavy chains contained 5 genes: ITIH1, ITIH2, ITIH3, ITIH4, and ITIH5.[27] Of these, ITIH2 and ITIH5 are arranged on chromosome 10p15.[25,27] In vitro experiment, ITIH1 and ITIH3 overexpression increased cell attachment and induced decrease of metastasis number.[28] Similarly, Himmelfarb founded that normal breast epithelial cells clearly express ITIH5, while the expression of ITIH5 is consistently lost or strongly downregulated in invasive breast cancer.[29] Moreover, patients with abundant ITIH5 expression had a better clinical outcome, compared to those with reduced expression in invasive node-negative breast cancer.[30] These results clearly indicated that the ITI family may contribute to carcinogenesis via deregulated gene expression. Because ITIH2 and ITIH5 are located on chromosome 10p15, their strong correlation indicated that these molecules interact in their tumor-suppressive and metastasis-repressive properties. The overall survival analysis of LIHC patients with respect to expression status of ITIH2 is relatively consistent with the previous study (Fig. 7D). Hamm et al had reported that ITIH2 gene is predominantly expressed in the liver tissues, Meanwhile, downregulation of ITIH2 expression was seen in 70% of breast cancers, 71% of lung cancers, and 70% of renal tumors.[25] The lower expression of ITIH2 in CHOL patients concur with these of several previous studies (Fig. 5C). As for the aspects of ITIH2 expression in LIHC, patients with highly expression of ITIH2 would have a better overall survival (P = .019). However, the findings of ITIH2 expression in LIHC patients is higher than that of normal group, which seem to conflict with those of previous research. It is probably worth to do further research on this subject.
Apolipoprotein A2 (APOA2), encoded by the APOA2 gene, is the second-most major apolipoprotein of the high-density lipoprotein cholesterol. APOA2 is part of the apolipoprotein superfamily including apolipoprotein A, apolipoprotein C and apolipoprotein E families.[31] Studies supported APOA2 has been associated with lipid-related diseases through modulating triglyceride, cholesterol transport, and glucose metabolism.[32,33] Previously published clinical studies suggested that APOA2 has been associated with various types of cancer. APOA2 levels are decreased in pancreatic and metastatic renal cell cancer.[34,35] Plasma APOA2 could improve an efficiency of detection of pancreatic cancer.[36] However, the elevated level of APOA2 and APOA1 urinary protein play a significant role in early detection of urinary bladder cancer.[37] In our study, APOA2 was significantly decreased in CHOL subgroups, whereas it was significantly increased in LIHC subgroups (Fig. 5H). When it comes to the prognosis, no significant correlation was detected between APOA2 and prognosis of LIHC and CHOL.
We were not able to demonstrate a statistically significant association between APOA2 expression in LIHC and reduced overall survival or shorter disease-free survival in Kaplan–Meier analysis, and neither did CHOL (Fig. 6 and Fig. 7). However, there was statistically significant correlation between lower expression of ITIH2 in LIHC and reduced overall survival.
5. Conclusion
By using bioinformatic analysis, the present study was designed to identify DEGs that may be distinguish LIHC and CHOL. A total of 171 DEGs and 10 hub genes may be regarded as biomarkers. Especially, ITIH2 and APOA2 were 2 potential key genes, which may induce to differentiate into LIHC rather than CHOL. Furthermore, the higher expression status of ITIH2 in LIHC patients is associated with favorable overall survival. Our results may provide new insights of molecular mechanisms regarding LIHC and CHOL, however, further experimental studies are still need to elucidate the biological function.
Author contributions
Formal analysis: Jing Wang.
Investigation: Xindan Kang.
Resources: Li Bai.
Software: Xiaoguang Qi, Jing Wang.
Supervision: Li Bai.
Visualization: Li Bai.
Writing – original draft: Xindan Kang.
Writing – review & editing: Xindan Kang.
Footnotes
Abbreviations: APOA1 = apolipoprotein A1, APOA2 = apolipoprotein A2, BP = biological process, CC = cellular component, CHOL = cholangiocarcinoma, DEGs = differentially expressed genes, GEO = Gene Expression Omnibus, GO = Gene Ontology, GTEx = Genotype-Tissue Expression, HA = hyaluronic acid, ITI = inter-alpha-trypsin inhibitors, KEGG = Kyoto Encyclopedia of Genes and Genomes, LIHC = liver hepatocellular carcinoma, MCODE = Molecular Complex Detection, MF = molecular function, PPI = protein-protein interaction network, TCGA = the Cancer Genome Atlas.
How to cite this article: Kang X, Bai L, QI X, Wang J. Screening and identification of key genes between liver hepatocellular carcinoma (LIHC) and cholangiocarcinoma (CHOL) by bioinformatic analysis. Medicine. 2020;99:50(e23563).
The authors report no conflicts of interest in this work.
This project was supported by National Key Research and Development (R&D) Program of China (Grant No. 2016YFC1303602).
Data sharing not applicable to this article as no datasets were generated or analyzed during the current study.
References
- [1].Bridgewater J, Galle PR, Khan SA, et al. Guidelines for the diagnosis and management of intrahepatic cholangiocarcinoma. J Hepatol 2014;60:1268–89. [DOI] [PubMed] [Google Scholar]
- [2].Sekiya S, Atsushi S. Intrahepatic cholangiocarcinoma can arise from Notch-mediated conversion of hepatocytes. J Clin Invest 2012;122:3914–8. [DOI] [PMC free article] [PubMed] [Google Scholar]
- [3].Fan B, Malato Y, Calvisi DF, et al. Cholangiocarcinomas can originate from hepatocytes in mice. J Clin Invest 2012;12:2911–5. [DOI] [PMC free article] [PubMed] [Google Scholar]
- [4].Seok JY, Na DC, Woo HG, et al. A fibrous stromal component in hepatocellular carcinoma reveals a cholangiocarcinoma-like gene expression trait and epithelial-mesenchymal transition. Hepatology 2012;55:1776–86. [DOI] [PubMed] [Google Scholar]
- [5].Brunt E, Aishima S, Clavien PA, et al. cHCC-CCA: Consensus terminology for primary liver carcinomas with both hepatocytic and cholangiocytic differentiation. Hepatology 2018;68:113–26. [DOI] [PMC free article] [PubMed] [Google Scholar]
- [6].Farshidfar F, Zheng S, Gingras MC, et al. Integrative genomic analysis of cholangiocarcinoma identifies distinct IDH-mutant molecular profiles. Cell Rep 2017;18:2780–94. [DOI] [PMC free article] [PubMed] [Google Scholar]
- [7].Khan SA, Toledano MB, Taylor-Robinson SD. Epidemiology, risk factors, and pathogenesis of cholangiocarcinoma. Hpb 2008;10:77–82. [DOI] [PMC free article] [PubMed] [Google Scholar]
- [8].Fu BS, Zhang T, Li H, et al. The role of liver transplantation for intrahepatic cholangiocarcinoma: a single-center experience. Eur Surg Res 2011;47:218–21. [DOI] [PubMed] [Google Scholar]
- [9].Llovet JM, Ricci S, Mazzaferro V, et al. Sorafenib in advanced hepatocellular carcinoma. NEngl J Med 2008;359:378–90. [DOI] [PubMed] [Google Scholar]
- [10].Kudo M, Finn RS, Qin S, et al. Lenvatinib versus sorafenib in first-line treatment of patients with unresectable hepatocellular carcinoma: a randomised phase 3 non-inferiority trial. Lancet 2018;391:1163–73. [DOI] [PubMed] [Google Scholar]
- [11].Cheng A-L, et al. IMbrave150: efficacy and safety results from a ph III study evaluating atezolizumab (atezo)+ bevacizumab (bev) vs sorafenib (Sor) as first treatment (tx) for patients (pts) with unresectable hepatocellular carcinoma (HCC). Ann Oncol 2019;30:ix186–7. [Google Scholar]
- [12].Weigt J, Malfertheiner P. Cisplatin plus gemcitabine versus gemcitabine for biliary tract cancer. NEngl J Med 2010;362:1273–81. [DOI] [PubMed] [Google Scholar]
- [13].Lovén J, Orlando DA, Sigova AA, et al. Revisiting global gene expression analysis. Cell 2012;151:476–82. [DOI] [PMC free article] [PubMed] [Google Scholar]
- [14].Edgar R, Barrett T. NCBI GEO standards and services for microarray data. Nat Biotechnol 2006;24:1471–2. [DOI] [PMC free article] [PubMed] [Google Scholar]
- [15].Lou W, Liu J, Ding B, et al. Five miRNAs-mediated PIEZO2 downregulation, accompanied with activation of Hedgehog signaling pathway, predicts poor prognosis of breast cancer. Aging (Albany NY) 2019;11:2628. [DOI] [PMC free article] [PubMed] [Google Scholar]
- [16].Tang Z, Li C, Kang B, et al. GEPIA: a web server for cancer and normal gene expression profiling and interactive analyses. Nucleic Acids Res 2017;45(W1):W98–102. [DOI] [PMC free article] [PubMed] [Google Scholar]
- [17].Markiewski MM, Lambris JD. Unwelcome complement. Cancer Res 2009;69:6367–70. [DOI] [PMC free article] [PubMed] [Google Scholar]
- [18].Chen HX, Jiang YY, Li MY, et al. Role of PPAR pathway in atrial fibrillation associated with heart valvular disease: transcriptomics and proteomics in the human atrial tissue. FASEB J 2020;34(S1):1–1. [DOI] [PMC free article] [PubMed] [Google Scholar]
- [19].Wagner N, Wagner KD. PPAR Beta/Delta and the Hallmarks of Cancer. Cells 2020;9:1133. [DOI] [PMC free article] [PubMed] [Google Scholar]
- [20].Chen S, Yin P, Zhao X, et al. Serum lipid profiling of patients with chronic hepatitis B, cirrhosis, and hepatocellular carcinoma by ultra-fast LC/IT-TOF MS. Electrophoresis 2013;34:2848–56. [PubMed] [Google Scholar]
- [21].Sombattheera S, Proungvitaya T, Limpaiboon T, et al. Total serum bile acid as a potential marker for the diagnosis of cholangiocarcinoma without jaundice. Asian Pac J Cancer Prev 2015;16:1367–70. [DOI] [PubMed] [Google Scholar]
- [22].Banales JM, Iñarrairaegui M, Arbelaiz A, et al. Serum metabolites as diagnostic biomarkers for cholangiocarcinoma, hepatocellular carcinoma, and primary sclerosing cholangitis. Hepatology 2019;70:547–62. [DOI] [PMC free article] [PubMed] [Google Scholar]
- [23].Stavraka, Chara, Hannah Rush, et al. Combined hepatocellular cholangiocarcinoma (cHCC-CC): an update of genetics, molecular biology, and therapeutic interventions. J Hepatocellular Carcinoma 2019;6:11. [DOI] [PMC free article] [PubMed] [Google Scholar]
- [24].Xue R, Chen L, Zhang C, et al. Genomic and transcriptomic profiling of combined hepatocellular and intrahepatic cholangiocarcinoma reveals distinct molecular subtypes. Cancer Cell 2019;35:932–47. [DOI] [PMC free article] [PubMed] [Google Scholar]
- [25].Bost F, Diarra-Mehrpour M, Martin JP. Inter-(-trypsin inhibitor proteoglycan family: A group of proteins binding and stabilizing the extracellular matrix. Eur J Biochem 1998;252:339–46. [DOI] [PubMed] [Google Scholar]
- [26].Yoon YI, Hwang S, Lee YJ, et al. Postresection outcomes of combined hepatocellular carcinoma-cholangiocarcinoma, hepatocellular carcinoma and intrahepatic cholangiocarcinoma. J Gastrointest Surg 2016;20:411–20. [DOI] [PubMed] [Google Scholar]
- [27].Hamm A, Veeck J, Bektas N, et al. Frequent expression loss of Inter-alpha-trypsin inhibitor heavy chain (ITIH) genes in multiple human solid tumors: a systematic expression analysis. BMC Cancer 2008;8:25. [DOI] [PMC free article] [PubMed] [Google Scholar]
- [28].Paris S, Sesboüé R, Delpech B, et al. Inhibition of tumor growth and metastatic spreading by overexpression of inter-alpha-trypsin inhibitor family chains. Int J Cancer 2002;97:615–20. [DOI] [PubMed] [Google Scholar]
- [29].Himmelfarb M, Klopocki E, Grube S, et al. ITIH5, a novel member of the inter-(-trypsin inhibitor heavy chain family is downregulated in breast cancer. Cancer Lett 2004;204:69–77. [DOI] [PubMed] [Google Scholar]
- [30].Veeck J, Chorovicer M, Naami A, et al. The extracellular matrix protein ITIH5 is a novel prognostic marker in invasive node-negative breast cancer and its aberrant expression is caused by promoter hypermethylation. Oncogene 2008;27:865–76. [DOI] [PubMed] [Google Scholar]
- [31].Boughanem H, Bandera-Merchán B, Hernández-Alonso P, et al. Association between the APOA2 rs3813627 single nucleotide polymorphism and HDL and APOA1 levels through BMI. Biomedicines 2020;8:44. [DOI] [PMC free article] [PubMed] [Google Scholar]
- [32].Chan DC, Ng TW, Watts GF. Apolipoprotein A-II: evaluating its significance in dyslipidaemia, insulin resistance, and atherosclerosis. Ann Med 2012;44:313–24. [DOI] [PubMed] [Google Scholar]
- [33].Bandarian F, Daneshpour MS, Hedayati M, et al. Identification of sequence variation in the Apolipoprotein A2 Gene and Their relationship with serum high-density lipoprotein cholesterol levels. Iran Biomed J 2016;20:84. [DOI] [PMC free article] [PubMed] [Google Scholar]
- [34].Ehmann M, Felix K, Hartmann D, et al. Identification of potential markers for the detection of pancreatic cancer through comparative serum protein expression profiling. Pancreas 2007;34:205–14. [DOI] [PubMed] [Google Scholar]
- [35].Vermaat JS, van der Tweel I, Mehra N, et al. Two-protein signature of novel serological markers apolipoprotein-A2 and serum amyloid alpha predicts prognosis in patients with metastatic renal cell cancer and improves the currently used prognostic survival models. Ann Oncol 2010;21:1472–81. [DOI] [PubMed] [Google Scholar]
- [36].Sato Y, Kobayashi T, Nishiumi S, et al. 746P Usefulness of the first screening using apolipoprotein A2 isoforms as the enrichment strategy for pancreatic cancer and its risk diseases. Ann Oncol 2018;29: suppl 8: mdy282-129. [Google Scholar]
- [37].Salem H, Ellakwa DES, Fouad H, et al. APOA1 AND APOA2 proteins as prognostic markers for early detection of urinary bladder cancer. Gene Rep 2019;16:100463. [DOI] [PubMed] [Google Scholar]


