

ABSTRACT
Emergency departments (EDs) provide medical treatment for a broad spectrum of illnesses and injuries to patients who arrive at all hours of the day. The quality and efficient delivery of health care in EDs are associated with a number of factors, such as patient overall length of stay (LOS) and admission, prompt ambulance diversion, quick and accurate triage, nurse and physician assessment, diagnostic and laboratory services, consultations and treatment. One of the most important ways to plan the healthcare delivery efficiently is to make forecasts of ED processes. The aim this study is thus to provide an exhaustive review for ED stakeholders interested in applying forecasting methods to their ED processes. A categorisation, analysis and interpretation of 102 papers is performed for review. This exhaustive review provides an insight for researchers and practitioners about forecasting in EDs in terms of showing current state and potential areas for future attempts.
KEYWORDS: Statistical forecasting, emergency departments, review
1. Introduction
Time is a crucial factor that provokes serious problems in the performance of EDs. Time related metrics in ED operations make it possible to measure, monitor, and analyse ED performance in a meaningful way. Patient arrivals, overall LOS and admission, prompt offloading of ambulance patients, quick and accurate triage, nurse and physician assessment, diagnostic and laboratory services, consultations and treatment are common and important processes of an ED care (Eitel, Rudkin, Malvehy, Killeen, & Pines, 2010; Gul & Guneri, 2015a; Wargon, Guidet, Hoang, & Hejblum, 2009). Overcrowding and long waiting times in ED processes have been common complaints for recent years. Both have impacts on the quality of ED patient care (Annual Report of the Office of the Auditor General of Ontario, 2010). Effective fulfilment of these processes has the potential to enhance ED throughput and patient satisfaction. Delays within these time related processes may exacerbate the overcrowding in the EDs. So, it becomes important to forecast and know the time metrics in terms of avoiding the delays. Statistical forecasting is considered as an OR method that uses time series data and a variety of statistical formulae and data mining techniques to forecast different types of ED processes. The development of forecasting models on ED processes indicates a need for planning more accurately, even if overcrowding is widely linked to other hospital units and outer world (Wargon et al., 2009). Therefore, we present an exhaustive review and analysis on forecasting models and applications of ED processes. We aim to contribute to the ED stakeholders interested in applying forecasting methods in their facility.
The objective of this paper is to review the statistical forecasting models designed to improve ED processes. We do not deal with other departments of the hospitals such as outpatient clinic, radiology clinic, mammography clinic, intensive care unit, and operation room within the scope of this review. Our paper aims to present forecasting methods including regression, time series, data mining and some miscellaneous OR methods for ED stakeholders to help them in planning the processes efficiently and improving service quality. Our ultimate goal is to provide ED stakeholders a guide for statistical forecasting concepts that can be practically applied to various ED processes.
In Wargon et al. (2009), models for forecasting ED visits have been dealt as a systematic review by discussing the limitations and pointing advantages of nine identified studies. This study seems to be the only review for ED patient visits forecasting. Unfortunately, no systematic and exhaustive review has been provided that covers other various forecasting themes for EDs excluding ED patient visits such as ED admission, crowding, LOS and waiting times. Therefore, in this paper, we review the literature related to the ED forecasting models using academic databases of PubMed, Web of Science, Scopus and Google Scholar. A total of 102 papers were reviewed ranged from 2001 to 2017. Our contributions to the knowledge are as follows: (1) to estimate and classify the ED forecasting themes, (2) to reveal forecasting methods used (regression, time series, data mining) that have further applied to mentioned themes, (3) to show the distribution of databases, journals and countries in which the papers are published, (4) to determine how the trend of these papers will continue in the future, (5) to show what data type and performance measures used, and (6) to foresee what open themes in ED processes can be for future work.
The study is structured as follows: Section 2 details material and article identification and selection methodology. Section 3 provides classification of papers in terms of applied forecasting themes. Section 4 offers a comprehensive summary of the review outcomes, graphical representations, and an overall assessment on existing themes, main challenges and open areas. Finally, Section 5 presents conclusion, limitations, and recommendations.
2. Material and method
2.1. Article identification and selection
We put together papers in notable databases that provide important insights to researchers and practitioners studying forecasting of ED processes. To this end, we followed an article identification and selection process as shown in Figure 1.
Figure 1.
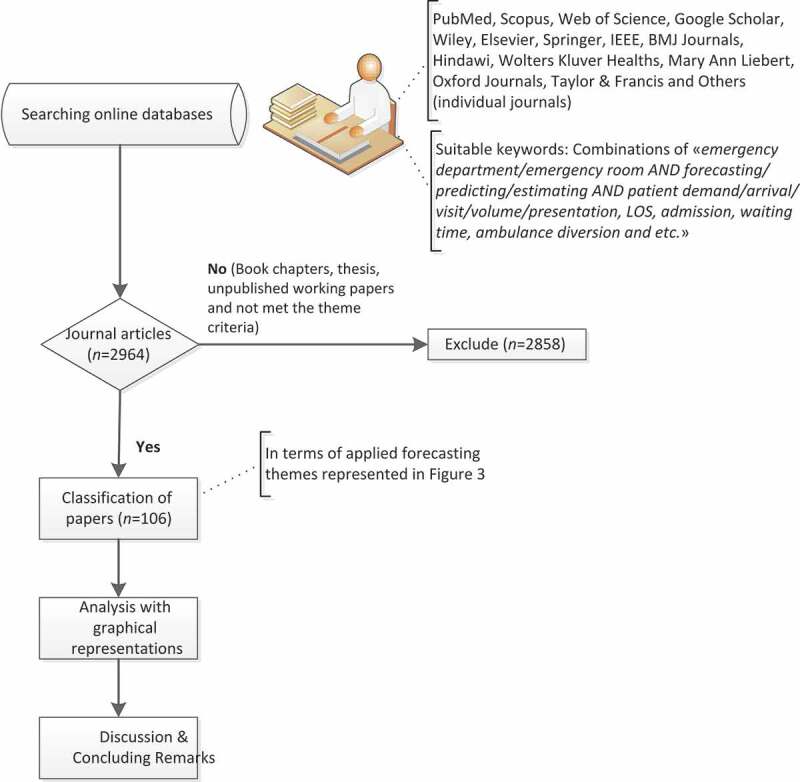
Article identification and selection process flow chart
First, we collect relevant papers from significant databases with suitable keywords (emergency department/emergency room AND forecasting/predicting/estimating AND patient demand/arrival/visit/volume/presentation, LOS, admission, waiting time, ambulance diversion, etc.). In this way, we conducted an extensive search in the title, abstract, and keywords of scholarly papers.
In the review process, the following main library databases cover most of the papers, namely: PubMed, Scopus, Web of Science, Google Scholar, Wiley, Elsevier, Springer, IEEE, BMJ Journals, Hindawi, Wolters Kluver Healths, Mary Ann Liebert, Oxford Journals, and Taylor & Francis. While some IEEE based conference proceedings were included, book chapters, thesis, and unpublished working papers were excluded from the review. The papers were analysed, classified, and recorded on an Excel sheet using the following dimensions, namely:
Year: year of publication
Database: title of database which the paper published in
Journal: title of journal in which the paper published
Country: country where the study was being conducted (in general, country of the first author is considered)
Application theme: applied forecasting themes are ED patient demand (in other words ED arrivals, visits, volume, presentations), ED patient admission, ED LOS, ED crowding, utilisation of ED resources, ED patient waiting time, ambulance diversion, inpatient admissions, and others
Specific objective: short purpose of the study in a few words including applied area or methods used
Method(s) used for forecasting: list of applied methods – as listed in Table 1 – classified under seven groups as time series, regression, data mining, regression + data mining, regression + time series, regression + time series + data mining and others (Markov chain, CUSUM & EWMA control charts, simulation, overcrowding scales such as NEDOCS, EDWIN and READI, queuing theory, principle component analysis, etc.)
Data characteristics and data type (if the theme is related to ED patient demand): description of data collected and used for the study in terms of quantity and time period. Data type refers to the information whether the data is hourly, daily, monthly or annually
Performance measures: They show the accuracy of the forecasting model reviewed
Table 1.
Acronyms used in the paper
| ACF | Auto-correlation function |
| ANN | Artificial neural network |
| ARIMA | Autoregressive integrated moving average |
| ARMA | Autoregressive moving average |
| CCMU | Clinical emergency department classification |
| CUSUM | Cumulative sum of the recursive residuals |
| EDWIN | Emergency department work index |
| ES | Exponential smoothing |
| EWMA | Exponentially weighted moving average |
| GARCH | Generalised autoregressive conditional heteroskedasticity |
| GEMSA | Multicentre emergency department study group |
| LR | Linear regression |
| MAE | Mean absolute error |
| MAPE | Mean absolute percentage error |
| MASE | Mean absolute scaled error |
| MSARIMA | Multivariate seasonal autoregressive integrated moving average |
| NEDOCS | National emergency department overcrowding scale |
| PACF | Partial auto-correlation function |
| PCA | Principle component analysis |
| READI | Real-time emergency analysis of demand indicators |
| RMSE | Root mean square error |
| ROC | Receiver operating characteristic curve |
| SARIMA | Seasonal autoregressive integrated moving average |
| SMHW | Seasonal multiplicative Holt-Winters |
| SVM | Support vector machine |
| WMAPE | Weighted mean absolute percentage error |
| r | Correlation coefficient |
Second, a classification is carried out in terms of applied forecasting themes. Finally, we analyse the papers in terms of statistical results for distribution of the papers and concluding remarks for the future studies.
3. Applied forecasting theme
The emergency care system is one of the most important components of the larger health care delivery system and of the even larger social safety net system (Committee on the Future of Emergency Care in the United States Health System, 2006). To better manage patient flow of this system, there are many operations management methodologies that could be applied including quality function deployment, failure-mode and effects analysis, human factors engineering, queuing theory, supply-chain management, statistical quality control, and forecasting. As a crucial tool among these, forecasting facilitates the understanding of ED systems and make it possible for ED managers to control and improve overall system performance. A usual conceptual ED patient flow diagram is demonstrated in Figure 2. From arrival at an ED to hospital admit or disposition, emergency care patients receive treatment at multiple points along the delivery process. Patient flow, defined as the movement of patients through this system, has many important indicators in terms of timeliness, safety, and quality of care such as ED patient throughput (the number of patients treated and discharged from the ED per day), ED LOS (the length of time a patient spends in the ED, beginning at the point when the patient sees a triage nurse and ending when the patient leaves the ED), utilisation of ED resources and ED patient wait time. Input/Throughput/Output (I/T/O) model of ED patient flow in Figure 2 allows for the identification of themes on forecasting of ED processes. Input component of the I/T/O model includes ED forecasting themes of patient demand of critically ill and injured patients, non-emergent and safety net patients. Also, forecasting of ambulance diversion is related to this component of the model. The throughput component of the I/T/O model demonstrates LOS in the ED and is comprised on triage, room placement, medical evaluation, diagnostic testing and ED treatment. ED boarding of inpatients is also featured in the throughput component. Also, forecasting of ED patient wait time in the abovementioned processes is related to the throughput component. The output component of the I/T/O model represents the disposition of ED patients. It includes both hospital admission, transfer to another facility, and patient discharge.
Figure 2.
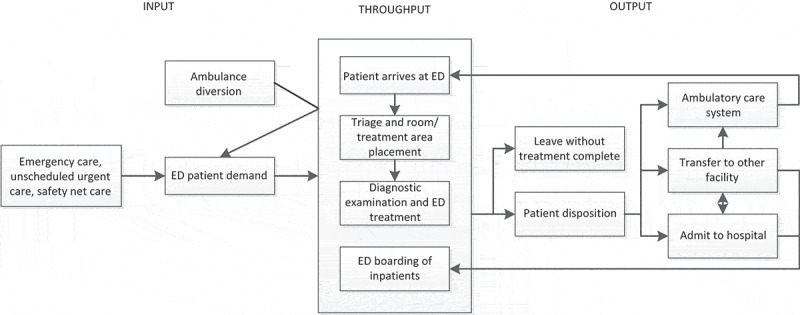
Input/Throughput/Output model of ED patient flow (Adapted from Committee on the Future of Emergency Care in the United States Health System, 2006)
In this section, 102 papers are presented according to 9 main application themes as presented in Figure 3. The themes are:(1) ED patient demand/arrivals/visits/volume/presentations, (2) ED patient admission, (3) ED LOS, (4) ED crowding, (5) utilisation of ED resources, (6) ED patient wait time, (7) ambulance diversion, (8) inpatient admissions, and (9) others such as anomaly detection, posttraumatic stress disorder forecasting, triage forecasting, communication risks prediction, charge prediction, patient disposition prediction, 90-day mortality prediction, and forecasting of blood product transfusion requirements of trauma patients.
Figure 3.
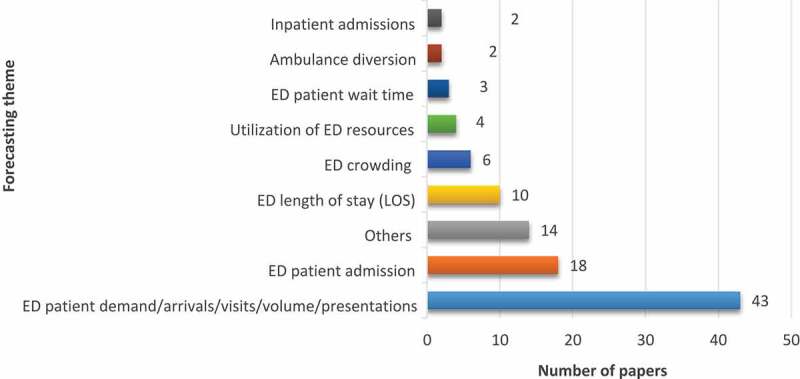
Distribution of papers according to forecasting theme for the EDs
3.1. Forecasting ED patient demand
The service quality through the EDs, expressed by waiting time and LOS, is significantly related to the patient demand (Au-Yeung, Harder, McCoy, & Knottenbelt, 2009; Xu, Wong, & Chin, 2013). Increased patient arrivals may lead to prolonged waiting and overcrowding. In order to enhance ED processes, a better balance between ED resources (doctors, nurses, beds, medical equipment, etc.) and demand (patient arrivals) is required. Accurate forecasting of ED patient demand can provide managerial implications on long- and short-term staffing policies so that the EDs can be better prepared for the coming demand variations (Xu et al., 2013; Yucesan, Gul, & Celik, 2018a; Yucesan, Gul, Mete, & Celik, 2018b). Regarding the theme of ED patient demand forecasting, 41 studies were retrieved. A detailed summary of papers regarding this theme was listed in Table 2. In the papers retrieved by our study, three main classes of methods were used to forecast ED patient demand.
Table 2.
Summary of papers in terms of forecasting ED patient demand
| Authors (Year) | Method(s) used | Specific objective | Data characteristics | Data type | Performance measures |
|---|---|---|---|---|---|
| Rosychuk, Youngson, and Rowe (2016) | SARIMA | To forecast monthly rates of ED presentations with chronic obstructive pulmonary disease | Individual aged ≥ 55 years patients’ data from April 1999 to March 2011 | Monthly | Standard error, 95% confidence interval |
| Xu, Tsui, Jiang, and Guo (2016) | ARIMA, LR | To develop a hybrid ARIMA–LR approach | Two-year daily data from 1 January 2012 to 31 December 2013 | Daily | RMSE, MAPE |
| Butler, Gu, Kenney, and Campbell (2016) | ACF, PACF, SARIMA | To use a time-series approach to assess whether current day and previous day is correlated | From January 2010 to May 2015 | Weekly | p value |
| Afilal et al. (2016a) | ARIMA, CCMU, GEMSA | To forecast daily attendance at an ED using time series-based approach | January 2010 and 31 December 2014 | Daily | RMSE |
| Calegari et al. (2016) | ES, SMHW, SARIMA, MSARIMA | To analyse the performance of forecasting models in predicting the demand for medical care | 1 January 2013 until 31 May 2015 | Daily | MAPE |
| Afilal et al. (2016b) | ARMA | To study the daily arrivals at an ED in France | 1 January 2010–31 December 2014 | Daily | RMSE |
| Gul and Guneri (2016) | Regression, ANN | To forecast ED arrivals for short, medium and long term considering calendar and ED specific variables | 266,693 patient records between the dates 1 January and 31 December in 2012 | Daily, Monthly, Yearly | Standard error, R-squared |
| Rosychuk, Youngson, and Rowe (2015) | SARIMA | To forecast monthly patterns of asthma presentations to EDs in Alberta, Canada | 362,430 ED presentations from April 1999 to March 2011 | Monthly | Standard error, 95% confidence interval |
| Mai, Aboagye‐Sarfo, Sanfilippo, Preen, and Fatovich (2015) | ARIMA, multivariate vector-ARIMA |
To predict the number of ED presentations in Western Australia in the next 5 years, stratified by place of treatment, age, triage and disposition | Monthly ED data from 2006/7 to 2012/13 financial years | Monthly | 95% confidence interval |
| Aboagye-Sarfo et al. (2015) | ARMA, Holt-Winters | To develop multivariate vector-ARMA models for predicting ED demand in Western Australia (WA) and compare them to ARMA and Winters’ models | Seven-year monthly data (2006/07 to 2012/13) | Monthly | MAE, RMSE, MAPE |
| Petrou (2015) | ARIMA | To propose an ARIMA model to analyse official data from Cyprus’ largest emergency room facility for three years | 369,970 visits from January 2011 to December 2013 | Monthly | R-squared, MAPE |
| Harrou, Sun, Kadri, Chaabane, and Tahon (2015) | ARMA, EWMA | To report the development of statistical method for enhancing detection of abnormal daily patient arrivals at the ED | From January 2011 to December 2011 | Daily | R-squared |
| Zlotnik, Gallardo-Antolin, Alfaro, Pérez, and Martínez (2015) | Support vector regression | To apply SVM to forecast patient visit and allocate dynamic nursing staff | January 2006–December 2007 | Daily | MAE |
| Kang and Park (2015) | Statistical analysis, histogram | To evaluate ED patient visit variability in order to determine if the average can be used to operate EDs | The year 2013 | Daily | |
| Aroua and Abdul-Nour (2015) | LR, SARIMA, multivariate SARIMA | To explore the capability of forecasting techniques to predict ED visits based on Major Diagnostic Categories | The years 2008−2011 | Weekly | MAE, MAPE, WMAPE |
| Ekström, Kurland, Farrokhnia, Castrén, and Nordberg (2015) | LR analysis | To investigate whether Web site visits could be used to predict the ED attendance for the coming day | From 13 August 2011 to 31 October 2012 | Hourly | R-squared |
| Araz, Bentley, and Muelleman (2014) | SARIMA, Holt-Winters, LR | To forecast influenza-like–illness (ILI)-related ED visits | Weekly ED visits between 2008 and 2012 | Weekly | RMSE |
| Kadri, Harrou, Chaabane, and Tahon (2014) | ARIMA | To develop models for forecasting daily attendances at a paediatric ED in France | Daily patient data from January 2012 to December 2012 | Daily | RMSE, R-squared |
| Kim, Lee et al. (2014) | ARIMA, SARIMA, GARCH | To evaluate the predictability of patient volume in hospital medicine using a variety of known forecasting techniques | Patient volume data from January 2009 to June 2012 | Daily, Hourly | MAPE |
| Bergs, Heerinckx, and Verelst (2014) | Automated ES | To evaluate an automatic forecasting algorithm in order to predict the number of monthly ED visits | A 6-year period data (2005–2011) | Monthly | MAE, MAPE, MASE |
| Menke et al. (2014) | ANN | To design an ANN and to test it retrospectively to determine if it may be used to predict ED volume | Patient registry data from 4 February 2007 to 31 December 2009 | Daily | R-squared |
| Xu et al. (2013) | ANN, regression | To model ED daily patient arrivals and to quantify the relative importance of contributing variables | One year of data of patient arrivals | Daily | MAPE |
| Marcilio, Hajat, and Gouveia (2013) | Generalised linear models, generalised estimating equations, SARIMA | To develop different models to forecast the daily number of ED patients according to calendar variables and ambient temperature readings | 1 January 2008 to 31 December 2010 | Daily | MAPE |
| Cote, Smith, Eitel, & Akçali (2013) | Regression analysis | To apply regression-based forecasting models based on data obtained from a large teaching hospital’s ED | 1997–2006 | Daily, Monthly, Yearly | R-squared |
| Chase, Cohn, Peterson, and Lavieri (2012) | Binary logistic regression |
To investigate whether ED variables could be used in mathematical models to predict a future surge in ED volume based on recent levels of use of physician capacity | Information spanning July 2009 through June 2010 | Hourly | CUR |
| Rosychuk, Klassen, Voaklander, Senthilselvan, and Rowe (2011) | SARIMA | To examine the monthly patterns of young children who made croup-related visits to EDs in Canada | 27,355 croup-related ED visits data from 1 April 1999 to 30 March 2005 | Monthly | standard error, 95% confidence interval |
| Boyle et al. (2011) | CUSUM | To predict and track epidemics (and, potentially, pandemics) of influenza | 5 years of historical data (2005–2009) on ED presentations and hospital admissions for influenza-like illnesses | Daily | MAPE |
| Kam, Sung, and Park (2010) | SARIMA | To develop and evaluate time series models to predict the daily number of patients visiting the ED of a Korean hospital | 2 years of data from January 2007 to December 2008 | Daily | MAPE |
| Wargon, Casalino, and Guidet (2010) | General linear model | To investigate whether mathematical models using calendar variables could identify the determinants of ED census over time in geographically close EDs | From 2004 to 2007 | Daily | MAPE |
| Au-Yeung et al. (2009) | Structural time series | To forecast daily patient arrivals into an ED based on previous arrivals data | 4 years of patient arrival data between 1 April 2002 and 31 March 2007 | Daily | RMSE, r, 95% confidence interval |
| Jones et al. (2009) | ES, ARIMA | To study the temporal relationships between the demands for key resources in the ED and the inpatient hospital and to develop multivariate forecasting models | One-year hourly data from three diverse hospitals | Hourly | MAE |
| Sun, Heng, Seow, and Seow (2009) | ARIMA | To forecast ED attendances for micro and macro level planning | Daily data from July 2005 to March 2008 | Daily | MAPE |
| McCarthy et al. (2008) | Poisson regression | To develop methodology for predicting demand for ED services by characterising ED arrivals | One-year hourly ED arrival data | Hourly | 95% confidence interval |
| Schonwetter et al. (2008) | Logistic regression | To devise a model to predict the probability of hospice cardiac disease patients having ED visits and/or hospitalisations after hospice admission | 65 patients | Standard error, Wald statistic | |
| Jones et al. (2008) | Regression, Time series, ANN | To explore and evaluate the use of several statistical forecasting methods to predict daily ED patient volumes at three diverse hospital EDs | Daily data from 1 January 2005 through 31 March 2007 from three EDs | Daily | MAPE |
| Park, Park, and Desai (2008) | Regression | To predict the number of patients arriving at ED and establish a forecasting model of number of ED patient arrivals | From 1 January 2005 to 30 September 2007 | Monthly | R-squared |
| Champion et al. (2007) | ES, Box–Jenkins | To propose ES and Box–Jenkins methods for forecasting of ED crowding | Seven-year monthly data (2000 to 2005) | Monthly | RMSE |
| Zibners, Bonsu, Hayes, and Cohen (2006) | Box-Jenkins ARIMA | To predict the volume of patient visits to an academic paediatric ED based on short interval local weather patterns | 76,702 records | R-squared | |
| Morzuch and Allen (2006) | Regression-based, ARIMA, ES | To forecast hourly arrivals for each day using standard Holt-Winters ES methods | 11 November 1999 to 28 June 2002 | Hourly | RMSE |
| Jones, Joy, and Pearson (2002) | ARIMA, GARCH | To develop a methodology for forecasting the number of beds occupied due to emergency admissions and the number of emergency admissions | From 1 April 1993 to 23 March 1999 | Daily | RMSE |
| Batal, Tench, McMillan, Adams, and Mehler (2001) | Stepwise LR | To develop a prediction equation for the number of patients seeking urgent care | Daily patient volume from February 1998 to January 1999 | Daily | 95% confidence interval |
| Jiang, Chin, and Tsui (2018) | ANN, Genetic algorithm, SARIMA, ARIMAX, Linear regression, SVM | To explore an integrated framework for predicting ED patient flow under different triage levels | A total of 245,377 records from 1 July 2009 to 31 March 2011 | Daily | MAPE, RMSE |
| Juang, Huang, Huang, Cheng, and Wann (2017) | ARIMA | To construct an adequate model and to forecast monthly ED visits | From January 2009 to December 2016 | Monthly | MAPE |
The first class consists of regression-based forecasting models. They may be classified as linear, logistics and Poisson and consists of looking for correlations between patient demand and a series of independent variables, such as calendar or meteorological variables. The second class is time series-based forecasting models that view patient demand as a time series and predict future values from past values (Wargon et al., 2009). The last class is concerned with data mining-based forecasting models. Within the context of this class, ANNs, SVM, decision trees, and Bayesian networks can be mentioned.
Among the retrieved papers, many variants of regression models exist as linear (Araz et al., 2014; Aroua & Abdul-Nour, 2015; Batal et al., 2001; Cote et al., 2013; Ekström et al., 2015; Gul & Guneri, 2016; Jiang et al., 2018; Jones et al., 2008; Park et al., 2008; Xu et al., 2016, 2013), logistic (Chase et al., 2012; Schonwetter et al., 2008) and Poisson (McCarthy et al., 2008). The dependent variable in LR models which are used in ED patient demand forecasting is the number of patients arriving per time period. The independent variables or input variables can be day of the week, month of the year, temperature, etc.
In a logistic regression model, the dependent variable is categorical. Logistic regression is divided into two classes as binomial/binary and ordinal/multinomial. Binomial or binary logistic regression deals with situations in which the observed outcome for a dependent variable can have only two possible types (Schonwetter et al., 2008), “0” and “1” (e.g., “no emergency room visits and/or hospitalisations (ERVH)” vs. “yes ERVH”). Multinomial logistic regression deals with situations where the outcome can have three or more possible types (e.g., “disease A” vs. “disease B” vs. “disease C”) that are not ordered.
Poisson regression models are based on the assumption that the events in one time period are independent of the events in another time period (McCarthy et al., 2008). It is used to model count data and contingency tables. In McCarthy et al. (2008), a Poisson regression model was proposed to predict ED patient demand. One year of ED visit data were merged with local climate data. Poisson regression was selected to represent the count of hourly ED arrivals as a function of temporal, climatic, and patient factors. The appropriateness of prediction models by whether the data met key Poisson assumptions were evaluated. On conclusion of the study, patient demand of the observed ED was well approximated by the proposed Poisson regression model. It was shown that the expected arrival rate was characterised by a small number of factors and did not depend on recent number of arrivals.
Apart from regression-based models, several authors or investigators proposed time series methods to forecast ED patient demand (Tandberg & Qualls, 1994). Wargon et al. (2009) pointed out that time series models in forecasting of ED patient demand focus on the net result of three components: (1) long-term trends; (2) short-term and often seasonal changes; and (3) the effects of unexpected events. The simplicity and effectiveness, and attractiveness for practical applications are main advantages of time series models (Kadri et al., 2014). Time series forecasting models are classified under two main classes as univariate and multivariate. In the knowledge of ED patient demand forecasting, various time series models were applied. ARIMA model is the most widely used time series method proposed by Jones et al. (2002), Morzuch and Allen (2006), Zibners et al. (2006), Jones et al. (2008), Jones et al. (2009), Sun et al. (2009), Kadri et al. (2014), Kim, Lee et al. (2014), Petrou (2015), Afilal et al. (2016a), Xu et al. (2016) and Juang et al. (2017). ARIMA models were demonstrated as (p, d, q) where p is the number of AR terms, d is the number of non-seasonal differences needed for stationarity, and q is the number of lagged forecast errors in the prediction equation (Xu et al., 2016).
A number of variations on the ARIMA models are commonly employed by researchers such as ARMA (Afilal et al. 2016b; Aboagye-Sarfo et al., 2015; Harrou et al., 2015), SARIMA (Araz et al., 2014; Aroua & Abdul-Nour, 2015; Butler et al., 2016; Kam et al., 2010; Kim, Lee et al. 2014; Marcilio et al., 2013; Rosychuk et al., 2011; Rosychuk et al., 2015; Rosychuk et al., 2016), MSARIMA (Aroua & Abdul-Nour, 2015), multivariate vector-ARIMA (Mai et al., 2015), Box-Jenkins ARIMA (Champion et al., 2007; Zibners et al., 2006).
ES is also one of the most important time series method applied mostly by researchers in the field of ED patient demand forecasting. This method is based on weighted moving average formulae (Champion et al., 2007). Among the retrieved studies in our review, Morzuch and Allen (2006), Champion et al. (2007), Jones et al. (2009), Araz et al. (2014), Bergs et al. (2014), Aboagye-Sarfo et al. (2015) and Calegari et al. (2016) used and successfully applied ES method to their data regarding ED patient arrivals.
The data mining-based models applied in the reviewed studies cover ANN, SVM, decision tree, and Naïve Bayes. ANNs are machine learning algorithms that work to solve computational processes in specific areas by using many interconnected processing elements (Onat & Gul, 2018). They are mainly applied for prediction, clustering, classification, and detection of abnormal patterns in healthcare domain and specifically in ED processes. SVM is a machine learning technique that can be widely used for regression analysis and classification in different research areas of EDs. Unlike traditional methods that aim to minimise the training error, SVM aims to minimise an upper bound of generalisation error by maximising the margin between the separating hyperplane and the data which can be considered as an approximate application of the structure risk minimisation principle (Salah, 2017). Decision trees are non-parametric learning algorithm which can be applied to both regression and classification problems of EDs. Given data variable, decision trees implement a set of if – then – else rules to predict class variable. Naïve Bayes assumes that each variable is independent of other variables. Bayes theorem is used in this learning method to calculate the probability of a certain class given a certain variable.
The above-mentioned data mining-based models are used to forecast patient demand in the context of ED operations. ANNs are frequently applied to forecasting ED patient arrivals (Gul & Guneri, 2016; Jones et al., 2008; Menke et al., 2014; Xu et al., 2013). Zlotnik et al. (2015) applied support vector regression and M5P tree model to forecast patient visit and allocate dynamic nursing staff for an ED system. On conclusion of the current study, these models were found to be superior to the stratified average model with a 95% confidence interval.
Unlike abovementioned methods used in forecasting of ED patient demand, Boyle et al. (2011) predicted and tracked epidemics of influenza with an adaptive CUSUM methodology. This analysis pointed out the value of health departments performing surveillance monitoring to forewarn of disease outbreaks. Au-Yeung et al. (2009) forecasted daily patient arrivals into an ED based on previous arrivals data. They proposed a structural time series model to characterise each arrival stream. On conclusion of the current study, it was clearly seen that this model assisted ED managers at the observed hospital to best use the resources available and anticipate periods of high demand.
3.2. Forecasting ED patient admission
The second most important theme among forecasting concepts is ED admission process. Optimal utilisation of the ED includes the timely evaluation, management, and stabilisation of all patients. Boarding of admitted patients in the ED leads to lower service quality, reduced timeliness of care, and reduced patient satisfaction. The ED should not be utilised as an extension of the intensive care units and other inpatient units for admitted patients, because this unfavourably affects patient safety, quality, and access to care (American College of Emergency Physicians, 2008). Because of all these reasons, ED admission process has been addressed by researchers in the literature (Table 3). Golmohammadi (2016) developed a prediction model capable of estimating the likelihood of admission of each ED patient to the hospital (as inpatient) using logistic regression and ANN methods. On conclusion of the study, it was proved that an ED admission forecasting model based on demographic and clinical variables accurately estimated the likelihood of patient admission, thus decreased ED boarding and crowding. As in Sun, Heng, Tay, and Seow (2011), Peck et al. (2013) and Golmohammadi (2016) applied logistic regression in their forecasting models. Peck et al. (2013) tested the generalisability for predicting the probabilities that ED patients will be admitted to a hospital inpatient unit. Results of the accuracy of ED patient admission likelihood prediction models showed that they were generalisable across hospitals of different sizes, populations, and administrative structures. Sun et al. (2011) developed a predictive model to assess whether a patient was likely to require inpatient admission at the time of ED triage.
Table 3.
Summary of papers in terms of forecasting ED admission
| Authors (Year) | Method(s) used | Specific objective | Data characteristics | Performance measures |
|---|---|---|---|---|
| Golmohammadi (2016) | Logistic regression, ANN | To predict hospital admissions in order to reduce ED boarding | 15,050 visits data from January 2012 to August 2012 | MSE, r, MAE |
| Luo, Stone, Johnson, and Nkoy (2016) | SVM, ANN, decision tree | To develop a predictive model to guide appropriate hospital admission for ED patients with bronchiolitis | 26,701 bronchiolitis patients’ data | ROC |
| Meng et al. (2015) | ANN | To predict the emergency admission of elderly stroke patients in Shanghai by using a multilayer perceptron (MLP) neural network | Patients (> 60 years) with first-ever stroke registered from January 2012 to June 2014 | Validity |
| Azari, Janeja, and Levin (2013) | Decision tree | To predict ED admissions to reduce boarding and LOS | 120,000 visits from ED over a 24 months’ period | Accuracy, precision, recall |
| Peck et al. (2013) | Logistic regression | To test the generalisability of a previously developed method for predicting the probabilities that ED patients will be admitted to a hospital inpatient unit | 2007, 2010–2012 | R-squared |
| Boyle et al. (2012) | ARIMA, regression, ES |
To develop and validate models to predict ED presentations and hospital admissions for time and day of the year | 5 years’ retrospective analysis (1 July 2002–30 June 2007) | MAPE |
| Sun et al. (2011) | Logistic regression | To develop and validate a predictive model to assess whether a patient is likely to require inpatient admission at the time of ED triage | Patient visits at the ED from January 2007 to December 2008 | 95% confidence interval, ROC |
| Boyle et al. (2008) | LR | To forecast patient admission data using regression | 5 years of ED admissions data (1/7/02–30/6/07) from two hospitals | R-squared, MAPE |
| Andersson, Andersson, Ohlsson, and Nilsson (2011) | ANN, Logistic regression | To construct and validate an ANN model for early prediction of the severity of acute pancreatitis | Acute pancreatitis patient data from 2002 to 2005 (n = 139) and from 2007 to 2009 (n = 69) | ROC |
| Barak-Corren, Fine, and Reis (2017) | Logistic regression, Naive Bayes | To develop a model for early prediction of hospitalisations | From 1 July 2014 to 30 June 2015 | ROC |
| Dent, Weiland, Vallender, and Oettel (2007) | Binomial logistic regression | To determine the accuracy of predictions of the need for hospital admission | Between 11 July and 27 October 2004 | Odds ratios and likelihood ratios |
| Kim, Li et al. (2014) | Logistic regression | To determine the importance of certain factors in predicting the need of hospital admission for a patient in the ED | Between January 2010 and March 2012 | ROC |
| Leegon, Jones, Lanaghan, and Aronsky (2005) | Bayesian Network | To predict hospital admission for ED patients using a Bayesian Network | Between 4/10/04 and 6/30/04 | ROC |
| Leegon, Jones, Lanaghan, and Aronsky (2006) | ANN | To predict hospital admission for ED patients using ANN | 3077 paediatric ED encounters’ data |
ROC |
| Lucke et al. (2018) | Multivariable logistic regression | To develop models that predict hospital admission to ED of patients younger and older than 70 and compare their performance | 10,807 patients’ data | ROC |
| Moriña, Puig, Ríos, Vilella, and Trilla (2011) | Two-order integer valued autoregressive time series | To model the number of hospital admissions per week caused by influenza | From January 2004 to December 2007 | N/A |
| Ng et al. (2016) | Multiple logistic regression | To identify risk factors for predicting the subsequent hospitalisation of non-urgent emergency patients | 2 months data from January 2013 to December 2013 | ROC |
| Zhang et al. (2017) | Logistic regression, ANN |
To describe and compare logistic regression and ANN strategies to predict hospital admission or transfer following initial presentation to ED triage with and without the addition of natural language processing element | 47,200 patients’ data | ROC |
Data mining-based methods such as ANN (Andersson et al., 2011; Leegon et al., 2006; Luo et al., 2016; Meng et al., 2015; Zhang et al., 2017), SVM (Luo et al., 2016), Bayesian networks (Barak-Corren et al., 2017; Leegon et al., 2005), decision trees (Azari et al., 2013; Luo et al., 2016), and time series-based methods such as ES and ARIMA (Boyle et al., 2012; Moriña et al., 2011) were also applied to forecast ED admission process. On the other hand, while Boyle et al. (2008) forecast patient admission data using LR analysis, logistic regression is studied by many scholars (Andersson et al., 2011; Barak-Corren et al., 2017; Dent et al., 2007; Kim, Li et al. 2014; Lucke et al., 2018; Ng et al., 2016; Zhang et al., 2017).
3.3. Forecasting ED LOS
LOS, in another name patient throughput time, is described as the length of time that passes from the patient’s time of arrival at the ED until time of discharge or transfer to another department of the hospital. Starting from patient arrivals at the EDs it becomes important have to be known the overall LOS in terms of efficient resource allocation (Gul & Guneri, 2015b). For this purpose, forecasting of LOS for the EDs has gained importance through the knowledge and studied by many researchers. We have retrieved seven papers regarding ED LOS forecasting in our review. Table 4 shows a summary of these papers in terms of method(s) used, specific objective(s), data characteristics, and performance measures.
Table 4.
Summary of papers in terms of forecasting ED LOS
| Authors (Year) | Method(s) used | Specific objective | Data characteristics | Performance measures |
|---|---|---|---|---|
| Chaou et al. (2017) | Accelerated failure time model | To identify and quantify the influence of different patient-related or diagnostic activities-related factors on the ED LOS of discharged patients | 106,206 patients’ data | 95% confidence interval |
| Launay, Rivière, Kabeshova, and Beauchet (2015) | ANN | To forecast prolonged LOS in older patients hospitalised in acute care wards after an ED visit | 1254 participants’ data in the year 2012 | Sensitivity, specificity, positive predictive value, negative predictive value, likelihood ratios, ROC |
| Gul and Guneri (2015b) | ANN | To present an ED LOS forecasting model using ANNs | October and November 2010 | r, absolute error |
| Azari, Janeja, and Levin (2015) | Logistic regression models | To present a framework that predicts patients with prolonged ED stays (> 14 h) from data available at triage | 1 May 2011 and 1 June 2013 | p value |
| Combes, Kadri, and Chaabane (2014) | LR | To identify the factors (variables) characterising the LOS in EDs in order to propose models to predict the LOS | 2498 patients’ data (period January–June, 2012) | Standard error |
| Benbelkacem, Kadri, Chaabane, and Atmani (2014) | Naïve Bayes, BayesNet, SVM, Decision trees | To present an approach based on supervised classification methods in order to predict the patient LOS at the paediatric emergency department | 6135 patients’ data between three months (January–March 2012) | Accuracy, precision, recall, kappa statistic, ROC |
| Hachesu, Ahmadi, Alizadeh, and Sadoughi (2013) | Decision tree, SVM, ANN | To predict LOS of heart patients | 4,948 patients’ data who had suffered coronary artery disease | accuracy, specificity, sensitivity |
| Gill et al. (2018) | Gradient boosting machine | To predict ED fast track patients who stayed longer than 4 h in the ED | 1 July 2014 and 30 June 2015 | ROC |
| Wrenn, Jones, Lanaghan, Congdon, and Aronsky (2005) | ANN | To estimate patient’s LOS in the ED with an ANN | 9729 consecutive patients’ data (4/1/04–6/30/04) | ROC |
| Zhu, Luo, Zhang, and Shen (2018) | Coxian phase-type distributions | To model of respiratory patients in ED using coxian phase-type distributions with covariates | 894 respiratory diseases patients’ data in the year 2014 |
Standard error |
In ED LOS forecasting, data mining-based methods are used more compared to regression and time series-based methods. Chaou et al. (2017) predicted LOS among patients discharged from an ED in Taiwan using an accelerated failure time model. They identified and quantified the causing variables on the ED LOS in the current study. On conclusion, it was proved that the forecasted ED LOS might be useful for ED stakeholders to better anticipate an individual’s LOS and to help the administrative level plan its staffing policy. Azari et al. (2015) and Combes et al. (2014) used logistic and LR in their forecasting models. ANN was mostly preferred by researchers in ED LOS forecasting (Gul & Guneri, 2015b; Hachesu et al., 2013; Launay et al., 2015; Wrenn et al., 2005). Launay et al. (2015) forecasted prolonged LOS in older patients hospitalised in acute care wards after an ED visit. Gul and Guneri (2015b) proposed two ANN-based models by a base model that includes all variables and an alternative model that takes into consider all the variables except variables with weak or medium correlation on LOS. Hachesu et al. (2013) forecasted the LOS of heart patients using ANN, SVM and decision tree. In their proposed model, LOS was the target variable, and 36 input variables were used for prediction. All three algorithms were able to predict LOS with various degrees of accuracy. The findings demonstrated that the SVM was the best fit. Benbelkacem et al. (2014) presented an approach based on supervised classification methods in order to predict the patient LOS at a paediatric emergency department. Results of the study indicated that BayesNet and Naïve Bayes provided the best results. However, decision tree methods obtained comparable results and could successfully be suitable for the prediction of ED patient’s LOS. Zhu et al. (2018) proposed a Coxian phase-type distribution model with covariates as an alternative method for ED LOS. The models were applied to 894 respiratory diseases patients’ data in the year 2014 from ED of a Chinese public tertiary hospital. Results of the study show that ED LOS data can be modelled by the Coxian phase-type distribution model. Distributions of ED LOS differ significantly with respect to patients’ gender, arrival mode, and treatment area. Using the fitted Coxian PH model assists ED stakeholders in identifying patients who are most likely to have an extreme ED LOS and in predicting the forthcoming workload for resources. Gill et al. (2018) determined the relative importance and estimated marginal effects of patient and system-related variables in predicting ED fast track patients who stayed longer than 4 h in the ED.
3.4. Forecasting ED crowding
ED crowding threatens service quality and access to care (Hoot et al., 2009). Therefore, accurate forecasting of ED crowding can provide stakeholders to handle this problem. ED crowding causes many troubles such as delayed treatment, patient leaves without seen by a doctor, prolonged transport and waiting, increased mortality, and financial losses (Hoot et al., 2008, 2009; Zhang et al., 2013). Papers in the literature forecasted ED crowding using ED crowding measures such as NEDOCS, EDWIN, READI, and statistical methods, simulation, and Markov chain. The formula for each of these three ED crowding measures considers various patient, ED, and hospital information, and yields a numerical value that indicates whether an ED is running smoothly, is crowded but effective, or is overcrowded at a given point in time (Ahalt, Argon, Ziya, Strickler, & Mehrotra, 2018). The NEDOCS score is based on a linear regression model which is computed using the ratio of total numbers of ED patients and beds, the ratio of the numbers of “hold” and inpatient beds, the most recent waiting time for an ED bed, the longest current boarding time, and the number of ED patients on a ventilator. The EDWIN is an algebraically simple, clinically sensible measure of ED busyness and crowding. It exhibits face and content validity and, at one institution, was associated with nurse and physician assessment of ED crowding and initiation of diversion and weakly associated with quality-of-care measures (Bernstein, Verghese, Leung, Lunney, & Perez, 2003). It is based on a weighted sum of the number of patients from all five triage categories present in the ED, the total ED capacity as a product of the number of attending physicians and the total number of available beds (excluding the “hold” beds). The READI is calculated using the bed ratio, the provider ratio and the acuity ratio (Ahalt et al., 2018). Table 5 presents a summary of papers in terms of forecasting ED crowding.
Table 5.
Summary of papers in terms of forecasting ED crowding
| Authors (Year) | Method(s) used | Specific objective | Data characteristics | Performance measures |
|---|---|---|---|---|
| Skinner (2016) | Dixon Forecasting Model, Bed Ratio, NEDOCS | To assess the development, use, and implementation of a predictive two-hour forecasting tool for ED overcrowding. | From June 17 until June 30 2015 | r |
| Skinner and Higbea (2015) | Dixon Forecasting Model, Bed Ratio, NEDOCS | To study used the Dixon Forecasting Model (DFM), a Bed Ratio (BR), and the NEDOCS to establish a reliable 2 h overcrowding forecasting tool within the ED | 17 June until 30 June 2015 | Standard error |
| Hoot, Zhou, Jones, and Aronsky (2007) | EDWIN, NEDOCS, READI, Work Score | To monitor current and near-future ED crowding by using 4 measures | An 8-week period data (21 June 2006–16 August 2006) | Positive likelihood ratio, negative likelihood ratio, negative predictive value, positive predictive value, specificity |
| Zhang et al. (2013) | Markov chain model | To suggest a patient flow network for supporting Markov chain model that forecasts ED patient flow rule | N/A | N/A |
| Hoot et al. (2008) | Simulation | To design and implement the discrete event simulation that uses patient flow to predict near-future ED operational measures | 2006 | r |
| Hoot et al. (2009) | Simulation | To implement and validate the previously developed Forecast ED discrete event simulation for real-time forecasting of emergency department crowding | (5/1/07–8/1/07) | R-squared |
3.5. Other forecasting papers for ED processes
This “Others” section includes forecasting themes about utilisation of ED resources, ED patient waiting time, ambulance diversion, inpatient admissions, and some miscellaneous applications such as anomaly detection, posttraumatic stress disorder forecasting, triage forecasting, communication risks prediction, charge prediction, discharge disposition prediction, and 90-day mortality prediction and forecasting of blood product transfusion requirements of trauma patients. Table 6 represents an overall summary of papers in terms of these mentioned forecasting themes. Sprivulis (2003), Stout and Tawney (2005), Schweigler et al. (2009) and Burns, Chernyak, and Scheinfeld (2016) focused on utilisation of ED resources. Burns et al. (2016) identified weather and calendar variables in order to forecast daily ED imaging volume to aid appropriate scheduling of imaging resources for efficient ED function.
Table 6.
Summary of papers in terms of other forecasting themes
| Authors (Year) | Method(s) used | Forecast theme | Specific objective | Data characteristics | Performance measures |
|---|---|---|---|---|---|
| Kadri, Harrou, Chaabane, Sun, and Tahon (2016) | SARMA | Anomaly detection | To use SARMA as a modelling framework and EWMA for anomaly detection | From November 2011 to March 2012 | R-squared, MAPE |
| Burns et al. (2016) | Student’s t tests and chi-squared tests | Utilisation of ED resources | To identify weather and calendar factors that would enable prediction of daily ED imaging volume | From 1 January 2011 through 31 December 2013 | p value |
| Bagnasco, Siri, Aleo, Rocco, and Sasso (2015) | ANN | Communication risks | To describe the utility of ANN in predicting communication risks in the ED | March–May 2011 by observing 840 nurses’ interactions | MSE |
| Galatzer-Levy, Karstoft, Statnikov, and Shalev (2014) | SVM | Post-traumatic stress disorder forecasting | To forecast posttraumatic stress disorder from early trauma responses | 957 participants | ROC |
| Lin, Patrick, and Labeau (2014) | Queuing theory | ED patient wait time | To employ queuing theory to estimate the average waiting time across patients as well as the necessary ED and IU resources | Fiscal year 2011/2012 | |
| Peck, Benneyan, Nightingale, and Gaehde (2012) | Expert opinion, naive Bayes, logit-linear regression |
Inpatient admissions | To evaluate models that use information gathered during triage to predict, in real time, the number of ED patients who subsequently will be admitted to a hospital inpatient unit | Data between 22 September 2010 and 26 November 2010 | ROC, R-squared |
| Wiler, Bolandifar, Griffey, Poirier, and Olsen (2013) | Queuing theory | ED patient wait time | To derive and validate a model that predicts the effect of various patient crowding scenarios on patient left without being seen rates | 87,705 visits in calendar year 2008 | 95% confidence interval |
| Wang (2013) | PCA and SVM | Triage prediction | To combine PCA and SVM to analyse anomaly detection | 109,360 patient visits in 2010 | MAPE |
| Abraham, Byrnes, and Bain (2009) | ARIMA, SARIMA | Inpatient admissions | To develop daily emergency inpatient admissions and occupancy | 10 April 2004–25 March 2007 | RMSE, MAPE |
| Au et al. (2009) | Continuous-time Markov chain | Ambulance diversion | To predict the onset of ambulance bypass | 199,480 records between 1 January 2001 and 18 April 2005 | Goodness-of-fit test |
| Schweigler et al. (2009) | SARIMA | Utilisation of ED resources | To generate accurate short-term forecasts of ED bed occupancy | ED bed occupancy data from July 2005 through June 2006 | RMSE |
| Bennett, Moore, and Probst (2007) | LR | Charge | To develop a national estimate of uncompensated care from patients utilising the ED in rural hospitals | From 1999 to 2000 | p value |
| Epstein and Tian (2006) | Logistic regression | Ambulance diversion | To develop a real-time instrument that might accurately predict the need for ambulance diversion | 46,164 patient visits from 1 January 2003 to 31 December 2003 | ROC |
| Stout and Tawney (2005) | Queuing theory | Utilisation of ED resources | To develop Excel spreadsheet model that is a dynamic, visual illustration of how variation in individual process times can affect total process capability | N/A | |
| Walczak (2005) | ANN | Blood product transfusion requirements of trauma patients | To evaluate the efficacy of ANNs to predict the transfusion requirements of trauma patients using readily available information | 1016 patient records | MAE |
| Ding et al. (2010) | Quantile regression | ED patient wait time | To characterise service completion times by patient, clinical, temporal, and crowding factors for different phases of emergency care using quantile regression | 1-year visit data | p value |
| Sprivulis (2003) | Retrospective analysis | Utilisation of ED resources | To estimate the number of, and costs associated with, low acuity presentations to an ED | 24 December 1999–21 June 2000 | 95% confidence interval |
| Bradman, Borland, and Pascoe (2014) | Logistic regression | ED patient disposition | To predict patient disposition in a paediatric ED | A total of 1223 patients data | ROC |
| Derose, Gabayan, Chiu, Yiu, and Sun (2014) | Regression analysis | ED patient wait time | To assess patient transit times and ED system crowding measures based on their associations with outcomes | 136,740 patients’ data from January 2008 to December 2010 | First and fourth quartiles |
| Goto, Maeda, and Goto (2013) | Decision tree | Outcomes after out-of-hospital cardiac arrest | To develop a simple and generally applicable bedside model for predicting outcomes after cardiac arrest | 390,226 adult patients’ data for 2005 through 2009 | Survival probability |
| Hofman et al. (2016) | Cox regression analyses |
90-day mortality | To predict 90-day mortality in older patients after discharge from an ED | The year of 2012 | Hazard ratio |
| Keogh, Culliford, Guerrero-Ludueña, and Monks (2018) | Univariate and multivariate linear regression analysis | ED 4-hour target performance and cancelled elective operations | To explore ED 4-hour target performance and cancelled elective operations |
142 patients’ data between 2012 and 2016 | R-squared |
| Leegon, Hoot, Aronsky, and Storkey (2007) | Gaussian process | Ambulance diversion | To predict ambulance diversion in an adult ED using a Gaussian process | 1 March 2005–30 November 2005 data | ROC |
| Liu et al. (2014) | Random forest algorithm | Adverse cardiac events | To predict adverse cardiac events in ED patients with chest pain using machine learning for variable selection | A total of 702 chest pain patients | ROC |
| Riordan et al. (2017) | Logistic regression | Patient discharge disposition |
To derive and validate a model capable of predicting patient discharge disposition using variables present on arrival to the ED for ESI 3 patients | Nearly 50,000 patients’ data | ROC |
Schweigler et al. (2009) studied to generate accurate short-term forecasts of ED bed occupancy using time series models. Both a sinusoidal model with AR-structured error term and a seasonal ARIMA model were found to robustly forecast ED bed occupancy 4 and 12 h in advance at three different EDs.
Another studied forecasting theme for EDs is waiting time. Waiting times are considered as performance measures and monitored to find delays in the service. Few researchers proposed models in order to forecast ED patient waiting time. Lin et al. (2014) applied queuing theory to estimate the average waiting time across patients as well as the necessary ED and IU resources. Similarly, Wiler et al. (2013) used queuing theory to derive and validate a model that predicts the effect of various patient crowding scenarios on patient left without being seen rates. Ding et al. (2010) characterised service completion times (waiting room times, treatment times and boarding times) by patient, clinical, temporal, and crowding factors for different phases of emergency care using quantile regression.
Peck et al. (2012) and Abraham et al. (2009) studied forecasting of inpatient admissions. Peck et al. (2012) proposed models that use information gathered during triage to predict, in real time, the number of ED patients who subsequently will be admitted to a hospital inpatient unit using expert opinion, naive Bayes, logit-LR. Abraham et al. (2009) focused on daily emergency inpatient admissions and occupancy using time series models.
One of the major concerns that EDs faced is ambulance diversion (or bypass). It is described as diversion of ambulances to other hospitals except in urgent cases where the ED is judged to be so busy. Ambulance diversion theme was investigated by three researchers (Au et al., 2009; Epstein & Tian, 2006; Leegon et al., 2007). Epstein and Tian (2006) developed a logistic regression model that might accurately predict the need for ambulance diversion. Leegon et al. (2007) evaluated the accuracy of a Gaussian process for prediction of ambulance diversion. Au et al. (2009) studied prediction of the onset of ambulance diversion using continuous-time Markov chain model.
4. Analysis and results
This section presents distribution of papers by the following points of view: (1) forecasting themes, (2) methods used to forecast ED processes, (3) data characteristics and type used for forecasting of ED processes and (4) study objectives and performance measures, (5) publication trend, (6) published journal, database, and country of origin.
4.1. Themes and methods used to forecast ED processes
Regarding the forecasting themes, “ED patient demand” constitutes nearly a half of the total papers. About 42% of total papers (n = 43) are concentrated in this application theme (Table 7). Another most studied application themes are “ED patient admission,” “ED LOS,” and “ED crowding” by 18% (n = 18), 10% (n = 10), and 6% (n = 6) of total papers. “Utilisation of ED resources,” “ED patient wait time,” “inpatient admissions,” and “ambulance diversion” are probably in the most delicate disciplines.
Table 7.
Summary of forecasting methods used for each application themes
| Forecasting theme for the EDs | DM | TS | Reg | Reg+ DM | Reg+ TS | Reg+ TS+ DM | Oth | Total |
|---|---|---|---|---|---|---|---|---|
| ED patient demand | 1 | 23 | 7 | 3 | 4 | 2 | 3 | 43 |
| ED length of stay (LOS) | 7 | 1 | 2 | 10 | ||||
| Inpatient admissions | 1 | 1 | 2 | |||||
| Utilisation of ED resources | 1 | 3 | 4 | |||||
| Ambulance diversion | 1 | 2 | 3 | |||||
| ED crowding | 6 | 6 | ||||||
| ED patient admission | 5 | 1 | 7 | 4 | 1 | 18 | ||
| ED patient wait time | 1 | 2 | 3 | |||||
| Others | 6 | 1 | 6 | 13 | ||||
| Total | 19 | 28 | 24 | 8 | 5 | 2 | 16 | 102 |
DM: Data mining, Reg: Regression, TS: Time series, Oth: Others.
From the summary of forecasting methods used for each application themes, the following important findings can be extracted: (1) the time series-based models play a dominant role among all methods with a rate of 27% (n = 28/102). The most widely applied modelling approach among all application themes is time series in ED patient demand area. (2) Regression, time series and data mining-based hybrid approaches are the least applied among all application themes. This hybrid approach is only applied in ED patient demand forecasting. (3) Regression is applied to most of all application themes excluding inpatient admissions, utilisation of ED resources and ED crowding while time series modelling is applied to six of the nine application themes.
4.2. Data characteristics and data type used for forecasting of ED processes
Data used for forecasting of ED processes have characteristics in terms of period and quantity. In ED patient demand forecasting studies, type of data can be classified into annually, seasonal, monthly, weekly, daily, and hourly. Figure 4 shows distribution of data type in ED patient demand forecasting studies. Daily data were used in 20 papers and monthly data in 9 papers. The data collection period varied widely, from one-year data to nearly 12 years. Detailed data characteristics for each paper were given in Tables 2–6.
Figure 4.
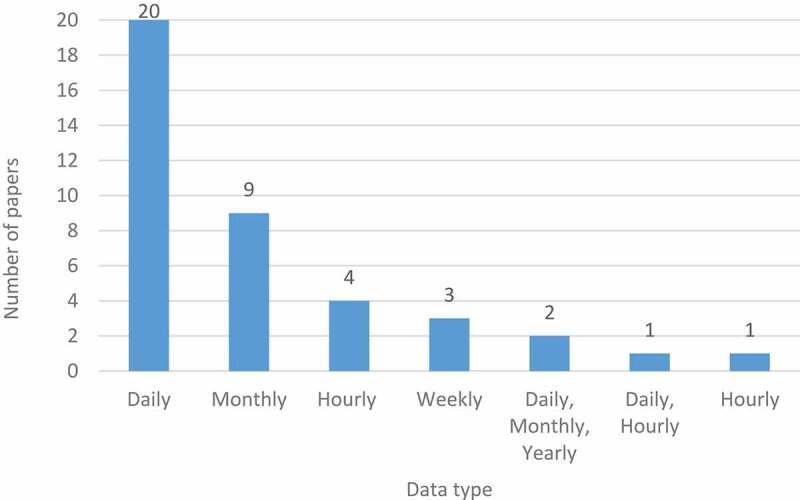
Distribution of ED patient demand forecasting papers in terms of data type
4.3. Study objectives and performance measures
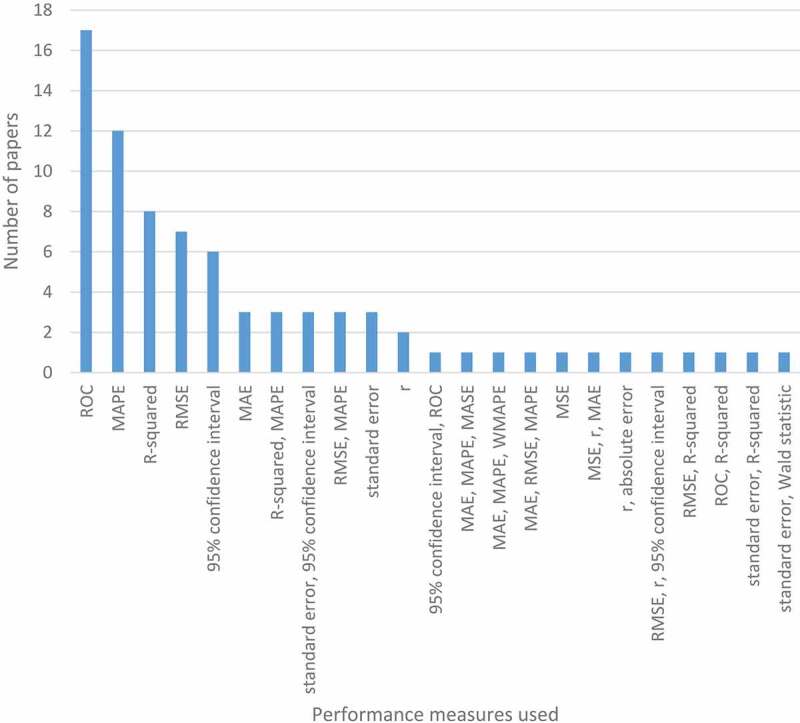
When reviewing measures used for assessing model accuracy and performance, 23 different groups of performance measures were identified as shown in Figure 5: MAPE, RMSE, R-squared, 95% confidence interval, MAE, ROC, standard error, r, MASE, WMAPE, MSE, Wald statistic, and some combination of these. In Sanders (1997), common used forecasting error measures are divided into two groups as follows: standard and relative error measures. While standard error (bias), MAE, MSE and RMSE are defined under the first group, MAPE and WMAPE are investigated in the second group. Apart from this evaluation by Sanders (1997), R-squared corresponds to the percentage of explained variability by the model. A higher R-squared value means a better model accuracy. MAPE is the percentages of mean of the absolute differences between predicted and actual values. RMSE is the root squared mean of the squared differences between predicted and actual values. A lower value of RMSE and MAPE indicates good model performance; that is, a good balance between predicted and actual values. In the ED forecasting literature, it is indicated that MAPE is easier to understand for comparison (Wargon et al., 2009). Among our reviewed papers, ROC and MAPE were mostly preferred performance measures nearly by 21% and 15% of total papers (n = 17 and n = 12). It was followed by R-squared (8; 10%), RMSE (7; 9%), 95% confidence interval (6; 7%), and MAE (3; 4%).
Figure 5.
Distribution of papers in terms of performance measures used
4.4. Publication trend
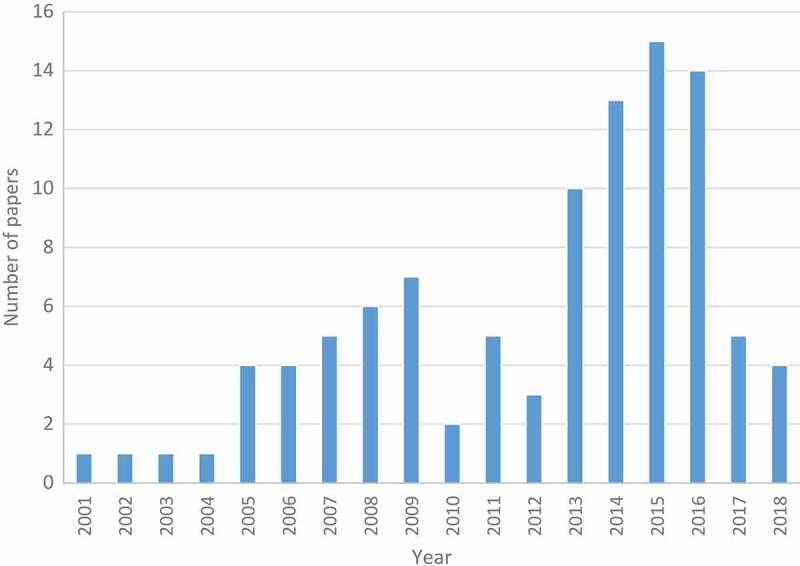
The reviewed papers to forecast the ED processes are handled in time, by adjusting the distribution of the number of papers during the period of 2001–2018 in Figure 6. From Figure 6, it can be easily seen that there are two important increases in the production of papers from 2001 to 2009 and from 2013 to 2015. These two intervals have a high R2 value (86% and 97%) indicating that the papers have increasingly better reception within the ED forecasting literature.
Figure 6.
Distribution of papers by publication year
4.5. Published journal, database, and country of origin
Table 8 provides the list of journals ordered based on the number of papers (from that journals) that have been reviewed and integrated to our review study (n = 102, and associated percentage % = 100, standing for the total number of papers). Academic Emergency Medicine has the most publications on ED forecasting models (13; 13%), followed by Annals of Emergency Medicine and Journal of Medical Systems (3; 3% per each). Of the journals, American Journal of Emergency Medicine, Emergency Medicine Journal, Health Care Management Science, Healthcare informatics research, IEEE Transactions on Information Technology in Biomedicine, Journal of Biomedical Informatics, Neurocomputing, Pediatric Emergency Care, BMJ Open and Emergency Medicine Australasia have two papers (2% per each). Other journals contain one entry (totally 48, 47% per each). Also, 15 proceeding papers are retrieved that corresponds to 15% of total number.
Table 8.
Distribution of papers in terms of published journals
| Publication journal name | No. of papers | Percentage |
|---|---|---|
| Academic Emergency Medicine | 13 | 13% |
| Annals of Emergency Medicine | 3 | 3% |
| Journal of Medical Systems | 3 | 3% |
| American Journal of Emergency Medicine | 2 | 2% |
| Emergency Medicine Journal | 2 | 2% |
| Health Care Management Science | 2 | 2% |
| Healthcare informatics research | 2 | 2% |
| IEEE Transactions on Information Technology in Biomedicine | 2 | 2% |
| Journal of Biomedical Informatics | 2 | 2% |
| Neurocomputing | 2 | 2% |
| Pediatric Emergency Care | 2 | 2% |
| BMJ Open | 2 | 2% |
| Emergency Medicine Australasia | 2 | 2% |
| 1 papers from each of 33 journals | 48 | 47% |
| Proceeding paper | 15 | 15% |
When the database where the reviewed papers published investigated, it is seen that Wiley (22; 22%) and Elsevier (19; 19%) are forefront followed by Springer (8; 8%) and IEEE (7; 7%) (see Figure 7).
Figure 7.

Distribution of papers by published database
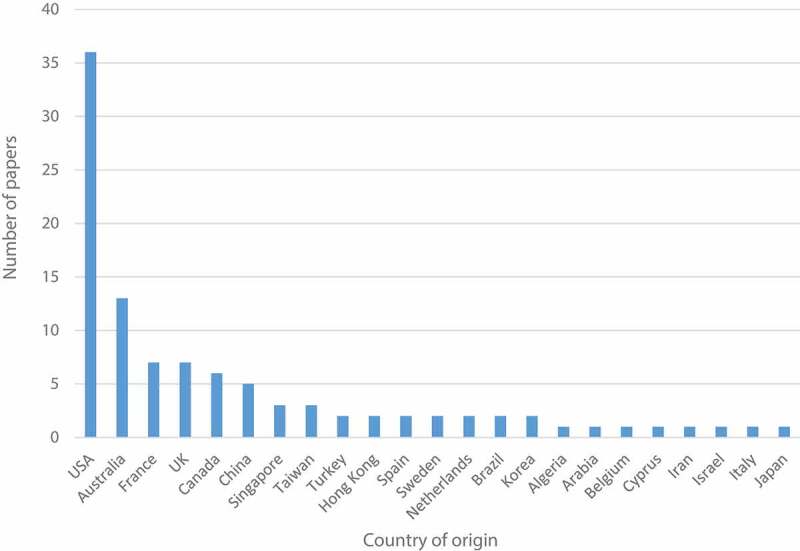
The literature review is, also, classified by country of origin for each study, resulting in the 21 portions and represented in the bar chart (Figure 8). The United States accounts for almost 36 (35%) of the all papers. Australia, France, the United Kingdom, and Canada are also prolific in the use of ED forecasting models (13; 13%, 7; 7%, 7; 7%, 6; 6%, respectively). The remaining countries have a rather testimonial presence (Canada, China, Singapore, Brazil, Taiwan, Turkey, Hong Kong, Spain, Sweden, Netherlands, Brazil, and Korea) with 6(6%), 5(5%), 3(3%), 3(3%), 2(2%), 2(2%), 2(2%), 2(2%), 2(2%), 2(2%), and 2(2%), respectively. The other countries include Algeria, Arabia, Belgium, Cyprus, Iran, Israel, Italy, and Japan (n = 1 per each).
Figure 8.
Distribution of papers in terms of country of origin
5. Discussion
5.1. Overall assessment and main challenges
Studies of ED patient demand forecasting models used generally the daily number of patient visits over a period ranging from 1 to 5 years. Dependent variables used in the developed models include hour of the day, day of the week, month, season, whether the day was a non-workday or the day after a non-workday and vacation days. Especially, in time-series based studies, additional variables are used like meteorological data consisted of maximum or minimum temperature, precipitation and wind speed. The historical data in the reviewed studies includes the linear and non-linear parts because of the complexity of and the randomness of ED demand. Forecasting accuracy depends on the choice of forecasting model. Hybrid models (e.g. ANN and ARIMA) have different advantage and disadvantage for the historical data. ARIMA models are very flexible and it can represent AR, MA and combined AR and MA (ARMA) series. ARIMA models very good when dealing with the linear part but it is weak when working with non-linear data. ANN model is good at dealing with the non-linear parts. But it is hard to decide how many input variables should to be used. When using hybrid model, the estimated values and residuals of the ARIMA model as input variables can solve this problem. Also, combination of ARIMA and ANN models can get better forecasting accuracy.
5.2. Open areas for future work
Even though ED forecasting literature covers the themes of ED patient demand, ED patient admission, ED LOS, ED crowding, utilisation of ED resources, ED patient waiting time, ambulance diversion, inpatient admissions, and some other miscellaneous examples, there are still open themes for future work.
One of the open themes is consultation. It is a common and important process of ED care (Chan, Orlich, Kulasegaram, & Sherbino, 2013; Geskey, Geeting, West, & Hollenbeak, 2013; Wiler et al., 2015; Woods et al., 2008). In this process, emergency physicians request other specialists (consultants) to participate in the care of the ED patient and provide one of the following: admission, discharge or, consultation for another specialty (Woods et al., 2008). The performance measure of this process that significantly affects ED length of stay and overcrowding is consultation response time (Cho et al., 2011; Geskey et al., 2013). It is defined as the placement of an order for an ED consult until the initial consultant recommendation is communicated to the ED provider (Wiler et al., 2015). Reducing consultation response time enables ED executive and medical staff to decrease overall length of time patients remain in the ED and provide better patient satisfaction. In 2010, annual report of the Office of the Auditor General of Ontario, Canada, it is indicated that limited hours and types of specialists’ consultations and diagnostic services available on-site were key barriers to efficient patient flow (Annual Report of the Office of the Auditor General of Ontario, 2010). It is also recommended in this report that to better allow EDs to assess the impact that timely specialist consultation has on patient care, especially for high-acuity patients, EDs should track targeted and actual wait times for specialist consultation for emergency patients, so that the impact of these wait times on providing timely and appropriate patient care can be periodically assessed. One of the best ways is to predict this key performance measure to avoid delays in the whole processes considering related predictors. Predicting and determining consultation response time in EDs can be very useful for ED executive, particularly for prioritising health care policies and promoting health services, comprising the appropriate allocation of health care resources according to differences in patients’ LOS (Gul & Guneri, 2015b).
From the method point, while different methods are applied to forecast ED, ANN-based models provide better results than regression-based models (Gul & Guneri, 2016). For improving the performance of forecasting, different metaheuristic approaches (ANN-ant colony optimisation (Song, 2012), ANN-genetic algorithm (Kuo, Chen, & Hwang, 2001), ANN-particle swarm optimisation (Chau, 2006), ANN-artificial bee colony optimisation (Hsieh, Hsiao, & Yeh, 2011), ANN-tabu search (Aladag, 2011), ANN-simulated annealing (Liao & Tsao, 2006), etc. should be integrated with ANN. To the best our knowledge, while these approaches are successfully applied to different application areas, it is not applied in ED forecasting.
This review study highlights that most of the studies related to ED forecasting is being done in ED patient demand, ED patient admission and ED LOS. Ambulance diversion, impatient admission and patient wait time have not attracted attention to a significant extent regarding development of methods for forecasting. Moreover, implementation of forecasting approaches has not been yet adapted to the auxiliary processes of EDs such as X-ray, tomography, ultrasound, laboratory tests and so on. However, these processes are considered as connections of EDs to the other departments of hospitals.
6. Conclusion
In this paper, a representative and systematic review of 102 papers on ED forecasting is presented. Recently, statistical forecasting concept has gained popularity in ED problems due to its ability on providing ED stakeholders planning their processes efficiently and improving service quality. These papers were classified under nine forecasting themes. In addition, all papers were classified by publication trend, published journal, database and country of origin, forecasting themes, methods used to forecast ED processes, data characteristics, and type used for forecasting of ED processes and study objectives and performance measures. It is aimed to present forecasting methods including regression, time series, data mining and some miscellaneous OR methods in ED-related problems. The ultimate goal is to provide ED stakeholders with a background on the ED as a service business and an overview of statistical forecasting concept that can be practically applied to various ED processes.
It should be acknowledged that this review has some limitations. The first is about exclusion of master’s thesis, doctoral dissertations, and book chapters in this literature review. Second potential limitation is concerned with the languages of the papers. We did not include any papers written in a language other than English.
A number of significant arguments with respect to the applications can be derived from this literature review. Results of the literature review shows that: (1) Usage of forecasting concept in the ED problems is following an increasing trend. (2) Academic Emergency Medicine (Wiley) has the most publications on ED forecasting with 13%. (3) The United States ranks first by accounting for almost 35% of the all papers related to the ED forecasting models. (4) The time series-based models play a dominant role among all approaches with a rate of 27%. (5) ED patient demand is the area where the most papers carried out and constitutes nearly a half of the total papers by 42%. (6) Researchers mostly prefer ROC and MAPE as key performance indicators with 21% and 15%, respectively. We expect and observe that, in the future, the number of applications and approaches related with forecasting methods will raise in the ED literature.
Future directions for ED patient flow forecasting are motivated by gaps found within the two sets of literature. First concerns the ED patient flow processes which have not been studied in the field of forecasting before such as consultation and ED auxiliary processes. Therefore, it would be beneficial to develop forecasting models for these processes. Considering the above, another useful direction would be to develop hybrid models using time-series and data-mining–based methods for these ED processes. Moreover, decision support systems, demand/capacity matching models would be straightforward future venues in ED forecasting.
Correction Statement
This article has been republished with minor changes. These changes do not impact the academic content of the article.
Disclosure statement
No potential conflict of interest was reported by the authors.
References
- Aboagye-Sarfo, P., Mai, Q., Sanfilippo, F. M., Preen, D. B., Stewart, L. M., & Fatovich, D. M. (2015). A comparison of multivariate and univariate time series approaches to modelling and forecasting emergency department demand in Western Australia. Journal of Biomedical Informatics, 57, 62–73. [DOI] [PubMed] [Google Scholar]
- Abraham, G., Byrnes, G. B., & Bain, C. A. (2009). Short-term forecasting of emergency inpatient flow. IEEE Transactions on Information Technology in Biomedicine, 13(3), 380–388. [DOI] [PubMed] [Google Scholar]
- Afilal, M., Yalaoui, F., Dugardin, F., Amodeo, L., Laplanche, D., & Blua, P. (2016a). Emergency department flow: A new practical patients classification and forecasting daily attendance. IFAC-PapersOnLine, 49(12), 721–726. [Google Scholar]
- Afilal, M., Yalaoui, F., Dugardin, F., Amodeo, L., Laplanche, D., & Blua, P. (2016b). Forecasting the emergency department patients flow. Journal of Medical Systems, 40(7), 1–18. [DOI] [PubMed] [Google Scholar]
- Ahalt, V., Argon, N. T., Ziya, S., Strickler, J., & Mehrotra, A. (2018). Comparison of emergency department crowding scores: A discrete-event simulation approach. Health Care Management Science, 21(1), 144–155. [DOI] [PubMed] [Google Scholar]
- Aladag, C. H. (2011). A new architecture selection method based on tabu search for artificial neural networks. Expert Systems with Applications, 38(4), 3287–3293. [Google Scholar]
- Andersson, B., Andersson, R., Ohlsson, M., & Nilsson, J. (2011). Prediction of severe acute pancreatitis at admission to hospital using artificial neural networks. Pancreatology, 11(3), 328–335. [DOI] [PubMed] [Google Scholar]
- Araz, O. M., Bentley, D., & Muelleman, R. L. (2014). Using Google Flu Trends data in forecasting influenza-like–Illness related ED visits in Omaha, Nebraska. The American Journal of Emergency Medicine, 32(9), 1016–1023. [DOI] [PubMed] [Google Scholar]
- Aroua, A., & Abdul-Nour, G. (2015). Forecast emergency room visits–A major diagnostic categories based approach. International Journal of Metrology and Quality Engineering, 6(2), 204. [Google Scholar]
- Au, L., Byrnes, G. B., Bain, C. A., Fackrell, M., Brand, C., Campbell, D. A., & Taylor, P. G. (2009). Predicting overflow in an emergency department. IMA Journal of Management Mathematics, 20(1), 39–49. [Google Scholar]
- Au-Yeung, S. W. M., Harder, U., McCoy, E. J., & Knottenbelt, W. J. (2009). Predicting patient arrivals to an accident and emergency department. Emergency Medicine Journal, 26(4), 241–244. [DOI] [PubMed] [Google Scholar]
- Azari, A., Janeja, V. P., & Levin, S. (2013). Predicting hospital admissions from the emergency department to reduce boarding. In Healthcare Systems Process Improvement Conference, New Orleans, USA. [Google Scholar]
- Azari, A., Janeja, V. P., & Levin, S. (2015, November). Imbalanced learning to predict long stay emergency department patients. In Bioinformatics and Biomedicine (BIBM), 2015 IEEE International Conference on (pp. 807–814). IEEE. Washington DC, USA. [Google Scholar]
- Bagnasco, A., Siri, A., Aleo, G., Rocco, G., & Sasso, L. (2015). Applying artificial neural networks to predict communication risks in the emergency department. Journal of Advanced Nursing, 71(10), 2293–2304. [DOI] [PubMed] [Google Scholar]
- Barak-Corren, Y., Fine, A. M., & Reis, B. Y. (2017). Early prediction model of patient hospitalization from the pediatric emergency department. Pediatrics, 139(5), e20162785. [DOI] [PubMed] [Google Scholar]
- Batal, H., Tench, J., McMillan, S., Adams, J., & Mehler, P. S. (2001). Predicting patient visits to an urgent care clinic using calendar variables. Academic Emergency Medicine, 8(1), 48–53. [DOI] [PubMed] [Google Scholar]
- Benbelkacem, S., Kadri, F., Chaabane, S., & Atmani, B. (2014, November). A data mining-based approach to predict strain situations in hospital emergency department systems. In 10ème Conférence Francophone de Modélisation, Optimisation et Simulation-MOSIM’14. Nancy, France. [Google Scholar]
- Bennett, K. J., Moore, C. G., & Probst, J. C. (2007). Estimating uncompensated care charges at rural hospital emergency departments. The Journal of Rural Health, 23(3), 258–263. [DOI] [PubMed] [Google Scholar]
- Bergs, J., Heerinckx, P., & Verelst, S. (2014). Knowing what to expect, forecasting monthly emergency department visits: A time-series analysis. International Emergency Nursing, 22(2), 112–115. [DOI] [PubMed] [Google Scholar]
- Bernstein, S. L., Verghese, V., Leung, W., Lunney, A. T., & Perez, I. (2003). Development and validation of a new index to measure emergency department crowding. Academic Emergency Medicine, 10(9), 938–942. [DOI] [PubMed] [Google Scholar]
- Boyle, J., Jessup, M., Crilly, J., Green, D., Lind, J., Wallis, M., … Fitzgerald, G. (2012). Predicting emergency department admissions. Emergency Medicine Journal, 29(5), 358–365. [DOI] [PubMed] [Google Scholar]
- Boyle, J., Wallis, M., Jessup, M., Crilly, J., Lind, J., Miller, P., & Fitzgerald, G. (2008, August). Regression forecasting of patient admission data. In Engineering in Medicine and Biology Society, 2008. EMBS 2008. 30th Annual International Conference of the IEEE (pp. 3819–3822). IEEE. British Columbia, Canada. [DOI] [PubMed] [Google Scholar]
- Boyle, J. R., Sparks, R. S., Keijzers, G. B., Crilly, J. L., Lind, J. F., & Ryan, L. M. (2011). Prediction and surveillance of influenza epidemics. Medical Journal of Australia, 194(4), S28. [DOI] [PubMed] [Google Scholar]
- Bradman, K., Borland, M., & Pascoe, E. (2014). Predicting patient disposition in a paediatric emergency department. Journal of Paediatrics and Child Health, 50(10), E39–E44. [DOI] [PubMed] [Google Scholar]
- Burns, K., Chernyak, V., & Scheinfeld, M. H. (2016). Emergency department imaging: Are weather and calendar factors associated with imaging volume? Clinical Radiology, 71(12), 1312–e1. [DOI] [PubMed] [Google Scholar]
- Butler, M. B., Gu, H., Kenney, T., & Campbell, S. G. (2016). P017: Does a busy day predict another busy day? A time-series analysis of multi-centre emergency department volumes. Cjem, 18(S1), S83–S84. [Google Scholar]
- Calegari, R., Fogliatto, F. S., Lucini, F. R., Neyeloff, J., Kuchenbecker, R. S., & Schaan, B. D. (2016). Forecasting daily volume and acuity of patients in the emergency department. Computational and Mathematical Methods in Medicine, 2016, 2016, 1–8. [DOI] [PMC free article] [PubMed] [Google Scholar]
- Champion, R., Kinsman, L. D., Lee, G. A., Masman, K. A., May, E. A., Mills, T. M., … Williams, R. J. (2007). Forecasting emergency department presentations. Australian Health Review, 31(1), 83–90. [DOI] [PubMed] [Google Scholar]
- Chan, T., Orlich, D., Kulasegaram, K., & Sherbino, J. (2013). Understanding communication between emergency and consulting physicians: A qualitative study that describes and defines the essential elements of the emergency department consultation-referral process for the junior learner. Canadian Journal of Emergency Medicine, 15(01), 42–51. [DOI] [PubMed] [Google Scholar]
- Chaou, C. H., Chen, H. H., Chang, S. H., Tang, P., Pan, S. L., Yen, A. M. F., & Chiu, T. F. (2017). Predicting length of stay among patients discharged from the emergency department—Using an accelerated failure time model. PloS one, 12(1), e0165756. [DOI] [PMC free article] [PubMed] [Google Scholar]
- Chase, V. J., Cohn, A. E., Peterson, T. A., & Lavieri, M. S. (2012). Predicting emergency department volume using forecasting methods to create a “surge response” for noncrisis events. Academic Emergency Medicine, 19(5), 569–576. [DOI] [PubMed] [Google Scholar]
- Chau, K. W. (2006). Particle swarm optimization training algorithm for ANNs in stage prediction of Shing Mun River. Journal of Hydrology, 329(3–4), 363–367. [Google Scholar]
- Cho, S. J., Jeong, J., Han, S., Yeom, S., Park, S. W., Kim, H. H., & Hwang, S. Y. (2011). Decreased emergency department length of stay by application of a computerized consultation management system. Academic Emergency Medicine, 18(4), 398–402. [DOI] [PubMed] [Google Scholar]
- Combes, C., Kadri, F., & Chaabane, S. (2014, November). Predicting hospital length of stay using regression models: Application to emergency department. In 10ème Conférence Francophone de Modélisation, Optimisation et Simulation-MOSIM’14. Nancy, France. [Google Scholar]
- Committee on the Future of Emergency Care in the United States Health System . (2006). Hospital-based emergency care: At the breaking point. Washington DC: National Academies Press. [Google Scholar]
- Cote, M. J., Smith, M. A., Eitel, D. R., & Akçali, E. (2013). Forecasting emergency department arrivals: A tutorial for emergency department directors. Hospital Topics, 91(1), 9–19. [DOI] [PubMed] [Google Scholar]
- Dent, A. W., Weiland, T. J., Vallender, L., & Oettel, N. E. (2007). Can medical admission and length of stay be accurately predicted by emergency staff, patients or relatives? Australian Health Review, 31(4), 633–641. [DOI] [PubMed] [Google Scholar]
- Derose, S. F., Gabayan, G. Z., Chiu, V. Y., Yiu, S. C., & Sun, B. C. (2014). Emergency department crowding predicts admission length-of-stay but not mortality in a large health system. Medical Care, 52(7), 602. [DOI] [PMC free article] [PubMed] [Google Scholar]
- Ding, R., McCarthy, M. L., Desmond, J. S., Lee, J. S., Aronsky, D., & Zeger, S. L. (2010). Characterizing waiting room time, treatment time, and boarding time in the emergency department using quantile regression. Academic Emergency Medicine, 17(8), 813–823. [DOI] [PubMed] [Google Scholar]
- Eitel, D. R., Rudkin, S. E., Malvehy, M. A., Killeen, J. P., & Pines, J. M. (2010). Improving service quality by understanding emergency department flow: A white paper and position statement prepared for the American academy of emergency medicine. The Journal of Emergency Medicine, 38(1), 70–79. [DOI] [PubMed] [Google Scholar]
- Ekström, A., Kurland, L., Farrokhnia, N., Castrén, M., & Nordberg, M. (2015). Forecasting emergency department visits using internet data. Annals of Emergency Medicine, 65(4), 436–442. [DOI] [PubMed] [Google Scholar]
- Epstein, S. K., & Tian, L. (2006). Development of an emergency department work score to predict ambulance diversion. Academic Emergency Medicine, 13(4), 421–426. [DOI] [PubMed] [Google Scholar]
- Galatzer-Levy, I. R., Karstoft, K. I., Statnikov, A., & Shalev, A. Y. (2014). Quantitative forecasting of PTSD from early trauma responses: A machine learning application. Journal of Psychiatric Research, 59, 68–76. [DOI] [PMC free article] [PubMed] [Google Scholar]
- Geskey, J. M., Geeting, G., West, C., & Hollenbeak, C. S. (2013). Improved physician consult response times in an academic emergency department after implementation of an institutional guideline. The Journal of Emergency Medicine, 44(5), 999–1006. [DOI] [PubMed] [Google Scholar]
- Gill, S. D., Lane, S. E., Sheridan, M., Ellis, E., Smith, D., & Stella, J. (2018). Why do ‘fast track’patients stay more than four hours in the emergency department? An investigation of factors that predict length of stay. Emergency Medicine Australasia, 30, 641–647. [DOI] [PubMed] [Google Scholar]
- Golmohammadi, D. (2016). Predicting hospital admissions to reduce emergency department boarding. International Journal of Production Economics, 182, 535–544. [Google Scholar]
- Goto, Y., Maeda, T., & Goto, Y. (2013). Decision-tree model for predicting outcomes after out-of-hospital cardiac arrest in the emergency department. Critical Care, 17(4), R133. [DOI] [PMC free article] [PubMed] [Google Scholar]
- Gul, M., & Guneri, A. F. (2015a). A comprehensive review of emergency department simulation applications for normal and disaster conditions. Computers & Industrial Engineering, 83, 327–344. [Google Scholar]
- Gul, M., & Guneri, A. F. (2015b). Forecasting patient length of stay in an emergency department by artificial neural networks. Journal of Aeronautics and Space Technologies, 8(2), 43–48. [Google Scholar]
- Gul, M., & Guneri, A. F. (2016). Planning the future of emergency departments: Forecasting ED patient arrivals by using regression and neural network models. International Journal of Industrial Engineering, 23(2), 137–154. [Google Scholar]
- Hachesu, P. R., Ahmadi, M., Alizadeh, S., & Sadoughi, F. (2013). Use of data mining techniques to determine and predict length of stay of cardiac patients. Healthcare Informatics Research, 19(2), 121–129. [DOI] [PMC free article] [PubMed] [Google Scholar]
- Harrou, F., Sun, Y., Kadri, F., Chaabane, S., & Tahon, C. (2015, October). Early detection of abnormal patient arrivals at hospital emergency department. In Industrial Engineering and Systems Management (IESM), 2015 International Conference on (pp. 221–227). IEEE. Seville, Spain. [Google Scholar]
- Hofman, S. E., Lucke, J. A., Heim, N., de Gelder, J., Fogteloo, A. J., Heringhaus, C., … Mooijaart, S. P. (2016). Prediction of 90-day mortality in older patients after discharge from an emergency department: A retrospective follow-up study. BMC Emergency Medicine, 16(1), 26. [DOI] [PMC free article] [PubMed] [Google Scholar]
- Hoot, N. R., LeBlanc, L. J., Jones, I., Levin, S. R., Zhou, C., Gadd, C. S., & Aronsky, D. (2008). Forecasting emergency department crowding: A discrete event simulation. Annals of Emergency Medicine, 52(2), 116–125. [DOI] [PMC free article] [PubMed] [Google Scholar]
- Hoot, N. R., LeBlanc, L. J., Jones, I., Levin, S. R., Zhou, C., Gadd, C. S., & Aronsky, D. (2009). Forecasting emergency department crowding: A prospective, real-time evaluation. Journal of the American Medical Informatics Association, 16(3), 338–345. [DOI] [PMC free article] [PubMed] [Google Scholar]
- Hoot, N. R., Zhou, C., Jones, I., & Aronsky, D. (2007). Measuring and forecasting emergency department crowding in real time. Annals of Emergency Medicine, 49(6), 747–755. [DOI] [PMC free article] [PubMed] [Google Scholar]
- Hsieh, T. J., Hsiao, H. F., & Yeh, W. C. (2011). Forecasting stock markets using wavelet transforms and recurrent neural networks: An integrated system based on artificial bee colony algorithm. Applied Soft Computing, 11(2), 2510–2525. [Google Scholar]
- Jiang, S., Chin, K. S., & Tsui, K. L. (2018). A universal deep learning approach for modeling the flow of patients under different severities. Computer Methods and Programs in Biomedicine, 154, 191–203. [DOI] [PubMed] [Google Scholar]
- Jones, S. A., Joy, M. P., & Pearson, J. (2002). Forecasting demand of emergency care. Health Care Management Science, 5(4), 297–305. [DOI] [PubMed] [Google Scholar]
- Jones, S. S., Evans, R. S., Allen, T. L., Thomas, A., Haug, P. J., Welch, S. J., & Snow, G. L. (2009). A multivariate time series approach to modeling and forecasting demand in the emergency department. Journal of Biomedical Informatics, 42(1), 123–139. [DOI] [PubMed] [Google Scholar]
- Jones, S. S., Thomas, A., Evans, R. S., Welch, S. J., Haug, P. J., & Snow, G. L. (2008). Forecasting daily patient volumes in the emergency department. Academic Emergency Medicine, 15(2), 159–170. [DOI] [PubMed] [Google Scholar]
- Juang, W. C., Huang, S. J., Huang, F. D., Cheng, P. W., & Wann, S. R. (2017). Application of time series analysis in modelling and forecasting emergency department visits in a medical centre in Southern Taiwan. BMJ open, 7(11), e018628. [DOI] [PMC free article] [PubMed] [Google Scholar]
- Kadri, F., Harrou, F., Chaabane, S., Sun, Y., & Tahon, C. (2016). Seasonal ARMA-based SPC charts for anomaly detection: Application to emergency department systems. Neurocomputing, 173, 2102–2114. [Google Scholar]
- Kadri, F., Harrou, F., Chaabane, S., & Tahon, C. (2014). Time series modelling and forecasting of emergency department overcrowding. Journal of Medical Systems, 38(9), 107–127. [DOI] [PubMed] [Google Scholar]
- Kam, H. J., Sung, J. O., & Park, R. W. (2010). Prediction of daily patient numbers for a regional emergency medical center using time series analysis. Healthcare Informatics Research, 16(3), 158–165. [DOI] [PMC free article] [PubMed] [Google Scholar]
- Kang, S. W., & Park, H. S. (2015). Emergency department visit volume variability. Clinical and Experimental Emergency Medicine, 2(3), 150–154. [DOI] [PMC free article] [PubMed] [Google Scholar]
- Keogh, B., Culliford, D., Guerrero-Ludueña, R., & Monks, T. (2018). Exploring emergency department 4-hour target performance and cancelled elective operations: A regression analysis of routinely collected and openly reported NHS trust data. BMJ open, 8(5), e020296. [DOI] [PMC free article] [PubMed] [Google Scholar]
- Kim, K., Lee, C., O’Leary, K., Rosenauer, S., & Mehrotra, S. (2014). Predicting patient volumes in hospital medicine: A comparative study of different time series forecasting methods. Tech. rep., Northwestern University. [Google Scholar]
- Kim, S. W., Li, J. Y., Hakendorf, P., Teubner, D. J., Ben‐Tovim, D. I., & Thompson, C. H. (2014). Predicting admission of patients by their presentation to the emergency department. Emergency Medicine Australasia : EMA, 26(4), 361–367. [DOI] [PubMed] [Google Scholar]
- Kuo, R. J., Chen, C. H., & Hwang, Y. C. (2001). An intelligent stock trading decision support system through integration of genetic algorithm based fuzzy neural network and artificial neural network. Fuzzy Sets and Systems, 118(1), 21–45. [Google Scholar]
- Launay, C. P., Rivière, H., Kabeshova, A., & Beauchet, O. (2015). Predicting prolonged length of hospital stay in older emergency department users: Use of a novel analysis method, the artificial neural network. European Journal of Internal Medicine, 26(7), 478–482. [DOI] [PubMed] [Google Scholar]
- Leegon, J., Hoot, N., Aronsky, D., & Storkey, A. (2007, October). Predicting ambulance diversion in an adult emergency department using a Gaussian process. In AMIA… Annual Symposium proceedings. AMIA Symposium (p. 1026). Chicago, USA. [PubMed] [Google Scholar]
- Leegon, J., Jones, I., Lanaghan, K., & Aronsky, D. (2005). Predicting hospital admission for emergency department patients using a Bayesian network. In AMIA Annual Symposium Proceedings (Vol. 2005, p. 1022). American Medical Informatics Association. Washington DC, USA. [PMC free article] [PubMed] [Google Scholar]
- Leegon, J., Jones, I., Lanaghan, K., & Aronsky, D. (2006). Predicting hospital admission in a pediatric emergency department using an artificial neural network. In AMIA Annual Symposium Proceedings (Vol. 2006, p. 1004). American Medical Informatics Association. Washington DC, USA. [PMC free article] [PubMed] [Google Scholar]
- Liao, G. C., & Tsao, T. P. (2006). Application of a fuzzy neural network combined with a chaos genetic algorithm and simulated annealing to short-term load forecasting. IEEE Transactions on Evolutionary Computation, 10(3), 330–340. [Google Scholar]
- Lin, D., Patrick, J., & Labeau, F. (2014). Estimating the waiting time of multi-priority emergency patients with downstream blocking. Health Care Management Science, 17(1), 88–99. [DOI] [PMC free article] [PubMed] [Google Scholar]
- Liu, N., Koh, Z. X., Goh, J., Lin, Z., Haaland, B., Ting, B. P., & Ong, M. E. H. (2014). Prediction of adverse cardiac events in emergency department patients with chest pain using machine learning for variable selection. BMC Medical Informatics and Decision Making, 14(1), 75. [DOI] [PMC free article] [PubMed] [Google Scholar]
- Lucke, J. A., de Gelder, J., Clarijs, F., Heringhaus, C., de Craen, A. J., Fogteloo, A. J., … Mooijaart, S. P. (2018). Early prediction of hospital admission for emergency department patients: A comparison between patients younger or older than 70 years. Emerg Med J, 35(1), 18–27. [DOI] [PubMed] [Google Scholar]
- Luo, G., Stone, B. L., Johnson, M. D., & Nkoy, F. L. (2016). Predicting appropriate admission of bronchiolitis patients in the emergency department: Rationale and methods. JMIR Research Protocols, 5(1), e41. [DOI] [PMC free article] [PubMed] [Google Scholar]
- Mai, Q., Aboagye‐Sarfo, P., Sanfilippo, F. M., Preen, D. B., & Fatovich, D. M. (2015). Predicting the number of emergency department presentations in Western Australia: A population‐based time series analysis. Emergency Medicine Australasia, 27(1), 16–21. [DOI] [PubMed] [Google Scholar]
- Marcilio, I., Hajat, S., & Gouveia, N. (2013). Forecasting daily emergency department visits using calendar variables and ambient temperature readings. Academic Emergency Medicine, 20(8), 769–777. [DOI] [PubMed] [Google Scholar]
- McCarthy, M. L., Zeger, S. L., Ding, R., Aronsky, D., Hoot, N. R., & Kelen, G. D. (2008). The challenge of predicting demand for emergency department services. Academic Emergency Medicine, 15(4), 337–346. [DOI] [PubMed] [Google Scholar]
- Meng, G., Tan, Y., Fang, M., Yang, H., Liu, X., & Zhao, Y. (2015). Meteorological factors related to emergency admission of elderly stroke patients in Shanghai: Analysis with a multilayer perceptron neural network. Medical Science Monitor: International Medical Journal of Experimental and Clinical Research, 21, 3600–3607. [DOI] [PMC free article] [PubMed] [Google Scholar]
- Menke, N. B., Caputo, N., Fraser, R., Haber, J., Shields, C., & Menke, M. N. (2014). A retrospective analysis of the utility of an artificial neural network to predict ED volume. The American Journal of Emergency Medicine, 32(6), 614–617. [DOI] [PubMed] [Google Scholar]
- Ministry of Health and Long-Term Care . (2010). Hospital emergency departments. Annual report of the office of the auditor general of Ontario, Canada. [Google Scholar]
- Moriña, D., Puig, P., Ríos, J., Vilella, A., & Trilla, A. (2011). A statistical model for hospital admissions caused by seasonal diseases. Statistics in Medicine, 30(26), 3125–3136. [DOI] [PubMed] [Google Scholar]
- Morzuch, B. J., & Allen, P. G. (2006, June). Forecasting hospital emergency department arrivals. In 26th Annual Symposium on Forecasting, Santander, Spain. [Google Scholar]
- Ng, C. J., Liao, P. J., Chang, Y. C., Kuan, J. T., Chen, J. C., & Hsu, K. H. (2016). Predictive factors for hospitalization of nonurgent patients in the emergency department. Medicine, 95(26). [DOI] [PMC free article] [PubMed] [Google Scholar]
- Onat, O., & Gul, M. (2018). Application of artificial neural networks to the prediction of out-of-plane response of infill walls subjected to shake table. Smart Structures and Systems, 21(4), 521–535. [Google Scholar]
- Park, J., Park, E., & Desai, Y. (2008, January). Forecasting patient load of ED at moses cone hospital. In IIE Annual Conference. Proceedings (p. 1). Institute of Industrial and Systems Engineers (IISE). Vancouver, Canada. [Google Scholar]
- Peck, J. S., Benneyan, J. C., Nightingale, D. J., & Gaehde, S. A. (2012). Predicting emergency department inpatient admissions to improve same‐day patient flow. Academic Emergency Medicine, 19(9), E1045–E1054. [DOI] [PubMed] [Google Scholar]
- Peck, J. S., Gaehde, S. A., Nightingale, D. J., Gelman, D. Y., Huckins, D. S., Lemons, M. F., … Benneyan, J. C. (2013). Generalizability of a simple approach for predicting hospital admission from an emergency department. Academic Emergency Medicine, 20(11), 1156–1163. [DOI] [PubMed] [Google Scholar]
- Petrou, P. (2015). An interrupted time-series analysis to assess impact of introduction of co-payment on emergency room visits in Cyprus. Applied Health Economics and Health Policy, 13(5), 515–523. [DOI] [PubMed] [Google Scholar]
- Riordan, J. P, Dell, W. L, & Patrie, J. T. (2017). Can patient variables measured on arrival to the emergency department predict disposition in medium-acuity patients?. The Journal Of Emergency Medicine, 52(5), 769-779. doi: 10.1016/j.jemermed.2016.11.018 [DOI] [PubMed] [Google Scholar]
- Rosychuk, R. J., Klassen, T. P., Voaklander, D. C., Senthilselvan, A., & Rowe, B. H. (2011). Seasonality patterns in croup presentations to emergency departments in Alberta, Canada: A time series analysis. Pediatric Emergency Care, 27(4), 256–260. [DOI] [PubMed] [Google Scholar]
- Rosychuk, R. J., Youngson, E., & Rowe, B. H. (2015). Presentations to Alberta emergency departments for asthma: A time series analysis. Academic Emergency Medicine, 22(8), 942–949. [DOI] [PubMed] [Google Scholar]
- Rosychuk, R. J., Youngson, E., & Rowe, B. H. (2016). Presentations to emergency departments for COPD: A time series analysis. Canadian Respiratory Journal, 2016, 2016, 1–9. [DOI] [PMC free article] [PubMed] [Google Scholar]
- Salah, H. (2017). Predicting Inpatient Length of Stay in Western New York Health Service Area Using Machine Learning Algorithms (Doctoral dissertation). State University of New York at Binghamton. [Google Scholar]
- Sanders, N. R. (1997). Measuring forecast accuracy: Some practical suggestions. Production and Inventory Management Journal, 38(1), 43–46. [Google Scholar]
- Schonwetter, R. S., Clark, L. D., Leedy, S. A., Quinn, M. J., Azer, M., & Kim, S. (2008). Predicting emergency room visits and hospitalizations among hospice patients with cardiac disease. Journal of Palliative Medicine, 11(8), 1142–1150. [DOI] [PubMed] [Google Scholar]
- Schweigler, L. M., Desmond, J. S., McCarthy, M. L., Bukowski, K. J., Ionides, E. L., & Younger, J. G. (2009). Forecasting models of emergency department crowding. Academic Emergency Medicine, 16(4), 301–308. [DOI] [PubMed] [Google Scholar]
- Skinner, J. (2016). Forecasting emergency department overcrowding. SPNHA Review, 12(1), 8. [Google Scholar]
- Skinner, J., & Higbea, R. J. (2015, October 30–31). Forecasting the potential for emergency department overcrowding. The Third International Conference on Health Information Technology Advancement-ICHITA (pp. 93–101). Kalamazoo, Michigan. [Google Scholar]
- Song, L. (2012). Improved intelligent method for traffic flow prediction based on artificial neural networks and ant colony optimization. Journal of Convergence Information Technology, 7(8), 272–280. [Google Scholar]
- Sprivulis, P. (2003). Estimation of the general practice workload of a metropolitan teaching hospital emergency department. Emergency Medicine, 15(1), 32–37. [DOI] [PubMed] [Google Scholar]
- Stout, W. A., & Tawney, B. (2005, April). An excel forecasting model to aid in decision making that affects hospital resource/bed utilization-hospital capability to admit emergency room patients. In Systems and Information Engineering Design Symposium, 2005 IEEE (pp. 222–228). IEEE. Charlottesville, VA, USA. [Google Scholar]
- Sun, Y., Heng, B. H., Seow, Y. T., & Seow, E. (2009). Forecasting daily attendances at an emergency department to aid resource planning. BMC Emergency Medicine, 9(1), 1. [DOI] [PMC free article] [PubMed] [Google Scholar]
- Sun, Y., Heng, B. H., Tay, S. Y., & Seow, E. (2011). Predicting hospital admissions at emergency department triage using routine administrative data. Academic Emergency Medicine, 18(8), 844–850. [DOI] [PubMed] [Google Scholar]
- Tandberg, D., & Qualls, C. (1994). Time series forecasts of emergency department patient volume, length of stay, and acuity. Annals of Emergency Medicine, 23(2), 299–306. [DOI] [PubMed] [Google Scholar]
- Walczak, S. (2005). Artificial neural network medical decision support tool: Predicting transfusion requirements of ER patients. IEEE Transactions on Information Technology in Biomedicine, 9(3), 468–474. [DOI] [PubMed] [Google Scholar]
- Wang, S. T. (2013). Construct an optimal triage prediction model: A case study of the emergency department of a teaching hospital in Taiwan. Journal of Medical Systems, 37(5), 9968. [DOI] [PubMed] [Google Scholar]
- Wargon, M., Casalino, E., & Guidet, B. (2010). From model to forecasting: A multicenter study in emergency departments. Academic Emergency Medicine, 17(9), 970–978. [DOI] [PubMed] [Google Scholar]
- Wargon, M., Guidet, B., Hoang, T. D., & Hejblum, G. (2009). A systematic review of models for forecasting the number of emergency department visits. Emergency Medicine Journal, 26(6), 395–399. [DOI] [PubMed] [Google Scholar]
- Wiler, J. L., Bolandifar, E., Griffey, R. T., Poirier, R. F., & Olsen, T. (2013). An emergency department patient flow model based on queueing theory principles. Academic Emergency Medicine, 20(9), 939–946. [DOI] [PubMed] [Google Scholar]
- Wiler, J. L., Welch, S., Pines, J., Schuur, J., Jouriles, N., & Stone‐Griffith, S. (2015). Emergency department performance measures updates: Proceedings of the 2014 emergency department benchmarking alliance consensus summit. Academic Emergency Medicine, 22(5), 542–553. [DOI] [PubMed] [Google Scholar]
- Woods, R. A., Lee, R., Ospina, M. B., Blitz, S., Lari, H., Bullard, M. J., & Rowe, B. H. (2008). Consultation outcomes in the emergency department: Exploring rates and complexity. Canadian Journal of Emergency Medicine, 10(1), 25–31. [DOI] [PubMed] [Google Scholar]
- Wrenn, J., Jones, I., Lanaghan, K., Congdon, C. B., & Aronsky, D. (2005). Estimating patient’s length of stay in the emergency department with an artificial neural network. In AMIA Annual Symposium Proceedings (Vol. 2005, p. 1155). American Medical Informatics Association. Washington DC, USA. [PMC free article] [PubMed] [Google Scholar]
- Xu, M., Wong, T. C., & Chin, K. S. (2013). Modeling daily patient arrivals at emergency department and quantifying the relative importance of contributing variables using artificial neural network. Decision Support Systems, 54(3), 1488–1498. [Google Scholar]
- Xu, Q., Tsui, K. L., Jiang, W., & Guo, H. (2016). A hybrid approach for forecasting patient visits in emergency department. Quality and Reliability Engineering International, 32(8), 2751–2759. [Google Scholar]
- Yucesan, M., Gul, M., & Celik, E. (2018a). A multi-method patient arrival forecasting outline for hospital emergency departments. International Journal of Healthcare Management, 1–13. doi: 10.1080/20479700.2018.1531608 [DOI] [Google Scholar]
- Yucesan, M., Gul, M., Mete, S., & Celik, E. (2018b). A forecasting model for patient arrivals of an emergency department in healthcare management systems. Intelligent Systems for Healthcare Management and Delivery. Ed. Nardjes Bouchemal, IGI Global. doi: 10.4018/978-1-5225-7071-4 [DOI] [Google Scholar]
- Zhang, X., Kim, J., Patzer, R. E., Pitts, S. R., Patzer, A., & Schrager, J. D. (2017). Prediction of emergency department hospital admission based on natural language processing and neural networks. Methods of Information in Medicine, 56(5), 377–389. [DOI] [PubMed] [Google Scholar]
- Zhang, X. L., Zhu, T., Luo, L., He, C. Z., Cao, Y., & Shi, Y. K. (2013, July). Forecasting emergency department patient flow using Markov chain. In Service Systems and Service Management (ICSSSM), 2013 10th International Conference on (pp. 278–282). IEEE. Hong Kong, China. [Google Scholar]
- Zhu, T., Luo, L., Zhang, X., & Shen, W. (2018). Modeling the length of stay of respiratory patients in emergency department using coxian phase-type distributions with covariates. IEEE Journal of Biomedical and Health Informatics, 22(3), 955–965. [DOI] [PubMed] [Google Scholar]
- Zibners, L. M., Bonsu, B. K., Hayes, J. R., & Cohen, D. M. (2006). Local weather effects on emergency department visits: A time series and regression analysis. Pediatric Emergency Care, 22(2), 104–106. [DOI] [PubMed] [Google Scholar]
- Zlotnik, A., Gallardo-Antolin, A., Alfaro, M. C., Pérez, M. C. P., & Martínez, J. M. M. (2015). Emergency department visit forecasting and dynamic nursing staff allocation using machine learning techniques with readily available open-source software. CIN: Computers, Informatics, Nursing, 33(8), 368–377. [DOI] [PubMed] [Google Scholar]