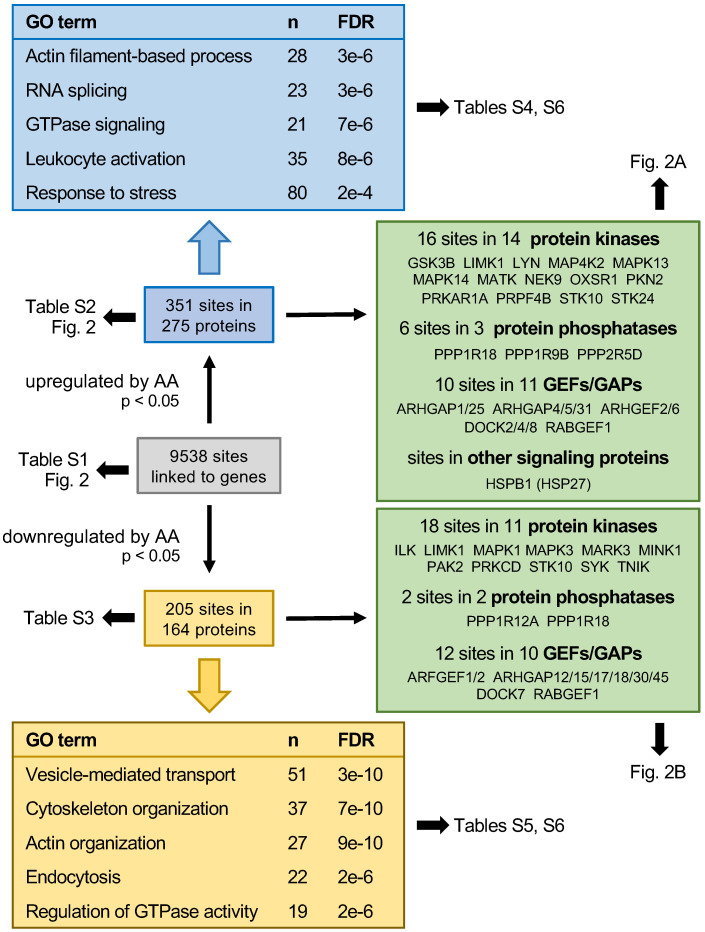
Figure 1.
Summary of the phosphoproteome analysis of AA-treated MDMs. Blue boxes show the data for significantly upregulated phosphosites (nominal p value < 0.05; n = 3), yellow boxes the results downregulated phosphosites. Boxes at the top and bottom show for the most significantly (FDR) enriched terms associated with specific functions. n: number of proteins linked to the respective GO term. Green boxes: AA regulated phosphoproteins with functions in signal transduction mediated by protein kinases, phosphatases, G proteins (GTPases) or heat shock protein 27 (HSP27).

