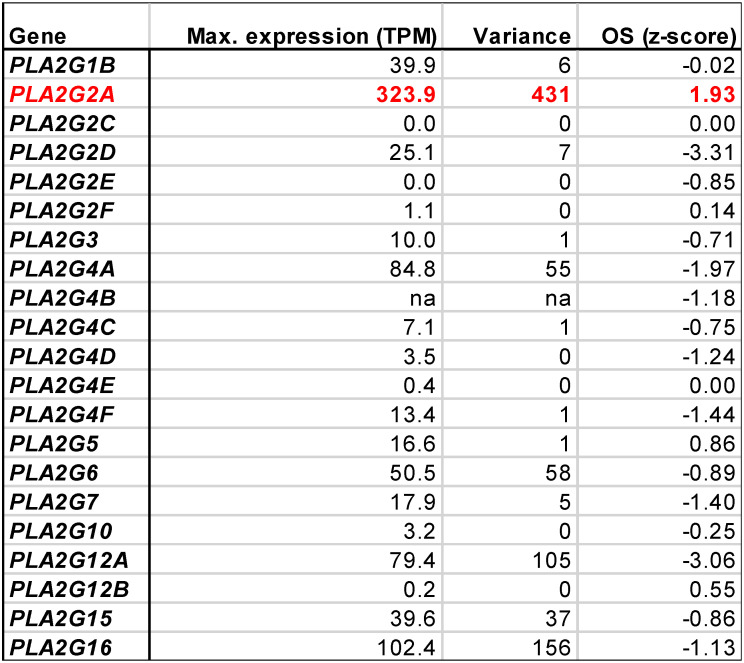
Table 1.
Expression of phospholipase A2 genes in in solid tumor tissue (TCGA RNA-Seq data) and association of expression with overall survival (OS, PRECOG data). A positive z-score indicates a hazard ratio > 1, a negative z-score a hazard ratio < 1; |z| = 1.96 corresponds to p = 0.05. The expression data show the maximum expression levels (TPM) and the variance of expression among samples (variance is the average squared deviation from the mean). na: not available

