Figure 5.
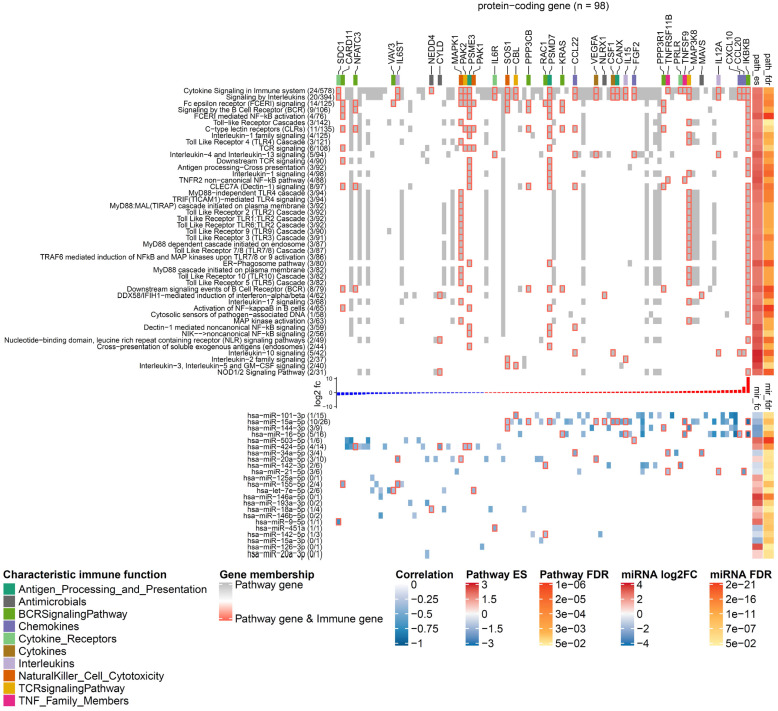
Landscape of miRNA-mediated DC gene regulation in immune signalling pathways. The heat map has two components that share a set of columns corresponding to 98 DE protein-coding genes that are targeted by the DE miRNAs. In the upper component, rows represent pathways from the category immune system, and grid cell colours indicate whether a protein-coding gene is involved in the pathway (grey), involved in the pathway and an immune gene (grey grid cells with red borders), or not involved in the pathway (white). The figures next to a pathway name indicate how many DE immune genes (left) and how many protein-coding genes found in our RNA-seq data (right) belong to it. The top annotation highlights genes with different characteristic immune function using a colour code. The annotation on the right side shows the statistics of the gene set enrichment analysis including the enrichment score and the FDR. The bar plot between the heat map components shows the log2 fold-change of the genes in caIKK-DCs (blue: downregulated; red: upregulated). In the lower component, the rows represent the ranking miRNAs in immune system (from high to low) and the grid cells show the regulative influence of a protein-coding gene by a miRNA, which is estimated by the Pearson correlation coefficients between their expression profiles. If a gene is a known immune gene, the corresponding grid cell has a red border. The numbers in the parentheses next to the miRNA names show the number of DE immune genes and the number of DE protein-coding genes that are regulated by a miRNA. The right annotation shows the results of the differential expression analysis including the log2 fold-change of miRNA expressions and their FDRs. For lack of space, we show only enriched pathways with more than 30 protein-coding genes picked up in the RNA-seq data, and in each pathway, only a subset of protein-coding genes that are estimated to be strongly influenced by the miRNAs (Pearson correlation ≤ -0.3) are shown. The complete landscape of miRNA-gene interactions in immune system is shown in Supplementary Figure S7.

