Abstract
Background:
The prognosis of patients with osteosarcoma is still poor due to the lack of effective prognostic markers. The EMT (epithelial–mesenchymal transition) serves as a promoter in the progression of osteosarcoma. This study systematically analyzed EMT-related genes to explore new markers for predicting the prognosis of osteosarcoma.
Methods:
RNA-Seq data and clinical information were obtained from the GEO database; GSVA and GSEA analysis were used to enrich pathways related to osteosarcoma progression; LASSO method analysis was used to construct the prognosis risk signature. The “Nomogram” package generated the risk prediction nomogram, and its clinical applicability was evaluated by decision curve analysis (DCA).
Results:
GSVA and GSEA analysis showed that the EMT signaling pathway was closely related to osteosarcoma progression. A 9-genes signature (LAMA3, LGALS1, SGCG, VEGFA, WNT5A, MATN3, ANPEP, FUCA1, and FLNA) was constructed. The overall survival (OS) of the high-risk scores group was significantly lower than the low-risk scores group. The 9-gene signature demonstrated good predictive accuracy. Cox regression analysis showed that the 9-gene signature provided independent prognostic factors for osteosarcoma patients. In addition, the predictive nomogram model could effectively predict the prognosis of osteosarcoma patients.
Conclusion:
This study constructed a 9-gene signature as a new prognostic marker to predict osteosarcoma patients’ survival.
Keywords: osteosarcoma, GSVA, EMT, nine gene, prognostic markers
Introduction
Osteosarcoma is the most common malignant tumor in children and adolescents,1 and at present, is treated mainly by surgery, radiotherapy, and chemotherapy.2 Unfortunately, these established treatments have not significantly improved the survival rate of local and metastatic osteosarcoma. Furthermore, with the widespread use of drugs and the evolution of the disease, tolerance has emerged, seriously affecting osteosarcoma prognosis.3,4 Therefore, research on the molecular mechanism of osteosarcoma development and searching for new possible molecular therapeutic targets and prognostic criteria have become key measures to improve the prognosis of osteosarcoma patients.
Epithelial-mesenchymal transitions (EMTs) play key roles in tumor progression, metastasis, and fibrosis.5 In this process, epithelial-derived cells can acquire the characteristics of mesenchymal cells, including loss of cell-cell contact and cell-basement membrane contact, changes in cell morphology, and expression of related proteins.6,7 Specifically, the monolayer of cuboidal epithelial cells with polarity will be transformed into spindle-shaped mesenchymal-like cells with migration ability. Substantial evidence has indicated that EMTs are related to infiltration and progression of various malignant tumors, including osteosarcoma.8,9 Thus it is critical to investigate the clinical relevance of EMT-related genes in osteosarcoma and its relationship to prognosis. For example, studies have shown that overexpression of EMT-related transcription factors (such as Twist, Snails, and Zebs) is related to the complex pathogenesis and osteosarcoma prognosis.8,10 However, more research is needed to systematically clarify the EMT phenotype of GBM and how it relates to prognosis.
In our study, datasets from the GEO database showed that the EMT signaling pathway was significantly enriched in osteosarcoma. We constructed a Cox-LASSO regression model based on EMT-related genes in osteosarcoma. The results showed that the 9-gene signature was independent of prognostic factors for osteosarcoma patients. These results highlighted the functional role of the EMT-related gene signature and revealed potential biomarkers for osteosarcoma.
Materials and Methods
Data Downloading and Preprocessing
A) Data were retrieved from the GEO (Gene Expression Omnibus) using the keyword “Osteosarcoma,” and the scope was narrowed to “Homo sapiens.” Finally, the GSE11416 and GSE126209 cohorts were included for further analysis.
B) The RNA-Seq data of osteosarcoma OS, TPM data, and clinical information were downloaded from the Target database (https://ocg.cancer.gov/).
GSVA and GSEA Enrichment Analysis
GSVA enrichment analysis was performed on the GSE11416 and GSE126209 cohorts. The reference gene sets were the hallmark gene sets, the threshold was P < 0.05, and | log2FC | > 1. GSVA enrichment analysis was performed using the “GSVA” package to identify the up- and down-regulated pathways.
Construction of the LASSO Regression Model Based on Pathway-Related and Prognosis-Related Genes
The Target training cohort was selected for model construction. The LASSO method is a compression estimation that obtains a more refined model by constructing a penalty function, which forces it to compress some coefficients and set some coefficients to zero. Therefore, the advantage of subset shrinkage is retained. This method produces a biased estimation for processing data with multicollinearity that can realize the selection of variables while estimating parameters and better solve the multicollinearity problem in regression analysis. We used the R package glmnet to perform Cox-LASSO regression analysis. The corresponding λ value when the maximum value of CVL (λ) was selected as the optimal λ value for constructing the LASSO regression model.
Construction of 9-Gene Univariate and Multivariate Cox Models
Univariate and multivariate Cox regression analyses were performed on gene expression profiles according to clinical information such as risk score, age, gender, metastasis, and primary site. The hazard ratio (HR) and 95% confidence intervals were calculated. P < 0.05 was selected as the statistical threshold.
Assessment of the Impact of Confounding Factors on the 9-Gene Risk Score Model
Data were classified into different categories according to significant clinical factors to exclude the impacts of confounding factors. The Survival package in R software was utilized for survival analysis.
Evaluation of the Clinical Applicability of the 9-Gene Signature
The rms, survival, and nomogram packages in R software (version 3.62) were utilized to generate a risk prediction nomogram that integrated 9-gene risk score, age, gender, whether transferred and the original site.
Results
Flowchart
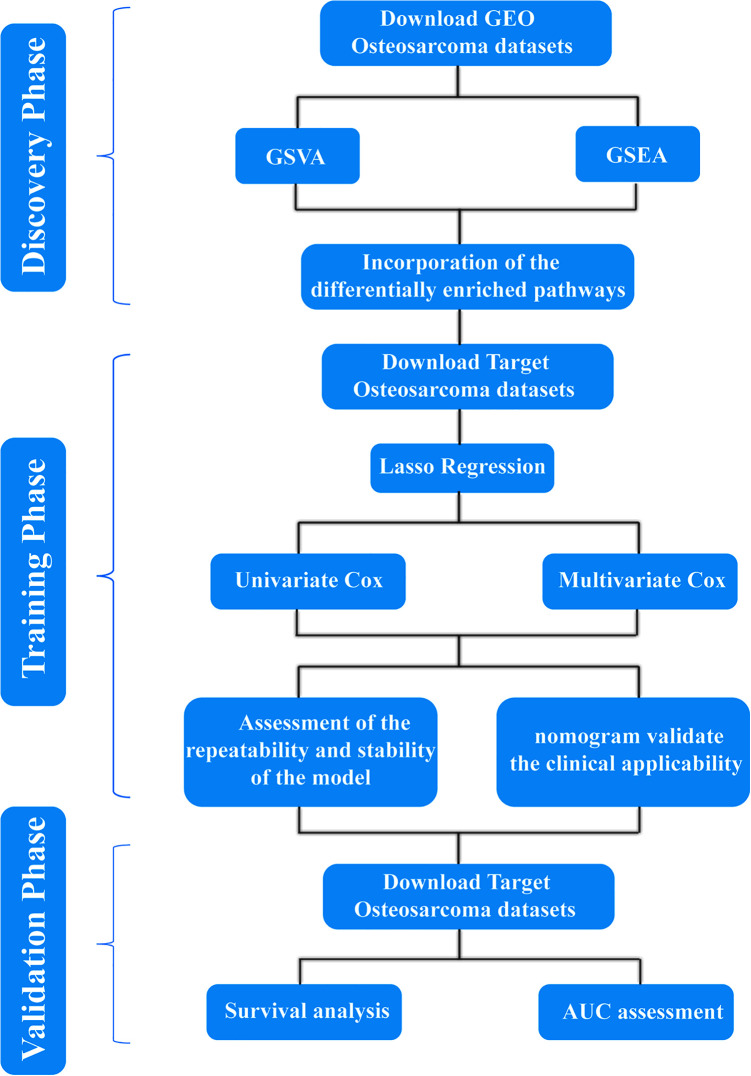
A flow chart of the entire study is provided in Figure 1.
Figure 1.
Flowchart.
Data Downloading and Preprocessing
Chips from the GPL20301 and GPL4091 chip platforms were selected. The GSE126209 (https://www.ncbi.nlm.nih.gov/geo/query/acc.cgi?acc=GSE126209) and GSE11416 cohorts (https://www.ncbi.nlm.nih.gov/geo/query/acc.cgi?acc=GSE11416) were downloaded and cleaned. GSE126209 contained tumor samples of osteosarcoma, para-cancerous samples, and paired serum samples. After data cleaning, a total of 25145 genes and 11 samples remained. As shown in S_Figure1, the expression of all samples was on the same level after correction, indicating that these samples demonstrated good homogenization. Genes with missing values were excluded.
GSVA and GSEA Enrichment Analysis
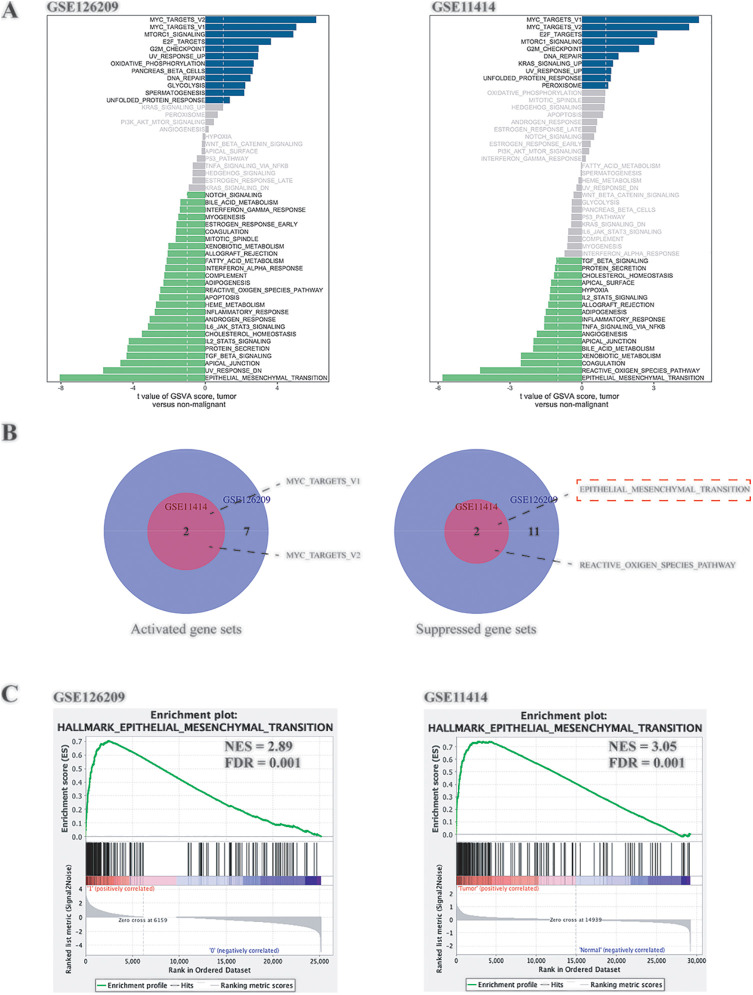
As shown in Figure 2A, the abscissa was the T value, and the ordinate was the different pathways. The Venn diagrams (Figure 2B) were drawn based on the intersection of up-regulated and down-regulated pathways of the 2 cohorts. The EMT pathway was a pathway with a difference (suppressed) in both cohorts and with the largest T value, so it was selected as the target pathway for subsequent analysis. Similarly, hallmark gene sets were used as reference gene sets, and Java GSEA was used to perform GSEA analysis on the 2 cohorts. The results still showed that EMT changed significantly between groups. The normalized enrichment scores (NES) of the 2 cohorts were 2.89 and 3.05, respectively, and false discovery rates (FDRs) were all 0.01.
Figure 2.
GSVA and GSEA analysis of the GEO cohorts. A, GSVA analysis of GSE126209 and GSE11414. B, The intersection of the differentially expressed pathways of the 2 cohorts. C, GSEA enrichment analysis of GSE126209 and GSE11414.
Construction of the LASSO Regression Model Based on EMT Pathway Genes
The Target database provided 101 sequencing samples and expression information on 25054 mRNAs. Samples without clinical prognosis information and with gene expression levels < 1 were excluded. The samples were randomly divided 6:4 using the caret package (60% were used for training, and 40% for validation).
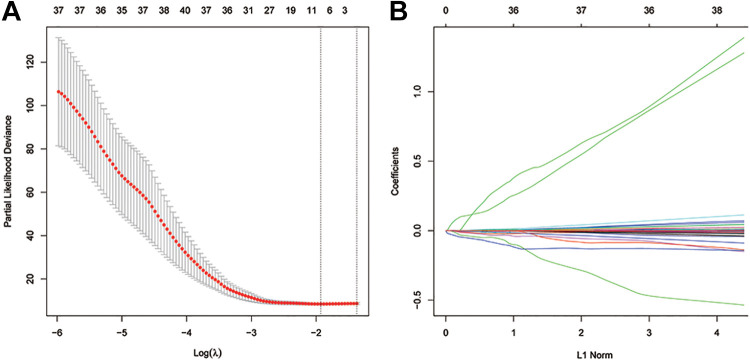
LASSO analysis was performed on 199 genes in the EMT pathway (Figure 3).
Figure 3.
Construction of the LASSO regression model. A, Selection of the optimal λ value. B, Coefficient diagram of different genes in LASSO regression.
We first analyzed each independent variable’s change trajectory, as shown in Figure 3B, in which we observe a gradual reduction of lambda, and the number of independent variable coefficients tending toward 0 gradually increases. We use 10-fold cross-validation to build the model and analyze the confidence interval under each lambda, as shown in Figure 3A. When log (λ) corresponds to 9 genes, the model is the most stable. These 9 genes are LAMA3, LGALS1, SGCG, VEGFA, WNT5A, MATN3, ANPEP, FUCA1, and FLNA. Based on the expression profile of the 9 genes, the risk-score formula was as follows: risk score = (−0.00575 * expression level of LAMA3) + (−0.00014 * expression level of LGALS1) + (0.0565 * expression level of SGCG) + (0.00151 * expression level of VEGFA) + (−0.00199 * expression level of WNT5A) + (−0.00069 * expression level of MATN3) + (−0.00117 * expression level of ANPEP) + (−0.03087 * expression level of FUCA1) + (−0.00017 * expression level of FLNA).
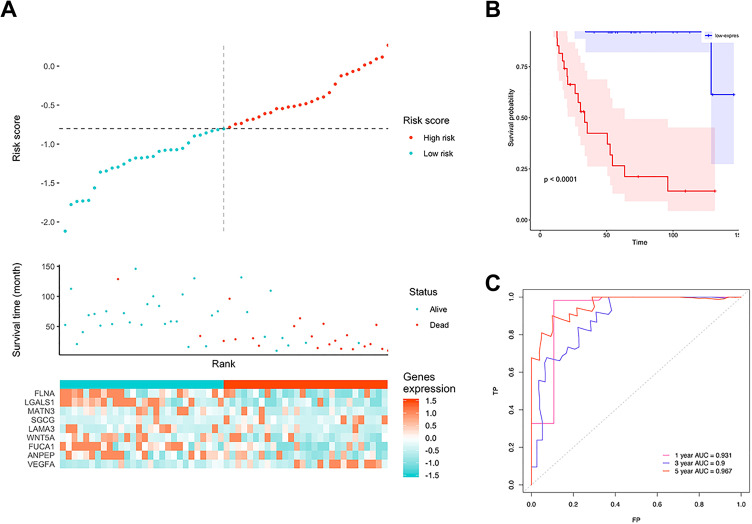
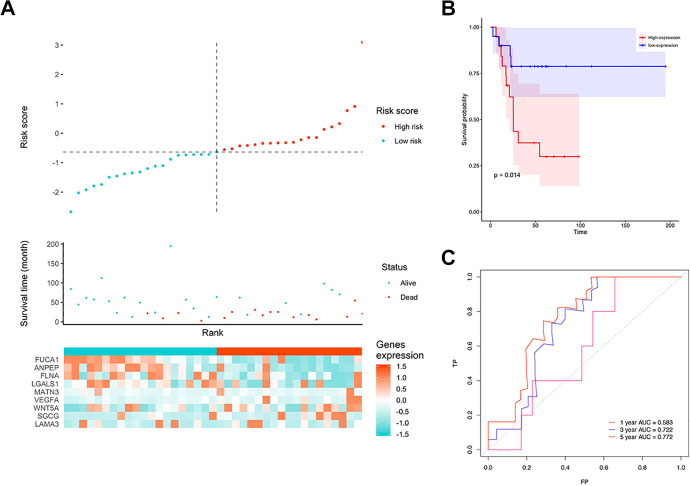
The signature risk scores of each patient in the training cohort were calculated. Samples were divided into a low-risk group (n = 49) and a high-risk group (n = 49) using the median risk score as the cutoff. Figure 4A shows the relationship between 9 gene expression, risk score, and survival time. Figure 4B shows that patients in the high-risk group had worse prognoses than those in the low-risk group (P < 0.001). The ROC curve showed that 3-year AUC was 0.90, and the 5-year AUC was 0.967 (Figure 4C). In the validation cohort, a similar trend was observed; the 5-year AUC was above 0.77, and the risk score could still significantly distinguish patients’ prognosis (P = 0.014) (Figure 5A-C), indicating that this model had good stability.
Figure 4.
The performance of the model in the training cohort. A, Distribution of risk score. B, Survival analysis of 9-gene signature in the training cohort. Red line: high-risk group; blue line: low-risk group. C, 1-, 3-, 5-year AUC in the training cohort.
Figure 5.
The performance of the model in the testing cohort. A, Distribution of risk score. B, Survival analysis of 9 gene signature in the testing cohort. Red line: high-risk group; blue line: low-risk group. C, 1-, 3-, 5-year AUC in the testing cohort.
Construction of 9-Gene Univariate and Multivariate Cox Models
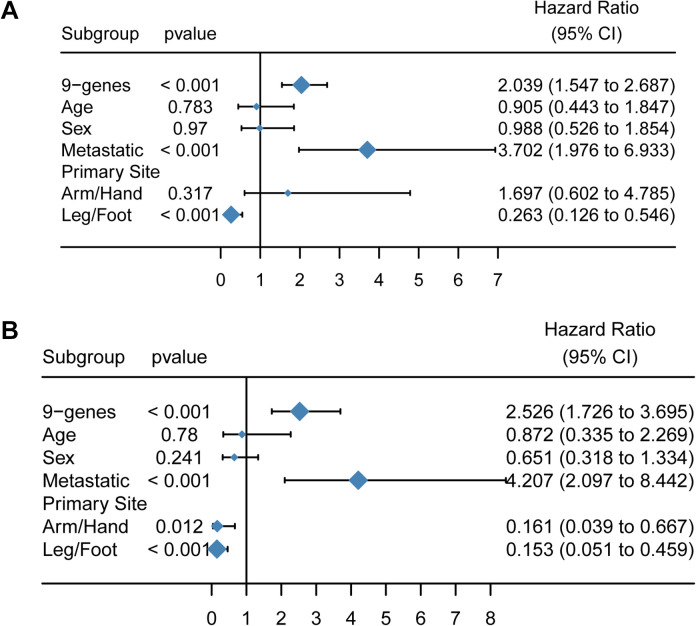
As shown in Figure 6, the 9-gene signature demonstrated the greatest statistical significance (P < 0.001, and the hazard ratio was 2.039 (1.547–2.687). The HR of metastases was 3.702 (19.76–6.933), indicating that it had a significant impact on prognosis (P < 0.05). Both age and gender had no significant effect on prognosis (P > 0.05).
Figure 6.
Construction of 9-gene univariate and multivariate Cox models. A, Forest plot of the univariate Cox model. B, Forest plot of the multivariate Cox model.
Assessment of the Impact of Confounding Factors on the 9-Gene Risk Score Signature
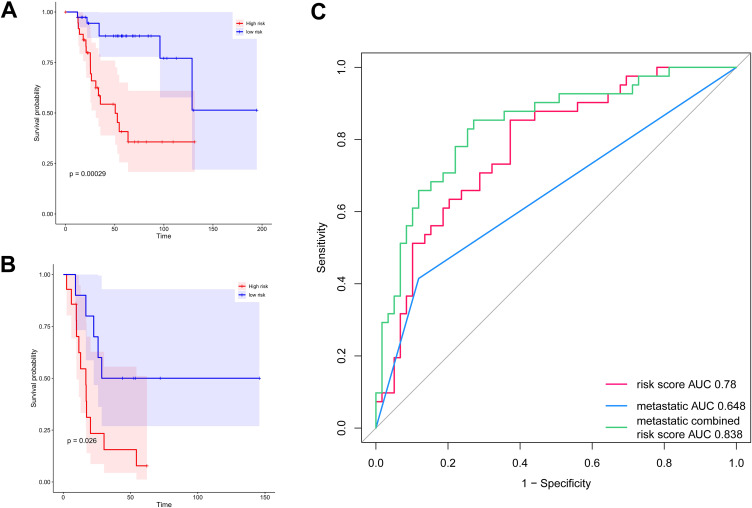
The data were divided into metastatic and non-metastatic groups for subgroup survival analysis to eliminate the confounding factors of metastasis. The results showed that after excluding metastasis, there was still a significant difference in survival between the 2 groups (Figure 7A-B, P < 0.05). The ROC curve showed that the AUC of the 9-gene risk score was 0.78, the AUC of metastases was 0.648, and the AUC of metastases combined risk score was 0.838, indicating that the combination of the two can improve the prediction performance of the model (Figure 7C).
Figure 7.
Assessment of the impact of confounding factors on the 9-gene signature. A, The survival curve of the 9-gene risk score in the non-metastatic group. B, The survival curve of the 9-gene risk score in the metastatic group. The abscissa represents survival time, and the ordinate represents the survival rate. C, ROC analysis of the survival prediction by the 9-gene signature.
Evaluation of the Clinical Applicability of the 9-Gene Model
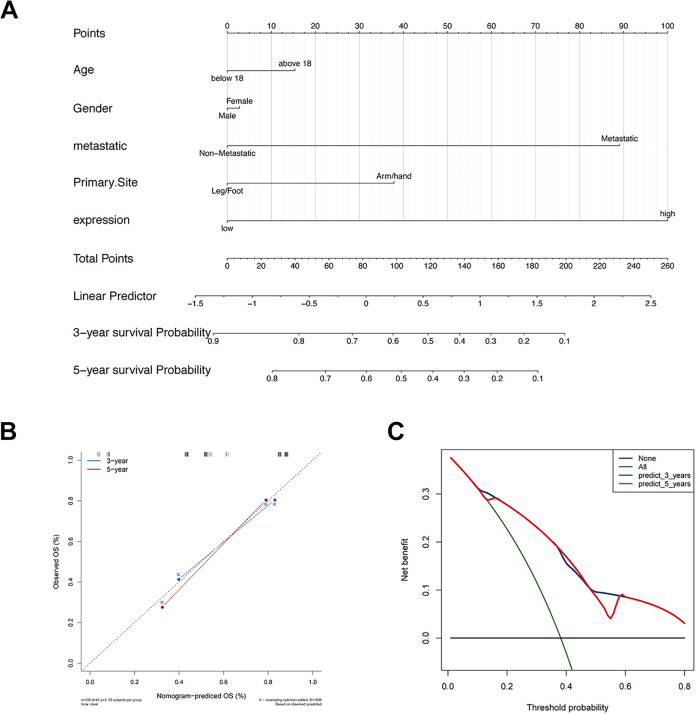
The risk prediction nomogram (Figure 8A) was generated by the rms package, which integrated the 9-gene signature, age, gender, metastasis, and primary site. Calibration plots were used to visualize the performances of the nomograms. The 45° line represented the best prediction. Calibration plots showed that the nomogram performed well (Figure 8B). The DCA curve was used to evaluate its clinical applicability, and 3-y, 5-y survival; the net benefits were both higher (Figure 8C).
Figure 8.
Evaluation of the clinical applicability of the 9-gene model. A, The nomogram for predicting the proportion of patients with 3-year and 5-year OS. B, The calibration plots for predicting patient 3-year and 5-year OS. C, Decision curve analysis (DCA) for assessment of the clinical utility of the nomogram.
Validation of Expression of the Gene Signature
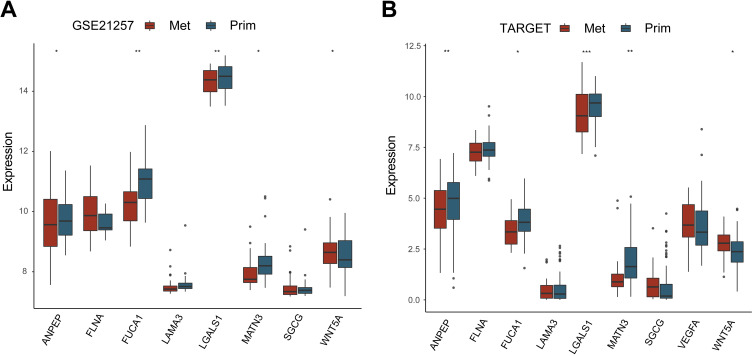
We used GSE21257 and TARGET database to verify the gene expression (VEGFR gene was not found in GSE21257 cohort). The results showed that the WNT5A gene was significantly highly expressed in metastatic tissues in the 2 datasets (Figure 9A). ANPEP, FUCA1, LGALS1, and MATN3 demonstrated significantly low expression in metastatic tissues in the 2 datasets (Figure 9B).
Figure 9.
Validation of expression of gene signature. A, Gene expression in the GEO database. B, Gene expression in the Target database. Abscissa represents gene symbol, ordinate represents gene expression.* means P < 0.05; ** means P < 0.01; *** means P < 0.001.
Discussion
Osteosarcoma is a highly malignant bone mesenchymal tumor; its tumor cells can produce osteoid and fibrillar matrices and are highly invasive.11 Advances in modern treatment, such as chemotherapy, surgery, a combination of neoadjuvant chemotherapy, and optimized surgical methods, significantly improve the 5-year survival rate of patients with osteosarcoma.12 However, about one-third of patients with metastases or relapses still have a poor prognosis. Therefore, it is crucial to develop a comprehensive and multidimensional treatment for osteosarcoma. Anti-tumor angiogenesis, pro-tumor cell apoptosis, gene therapy of viral vectors, immunotherapy, and other treatments have been initially applied in osteosarcoma patients, yet their effectiveness is still unclear.13,14 Therefore, it is necessary to explore the molecular mechanisms and signaling pathways related to the progression and metastasis of osteosarcoma to improve prognoses. In this study, the most important signaling pathways were identified by GSEA and GSVA. The EMT signal pathway was identified as the most important pathway in both GEO cohorts (GSE126209 and GSE11416). These results suggest that the EMT signaling pathway played a key role in the progression of osteosarcoma. EMT is the core step in tumor recurrence and metastasis. It is a complex, multi-step process, with multiple participating factors.15 A single molecule cannot reflect the EMT status of the tumor.16 Therefore, a comprehensive analysis of EMT-related genes is needed to define cell status and evaluate the relationship between EMT and osteosarcoma’s progression and prognosis.
A large number of studies have reported many single-molecule biomarkers, but only a few indicators have been clinically applied.17-19 The predictive effect of polygenic markers has been highlighted.20 In this study, the Cox-LASSO regression model was used to construct an EMT-related gene signature related to osteosarcoma prognosis by using the Target cohorts. The 9-gene model included: LAMA3, LGALS1, SGCG, VEGFA, WNT5A, MATN3, ANPEP, FUCA1, and FLNA. LAMA3 encodes a laminin and has been shown to be closely related to the prognosis of patients with ovarian cancer21 and pancreatic cancer.22 LGALS1 is a widely studied galectin, and a large number of studies have confirmed that it is closely associated with the prognosis of various solid tumor patients.23-25 SGCG encoded gamma (γ)-sarcoglycan is one of several sarcolemmal transmembrane glycoproteins that interact with dystrophinone. It has been found to be closely related to the prognosis of colon cancer patients.26 VEGFA is a member of the PDGF/VEGF growth factor family and encodes heparin-binding protein. This growth factor induced the proliferation and migration of vascular endothelial cells and is essential for both physiological and pathological angiogenesis. WNT5A is an important member of the WNT family and is closely related to embryonic development and tumorigenesis. It has proven to be a prognostic marker for various tumors such as liver cancer,27 renal clear cell carcinoma,28 and prostate cancer.29 The protein encoded by MATN3 is present in the extracellular matrix of cartilage and plays an important role in developing cartilage and bone and homeostasis in vivo, and is closely related to the prognosis of patients with gastric cancer.30,31 ANPEP encodes an aminopeptidase and is a prognostic marker for gallbladder cancer,32 prostate cancer,33 and glioma.34 The protein encoded by the FUCA1 gene is a lysosomal enzyme that participates in the degradation of glycoproteins and glycolipids in fucose-containing cells, and is a prognostic marker for patients with liver and breast cancer.35,36 FLNA encodes an actin-binding protein and has been proven to be a prognostic marker for liver cancer,37,38 prostate cancer,39 and cervical cancer.40
After constructing the EMT-related gene signature, the prognostic value of the 9-gene model was further validated in the validation cohort. KM analysis and ROC curve showed its satisfactory predictive performance. Univariate and multivariate Cox analysis found that the 9-gene model and pathological M stage were the only 2 independent prognostic factors. Metastasis is the main factor affecting the prognosis of osteosarcoma patients. To exclude the impact of metastasis on the 9-gene model, we conducted subgroup analysis, and the results showed that the model could readily distinguish the prognosis of patients in both subgroups. Finally, the nomogram was used as a predictive tool for evaluating prognoses, and it demonstrated an ability to predict the individualized possibility of clinical events by integrating various prognostic factors. A nomogram combining pathological features with the 9-gene model was constructed in this study, and performed better in survival prediction. The calibration curve and results of DCA also proved its good performance.
Although this study was based on large sample multi-omics data, it did have some limitations. This study’s conclusions were mainly based on bioinformatics analysis; thus, further validation by in vivo and in vitro experiments is still needed. Second, other clinical features that might also affect patients’ prognosis were not included in this study. Finally, samples in this research were all from retrospective studies, and it will be necessary to conduct comprehensive experimental research for its clinical applications.
In conclusion, our research results indicate that the 9-gene prognostic model is a reliable tool for predicting the overall survival of osteosarcoma patients, and a nomogram comprising a prognostic model can assist clinicians in selecting personalized treatment for patients with osteosarcoma.
Supplemental Material
Supplement_Figure1 for Identification of 9-Gene Epithelial–Mesenchymal Transition Related Signature of Osteosarcoma by Integrating Multi Cohorts by Zhang Yiqi, Liu Ziyun, Fu Qin, Wang Xingli and Yang Liyu in Technology in Cancer Research & Treatment
Footnotes
Declaration of Conflicting Interests: The author(s) declared no potential conflicts of interest with respect to the research, authorship, and/or publication of this article.
Funding: The author(s) disclosed receipt of the following financial support for the research, authorship, and/or publication of this article: This study was supported by grants from Guiding Plan of Scientific Research Foundation of Liaoning Province (No. 2019-ZD-0761) and 60 talent team construction of Shengjing Hospital of China Medical University (M0452).
ORCID iD: Yang Liyu  https://orcid.org/0000-0003-0497-1819
Supplemental Material: Supplemental material for this article is available online.
References
- 1. Roberts RD, Lizardo MM, Reed DR, et al. Provocative questions in osteosarcoma basic and translational biology: a report from the Children’s Oncology Group. Cancer. 2019;125(20):3514–3525. [DOI] [PMC free article] [PubMed] [Google Scholar]
- 2. Carina V, Costa V, Sartori M, et al. Adjuvant biophysical therapies in osteosarcoma. Cancers (Basel). 2019;11(3):348. [DOI] [PMC free article] [PubMed] [Google Scholar]
- 3. Kager L, Tamamyan G, Bielack S. Novel insights and therapeutic interventions for pediatric osteosarcoma. Future Oncology (London, England). 2017;13:357–368. [DOI] [PubMed] [Google Scholar]
- 4. Kansara M, Teng MW, Smyth MJ, Thomas DM. Translational biology of osteosarcoma. Nat Rev Cancer. 2014;14(11):722–735. [DOI] [PubMed] [Google Scholar]
- 5. Mittal V. Epithelial mesenchymal transition in tumor metastasis. Annu Rev Pathol. 2018;13:395–412. [DOI] [PubMed] [Google Scholar]
- 6. Davis FM, Stewart TA, Thompson EW, Monteith GR. Targeting EMT in cancer: opportunities for pharmacological intervention. Trends Pharmacol Sci. 2014;35(9):479–88. [DOI] [PubMed] [Google Scholar]
- 7. Aiello NM, Kang Y. Context-dependent EMT programs in cancer metastasis. J Exp Med. 2019;216(5):1016–1026. [DOI] [PMC free article] [PubMed] [Google Scholar]
- 8. Yang G, Yuan J, Li K. EMT transcription factors: implication in osteosarcoma. Med Oncol (Northwood, London, England). 2013;30(4):697. [DOI] [PubMed] [Google Scholar]
- 9. Shi D, Wu F, Mu S, et al. LncRNA AFAP1-AS1 promotes tumorigenesis and epithelial-mesenchymal transition of osteosarcoma through RhoC/ROCK1/p38MAPK/Twist1 signaling pathway. J Exp Clin Cancer Res. 2019;38(1):375. [DOI] [PMC free article] [PubMed] [Google Scholar]
- 10. Wushou A, Hou J, Zhao Y-J, Shao Z-M. Twist-1 up-regulation in carcinoma correlates to poor survival. Int J Mol Sci. 2014;15(12):21621–21630. [DOI] [PMC free article] [PubMed] [Google Scholar]
- 11. Fan TM, Roberts RD, Lizardo MM. Understanding and modeling metastasis biology to improve therapeutic strategies for combating osteosarcoma progression. Front Oncol. 2020;10:13. [DOI] [PMC free article] [PubMed] [Google Scholar]
- 12. Castillo-Tandazo W, Mutsaers AJ, Walkley CR. Osteosarcoma in the post genome era: preclinical models and approaches to identify tractable therapeutic targets. Curr Osteoporos Rep. 2019;17(5):343–352. [DOI] [PubMed] [Google Scholar]
- 13. Otoukesh B, Boddouhi B, Moghtadaei M, Kaghazian P, Kaghazian M. Novel molecular insights and new therapeutic strategies in osteosarcoma. Cancer Cell Int. 2018;18:158. [DOI] [PMC free article] [PubMed] [Google Scholar]
- 14. Hattinger CM, Patrizio MP, Tavanti E, et al. Genetic testing for high-grade osteosarcoma: a guide for future tailored treatments? Expert Rev Mol Diagn. 2018;18(11):947–961. [DOI] [PubMed] [Google Scholar]
- 15. Dean DC, Shen S, Hornicek FJ, Duan Z. From genomics to metabolomics: emerging metastatic biomarkers in osteosarcoma. Cancer Metastasis Rev. 2018;37(4):719–731. [DOI] [PubMed] [Google Scholar]
- 16. Wang D, Niu X, Wang Z, et al. Multiregion sequencing reveals the genetic heterogeneity and evolutionary history of osteosarcoma and matched pulmonary metastases. Cancer Res. 2019;79(1):7–20. [DOI] [PubMed] [Google Scholar]
- 17. Wagner F, Holzapfel BM, Martine LC, et al. A humanized bone microenvironment uncovers HIF2 alpha as a latent marker for osteosarcoma. Acta Biomaterialia. 2019;89:372–381. [DOI] [PubMed] [Google Scholar]
- 18. Bottani M, Banfi G, Lombardi G. Circulating miRNAs as diagnostic and prognostic biomarkers in common solid tumors: focus on lung, breast, prostate cancers, and osteosarcoma. J Clin Med. 2019;8(10):1661. [DOI] [PMC free article] [PubMed] [Google Scholar]
- 19. Jiang-Jiang Q. Is CDK9 a promising target for both primary and metastatic osteosarcoma? EBioMedicine. 2019;40:27–28. [DOI] [PMC free article] [PubMed] [Google Scholar]
- 20. Pfeil J, Sanders LM, Anastopoulos I, et al. Hydra: a mixture modeling framework for subtyping pediatric cancer cohorts using multimodal gene expression signatures. PLoS Comput Biol. 2020;16(4):e1007753. [DOI] [PMC free article] [PubMed] [Google Scholar]
- 21. Zhang Z, Li Z, Deng M, et al. Downregulation of GPSM2 is associated with primary resistance to paclitaxel in breast cancer. Oncol Rep. 2020;43(3):965–974. [DOI] [PMC free article] [PubMed] [Google Scholar]
- 22. Lu Y, Li C, Chen H, Zhong W. Identification of hub genes and analysis of prognostic values in pancreatic ductal adenocarcinoma by integrated bioinformatics methods. Mol Biol Rep. 2018;45(6):1799–1807. [DOI] [PubMed] [Google Scholar]
- 23. Thijssen VL, Heusschen R, Caers J, Griffioen AW. Galectin expression in cancer diagnosis and prognosis: a systematic review. Biochimica Et Biophysica Acta. 2015;1855(2):235–247. [DOI] [PubMed] [Google Scholar]
- 24. Wu R, Wu T, Wang K, et al. Prognostic significance of galectin-1 expression in patients with cancer: a meta-analysis. Cancer Cell Int. 2018;18:108. [DOI] [PMC free article] [PubMed] [Google Scholar]
- 25. Chetry M, Thapa S, Hu X, et al. The role of galectins in tumor progression, treatment and prognosis of gynecological cancers. J Cancer. 2018;9(24):4742–4755. [DOI] [PMC free article] [PubMed] [Google Scholar]
- 26. Yang H, Liu H, Hong-Cheng L, et al. Association of a novel seven-gene expression signature with the disease prognosis in colon cancer patients. Aging. 2019;11(19):8710–8727. [DOI] [PMC free article] [PubMed] [Google Scholar]
- 27. Wang L, Yao M, Fang M, et al. Expression of hepatic Wnt5a and its clinicopathological features in patients with hepatocellular carcinoma. Hepatobiliary Pancreat Dis Int. 2018;17(3):227–232. [DOI] [PubMed] [Google Scholar]
- 28. Shen C, Liu J, Wang J, et al. Development and validation of a prognostic immune-associated gene signature in clear cell renal cell carcinoma. Int Immunopharmacol. 2020;81:106274. [DOI] [PubMed] [Google Scholar]
- 29. Fisher RR, Pleskow HM, Bedingfield K, Miyamoto DT. Noncanonical Wnt as a prognostic marker in prostate cancer: “you can’t always get what you Wnt”. Expert Rev Mol Diagn. 2020;20(2):245–54. [DOI] [PubMed] [Google Scholar]
- 30. Ping-Li W, Yi-Fu H, Han-Hui Y, Hu B. Martrilin-3 (MATN3) overexpression in gastric adenocarcinoma and its prognostic significance. Med Sci Monit. 2018;24:348–55. [DOI] [PMC free article] [PubMed] [Google Scholar]
- 31. Zhang C, Liang Y, Ming-Hui M, Kun-Zhe W, Dong-Qiu D. KRT15, INHBA, MATN3, and AGT are aberrantly methylated and differentially expressed in gastric cancer and associated with prognosis. Pathol Res Pract. 2019;215(5):893–899. [DOI] [PubMed] [Google Scholar]
- 32. Liu Z, Yang Z, Xiong L, Li D, Zou Q, Yuan Y. ACO2 and ANPEP as novel prognostic markers for gallbladder squamous cell/adenosquamous carcinomas and adenocarcinomas. Int J Clin Oncol. 2020;25(7):1346–1355. [DOI] [PubMed] [Google Scholar]
- 33. Sørensen KD, Abildgaard MO, Haldrup C, et al. Prognostic significance of aberrantly silenced ANPEP expression in prostate cancer. Br J Cancer. 2013;108(2):420–428. [DOI] [PMC free article] [PubMed] [Google Scholar]
- 34. Sun X, Liu X, Xia M, Shao Y, Zhang XD. Multicellular gene network analysis identifies a macrophage-related gene signature predictive of therapeutic response and prognosis of gliomas. J Transl Med. 2019;17(1):159. [DOI] [PMC free article] [PubMed] [Google Scholar]
- 35. Hass HG, Hass H, Jobst J, Scheurlen M, Vogel U, Nehls O. Gene expression analysis for evaluation of potential biomarkers in hepatocellular carcinoma. Anticancer Res. 2015;35(4):2021–2028. [PubMed] [Google Scholar]
- 36. Milde-Langosch K, Karn T, Schmidt M, et al. Prognostic relevance of glycosylation-associated genes in breast cancer. Breast Cancer Res Treat. 2014;145(2):295–305. [DOI] [PubMed] [Google Scholar]
- 37. Ai J, Huang H, Lv X, et al. FLNA and PGK1 are two potential markers for progression in hepatocellular carcinoma. Cell Physiol Biochem. 2011;27(3-4):207–216. [DOI] [PubMed] [Google Scholar]
- 38. Xing X, Yuan H, Sun Y, et al. ANXA2 and FLNA phosphorylation associate with poor prognosis in hepatic carcinoma revealed by quantitative phosphoproteomics analysis. J Proteomics. 2019;200:111–122. [DOI] [PubMed] [Google Scholar]
- 39. Ravipaty S, Wu W, Dalvi A, et al. Clinical validation of a serum protein panel (FLNA, FLNB and KRT19) for diagnosis of prostate cancer. J Mol Biomark Diagn. 2017;8(2):323. [DOI] [PMC free article] [PubMed] [Google Scholar]
- 40. Yan-Ze J, Chang-Zhu P, Lan-Ying W. FLNA is a predictor of chemoresistance and poor survival in cervical cancer. Biomark Med. 2016;10(7):711–719. [DOI] [PubMed] [Google Scholar]
Associated Data
This section collects any data citations, data availability statements, or supplementary materials included in this article.
Supplementary Materials
Supplement_Figure1 for Identification of 9-Gene Epithelial–Mesenchymal Transition Related Signature of Osteosarcoma by Integrating Multi Cohorts by Zhang Yiqi, Liu Ziyun, Fu Qin, Wang Xingli and Yang Liyu in Technology in Cancer Research & Treatment


