

Abstract
Local and systemic factors that influence renal structure and function in aging are not well understood. The secretory protein C1q/TNF-related protein 1 (CTRP1) regulates systemic metabolism and cardiovascular function. We provide evidence here that CTRP1 also modulates renal physiology in an age- and sex-dependent manner. In mice lacking CTRP1, we observed significantly increased kidney weight and glomerular hypertrophy in aged male but not female or young mice. Although glomerular filtration rate, plasma renin and aldosterone levels, and renal response to water restriction did not differ between genotypes, CTRP1-deficient male mice had elevated blood pressure. Echocardiogram and pulse wave velocity measurements indicated normal heart function and vascular stiffness in CTRP1-deficient animals, and increased blood pressure was not due to greater salt retention. Paradoxically, CTRP1-deficient mice had elevated urinary sodium and potassium excretion, partially resulting from reduced expression of genes involved in renal sodium and potassium reabsorption. Despite renal hypertrophy, markers of inflammation, fibrosis, and oxidative stress were reduced in CTRP1-deficient mice. RNA sequencing revealed alterations and enrichments of genes in metabolic processes in CTRP1-deficient animals. These results highlight novel contributions of CTRP1 to aging-associated changes in renal physiology.
Keywords: aging-associated renal physiology, C1q/TNF-related protein 1, kidney function
1 |. INTRODUCTION
Aging is a complex process that impacts multi-organ systems, including cardiovascular and renal functions.1–3 Given the integrative nature of physiological processes, changes in one organ and tissue during aging are likely to affect others. For instance, aging promotes vascular stiffness, which elevates systolic blood pressure4 and, in turn, triggers a renal response to restore vascular homeostasis.5 Due to the complex nature of tissue crosstalk, aging-associated changes in organ function or dysfunction are multifactorial and not well understood.
Inter-organ communications are largely mediated by secreted factors that circulate in plasma. Secreted proteins can exert local effects via autocrine or paracrine action, or systemic effects via endocrine mechanisms. Our efforts to identify novel regulators of metabolism have led to the identification and characterization of C1q/TNF-related proteins (CTRP1–15), secreted proteins of the C1q family conserved from fish to human.6–8 In vivo animal studies highlight important metabolic,9–25 cardiovascular,26–36 and inflammatory12,13,37–40 functions for multiple family members.
In humans and mice, CTRP1 (encoded by the gene C1QTNF1) is robustly expressed in adipose tissue and heart, with lower expression in other tissues.7 In vivo studies using recombinant protein infusion or genetic gain- and loss-of-function mouse models have established CTRP1’s role in regulating systemic glucose and lipid metabolism.14,19,24 Correlative human studies also support a role for CTRP1 as an adipokine with cardio-metabolic function. Elevated plasma levels of CTRP1 are found in patients with type 2 diabetes and metabolic syndrome,41–45 non-alcoholic fatty liver disease,46 coronary artery and heart disease,33,47–51 and hypertension.52,53 The direct causal or compensatory role of CTRP1 in human pathophysiology, however, is often unclear. Furthermore, the impact of CTRP1 deletion on cardiovascular function appears to be context-dependent. Whereas loss of CTRP1 exacerbates cardiac ischemia/reperfusion injury in mice,32 it attenuates atherosclerosis in apolipoprotein E-deficient animals.33
Whether CTRP1 has a role in organ systems beside adipose tissue, liver, skeletal muscle, and heart is unknown. In characterizing this protein more fully, we noted novel roles for CTRP1 in renal function in a Ctrp1 knockout (KO) mouse model.
2 |. MATERIALS AND METHODS
2.1 |. Animals
The Ctrp1/C1qtnf1 KO (−/−) mice generated for this study were previously described.19 Both wild-type (WT) and knockout (KO) mice are on C57BL6/J genetic background. All Ctrp1-KO (−/−) and WT (+/+) littermate controls were generated by intercrossing Ctrp1 heterozygous (+/−) mice. Male Ctrp1 KO mice and WT littermate controls were housed in polycarbonate cages on a 12-hour light-dark photocycle with ad libitum access to water and food. Mice were fed a control low-fat diet (LFD; 10% kcal derived from fat; D12450B, Research Diets, New Brunswick, NJ, USA) comparable to standard chow beginning at 6 weeks of age. For sodium-loading studies, WT C57BL/6J mice were maintained on a standard laboratory chow diet (0.29% sodium and 0.49% chloride; Purina Conventional Mouse Diet, LabDiet JL Rat/Mouse and Auto 6F No. 5K67), and then transitioned to a low-salt diet (LSD; 0.49% NaCl; TD.96208, Envigo Teklad Diets, East Millstone, NJ, USA) or high-salt diet (HSD; 4% NaCl; TD.92034, Envigo Teklad Diets) for 2 weeks. Additional salt-loading studies performed on LFD-fed Ctrp1-KO mice and WT littermates were conducted in a similar manner by transitioning to a LSD or HSD during the indicated time periods. For the angiotensin II (AngII)-induced high blood pressure model,54,55 C57BL/6J male and female mice were implanted with subcutaneous osmotic minipumps (Alzet 1004, Alzet, Cupertino, CA, USA) that delivered AngII (400 ng/kg/min) or vehicle control for 28 days. All animal protocols were approved by the Institutional Animal Care and Use Committee of The Johns Hopkins University School of Medicine (Protocol # MO16M431).
2.2 |. Tissue collection
Whole LSD and HSD kidney samples were immediately harvested from euthanized mice at 22 weeks of age and flash-frozen in liquid nitrogen. Homogenized tissue lysates were prepared in pre-chilled RIPA lysis buffer (50 mM Tris–HCl pH 7.4, 150 mM NaCl, 1 mM EDTA, 1% Triton × 100, and 0.25% deoxycholate) containing protease inhibitors (Complete Mini, Roche, Basel, Switzerland) and phosphatase inhibitors (PhosSTOP, Roche). Tissue lysates were centrifuged at 13 000 rpm for 20 minutes at 4°C. Supernatants were collected and protein content was quantified using the Pierce BCA Protein Assay Kit (Thermo Fisher Scientific, Waltham, MA, USA). CTRP1 protein concentration in the kidney was measured with a CTRP1 enzyme-linked immunosorbent assay (ELISA) (BioVendor R&D, Brno, Czech Republic). Kidney supernatants were diluted 1:20, according to the manufacturer’s instructions, and normalized to protein content. The same method was applied to assay CTRP1 concentration in AngII-treated kidney lysates.
2.3 |. Histology
For LacZ staining, excised WT and Ctrp1-KO mouse anatomical right kidneys were fixed in pre-chilled whole mount fixing media (0.2% glutaraldehyde, 5 mM EDTA, 5 mM MgCl2 in PBS) and incubated at 4°C for 1 hour. Kidneys were washed with pre-chilled PBS and then allowed to sink in 30% sucrose in PBS supplemented with 2 mM MgCl2 at 4°C. Kidneys were embedded in Tissue Plus OCT (Thermo Fisher Scientific). Kidney sections (8-μm thick) were mounted on positively charged glass microscope slides and allowed to dry overnight at room temperature. Sections were fixed in 4% paraformaldehyde/PBS for 10 minutes at 4°C. Slides were rinsed twice in PBS supplemented with 2 mM MgCl2 at 4°C. Slides were stained in Xgal reaction buffer (5 mM potassium ferricyanate, 5 mM potassium ferrocyanate, 1 mg/mL X-gal [reconstituted in DMF]) diluted in detergent wash buffer (2 mM MgCl2, 0.01% sodium deoxycholate, 0.01% NP-40, PBS pH 7.4) for 6 hours at 37°C. Sections were rinsed in PBS five times, covered with a cover slip, and imaged immediately using an EVOS Fl Auto Imaging System (Thermo Fisher Scientific).
2.4 |. Quantification of glomeruli and podocyte parameters
Glomeruli were quantified in a separate cohort of LFD-fed 46-week-old WT and Ctrp1-KO mice. Mice were subjected to a 2-hour food removal before anatomical right kidneys were excised and cut mid-coronally. Tissues were fixed overnight in 10% formalin at 4°C, followed by embedding in paraffin and sectioning at the Histology Reference Laboratory at The Johns Hopkins University School of Medicine. To detect podocyte nuclei, rabbit monoclonal anti-p57/Kip2 (Abcam, Cambridge, MA) was used to stain formalin-fixed paraffin-embedded tissue sections on an automated stainer (Lab Vision Autostainer 360 Grand Island, NY) followed by Periodic acid Schiff (PAS) counterstaining. Whole slide images were generated on a Hamamatsu Nanozoomer S60 and evaluated using NDPI.view2 (Hammamatsu). In all, 50 glomeruli were randomly selected in each cortical profile and p57-positive podocytes were enumerated. Using the PAS stain as the delimiter of the glomerular area, glomerular area was measured and the podocyte number was indexed to the glomerular area (μm2). Glomerular density was determined by calculating the number of glomeruli that were not globally sclerotic per total renal cortical area.
2.5 |. Quantitative real-time PCR analysis
Total RNA was isolated from whole kidney tissue, reverse transcribed, and subjected to quantitative real-time PCR analyses using SYBR green method as previously described.19 Real-time PCR primers for fibrotic genes (Col1a1, Col3a1, and Col6a1),56 inflammatory genes (Il-1β, Il-6, and Tgf-β),57 and other genes used in this study are listed in Table S1. Data were normalized to 18S rRNA and expressed as relative mRNA levels using the ΔΔCt method.58
2.6 |. RNA-seq and bioinformatics analysis
RNA-seq and bioinformatics analyses of age-matched (49-week old) WT littermates (n = 4) and Ctrp1-KO (n = 4) male kidneys were performed by Novogen (New South Wales, Australia). In brief, data analysis was performed using a combination of programs, including STAR, HTseq, Cufflink, and our wrapped scripts. Alignments were parsed using TopHat program, and differential expressions were determined through DESeq2/edgeR. Gene ontology (GO) and Kyoto Encyclopedia of Genes and Genomes (KEGG) enrichment were implemented by ClusterProfiler. High-throughput sequencing data from this study have been submitted to the NCBI Sequence Read Archive under accession number GSE127332.
2.7 |. Pathway analysis
For pathway analysis, we focused on NCBI-annotated genes with >2 standard deviation (SD) difference between Ctrp1 KO and WT kidneys. These transcripts were considered to have significant differential expression. This SD corresponded to a linear fold-change of approximately ±1.16 for KO versus WT, which resolved to 530 upregulated and 539 downregulated transcripts between the two genotypes. These probeset transcripts were uploaded to the Ingenuity Pathway Analysis platform (www.ingenuity.com; Qiagen, Hilden, Germany) to evaluate their functional relevance in canonical pathways. Analysis was last performed on December 11, 2018. P values for pathway selection were calculated using Fisher’s exact test, and the top 20 pathways were analyzed for each two-way comparison. All listed pathways had P < .01 (right-tailed).
2.8 |. Serum and blood chemistry analysis
Blood chemistry of 33-week-old male WT and Ctrp1-KO mice was analyzed using an iSTAT Chem8+cartridge with handheld iSTAT system (Abbott Point of Care, Princeton, NJ, USA). For iSTAT analyses, blood samples were obtained from the superficial temporal vein. Mouse serum was harvested by retro-orbital bleeds at the time of euthanasia from 49-week-old WT and Ctrp1-KO mice. ELISA kits were used to measure serum aldosterone (Abcam, Cambridge, UK), CTRP1 (BioVendor R&D), and serum renin (EMREN1, Thermo Fisher Scientific). Serum corticosterone was measured using an enzyme immunoassay kit (K014-H1, Arbor Assays, Ann Arbor, MI, USA). Assays were carried out according to the manufacturer’s instructions.
2.9 |. Water restriction
Water restriction experiments were conducted on 36-week-old (for control LFD) and 40-week-old (for HSD) WT and Ctrp1-KO mice. For day 1, baseline bodyweights were measured before water was removed at 3 hours before the start of the dark cycle (3 pm), when mice were active and feeding. On day 2, bodyweights were measured at the same time, before mice were given access to water again. On day 3, bodyweights were measured again at the same time to assess the ability to recover from water depravation. Mice had ad libitum access to food during the experiment.
2.10 |. Urine analysis
For urine collection, 40-week-old WT and Ctrp1-KO mice (on control LFD) were housed in diuresis cages with ad libitum access to water and food. Levels of urinary sodium, potassium, and chloride were measured using an EasyLyte electrolyte analyzer (Medica Corporation, Bedford, MA, USA) at the University of Maryland School of Medicine. Urine osmolality measurements were performed on an Advanced Instruments 3320 single-sample micro-osmometer (Advanced Instruments, Norwood, MA). Urinalysis of pH, creatine, urea nitrogen, calcium, total protein, glucose, and albumin were measured at the Molecular and Comparative Pathobiology Core at The Johns Hopkins University School of Medicine.
2.11 |. Glomerular filtration rate (GFR)
GFR was measured in conscious, unrestrained 38-week-old WT and Ctrp1-KO mice (on control LFD) using a fluorescence-based transcutaneous monitoring device (MediBeacon GmbH, Mannheim Germany).59 Briefly, FITC-labeled sinistrin (Fresenius Kabi, Austria), a more stable analogue of inulin, was injected into the retro-orbital sinus at a dose of 15 mg/100 g body weight. A miniature device was mounted to the backs of depilated mice to measure transcutaneous fluorescence and decay of FITC. Because sinistrin is only cleared from the plasma by kidney filtration (it is neither re-absorbed nor secreted), its clearance from plasma is directly proportional to GFR and can thus be extrapolated from the FITC decay curve.59
2.12 |. Blood pressure
Tail vein blood pressure measurements were obtained using a BP-2000 blood pressure analysis system (Visitech Systems, Apex, NC, USA) on conscious mice starting at 46 weeks of age. Mice received a 5-day training period to acclimate to restraint and tail cuff inflation prior to collecting experimental data. During training and testing weeks, mice were placed onto individual rodent restrainers on a preheated platform at 38°C. The animal was restrained using a magnetic rectangular box designed to calm the animal. The tail was held in place by a piece of surgical tape. Pressure recording began after a 5-minute calming period, an automated procedure during which the cuff was repeatedly inflated and deflated. Mice were monitored continuously during the procedure. Blood pressure values were recorded 20 consecutive times, and results were averaged. Only successful reads were accepted for analysis. Mice were tested daily during 3–5 pm, for 5 days during each diet challenge.
2.13 |. Transthoracic echocardiography
Transthoracic echocardiography was performed without sedating mice and using a Vevo 2100 system (VisualSonics Inc, Toronto, Canada), equipped with a 40 MHz linear transducer. M-mode echocardiogram was acquired from the parasternal short axis view of the left ventricle (LV) at the mid-papillary muscle level and at sweep speed of 200 mm/sec. From this view, we measured (a) inter-ventricular septal thickness at end of diastole (IVSD), (b) LV chamber diameter at end of diastole (LVEDD), (c) posterior wall thickness at end of diastole (PWTED), and (d) LV chamber diameter at end of systole (LVESD).60,61 These cardiac parameters were used to calculate percent fractional shortening (FS), relative wall thickness (RWT), and LV mass to estimate cardiac contractility and LV hypertrophy. These indices were derived from the following equations60,61:
where 1.055 is specific gravity of the myocardium
End-diastolic ventricular volume (EDV), end-systolic ventricular volume (ESV), stroke volume (SV), and percent ejection fraction (EF) were estimated using Simpson’s method and the two-chamber view of the heart in the two-chamber long axis.62,63
2.14 |. Pulse wave velocity (PWV)
PWV was measured noninvasively in Ctrp1-KO and WT mice with a high-frequency, high-resolution Doppler spectrum analyzer (DSPW, Indus Instruments, Houston, TX, USA), as previously described.64 In brief, mice were anesthetized with 1.5% isoflurane and placed in a supine position on a temperature-controlled platform equipped with electrocardiogram (EKG). Mouse core temperature was maintained at 37°C, and heart rate was allowed to stabilize to a physiological range. A 20 MHz probe was used to measure flow velocities in the descending aorta and abdominal aorta. A real-time signal acquisition and spectrum analyzer system were used to calculate time between the R wave of EKG to the start of pulse wave form for each measurement location.
2.15 |. Multiplex quantification of serum cytokines
Serum levels of 59 mouse cytokines were quantified using a Luminex bead-based multiplex system according to the manufacturer’s protocol (MilliporeSigma, Burlington, MA, USA). This method is sensitive and reproducible65,66 and has been validated in multiple studies.67,68 MCYTOMAG-70K, MECY2MAG-73K, and MSCRMAG-42K assay kits were used (MilliporeSigma). The ectodomain of many cytokine receptors also circulate in plasma as a soluble form, generated from proteolytic cleavage or alternative splicing.69 Thus, secreted sCD30, sIL-1RI, sIL-1RII, sIL-2Ra, sIL-4R, sIL-6R, sTNFRI, sTNFRII, sVEGFR1, sVEGFR2, sVEGFR3, sgp130, and sRAGE were also measured. We performed assays as previously described.70,71 Briefly, standard curves were generated for each mouse cytokine. Serum was diluted according to the manufacturer’s instructions. All samples and standards were analyzed using a Luminex 200 instrument (Luminex, Austin, TX, USA) and XPonent 3.1 software (MilliporeSigma). Concentrations were determined for each of the 59 mouse cytokines relative to an appropriate 6-point regression standard curve in which the mean fluorescence for each cytokine standard was transformed into known concentrations (pg/mL or ng/mL). All samples that were used for direct comparison or normalization were run on the same plate. For a given analyte, not all samples were successfully detected in the multiplex analysis. Data for a given analyte were analyzed when analyte levels were detected in at least 6 out of 10–12 samples. To enable unpaired t test analysis (where N ≥ 6), serum analyte levels had to be detected in both WT and Ctrp1-KO mice. All data are reported as mean ± standard error of the mean (SEM). Data were analyzed using Graph Pad Prism 7 software.
2.16 |. Statistical analysis
Comparisons between two groups of data were performed using two-tailed Student’s t tests with 95% confidence intervals, and ANOVA tests were used to make comparisons involving more than two groups. Values were considered statistically significant at P < .05. For all data, *P < .05, **P < .01, ***P < .001; ****P < .0001. All data are presented as mean ± SEM.
3 |. RESULTS
3.1 |. Late-onset renal hypertrophy in aged CTRP1-deficient male mice
We observed an unexpected increase in kidney size and weight in aged (~1-year old) male Ctrp1-KO mice. In male mice fed a control LFD comparable to standard chow, there was no difference in body weight between genotypes (Figure 1A). However, both absolute and relative (normalized to bodyweight or tibia length) kidney weights were significantly increased in Ctrp1-KO mice relative to WT littermates (Figure 1B–D). The phenotype was robust and reproducible, as increased kidney weight in aged male mice was consistently observed in three additional independent cohorts of Ctrp1-KO mice and littermate controls fed a LFD. In contrast to male mice, no increase in kidney weight was observed in aged (~1-year old) female mice fed a LFD (Figure 1E–H). Given the sex differences in this renal phenotype, we focused our studies on male mice fed a LFD.
FIGURE 1.
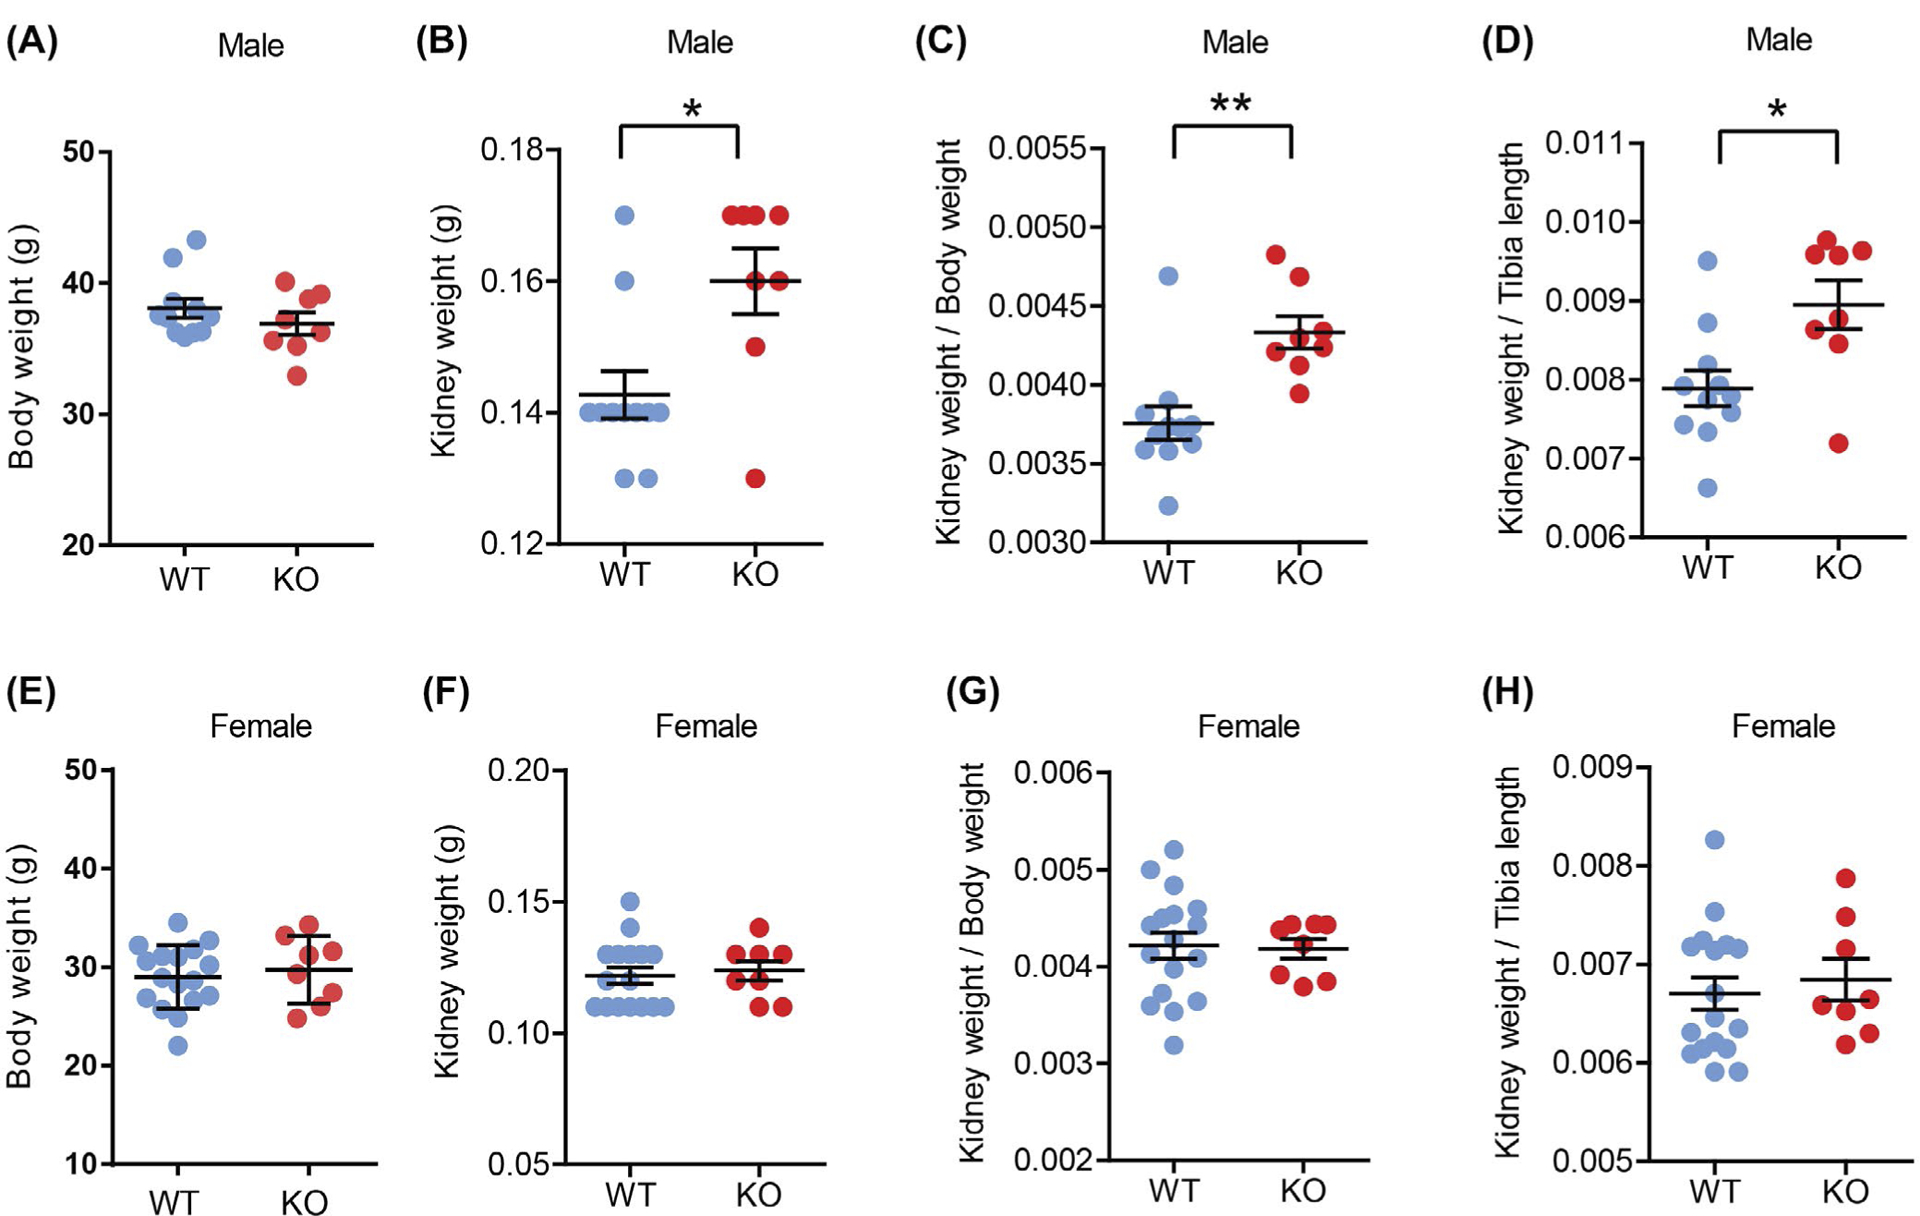
Aging-associated renal hypertrophy in Ctrp1-KO male mice fed a control LFD. A, Bodyweight of WT (n = 11) and KO (n = 8) aged male mice (39-week old). B, Kidney weight of WT (n = 11) and KO (n = 8) male mice (39-week old) fed a control LFD. C, Kidney weight to bodyweight ratio of LFD-fed aged male mice. D, Kidney weight to tibia length ratio of LFD-fed aged male mice. E, Body weight of WT (n = 16) and KO (n = 8) female mice (44 weeks old). F, Kidney weight of WT (n = 16) and KO (n = 8) female mice (44 weeks old) fed a control LFD. G, Kidney weight to bodyweight ratio of LFD-fed aged female mice. H, Kidney weight to tibia length ratio of LFD-fed aged female mice. Data are expressed as mean ± SEM. *P < .05; **P < .01
3.2 |. Increased glomeruli size in aged CTRP1-deficient male mice
Increased kidney weight could be due to renal hyperplasia or hypertrophy. We therefore determined whether increased glomeruli size and/or number was responsible for the increased kidney weight in aged Ctrp1-KO male mice. Quantification of histological sections (Figure 2A) revealed that cortical area was significantly increased in Ctrp1-KO mice relative to WT controls (Figure 2B), but the number of glomeruli, as well as the number of glomeruli per cortical area were not significantly different between genotypes (Figure 2C–D). The mean glomeruli area was also significantly increased in CTRP1-deficient animals relative to WT littermates (Figure 2E). While podocyte number was not different between genotypes (Figure 2F), the average number of podocyte per glomerular area was significantly reduced in Ctrp1-KO mice (Figure 2G). No significant histomorphological changes were observed in other compartments of the kidney including the tubulointerstitium and vasculature. Quantification of expression of the cell proliferation marker Ki-67 by real-time PCR showed ~50% reduced Ki-67 expression in Ctrp1-KO relative to WT kidneys (Figure 2H). Expression of kidney injury marker 1 (Kim-1) was also significantly reduced in aged Ctrp1-KO male mice relative to age-matched WT littermates (Figure 2I). We also assessed whether glomeruli enlargement affected expression of podocyte-specific genes.72 We observed significantly reduced expression of podocin (Nphs2) and podoplanin (Pdpn1) but not nephrin (Nphs1), the major slit diaphragm component of podocytes, in the kidneys of Ctrp1-KO mice (Figure 2J).
FIGURE 2.
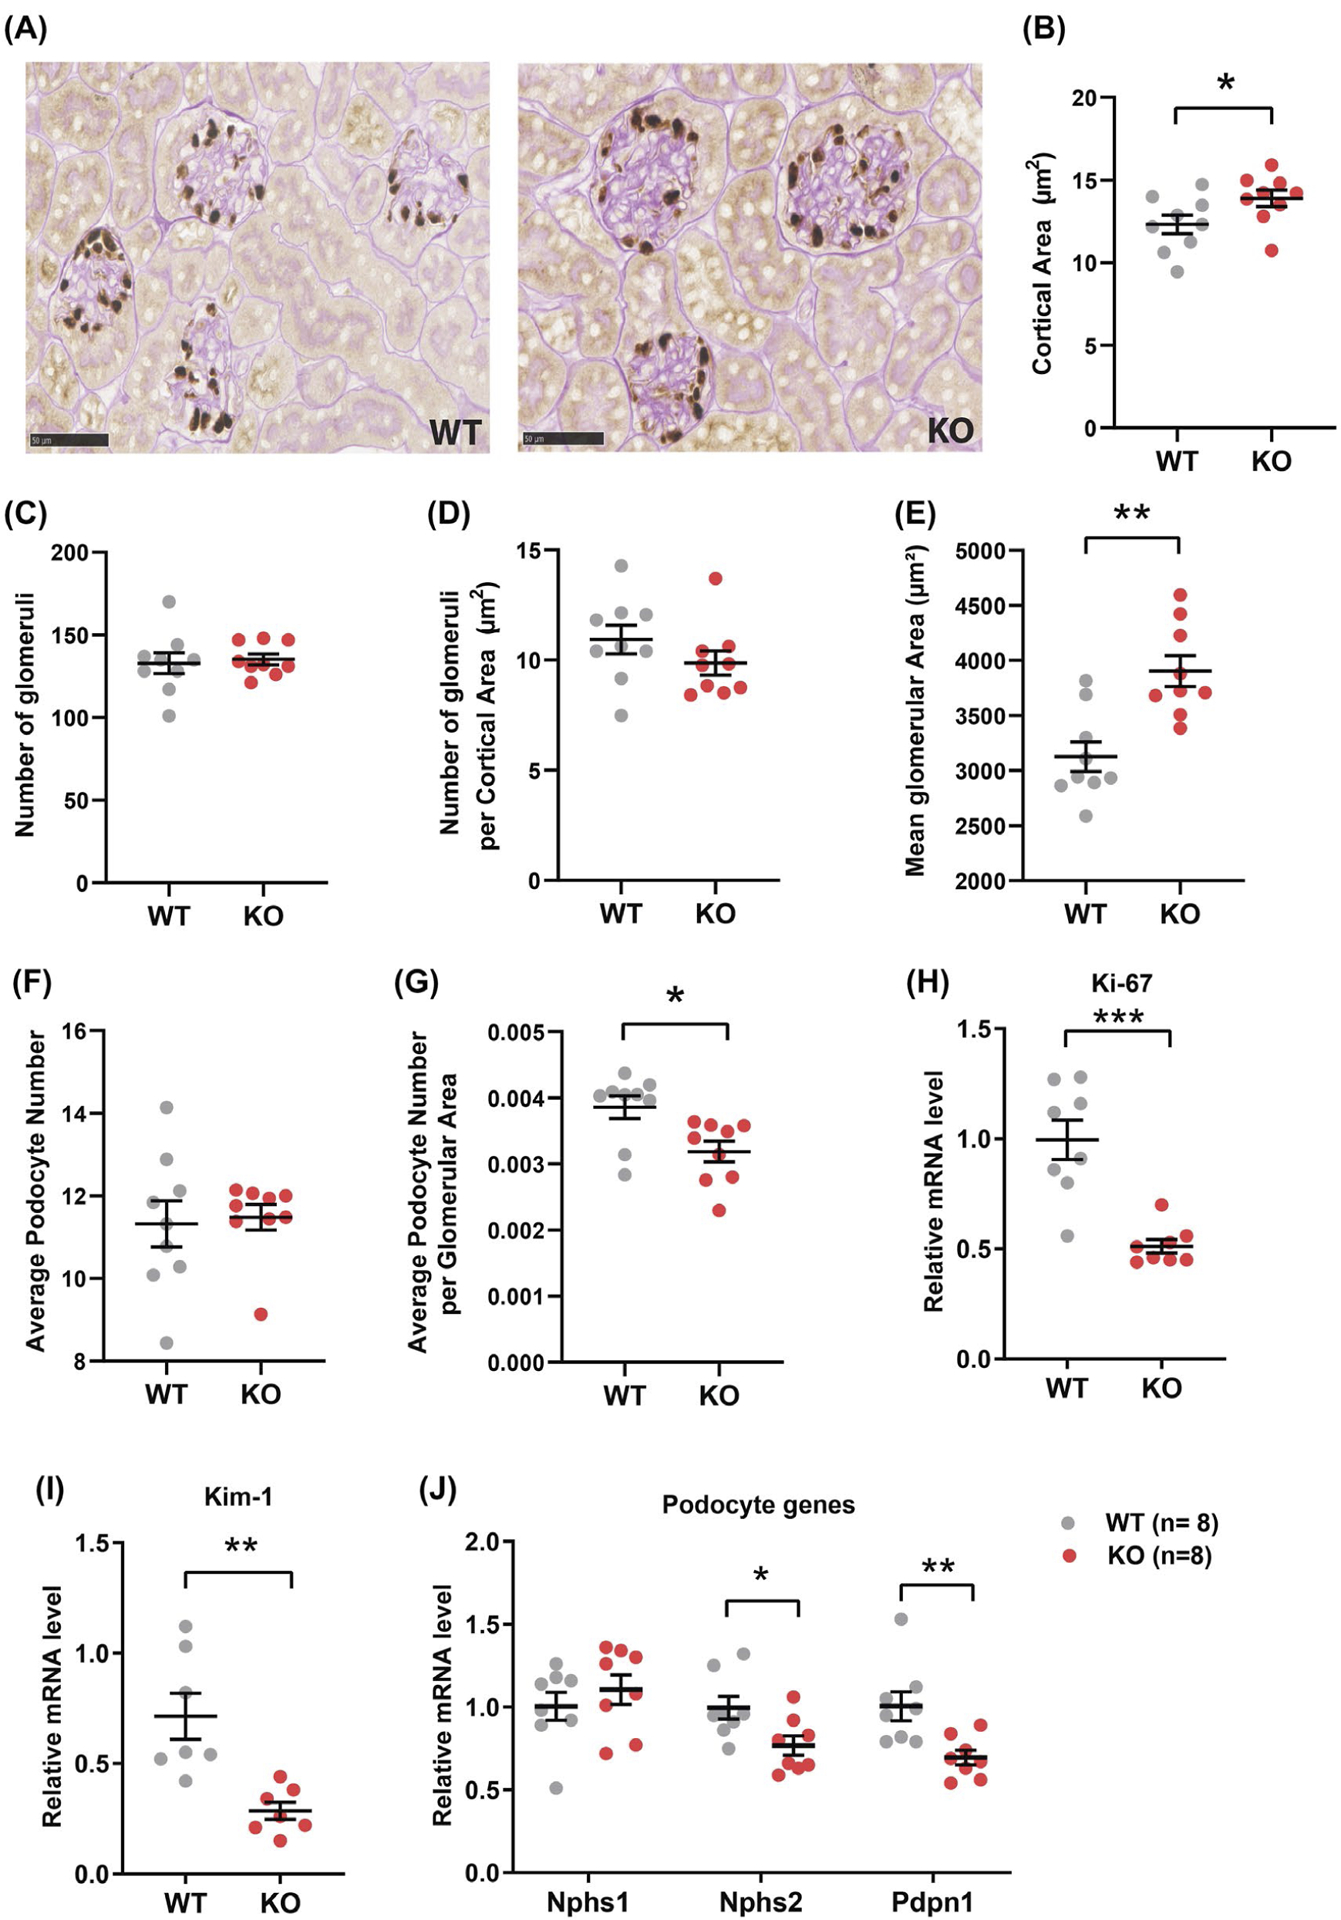
Increased glomeruli size in aged Ctrp1-KO male mice. A, Representative kidney histology (40× magnification) of Ctrp1-KO male mice and WT littermates (46-week old) fed a control LFD. The tissue sections were stained for the podocyte marker p57/Kip2, followed by Periodic acid Schiff (PAS) counterstaining. B-G, Quantification of cortical area (B), number of glomeruli (C), number of glomeruli per cortical area (D), mean glomerular area (μm2) (E), average podocyte number (F), and average podocyte number per glomerular area (G) in WT and Ctrp1-KO male mice; n = 9 mice per genotype. H-J, Quantitative real-time PCR analysis of cell proliferation marker Ki67 (H), kidney injury marker Kim-1 (I), and podocyte genes Nphs1 (nephrin 1), Nphs2 (nephrin 2), and Pdpn1 (podoplanin) (J). Data are expressed as mean ± SEM. *P < .05; **P < .01; ***P < .001
3.3 |. Absence of renal hypertrophy in young CTRP1-deficient male mice
To address whether the renal phenotype we observed was age-dependent, we also examined kidney weight in young WT and Ctrp1-KO male mice. At 12 weeks of age, bodyweights were similar between genotypes (Figure S1A). Neither absolute nor relative (normalized to bodyweight) kidney weights differed between WT and Ctrp1-KO animals (Figure S1B,C), indicating that late-onset renal hypertrophy in CTRP1-deficient male mice was age-dependent.
3.4 |. CTRP1 is expressed in glomeruli and podocytes
In Ctrp1-KO mice, Ctrp1 exon 4 encoding for the globular C1q domain was replaced with a lacZ cassette (Figure 3A). Consequently, no relative Ctrp1 mRNA was detected in Ctrp1 (−/−) kidneys (Figure 3B). Presence of the lacZ cassette within the Ctrp1 locus allows us to visualize endogenous cells that express Ctrp1 transcript by β-gal staining. In kidney sections from either Ctrp1 homozygous (−/−) or heterozygous (+/−) mice, we observed β-gal staining only in glomeruli (Figure 3C). The glomerulus is composed of several cell types, including endothelial cells, podocytes, and mesangial cells. In the published RNA-seq dataset from FACS-sorted mouse podocytes (GEO database #GSE64063),73 expression of CTRP1 transcript (C1qtnf1) has a mean fragments per kilobase million (FPKM) of 488 and is ranked 102 for the most highly expressed mRNAs from 8922 transcripts with FPKM > 3. In more recent single-cell transcriptomics of healthy mouse kidney,72 the podocyte is also a major cell type within the kidney that expresses Ctrp1/C1qtnf1 (GEO database #GSE107585; data can be accessed at: 18.217.22.69/sc). Consistent with transcriptomics data, previous immunohistochemical analysis using an anti-CTRP1 antibody also suggested podocyte as a possible cell type within the kidney that expresses CTRP1.74 Thus, based on mRNA and protein data, podocytes are the principal cell type expressing CTRP1 in the glomerulus.
FIGURE 3.
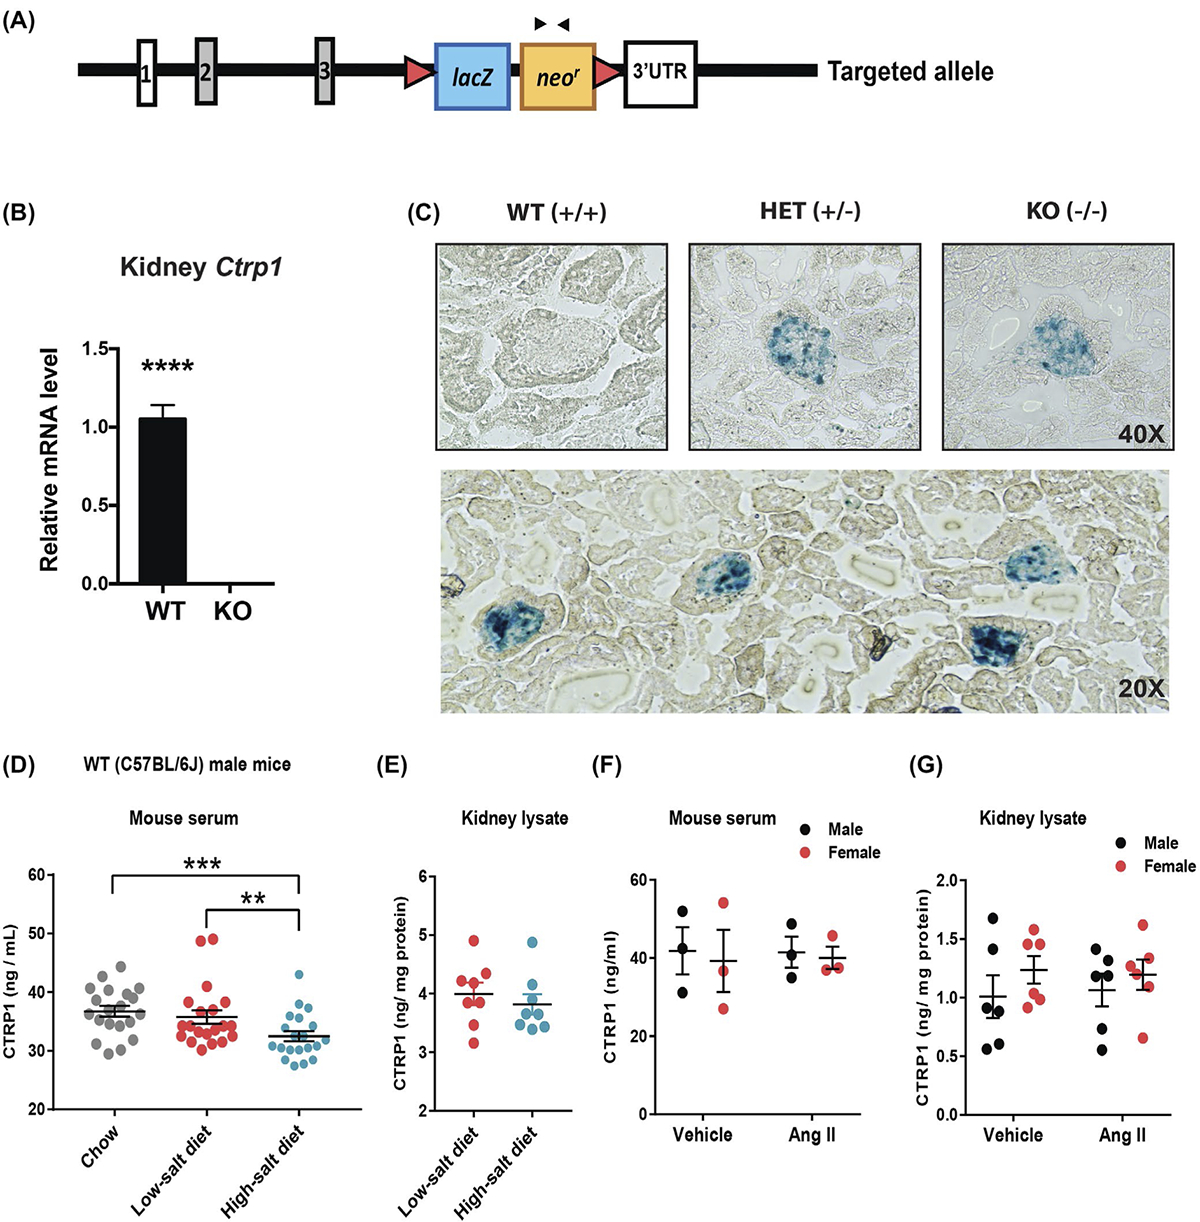
CTRP1 is expressed in kidney glomeruli and its circulating levels are reduced by high-salt diet. A, Schematic showing the strategy for generating Ctrp1-KO mice by targeted deletion of exon 4 of mouse Ctrp1 and replacement with a lacZ reporter and neomycin resistance cassette. The lacZ reporter is driven by the endogenous Ctrp1 promoter, allowing visualization of cells that express Ctrp1 with β-gal staining. B, Quantitative real-time PCR analysis of Ctrp1 mRNA in the kidney of Ctrp1-KO male mice (n = 8) and WT littermates (n = 8). C, Representative images of β-gal staining of frozen kidney tissue sections of WT (+/+), heterozygous (+/−), and homozygous KO (−/−) mice. LacZ expression is localized to kidney glomeruli. D, ELISA results showing serum CTRP1 levels of WT C57BL/6J male mice (n = 20) consuming standard chow, transitioned to a LSD (n = 20) for 1 week, and switched to a HSD (n = 20) for 1 week. E, CTRP1 levels in kidney lysates of wild-type C57BL/6J male mice fed a LSD (n = 8) or HSD (n = 8). F, Serum CTRP1 levels of WT C57BL/6J male (n = 3) and female mice (n = 3) infused with vehicle control or AngII. G, CTRP1 levels in kidney lysates of wild-type C57BL/6J male (n = 6) and female mice (n = 6) infused with vehicle control or AngII. Data are expressed as mean ± SEM. **P < .01; ***P < .001; ****P < .0001
3.5 |. Effects of HSD and AngII infusion on local and systemic CTRP1
Kidneys play a major role in maintaining normal salt level and blood pressure. To test whether circulating levels of CTRP1 were responsive to a HSD, chow-fed WT male mice were first transitioned to a LSD for 1 week, followed by a HSD for 1 week. ELISA quantification of serum CTRP1 levels revealed a modest but significant reduction in circulating CTRP1 in response to a HSD relative to mice fed a control LSD or standard chow (Figure 3D). Local concentration of CTRP1 in the kidney, however, was not significantly different between mice fed a low-salt or a high-salt diet (Figure 3E). To test whether CTRP1 was responsive to changes in blood pressure, we quantified local (kidney) and systemic (serum) CTRP1 levels in mice implanted with a mini-pump delivering vehicle control or AngII for 28 days. Although AngII infusion was shown to significantly elevate blood pressure,54,55,75 we measured no significant differences in systemic circulating or local CTRP1 levels within the kidneys of male or female animals infused with AngII or vehicle control (Figure 3F,G).
3.6 |. CTRP1 deficiency does not affect renal response to dehydration
Given that male mice lacking CTRP1 have renal hypertrophy, we determined whether loss of CTRP1 impaired renal function. One of the critical functions of the kidney is to maintain blood volume and pressure, partially by regulating water and salt reabsorption and retention.76 Because water constitutes a significant portion of body mass, a 24-hour water restriction should significantly and robustly reduce body mass, and mice should quickly regain their body mass during a recovery phase when water is available again. As expected, when WT mice were subjected to 24-hour water restriction, they lost body mass, and regained it in the recovery phase (Figure S2A). Consistent with previously published report,52 circulating CTRP1 protein level was significantly increased in response to water restriction (Figure S2B). Next, we performed water restriction of Ctrp1-KO mice and WT littermates. When subjected to a 24-hour water restriction followed by water replenishment, the magnitude of body mass reduction and rebound did not significantly differ between aged Ctrp1-KO and WT mice, regardless of whether these animals were fed a control LFD or HSD (Figure S2C,D). Quantification of cortical area, glomeruli number, number of glomeruli per cortical area, mean glomerular area, average podocyte number, and average podocyte number per glomerular area revealed comparable changes in WT and KO male mice as they were transitioned from a low-salt diet to a high-salt diet (Figure S3). Together, these results suggest that CTRP1 is not required for renal response to dehydration.
3.7 |. CTRP1 deficiency elevates blood pressure in aged male mice
Loss of CTRP1 did not elevate general stress levels, as serum corticosterone levels of Ctrp1-KO mice did not significantly differ from WT littermates (Figure 4A). Furthermore, GFR did not significantly differ between genotypes (Figure 4B). WT and Ctrp1-KO aged male mice also had comparable serum aldosterone and renin levels (Figure 4C,D). However, Ctrp1-KO male mice had elevated systolic blood pressure relative to WT littermates (Figure 4E). Diastolic blood pressure did not differ (data not shown). When challenged with a HSD for 2 weeks, the differences in systolic blood pressure became less apparent between WT and Ctrp1-KO aged male mice (Figure 4F).
FIGURE 4.
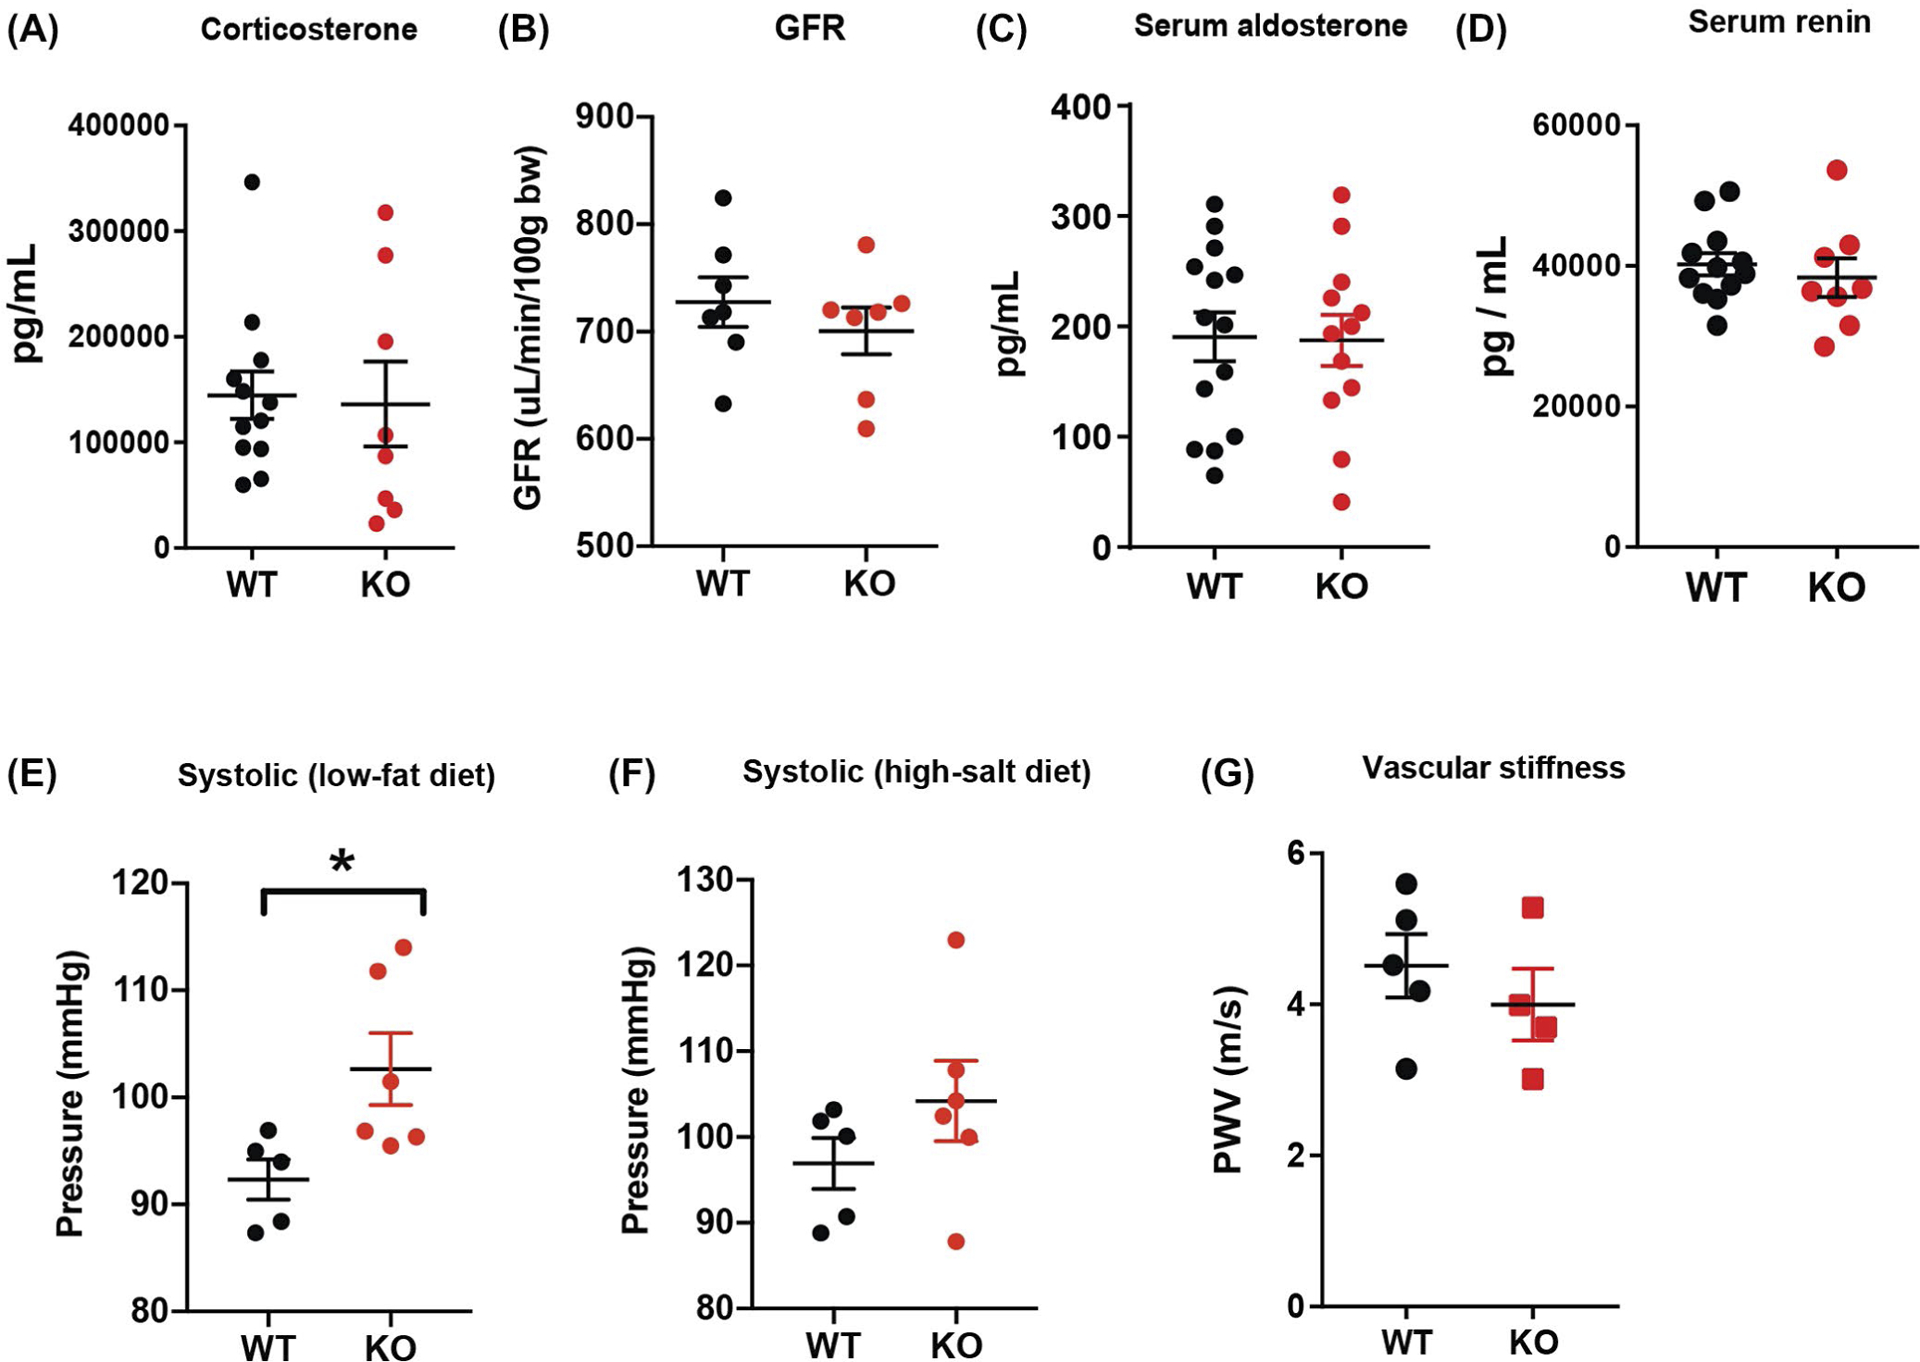
Elevated blood pressure in aged Ctrp1-KO male mice. A, Serum corticosterone levels of WT (n = 12) and Ctrp1-KO (n = 8) male mice at 39 weeks of age. B, Glomerular filtration rate (GFR) of WT (n = 7) and Ctrp1-KO (n = 7) male mice at 38 weeks of age. C, Serum aldosterone levels of WT (n = 14) and Ctrp1-KO (n = 12) male mice at 49 weeks of age. D, Serum renin levels of WT (n = 12) and Ctrp1-KO (n = 8) male mice at 49 weeks of age. E,F, Systolic blood pressure measured via tail-vein cuff of WT (n = 5) and Ctrp1-KO (n = 6) mice on control LFD (E) and after 1 week of HSD (F). G, Pulse wave velocity measurements of vascular stiffness of WT (n = 5) and Ctrp1-KO (n = 4) male mice at 24 weeks of age. Data are expressed as mean ± SEM. *P < .05
3.8 |. CTRP1 deficiency does not affect heart function and vascular stiffness
A deficit in cardiovascular function can affect blood pressure. Therefore, we performed echocardiogram analysis to determine whether aged male mice lacking CTRP1 had any deficit in heart function. As shown in Table 1, no parameters associated with heart function and contractility differed between LFD-fed WT and Ctrp1-KO animals. Although vascular stiffness can affect contractility and blood pressure regulation, pulse wave velocity analysis showed no difference in vascular stiffness between aged Ctrp1-KO and WT littermates (Figure 4G). Thus, cardiovascular function was preserved in aged CTRP1-deficient male mice relative to WT littermates.
TABLE 1.
Echocardiogram analysis of aged WT and Ctrp1-KO male mice fed a control low-fat diet
| WT (n = 14) | KO (n = 11) | P | |
|---|---|---|---|
| LVIDd (mm) | 2.852 ± 0.05 | 2.832 ± 0.06 | 0.7912 |
| LVIDs (mm) | 1.217 ± 0.04 | 1.261 ± 0.04 | 0.4282 |
| IVSd (mm) | 1.049 ± 0.02 | 1.067 ± 0.02 | 0.4613 |
| LVPWd (mm) | 1.011 ± 0.02 | 1.027 ± 0.02 | 0.604 |
| HR (b/min) | 668.2 ± 8.69 | 672.7 ± 13.13 | 0.7691 |
| FS (%) | 57.38 ± 0.72 | 55.51 ± 1.03 | 0.1388 |
| EF (%) | 81.77 ± 0.63 | 80.1 ± 0.95 | 0.1417 |
| LV mass | 100.7 ± 2.45 | 102.4 ± 3.44 | 0.6782 |
Abbreviations: EF, percent ejection fractionation; FS, percent fractional shortening; HR, heart rate; IVSD, inter-ventricular septal thickness at end of diastole; LV mass, left ventricle mass; LVIDd, left ventricular internal dimension at end diastole; LVIDs, left ventricular internal dimension at end systole; LVPWd, left ventricular posterior wall thickness at end diastole.
3.9 |. CTRP1 deficiency increases urinary sodium and potassium excretion
Given the observed increase in systolic pressure, we next determined whether loss of CTRP1 affected renal function in handling salt and other ions. In Ctrp1-KO mice, urine output as well as urinary creatinine, urea, albumin, protein content, Ca2+, Cl−, pH, and osmolality did not significantly differ from WT littermates (Figure 5A,B,D,F–K). However, urinary Na+ and K+ excretion were significantly elevated in aged Ctrp1-KO male mice (Figure 5C,E). In contrast to urine, no differences were measured in blood concentrations of Na+, K+, Cl−, iCa2+, creatinine, hemoglobin, hematocrit, glucose, blood urea nitrogen, carbon dioxide, and anion gap between WT and Ctrp1-KO animals (Table S2).
FIGURE 5.
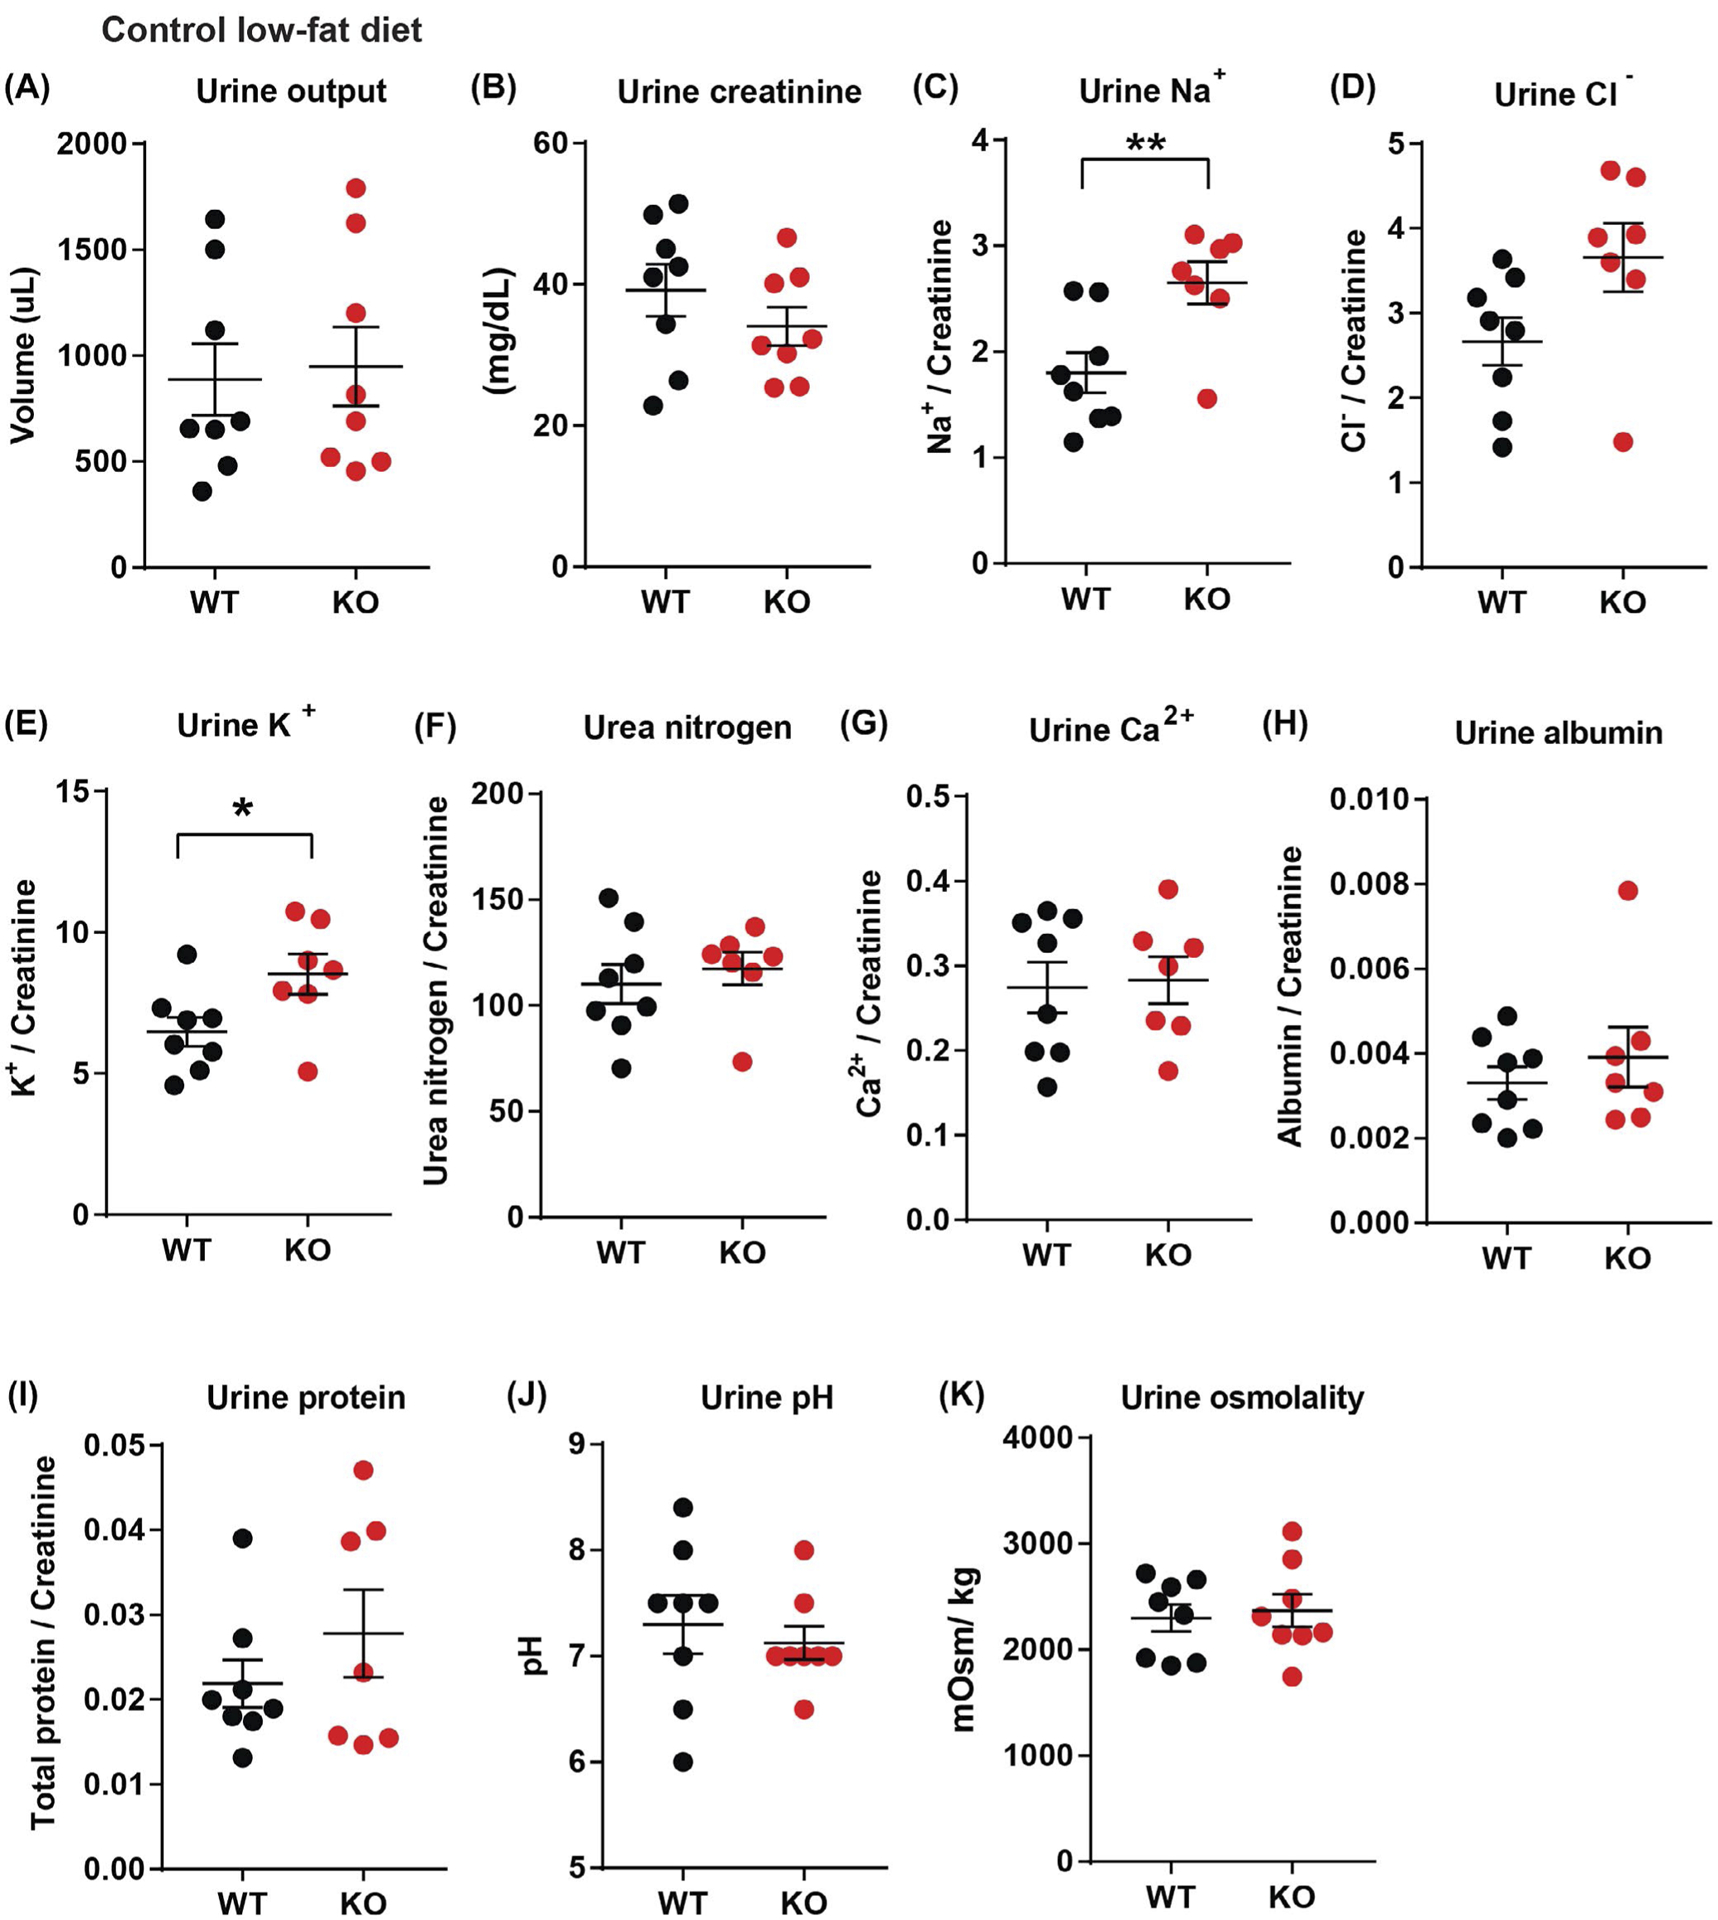
Elevated urinary sodium and potassium excretion in aged Ctrp1-KO male mice. A,B, 24-hour urine output (A) and urinary creatinine level (B) in WT (n = 8) and KO (n = 8) male mice at 40 weeks of age. C-H, 24-hour urinary sodium (Na+) (C), chloride (Cl−) (D), potassium (K+) (E), urea nitrogen content (F), calcium (Ca2+) (G), albumin (H), and total protein (I) normalized to creatinine level in WT (n = 8) and Ctrp1-KO (n = 8) male mice at 40 weeks of age. (J-K) 24-hour urine pH (J) and osmolality (K) in WT (n = 8) and Ctrp1-KO (n = 8) male mice at 40 weeks of age. Data are expressed as mean ± SEM. *P < .05, **P < .01
3.10 |. HSD elevates urinary potassium and protein excretion in CTRP1-deficient mice
Next, we examined the impact of CTRP1 deficiency on renal handling of salt loading. When challenged with a HSD for 2 weeks, urine output as well as urinary creatinine, Cl−, urea, Ca2+, and pH of Ctrp1-KO male mice did not significantly differ from WT littermates (Figure 6A,B,D,F,G,J). Urinary levels of Na+ (P = .07) and albumin (P = .07) tended to be higher, although not significantly, in aged Ctrp1-KO male mice (Figure 6C,H). We again observed significantly higher urinary K+ levels (P = .03) in aged Ctrp1-KO male mice relative to WT littermates (Figure 6E). Total protein content in the urine was also significantly elevated in Ctrp1-KO mice (Figure 6I), indicating impaired kidney barrier function. In contrast to urine, blood concentrations of Na+, K+, Cl−, iCa2+, carbon dioxide, creatinine, hemoglobin, hematocrit, glucose, and anion gap did not significantly differ between WT and Ctrp1-KO animals fed a HSD, except for blood urea nitrogen (Table S3).
FIGURE 6.
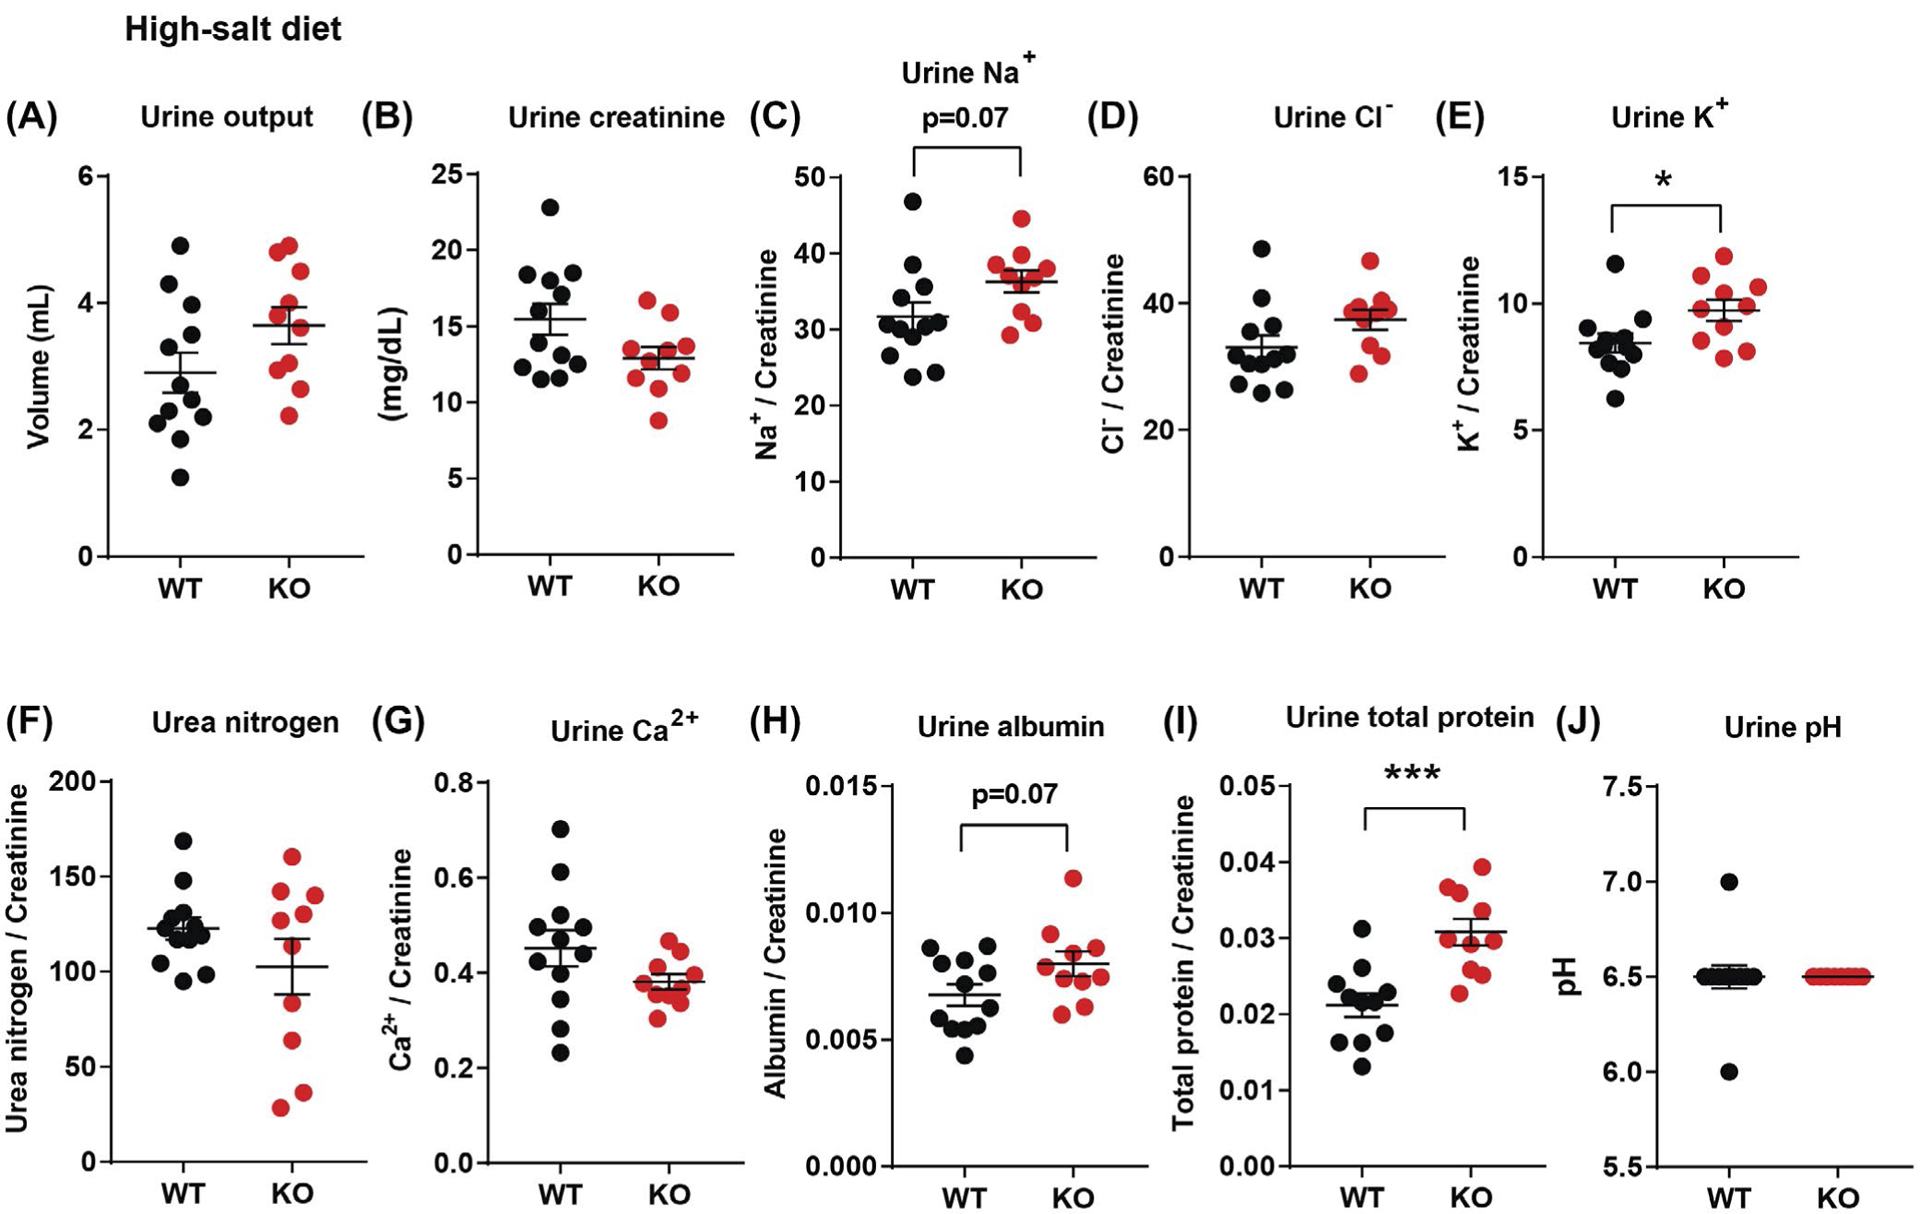
Elevated urinary potassium and protein excretion in aged Ctrp1-KO male mice challenged with a HSD for 2 weeks. A,B, 24-hour urine output (A) and urinary creatinine level (B) in WT (n = 12) and Ctrp1-KO (n = 10) male mice at 38 weeks of age. C-H, 24-hour urinary sodium (Na+) (C), chloride (Cl−) (D), potassium (K+) (E), urea nitrogen content (F), calcium (Ca2+) (G), albumin (H), and total protein (I) normalized to creatinine level in WT (n = 12) and Ctrp1-KO (n = 10) male mice at 38 weeks of age. J, 24-hour urine pH in WT (n = 12) and Ctrp1-KO (n = 10) male mice at 38 weeks of age. Data are expressed as mean ± SEM. *P < .05, ***P < .001
3.11 |. CTRP1 deficiency reduces renal expression of genes involved in sodium and potassium reabsorption
We next determined whether CTRP1-deficient aged mice had altered expression of renal genes involved in sodium and potassium reabsorption. Real-time PCR revealed significantly reduced expression of genes encoding epithelial sodium channels (Scnn1-α, Scnn1-β, and Scnn1-γ), sodium chloride cotransporter (Ncc), Na+-K+−2Cl− cotransporters (Nkcc1 and Nkcc2), sodium glucose cotransporter (Slc5a2), and sodium hydrogen exchanger (Nhe3) in Ctrp1-KO relative to WT mice (Figure 7A). During aging, renal function can be altered or compromised by fibrosis, oxidative stress, hypoxia, and inflammation.1,2,5 For this reason, we also looked at markers for these processes. Interestingly, we also observed significantly reduced expression of genes involved in inflammation, fibrosis, oxidative stress, hypoxia, lipid metabolism, fat oxidation, and bile acid elimination in Ctrp1-KO relative to WT mice (Figure 7B–H). In contrast to aged mice, young (12-week old) Ctrp1-KO male mice with no renal hypertrophy (Figure S1) did not have significantly different expression of genes involved in sodium and potassium reabsorption, fibrosis, and oxidative stress from WT littermates (Figure S4).
FIGURE 7.
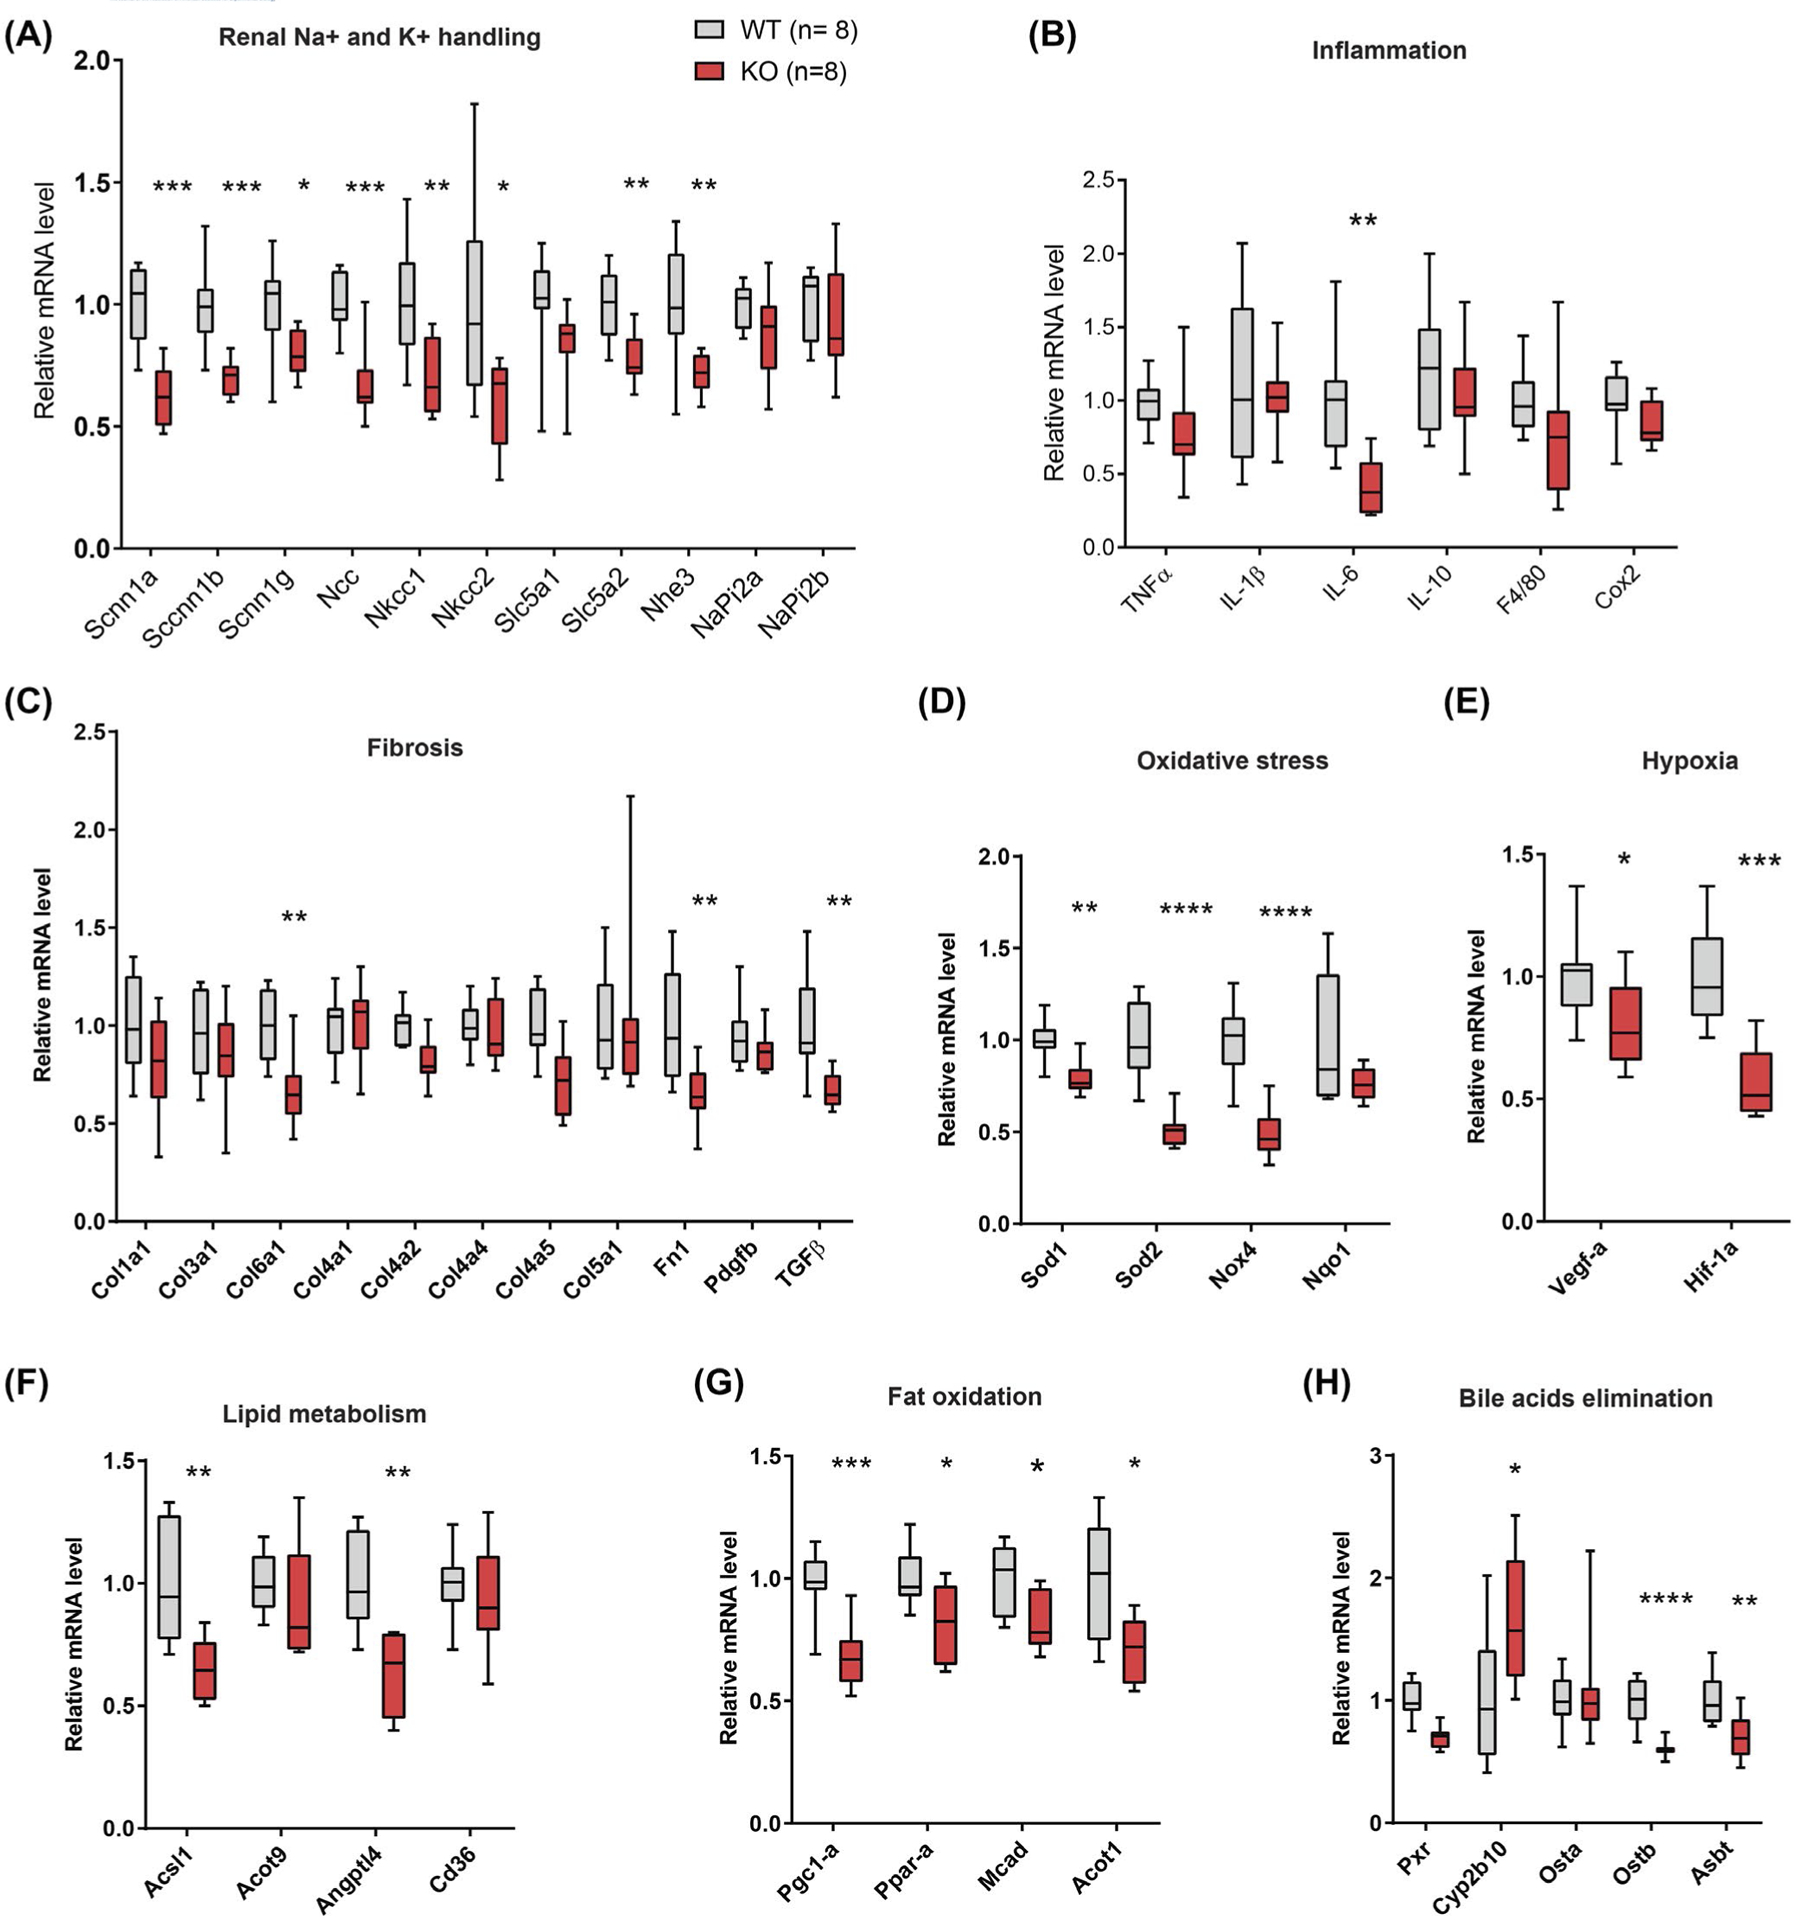
Reduced renal expression of genes important for sodium and potassium reabsorption, including genes involved in fibrosis, inflammation, lipid and bile acid metabolism, fat oxidation, and oxidative stress, in aged Ctrp1-KO male mice. Expression of genes involved in sodium and potassium reabsorption (A), inflammation (B), fibrosis (C), oxidative stress (D), hypoxia (E), lipid metabolism (F), fat oxidation (G), and bile acids elimination (H) in the kidney of WT (n = 8) and Ctrp1-KO (n = 8) male mice (Acot, acyl-CoA thioesterase; Acsl1, acyl-CoA synthetase long chain family member 1; Asbt, apical sodium-dependent bile acid transporter; Angptl4, angiopoietin-like 4; Col, collagen; Cox2, cyclooxygenase 2; Cyp2b10, cytochrome P450, family 2, subfamily b, polypeptide 10; Fn1, fibronectin 1; Mcad, medium-chain acyl-CoA dehydrogenase; Ncc, sodium chloride co-transporter (Slc12a3); Nhe3, sodium hydrogen exchanger 3; Nkcc, Na-K-Cl cotransporter; Nox4, NADPH oxidase 4; Nqo1, NADPH-quinone oxidoreductase 1; Osta, organic solute transporter alpha (Slc51a); Ostb, organic solute transporter beta (Slc51b); Pdgfb, platelet-derived growth factor b; Pgc1-a, peroxisome proliferator-activated receptor gamma coactivator 1-alpha; Ppar-a; peroxisome proliferator-activated receptor alpha; Pxr, pregnane × receptor; Scnn1, sodium channel epithelial 1; Slc5a1, solute carrier family 5 (sodium/glucose co-transporter) member 1; Sod, superoxide dismutase). Data are presented as Box and whiskers plots. *P < .05, **P < .01, ***P < .001, ****P < .0001
3.12 |. RNA sequencing reveals alterations in metabolic processes in the kidney of CTRP1-deficient mice
To better determine the global impact on the transcriptome due to CTRP1 deficiency, we also performed RNA-seq on whole kidneys isolated from aged WT and Ctrp1-KO male mice. Of the 352 differentially expressed genes, 156 genes were upregulated and 196 genes were downregulated in Ctrp1-KO male kidneys relative to WT controls (Figure 8A and Tables S4 and S5). GO and KEGG analyses indicated enrichment for genes involved in metabolic processes and pathways in the kidney of CTRP1-deficient mice (Figure 8B and Table 2). These combined changes in aging mice likely contributed to the renal phenotypes we observed in Ctrp1-KO animals.
FIGURE 8.
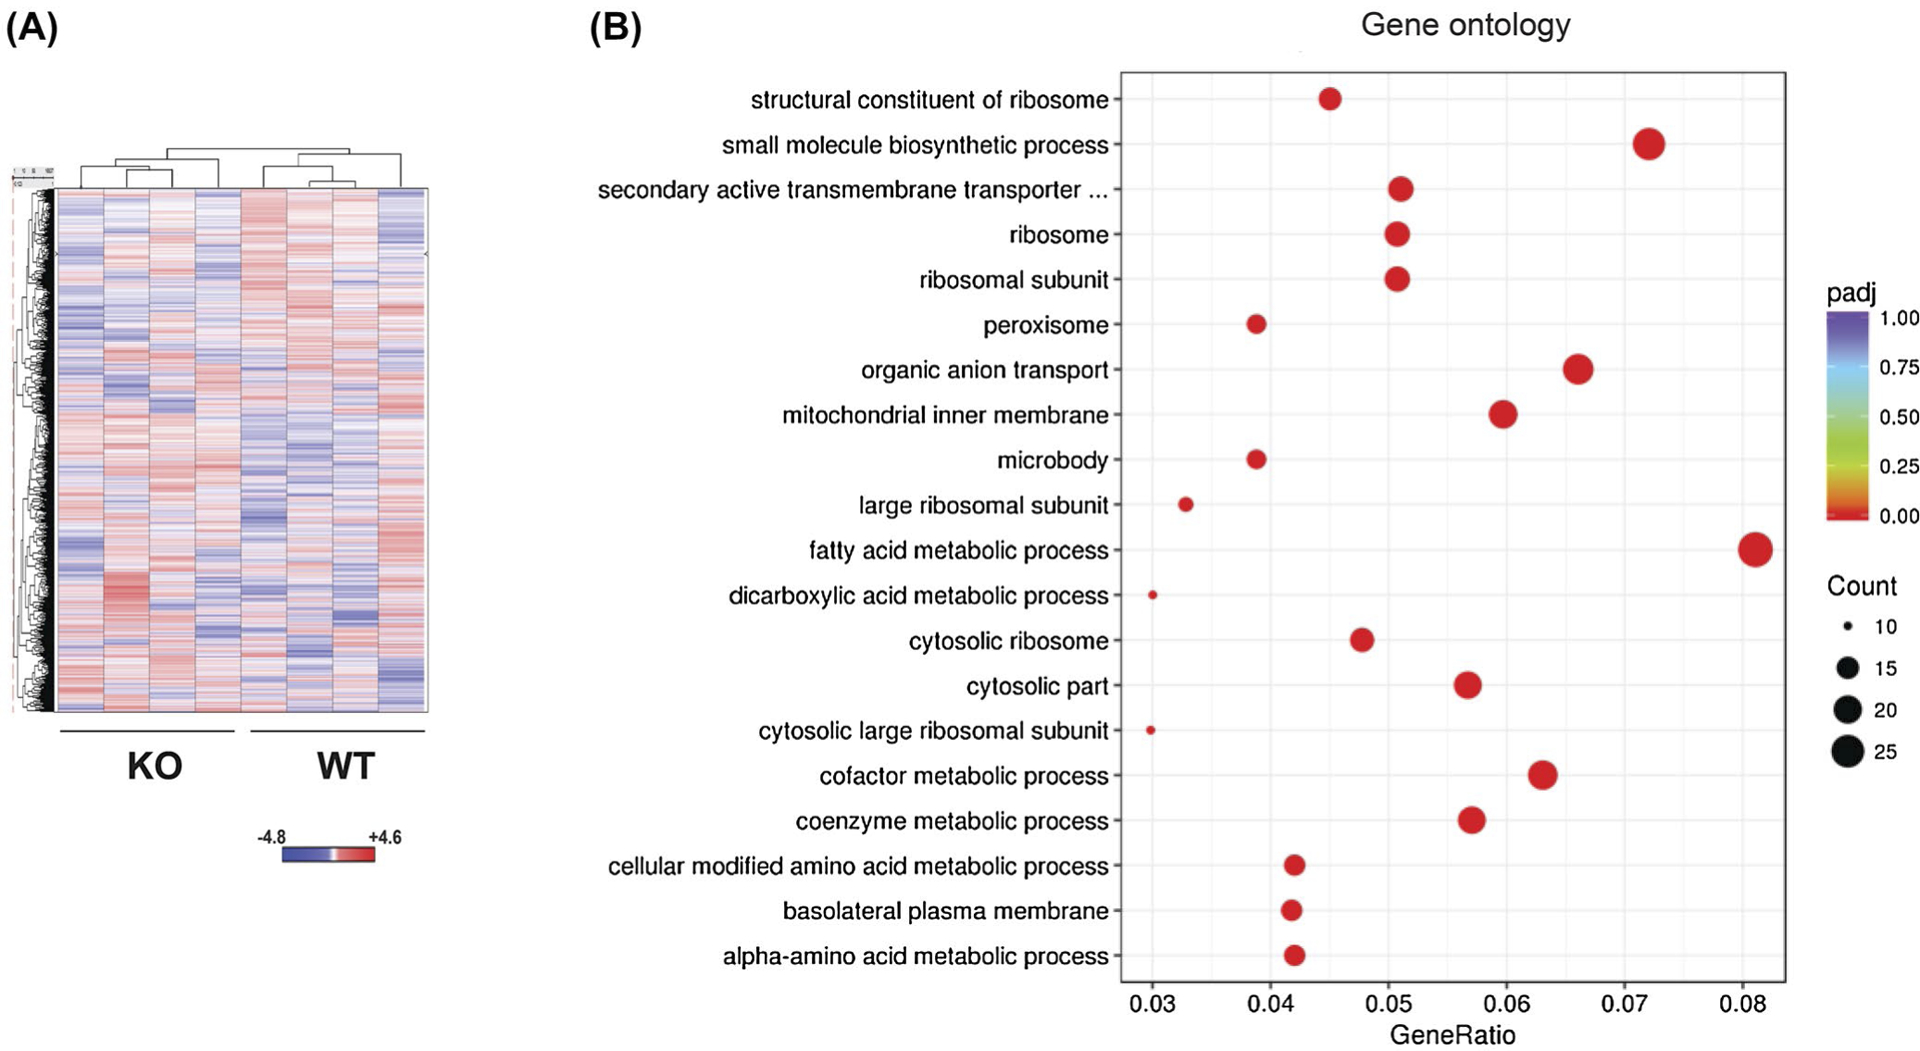
RNA-seq analysis of global gene expression in Ctrp1-KO and WT kidney. A, Heat map showing unsupervised hierarchical clustering of all Entrez genes’ differential expression between WT (n = 4) and Ctrp1-KO (n = 4) kidneys. The mean-subtracted values represent all genes that have FPKM values for all eight samples. B, Gene Ontology analysis showing major processes affected by CTRP1 deficiency in aging kidney
TABLE 2.
KEGG ((Kyoto Encyclopedia of Genes and Genomes) pathway analysis showing major metabolic pathways and genes affected by CTRP1 deficiency in aging kidney
| KEGG pathway | Gene ratio | P value | Gene |
|---|---|---|---|
| Ribosome | 15/157 | 2.16E-09 | Rpl13, Rps5, Rpl28, Rpsa, Rps16, Rpl10a, Fau, Rps2, Rpl18a, Rps23, Rpl38, Rpl32, Rpl11, Rpl35, Rplp0 |
| Metabolic pathways | 54/157 | 4.89E-07 | Galnt1, Prodh, St6galnac1, Sardh, Acaa1b, Acsl1, Pank3, Ndufs7, Fbp2, Btd, Cryl1, Tkt, Rrm2b, Dpys, Xdh, Aldh1a7, Asl, Gaa, Gls, Hao2, Hmgcs2, Papss1, Alad, Cyp2j13, Alpl, Hpd, Aldh2, Nt5c3, Me1, Pon2, Ugt8a, Mgll, Gpi1, Acaa2, Prodh2, Dcxr, Lap3, Ggt6, Agps, Aldh7a1, Mat2a, Aadat, Gapdh, Gapdh-ps15, Idi1, Eno1, COX2, ATP6, COX3, ND3, ND4L, Cyp4a10, Ass1, Hmgcs1 |
| Arginine and proline metabolism | 8/157 | 4.12E-05 | Prodh, Asl, Gls, Aldh2, Prodh2, Lap3, Aldh7a1, Ass1 |
| Peroxisome | 9/157 | 0.000113696 | Crot, Acaa1b, Acsl1, Hacl1, Xdh, Hao2, Far1, Nudt19, Agps |
| Fatty acid degradation | 7/157 | 0.000140267 | Acaa1b, Acsl1, Eci1, Aldh2, Acaa2, Aldh7a1, Cyp4a10 |
| Glycolysis/Gluconeogenesis | 7/157 | 0.000576352 | Fbp2, Aldh2, Gpi1, Aldh7a1, Gapdh, Gapdh-ps15, Eno1 |
| PPAR signaling pathway | 8/157 | 0.000672673 | Angptl4, Cd36, Acaa1b, Acsl1, Hmgcs2, Slc27a1, Me1, Cyp4a10 |
| Valine, leucine, and isoleucine degradation | 6/157 | 0.001234417 | Acaa1b, Hmgcs2, Aldh2, Acaa2, Aldh7a1, Hmgcs1 |
| Glutathione metabolism | 6/157 | 0.00185234 | Gstt1, Rrm2b, Oplah, Lap3, Ggt6, Gstp1 |
3.13 |. Impact of CTRP1 deficiency on circulating cytokines
Many cytokines have pleiotropic effects on different organ systems, including the kidney.77 Thus, changes in systemic circulating cytokines in the context of CTRP1 deficiency and aging could potentially contribute, albeit indirectly, to the renal phenotype we observed. To address this possibility, we examined serum levels of 59 mouse cytokines, chemokines, and soluble cytokine receptors in aged (40-week old) WT and Ctrp1-KO male mice (Table 3). Of the profiled cytokines, only serum levels of LIX/CXCL5, INF-β1, and sTNFRII were significantly reduced in aged Ctrp1-KO male mice relative to WT littermates. Given that renal hypertrophy only manifested in aged Ctrp1-KO mice and that only three cytokines were reduced in Ctrp1-KO animals, the kidney phenotypes we observed were likely not due to changes in circulating levels of these 59 cytokines, chemokines, and secreted cytokine receptors.
TABLE 3.
Serum cytokine levels in LFD-fed aged WT and Ctrp1-KO (40-week old) male mice
| Cytokine (pg/mL) | WT (n = 11) | KO (n = 11) | Cytokine (pg/mL) | WT (n = 12) | KO (n = 10) |
|---|---|---|---|---|---|
| G-CSF | 395 ± 49 | 483 ± 53 | M-CSF | 383 ± 231 | 182 ± 83 |
| Eotaxin-1/CCL11 | 3334 ± 281 | 3421 ± 224 | MIP-2/CXCL2 | 351 ± 138 | 252 ± 82 |
| GM-CSF | 103 ± 49 | 104 ± 38 | MIG/CXCL9 | 564 ± 42 | 501 ± 35 |
| IFN-γ | 187 ± 29 | 170 ± 11 | RANTES/CCL5 | 46 ± 17 | 41 ± 10 |
| IL-1α | 249 ± 49 | 324 ± 88 | VEGF | 3.2 ± 0.7 | 4.4 ± 1 |
| IL-1β | 58 ± 16 | 43 ± 17 | TNF-α | 15 ± 2 | 17 ± 5 |
| IL-2 | 65 ± 24 | 93 ± 44 | EPO | 270 ± 32 | 254 ± 21 |
| IL-3 | 9 ± 7 | 9 ± 4 | Exodus-2/CCL21 | 54 959 ± 2771 | 48 663 ± 5697 |
| IL-4 | ND | ND | MCP-5/CCL12 | 283 ± 31 | 292 ± 18 |
| IL-5 | 56 ± 21 | 59 ± 16 | MIP-3β/CCL19 | 396 ± 45 | 509 ± 75 |
| IL-6 | 24 ± 5 | 31 ± 9 | MIP-3α/CCL20 | 96 ± 8 | 119 ± 13 |
| IL-7 | 23 ± 4 | 33 ± 12 | INF-b1 | 934 ± 237 | 111 ± 37* |
| IL-9 | 563 ± 73 | 1503 ± 633 | TARC/CCL17 | 48 ± 6 | 40 ± 3 |
| IL-10 | 116 ± 23 | 107 ± 24 | Fractalkine/CX3CL1 | 574 ± 57 | 434 ± 32 |
| IL-11 | 193 ± 57 | 62 ± 18 | MDC/CCL22 | 268 ± 25 | 272 ± 30 |
| IL-12 (p40) | 28 ± 10 | 63 ± 27 | TIMP-1 | 5306 ± 302 | 4433 ± 525 |
| IL-12 (p70) | 65 ± 20 | 82 ± 42 | sCD30 (sTNFRSF8) | 733 ± 269 | 423 ± 134 |
| LIF | 6 ± 3 | 3 ± 0.2 | sgp130 | 1098 ± 83 | 1272 ± 209 |
| IL-13 | 270 ± 131 | 179 ± 51 | sIL-1RI (sCD121a) | 475 ± 98 | 564 ± 84 |
| IL-15 | 268 ± 36 | 201 ± 15 | sIL-1RII (sCD121b) | 11 489 ± 525 | 10 417 ± 1001 |
| IL-16 | 1453 ± 223 | 1237 ± 141 | sIL-2Ra (sCD25) | 903 ± 80 | 736 ± 63 |
| IL-17 | 34 ± 15 | 21 ± 6 | sIL-4R (sCD124) | 4191 ± 289 | 3665 ± 488 |
| IL-17A/F | 785 ± 136 | 580 ± 37 | sIL-6R (sCD126) | 21 992 ± 1178 | 19 120 ± 1047 |
| IL-20 | 596 ± 69 | 776 ± 164 | sRAGE | 192 ± 34 | 335 ± 78 |
| LIX/CXCL5 | 1598 ± 369 | 607 ± 162* | sTNFRI (sTNFRSF1A) | 10 365 ± 665 | 9995 ± 967 |
| IP-10/CXCL10 | 398 ± 21 | 396 ± 26 | sTNFRII (sTNFRSF1B) | 15 961 ± 1345 | 10 915 ± 1355* |
| KC/CXCL1 | 855 ± 106 | 936 ± 186 | sVEGFR1 (sFlt-1) | 1232 ± 214 | 970 ± 181 |
| MCP-1/CCL2 | 112 ± 19 | 82 ± 18 | sVEGFR2 (sFlk-1) | 64 529 ± 7651 | 61 736 ± 7622 |
| MIP-1α/CCL3 | 117 ± 16 | 154 ± 28 | sVEGFR3 (sFlt-4) | 94 241 ± 3475 | 83 316 ± 4125 |
| MIP-1β/CCL4 | 59 ± 10 | 77 ± 17 |
Notes: All values shown as average ± SEM. Cytokines below the assay detection limit are indicated by “ND” (not detected). Cytokines with statistically significant differences (*P < .05) between WT and Ctrp1-KO mice are bolded.
4 |. DISCUSSION
In the course of characterizing the metabolic phenotypes of Ctrp1-KO mice, we made several unexpected observations concerning the novel contributions of CTRP1 to renal structure and function during aging. We noted that as Ctrp1-KO mice aged (~1-year-old), their absolute and relative kidney weight (normalized to bodyweight) increased significantly. Interestingly, renal enlargement manifests in an age- and sex-dependent manner. Only aging male Ctrp1-KO mice developed renal hypertrophy—neither aged female nor younger male mice had enlarged kidneys. However, human males are much more susceptible to develop chronic kidney disease during aging than females.78 Our observations in Ctrp1-KO male mice reinforce sex as an important biological variable that can contribute to differential changes in structure and function of aging kidneys.
Increased kidney weight in Ctrp1-KO mice was not due to the presence of cysts; none were observed in renal histology. Ki-67 expression, a robust marker of cell proliferation,79 was reduced in the kidney of Ctrp1-KO mice, thus ruling out cell hyperplasia as the cause of increased kidney weight. Instead, kidney enlargement in Ctrp1-KO animals was attributed to glomeruli hypertrophy. It must be noted that renal hypertrophy is generally seen in pathophysiological contexts (eg, compensatory nephromegaly, hyperfiltration in early diabetes and nodular glomerulopathy in advanced diabetes) and is frequently associated with renal fibrosis, oxidative stress, hypoxia, and/or inflammation.80,81 To our surprise, expression of multiple genes involved in inflammation, fibrosis, oxidative stress, and hypoxia was either unchanged or significantly reduced in the kidneys of CTRP1-deficient mice relative to WT littermates. Consistently, GFR, urine output, most urine electrolytes (except Na+ and K+), pH, and osmolality were not affected in CTRP1-deficient mice with enlarged kidneys. These data indicate that late-onset renal hypertrophy in Ctrp1-KO mice fed a control LFD is associated with aging and not overt renal injury (eg, diabetic nephropathy, renal fibrosis, and inflammation). We previously showed that Ctrp1-KO mice fed an LFD also develop fatty liver.19 Although the link between liver steatosis and glomerular hypertrophy is unclear, we cannot rule out the possibility that kidney enlargement in aged CTRP1-deficient animals is indirectly due to metabolic dysfunction in the liver.
It is worth noting that our data were obtained from ~1-year-old mice. Aging-associated functional decline in renal structure and function occurs progressively across life.1,2,5 Because laboratory mice can live up to 2 years, future studies may be warranted to determine whether the kidneys of Ctrp1-KO animals will become progressively more hyper-trophied and fibrotic and eventually manifest overt functional deficits (eg, reduced GFR and impaired barrier function and reabsorption) as mice approach ~2 years old.
While adipose tissue is a major source of circulating CTRP1 in the blood, other tissues also express Ctrp1 transcripts, including the kidney, albeit at lower levels.7 In the kidney, only glomeruli appear to express Ctrp1 transcripts. Although there are multiple different cell types that comprise the glomerulus, single-cell RNA-seq72,73 as well as immunohistochemical localization of CTRP174 indicate podocytes as the major cell source of CTRP1 transcript and protein. Local production of CTRP1 raises the question of whether its expression in the kidney is regulated in pathophysiological states. Indeed, in the salt-induced hypertension model, circulating serum levels of CTRP1 were significantly reduced in normal WT mice consuming a HSD. However, in the AngII-induced hypertension model, no differences were observed in CTRP1 levels in the kidney or in circulation. These data suggest that circulating CTRP1 levels in blood may be modulated by salt content of the diet rather than changes in blood pressure per se. This is in contrast to recent reports indicating that serum CTRP1 levels are significantly elevated in spontaneous hypertensive rats as well as in hypertensive patients.52,53 Since hypertension is a complex disorder that can be caused by different mechanisms, additional studies will help determine whether hypertension per se or other environment factors (eg, greater salt intake) could trigger increased plasma CTRP1 levels in humans.
Another study suggests that CTRP1 is required to maintain normal blood pressure in the context of dehydration-induced hypotension.52 A 24-hour water restriction significantly reduced blood pressure due to water loss and a concomitant increase in serum CTRP1 levels in mice. This hypotensive-induced increase in circulating CTRP1 appears to be derived from skeletal muscle.52 In the context of dehydration, CTRP1 is required to prevent hypotension by indirectly promoting peripheral vascular constriction. Although volume control by the kidney also plays an important role in blood pressure regulation, it is unclear whether CTRP1 is required for water retention in response to dehydration. Given that we observed structural changes (ie, glomerulus hypertrophy) in the aging kidney of Ctrp1-KO mice, we examined whether this would affect renal response to dehydration. However, the renal response to water restriction followed by water replenishment did not differ between genotypes, indicating that CTRP1 is not required for homeostatic response to dehydration.
Intriguingly, Han and colleagues52 showed that in the whole-body CTRP1 overexpression mouse model, older mice (~1 year old) also have enlarged kidneys as well as diminished cardiac contractility. It is unclear whether cell hyperplasia or hypertrophy is responsible for the increased kidney size in aged CTRP1 transgenic mice since these parameters were not measured. The authors suggest structural changes in heart and kidney are secondary to chronic increases in blood pressure in aged CTRP1 transgenic mice. Interestingly, we also observed that mice lacking CTRP1 have elevated blood pressure and renal enlargement due to glomeruli hypertrophy. Elevated blood pressure in CTRP1-deficient mice, however, was not due to any structural or functional deficit in the heart, changes in vascular stiffness, general increase in stress (as measured by serum corticosterone level), or altered serum renin and aldosterone levels. Although previous in vitro studies using immortalized human cell lines show that recombinant CTRP1 can enhance aldosterone secretion,53 serum aldosterone levels did not change in CTRP1-overexpression52 or CTRP1-deficient mice. While puzzling, it appears that complete absence of CTRP1 or its overproduction results in overlapping phenotypes, thus suggesting the importance of maintaining plasma CTRP1 levels within a normal physiological range.
We initially hypothesized that enhanced renal salt reabsorption could be a possible cause for increased blood pressure in aged CTRP1-deficient mice. To our surprise and contrary to expectation, CTRP1-deficient mice had elevated urinary Na+ and K+ excretion. Consistent and correlated with this phenotype is significantly reduced expression of genes encoding epithelial sodium channels (Scnn1), sodium chloride cotransporter (Ncc), Na+-K+−2Cl− cotransporters (Nkcc), and sodium hydrogen exchanger (Nhe3). All of these transporters, channels, and exchangers are located in the apical membrane along different segments of the nephron and are responsible for reabsorption of Na+ and K+ from the kidney filtrate.82,83 We postulate that reduced expression of these genes partially accounts for greater urinary excretion of Na+ and K+ in aged CTRP1-deficient mice.
Given the unusual combinations of kidney phenotypes, we examined the renal transcriptome of CTRP1-deficient mice. One major finding—based on gene ontology and pathway analysis—is enrichment for genes involved in metabolic processes and pathways in the kidney of CTRP1-deficient mice. In support of pathway analysis based on RNA-seq data, real-time PCR quantification of select metabolic genes involved in lipid metabolism, fat oxidation, and bile acids elimination also revealed significant changes in the kidney of CTRP1-deficient mice. The metabolic role of CTRP1 in kidney is reminiscent of its known metabolic function in other tissues, such as skeletal muscle and liver.14,19,24 We speculate that chronic alterations of renal carbohydrate and fat metabolism promote glomeruli hypertrophy, and these structural changes, in combination with changes in renal gene expression, result in altered Na+/K+ reabsorption. In support of this idea, dysregulated lipid metabolism in the kidney can cause mild or significant renal pathology.84,85 Collectively, our data highlight novel contributions of CTRP1 to renal structural integrity and function during aging.
Supplementary Material
ACKNOWLEDGMENTS
We thank Niranjana Natarajan, Nathan Zaidman, and Victoria Halperin Kuhns for fruitful discussion and technical input. We thank Djahida Bedja for help with echocardiogram studies. This work was supported, in part, by grants from the National Institutes of Health (DK084171 to GWW; DK107726 and HL128512 to JLP), a post-doctoral fellowship from the American Diabetes Association (1-18-PMF-022 to SR), a pre-doctoral fellowship from NIH (F31DK116537 to HCL), and a mini-grant from the National Kidney Foundation of Maryland (NKFMD2017 to SR).
Abbreviations:
- AngII
angiotensin II
- EDV
end-diastolic ventricular volume
- EF
ejection fraction
- ESV
end-systolic ventricular volume
- FS
fractional shortening
- GO
gene ontology
- HSD
high-salt diet
- IVSD
inter-ventricular septal thickness at end of diastole
- KEGG
Kyoto Encyclopedia of Genes and Genomes
- KO
knockout
- LFD
low-fat diet
- LSD
low-salt diet
- LV
left ventricle
- LVEDD
LV chamber diameter at end of diastole
- LVESD
LV chamber diameter at end of systole
- PWTED
posterior wall thickness at end of diastole
- PWV
pulse wave velocity
- RWT
relative wall thickness
- SV
stroke volume
- WT
wild-type
Footnotes
Publisher's Disclaimer: DISCLAIMER
Publisher's Disclaimer: This work was prepared while Andrew Wolfe was employed at Johns Hopkins University. The opinions expressed in this article are the author’s own and do not reflect the view of the National Institutes of Health, the Department of Health and Human Services, or the United States government.
CONFLICT OF INTEREST
The authors have no conflicts of interest to declare.
SUPPORTING INFORMATION
Additional supporting information may be found online in the Supporting Information section.
REFERENCES
- 1.Denic A, Glassock RJ, Rule AD. Structural and functional changes with the aging kidney. Adv Chronic Kidney Dis. 2016;23:19–28. [DOI] [PMC free article] [PubMed] [Google Scholar]
- 2.Zhou XJ, Rakheja D, Yu X, Saxena R, Vaziri ND, Silva FG. The aging kidney. Kidney Int. 2008;74:710–720. [DOI] [PubMed] [Google Scholar]
- 3.Schmitt R, Melk A. Molecular mechanisms of renal aging. Kidney Int. 2017;92:569–579. [DOI] [PubMed] [Google Scholar]
- 4.Lee HY, Oh BH. Aging and arterial stiffness. Circ J. 2010;74:2257–2262. [DOI] [PubMed] [Google Scholar]
- 5.Weinstein JR, Anderson S. The aging kidney: physiological changes. Adv Chronic Kidney Dis. 2010;17:302–307. [DOI] [PMC free article] [PubMed] [Google Scholar]
- 6.Seldin MM, Tan SY, Wong GW. Metabolic function of the CTRP family of hormones. Rev Endocr Metab Disord. 2014;15:111–123. [DOI] [PMC free article] [PubMed] [Google Scholar]
- 7.Wong GW, Krawczyk SA, Kitidis-Mitrokostas C, Revett T, Gimeno R, Lodish HF. Molecular, biochemical and functional characterizations of C1q/TNF family members: adipose-tissue-selective expression patterns, regulation by PPAR-gamma agonist, cysteine-mediated oligomerizations, combinatorial associations and metabolic functions. Biochem J. 2008;416:161–177. [DOI] [PMC free article] [PubMed] [Google Scholar]
- 8.Wong GW, Wang J, Hug C, Tsao TS, Lodish HF. A family of Acrp30/adiponectin structural and functional paralogs. Proc Natl Acad Sci U S A. 2004;101:10302–10307. [DOI] [PMC free article] [PubMed] [Google Scholar]
- 9.Byerly MS, Petersen PS, Ramamurthy S, et al. C1q/TNF-related protein 4 (CTRP4) is a unique secreted protein with two tandem C1q domains that functions in the hypothalamus to modulate food intake and body weight. J Biol Chem. 2014;289:4055–4069. [DOI] [PMC free article] [PubMed] [Google Scholar]
- 10.Byerly MS, Swanson R, Wei Z, Seldin MM, McCulloh PS, Wong GW. A central role for C1q/TNF-related protein 13 (CTRP13) in modulating food intake and body weight. PLoS One. 2013;8:e62862. [DOI] [PMC free article] [PubMed] [Google Scholar]
- 11.Lei X, Rodriguez S, Petersen PS, et al. Loss of CTRP5 improves insulin action and hepatic steatosis. Am J Physiol Endocrinol Metab. 2016;310:E1036–E1052. [DOI] [PMC free article] [PubMed] [Google Scholar]
- 12.Lei X, Seldin MM, Little HC, Choy N, Klonisch T, Wong GW. C1q/TNF-related protein 6 (CTRP6) links obesity to adipose tissue inflammation and insulin resistance. J Biol Chem. 2017;292:14836–14850. [DOI] [PMC free article] [PubMed] [Google Scholar]
- 13.Petersen PS, Lei X, Wolf RM, et al. CTRP7 deletion attenuates obesity-linked glucose intolerance, adipose tissue inflammation, and hepatic stress. Am J Physiol Endocrinol Metab. 2017;312:E309–E325. [DOI] [PMC free article] [PubMed] [Google Scholar]
- 14.Peterson JM, Aja S, Wei Z, Wong GW. C1q/TNF-related protein-1 (CTRP1) enhances fatty acid oxidation via AMPK activation and ACC inhibition. J Biol Chem. 2012;287:1576–1587. [DOI] [PMC free article] [PubMed] [Google Scholar]
- 15.Peterson JM, Seldin MM, Tan SY, Wong GW. CTRP2 overexpression improves insulin and lipid tolerance in diet-induced obese mice. PLoS One. 2014;9:e88535. [DOI] [PMC free article] [PubMed] [Google Scholar]
- 16.Peterson JM, Seldin MM, Wei Z, Aja S, Wong GW. CTRP3 attenuates diet-induced hepatic steatosis by regulating triglyceride metabolism. Am J Physiol Gastrointest Liver Physiol. 2013;305:G214–G224. [DOI] [PMC free article] [PubMed] [Google Scholar]
- 17.Peterson JM, Wei Z, Seldin MM, Byerly MS, Aja S, Wong GW. CTRP9 transgenic mice are protected from diet-induced obesity and metabolic dysfunction. Am J Physiol Regul Integr Comp Physiol. 2013;305:R522–R533. [DOI] [PMC free article] [PubMed] [Google Scholar]
- 18.Peterson JM, Wei Z, Wong GW. C1q/TNF-related protein-3 (CTRP3), a novel adipokine that regulates hepatic glucose output. J Biol Chem. 2010;285:39691–39701. [DOI] [PMC free article] [PubMed] [Google Scholar]
- 19.Rodriguez S, Lei X, Petersen PS, Tan SY, Little HC, Wong GW. Loss of CTRP1 disrupts glucose and lipid homeostasis. Am J Physiol Endocrinol Metab. 2016;311:E678–E697. [DOI] [PMC free article] [PubMed] [Google Scholar]
- 20.Seldin MM, Peterson JM, Byerly MS, Wei Z, Wong GW. Myonectin (CTRP15), a novel myokine that links skeletal muscle to systemic lipid homeostasis. J Biol Chem. 2012;287:11968–11980. [DOI] [PMC free article] [PubMed] [Google Scholar]
- 21.Tan SY, Little HC, Lei X, Li S, Rodriguez S, Wong GW. Partial deficiency of CTRP12 alters hepatic lipid metabolism. Physiol Genomics. 2016;48:936–949. [DOI] [PMC free article] [PubMed] [Google Scholar]
- 22.Wei Z, Lei X, Petersen PS, Aja S, Wong GW. Targeted deletion of C1q/TNF-related protein 9 increases food intake, decreases insulin sensitivity, and promotes hepatic steatosis in mice. Am J Physiol Endocrinol Metab. 2014;306:E779–E790. [DOI] [PMC free article] [PubMed] [Google Scholar]
- 23.Wei Z, Peterson JM, Lei X, et al. C1q/TNF-related protein-12 (CTRP12), a novel adipokine that improves insulin sensitivity and glycemic control in mouse models of obesity and diabetes. J Biol Chem. 2012;287:10301–10315. [DOI] [PMC free article] [PubMed] [Google Scholar]
- 24.Han S, Park JS, Lee S, et al. CTRP1 protects against diet-induced hyperglycemia by enhancing glycolysis and fatty acid oxidation. J Nutr Biochem. 2016;27:43–52. [DOI] [PubMed] [Google Scholar]
- 25.Wong GW, Krawczyk SA, Kitidis-Mitrokostas C, et al. Identification and characterization of CTRP9, a novel secreted glycoprotein, from adipose tissue that reduces serum glucose in mice and forms heterotrimers with adiponectin. FASEB J. 2009;23:241–258. [DOI] [PMC free article] [PubMed] [Google Scholar]
- 26.Appari M, Breitbart A, Brandes F, et al. C1q-TNF-related protein-9 promotes cardiac hypertrophy and failure. Circ Res. 2017;120:66–77. [DOI] [PubMed] [Google Scholar]
- 27.Sun Y, Yi W, Yuan Y, et al. C1q/tumor necrosis factor-related protein-9, a novel adipocyte-derived cytokine, attenuates adverse remodeling in the ischemic mouse heart via protein kinase a activation. Circulation. 2013;128:S113–S120. [DOI] [PMC free article] [PubMed] [Google Scholar]
- 28.Yan W, Guo Y, Tao L, et al. C1q/tumor necrosis factor-related protein-9 regulates the fate of implanted mesenchymal stem cells and mobilizes their protective effects against ischemic heart injury via multiple novel signaling pathways. Circulation. 2017;136: 2162–2177. [DOI] [PMC free article] [PubMed] [Google Scholar]
- 29.Kambara T, Ohashi K, Shibata R, et al. CTRP9 protein protects against myocardial injury following ischemia-reperfusion through AMP-activated protein kinase (AMPK)-dependent mechanism. J Biol Chem. 2012;287:18965–18973. [DOI] [PMC free article] [PubMed] [Google Scholar]
- 30.Kambara T, Shibata R, Ohashi K, et al. C1q/tumor necrosis factor-related protein 9 protects against acute myocardial injury through an adiponectin receptor I-AMPK-dependent mechanism. Mol Cell Biol. 2015;35:2173–2185. [DOI] [PMC free article] [PubMed] [Google Scholar]
- 31.Kanemura N, Shibata R, Ohashi K, et al. C1q/TNF-related protein 1 prevents neointimal formation after arterial injury. Atherosclerosis. 2017;257:138–145. [DOI] [PubMed] [Google Scholar]
- 32.Yuasa D, Ohashi K, Shibata R, et al. C1q/TNF-related protein-1 functions to protect against acute ischemic injury in the heart. FASEB J. 2016;30:1065–1075. [DOI] [PubMed] [Google Scholar]
- 33.Lu L, Zhang RY, Wang XQ, et al. C1q/TNF-related protein-1: an adipokine marking and promoting atherosclerosis. Eur Heart J. 2016;37:1762–1771. [DOI] [PubMed] [Google Scholar]
- 34.Liu ZH, Li C, Chen JW, et al. C1q/TNF-related protein 1 promotes endothelial barrier dysfunction under disturbed flow. Biochem Biophys Res Commun. 2017;490:580–586. [DOI] [PubMed] [Google Scholar]
- 35.Wu D, Lei H, Wang JY, et al. CTRP3 attenuates post-infarct cardiac fibrosis by targeting Smad3 activation and inhibiting myofibroblast differentiation. J Mol Med. 2015;93:1311–1325. [DOI] [PubMed] [Google Scholar]
- 36.Uemura Y, Shibata R, Ohashi K, et al. Adipose-derived factor CTRP9 attenuates vascular smooth muscle cell proliferation and neointimal formation. FASEB J. 2013;27:25–33. [DOI] [PubMed] [Google Scholar]
- 37.Enomoto T, Ohashi K, Shibata R, et al. Adipolin/C1qdc2/CTRP12 functions as an adipokine that improves glucose metabolism. J Biol Chem. 2011;286:34552–34558. [DOI] [PMC free article] [PubMed] [Google Scholar]
- 38.Petersen PS, Wolf RM, Lei X, Peterson JM, Wong GW. Immunomodulatory roles of CTRP3 in endotoxemia and metabolic stress. Physiol Rep. 2016;4:e12735. [DOI] [PMC free article] [PubMed] [Google Scholar]
- 39.Murayama MA, Kakuta S, Maruhashi T, et al. CTRP3 plays an important role in the development of collagen-induced arthritis in mice. Biochem Biophys Res Commun. 2014;443:42–48. [DOI] [PubMed] [Google Scholar]
- 40.Murayama MA, Kakuta S, Inoue A, et al. CTRP6 is an endogenous complement regulator that can effectively treat induced arthritis. Nat Commun. 2015;6:8483. [DOI] [PMC free article] [PubMed] [Google Scholar]
- 41.Bai B, Ban B, Liu Z, Zhang MM, Tan BK, Chen J. Circulating C1q complement/TNF-related protein (CTRP) 1, CTRP9, CTRP12 and CTRP13 concentrations in type 2 diabetes mellitus: in vivo regulation by glucose. PLoS One. 2017;12:e0172271. [DOI] [PMC free article] [PubMed] [Google Scholar]
- 42.Han S, Kim JD, Lee S, et al. Circulating CTRP1 levels in type 2 diabetes and their association with FGF21. Int J Endocrinol. 2016;2016:5479627. [DOI] [PMC free article] [PubMed] [Google Scholar]
- 43.Pan X, Lu T, Wu F, et al. Circulating complement-C1q TNF-related protein 1 levels are increased in patients with type 2 diabetes and are associated with insulin sensitivity in Chinese subjects. PLoS One. 2014;9:e94478. [DOI] [PMC free article] [PubMed] [Google Scholar]
- 44.Xin Y, Lyu X, Wang C, et al. Elevated circulating levels of CTRP1, a novel adipokine, in diabetic patients. Endocr J. 2014;61:841–847. [DOI] [PubMed] [Google Scholar]
- 45.Chalupova L, Zakovska A, Adamcova K. Development of a novel enzyme-linked immunosorbent assay (ELISA) for measurement of serum CTRP1: a pilot study: measurement of serum CTRP1 in healthy donors and patients with metabolic syndrome. Clin Biochem. 2013;46:73–78. [DOI] [PubMed] [Google Scholar]
- 46.Shabani P, Naeimi Khaledi H, Beigy M, et al. Circulating level of CTRP1 in patients with nonalcoholic fatty liver disease (NAFLD): is it through insulin resistance? PLoS One. 2015;10:e0118650. [DOI] [PMC free article] [PubMed] [Google Scholar]
- 47.Shen Y, Lu L, Liu ZH, et al. Increased serum level of CTRP1 is associated with low coronary collateralization in stable angina patients with chronic total occlusion. Int J Cardiol. 2014;174:203–206. [DOI] [PubMed] [Google Scholar]
- 48.Wang H, Wang R, Du D, Li F, Li Y. Serum levels of C1q/TNF-related protein-1 (CTRP-1) are closely associated with coronary artery disease. BMC Cardiovasc Disord. 2016;16:92. [DOI] [PMC free article] [PubMed] [Google Scholar]
- 49.Tang JN, Shen DL, Liu CL, et al. Plasma levels of C1q/TNF-related protein 1 and interleukin 6 in patients with acute coronary syndrome or stable angina pectoris. Am J Med Sci. 2015;349:130–136. [DOI] [PubMed] [Google Scholar]
- 50.Yuasa D, Ohashi K, Shibata R, et al. Association of circulating C1q/TNF-related protein 1 levels with coronary artery disease in men. PLoS One. 2014;9:e99846. [DOI] [PMC free article] [PubMed] [Google Scholar]
- 51.Yang Y, Liu S, Zhang RY, et al. Association between C1q/TNF-related protein-1 levels in human plasma and epicardial adipose tissues and congestive heart failure. Cell Physiol Biochem. 2017;42:2130–2143. [DOI] [PubMed] [Google Scholar]
- 52.Han S, Jeong AL, Lee S, et al. C1q/TNF-alpha–related protein 1 (CTRP1) maintains blood pressure under dehydration conditions. Circ Res. 2018;123(5):e5–e19. [DOI] [PubMed] [Google Scholar]
- 53.Jeon JH, Kim K-Y, Kim JH, et al. A novel adipokine CTRP1 stimulates aldosterone production. FASEB J. 2008;22:1502–1511. [DOI] [PubMed] [Google Scholar]
- 54.Ramkumar N, Stuart D, Rees S, Hoek AV, Sigmund CD, Kohan DE. Collecting duct-specific knockout of renin attenuates angiotensin II-induced hypertension. Am J Physiol Renal Physiol. 2014;307:F931–F938. [DOI] [PMC free article] [PubMed] [Google Scholar]
- 55.Crowley SD, Gurley SB, Herrera MJ, et al. Angiotensin II causes hypertension and cardiac hypertrophy through its receptors in the kidney. Proc Natl Acad Sci U S A. 2006;103:17985–17990. [DOI] [PMC free article] [PubMed] [Google Scholar]
- 56.Lei X, Li Q, Rodriguez S, et al. Thromboxane synthase deficiency improves insulin action and attenuates adipose tissue fibrosis. Am J Physiol Endocrinol Metab. 2015;308:E792–E804. [DOI] [PMC free article] [PubMed] [Google Scholar]
- 57.Wolf RM, Lei X, Yang ZC, Nyandjo M, Tan SY, Wong GW. CTRP3 deficiency reduces liver size and alters IL-6 and TGFbeta levels in obese mice. Am J Physiol Endocrinol Metab. 2016;310:E332–E345. [DOI] [PMC free article] [PubMed] [Google Scholar]
- 58.Schmittgen TD, Livak KJ. Analyzing real-time PCR data by the comparative C(T) method. Nat Protoc. 2008;3:1101–1108. [DOI] [PubMed] [Google Scholar]
- 59.Schreiber A, Shulhevich Y, Geraci S, et al. Transcutaneous measurement of renal function in conscious mice. Am J Physiol Renal Physiol. 2012;303:F783–F788. [DOI] [PubMed] [Google Scholar]
- 60.Olson LE, Bedja D, Alvey SJ, Cardounel AJ, Gabrielson KL, Reeves RH. Protection from doxorubicin-induced cardiac toxicity in mice with a null allele of carbonyl reductase 1. Cancer Res. 2003;63:6602–6606. [PubMed] [Google Scholar]
- 61.Wei H, Bedja D, Koitabashi N, et al. Endothelial expression of hypoxia-inducible factor 1 protects the murine heart and aorta from pressure overload by suppression of TGF-beta signaling. Proc Natl Acad Sci U S A. 2012;109:E841–E850. [DOI] [PMC free article] [PubMed] [Google Scholar] [Retracted]
- 62.Benavides-Vallve C, Corbacho D, Iglesias-Garcia O, et al. New strategies for echocardiographic evaluation of left ventricular function in a mouse model of long-term myocardial infarction. PLoS One. 2012;7:e41691. [DOI] [PMC free article] [PubMed] [Google Scholar]
- 63.Arias T, Chen J, Fayad ZA, Fuster V, Hajjar RJ, Chemaly ER. Comparison of echocardiographic measurements of left ventricular volumes to full volume magnetic resonance imaging in normal and diseased rats. J Am Soc Echocardiogr. 2013;26:910–918. [DOI] [PMC free article] [PubMed] [Google Scholar]
- 64.Chatterjee S, Bedja D, Mishra S, et al. Inhibition of glycosphingolipid synthesis ameliorates atherosclerosis and arterial stiffness in apolipoprotein E−/− mice and rabbits fed a high-fat and -cholesterol diet. Circulation. 2014;129:2403–2413. [DOI] [PMC free article] [PubMed] [Google Scholar]
- 65.Dupont NC, Wang K, Wadhwa PD, Culhane JF, Nelson EL. Validation and comparison of luminex multiplex cytokine analysis kits with ELISA: determinations of a panel of nine cytokines in clinical sample culture supernatants. J Reprod Immunol. 2005;66:175–191. [DOI] [PMC free article] [PubMed] [Google Scholar]
- 66.Tighe P, Negm O, Todd I, Fairclough L. Utility, reliability and reproducibility of immunoassay multiplex kits. Methods. 2013;61:23–29. [DOI] [PubMed] [Google Scholar]
- 67.Moncunill G, Aponte JJ, Nhabomba AJ, Dobano C. Performance of multiplex commercial kits to quantify cytokine and chemokine responses in culture supernatants from Plasmodium falciparum stimulations. PLoS One. 2013;8:e52587. [DOI] [PMC free article] [PubMed] [Google Scholar]
- 68.Scheler M, Irmler M, Lehr S, et al. Cytokine response of primary human myotubes in an in vitro exercise model. Am J Physiol Cell Physiol. 2013;305:C877–C886. [DOI] [PubMed] [Google Scholar]
- 69.Levine SJ. Molecular mechanisms of soluble cytokine receptor generation. J Biol Chem. 2008;283:14177–14181. [DOI] [PMC free article] [PubMed] [Google Scholar]
- 70.Petersen PS, Lei X, Seldin MM, et al. Dynamic and extensive metabolic state-dependent regulation of cytokine expression and circulating levels. Am J Physiol Regul Integr Comp Physiol. 2014;307:R1458–R1470. [DOI] [PMC free article] [PubMed] [Google Scholar]
- 71.Little HC, Tan SY, Cali FM, et al. Multiplex quantification identifies novel exercise-regulated myokines/cytokines in plasma and in glycolytic and oxidative skeletal muscle. Mol Cell Proteomics. 2018;17:1546–1563. [DOI] [PMC free article] [PubMed] [Google Scholar]
- 72.Park J, Shrestha R, Qiu C, et al. Single-cell transcriptomics of the mouse kidney reveals potential cellular targets of kidney disease. Science. 2018;360:758–763. [DOI] [PMC free article] [PubMed] [Google Scholar]
- 73.Kann M, Ettou S, Jung YL, et al. Genome-wide analysis of Wilms’ tumor 1-controlled gene expression in podocytes reveals key regulatory mechanisms. J Am Soc Nephrol. 2015;26:2097–2104. [DOI] [PMC free article] [PubMed] [Google Scholar]
- 74.Cho KJ, Yang Y, Lee YH, Kim S. Podocyte-specific expression of C1q/TNF-related protein 1 in mice. Korean J Phys Anthropol. 2013;26:147–153. [Google Scholar]
- 75.Kurata A, Nishizawa H, Kihara S, et al. Blockade of Angiotensin II type-1 receptor reduces oxidative stress in adipose tissue and ameliorates adipocytokine dysregulation. Kidney Int. 2006;70:1717–1724. [DOI] [PubMed] [Google Scholar]
- 76.Hoenig MP, Zeidel ML. Homeostasis, the milieu interieur, and the wisdom of the nephron. Clin J Am Soc Nephrol. 2014;9:1272–1281. [DOI] [PMC free article] [PubMed] [Google Scholar]
- 77.Akchurin OM, Kaskel F. Update on inflammation in chronic kidney disease. Blood Purif. 2015;39:84–92. [DOI] [PubMed] [Google Scholar]
- 78.Eriksen BO, Ingebretsen OC. The progression of chronic kidney disease: a 10-year population-based study of the effects of gender and age. Kidney Int. 2006;69:375–382. [DOI] [PubMed] [Google Scholar]
- 79.Scholzen T, Gerdes J. The Ki-67 protein: from the known and the unknown. J Cell Physiol. 2000;182:311–322. [DOI] [PubMed] [Google Scholar]
- 80.Wolf G, Ziyadeh FN. Molecular mechanisms of diabetic renal hypertrophy. Kidney Int. 1999;56:393–405. [DOI] [PubMed] [Google Scholar]
- 81.D’Agati VD, Chagnac A, de Vries AP, et al. Obesity-related glomerulopathy: clinical and pathologic characteristics and pathogenesis. Nat Rev Nephrol. 2016;12:453–471. [DOI] [PubMed] [Google Scholar]
- 82.Esteva-Font C, Ballarin J, Fernandez-Llama P. Molecular biology of water and salt regulation in the kidney. Cell Mol Life Sci. 2012;69:683–695. [DOI] [PMC free article] [PubMed] [Google Scholar]
- 83.Knepper MA, Brooks HL. Regulation of the sodium transporters NHE3, NKCC2 and NCC in the kidney. Curr Opin Nephrol Hypertens. 2001;10:655–659. [DOI] [PubMed] [Google Scholar]
- 84.de Vries AP, Ruggenenti P, Ruan XZ, et al. Fatty kidney: emerging role of ectopic lipid in obesity-related renal disease. Lancet Diabetes Endocrinol. 2014;2:417–426. [DOI] [PubMed] [Google Scholar]
- 85.Svensson K, Schnyder S, Cardel B, Handschin C. Loss of renal tubular PGC-1alpha exacerbates diet-induced renal steatosis and age-related urinary sodium excretion in mice. PLoS ONE. 2016;11:e0158716. [DOI] [PMC free article] [PubMed] [Google Scholar]
Associated Data
This section collects any data citations, data availability statements, or supplementary materials included in this article.