

Abstract
Background
The rapid growth of the older population is having a substantial impact on health and social care services in many societies across the world. Maintaining health and functioning in older age is a key public health issue but few studies have examined factors associated with inequalities in trajectories of health and functioning across countries. The aim of this study is to investigate trajectories of healthy ageing in older men and women and the impact of education and wealth on the trajectories.
Methods
This analysis was based on eight longitudinal cohorts from Australia, USA, Japan, South Korea, Mexico and Europe (N=141,214) harmonised by the EU Ageing Trajectories of Health: Longitudinal Opportunities and Synergies (ATHLOS) consortium. Multilevel modelling was used to investigate the impact of education and wealth on trajectories of healthy ageing scores, which incorporated 41 items of physical and cognitive functioning with a range between 0 (poor) and 100 (good).
Findings
Education and wealth affected baseline scores of healthy ageing but had minimal impacts on decline rates. Compared to those with primary or less education, participants with tertiary education had higher baseline scores (10∙54; 95% confidence interval (CI): 10∙31, 10∙77) adjusting for age, sex and cohort studies. The adjusted difference between lowest and highest quintiles of wealth was 8∙98 points (95% CI: 8∙74, 9∙22). Among the eight cohorts, the strongest inequality gradient was found in the Health Retirement Study from the USA.
Interpretation
The apparent difference in baseline scores suggests that cumulative disadvantage due to low education and wealth might have largely deteriorated health conditions in early life stages, leading to persistent differences throughout older age. Future research should adopt a lifecourse approach to investigate mechanisms of health inequalities across education and wealth in different societies.
Introduction
Due to a decline in health status, increase of non-communicable diseases, disability and care dependence in later life, the rapid growth of the older population will lead to an increased burden on the already stretched health and social care services.1 To address the potential impact of population ageing, the concept of ‘healthy ageing’, which is defined by World Health Organization (WHO) as ‘the process of developing and maintaining the functional ability that enables wellbeing in older age’,2 has become a key topic in policy planning and health research. Functional ability focuses on having the capabilities that enable all people to meet their basic needs; to learn, grow and make decisions; to be mobile; to build and maintain relationships; and to contribute to society. This is made up of the interaction between intrinsic capacity, which combines all the individual’s physical and mental, psychosocial capacities, and environmental characteristics, which form the context of an individual’s life. This latest concept highlights the need to focus on positive aspects of ageing and the importance of considering both individual and contextual factors that may support health and functioning in later life. Whereas, traditional concepts in medical research, such as frailty, accumulated deficits or multimorbidity, have generally focused on negative aspects of health and on the identification of underlying biological and pathological abnormalities in older people.3,4
Previous research on health inequalities has focused on a wide range of outcomes such as specific chronic diseases, multimorbidity, frailty and disability, mortality and life expectancy,5–7 where consistent socioeconomic inequalities according to factors such as education, occupational class and income have been reported. To provide a nuanced understanding of healthy ageing, it is important to investigate how the process of maintaining health and functioning differs across socioeconomic groups. A recent systematic review has summarised risk and protective factors related to healthy ageing.8 Several studies were identified that reported a positive impact of education and income on ageing outcomes, suggesting the existence of health inequalities in later life across different socioeconomic positions.8 However, existing studies have used diverse measures and analytical methods, leading to problems in study comparability. This has also hindered the assessment of factors that could be responsible for variations across countries.
To provide a better understanding of healthy ageing, the Ageing Trajectories of Health: Longitudinal Opportunities and Synergies (ATHLOS) Project harmonised a wide range of sociodemographic, lifestyle, health and functioning factors from 17 ageing cohorts across the globe.9 The research team also developed a measure which incorporated multiple domains of physical and cognitive functioning and provided an indicator for healthy ageing across time and cohorts.10 Built on the ATHLOS work of data harmonisation and methodology development, the aim of this study is to investigate the impact of education and wealth on trajectories of healthy ageing and to examine whether health inequalities across education and wealth vary in diverse older populations.
Methods
Study population
The ATHLOS Project9 brought together 17 ageing studies across the world and harmonised a wide range of lifestyle, social environment, physical and psychological health factors across different studies. Documentation of the harmonisation process can be accessed at: https://github.com/athlosproject/athlos-project.github.io. To estimate longitudinal changes in health status, the present analysis excluded cohorts with one- or two-wave investigations due to study design (N=192,114) and focused on the eight cohorts with at least three waves of data (N=141,214). This included the Australian Longitudinal Study of Ageing (ALSA),11 the English Longitudinal Study of Ageing (ELSA),12 the Study on Nutrition and Cardiovascular Health in Older Adults in Spain (Seniors-ENRICA),13 the Health and Retirement Study (HRS),14 the Japanese Study of Ageing and Retirement (JSTAR),15 the Korean Longitudinal Study of Ageing (KLOSA),16 the Mexican Health and Ageing Study (MHAS)17 and the Survey of Health Ageing and Retirement in Europe (SHARE).18
Healthy ageing score
Based on the WHO healthy ageing framework, researchers from the ATHLOS consortium reviewed measures of functional ability in the ageing cohorts and identified 41 items related to health, physical and cognitive functioning. These 41 items were harmonised into binary variables and item-response theory modelling was employed to generate a common measure for healthy ageing across cohorts.10 Using the baseline data of all individuals, a two parameter logistic model was fitted to incorporate all the items and estimate a latent trait score reflecting individual health and functioning level. The estimated parameters from baseline data were applied to follow-up waves and used to generate the scores at different time points. The scores were rescaled into a range between 0 and 100 and a higher score indicated better healthy ageing. More detailed information is provided in Supporting Information S2.
Sociodemographic factors
This analysis focused on five key factors: age, sex, cohort study, education and wealth. To align different baseline age across cohort studies, age was centred to 70 years old (age–70) as one of the cohort studies, ALSA, did not have participants aged 70 years or below. The ATHLOS harmonised dataset provided four levels of education qualification: less than primary education, primary, secondary and tertiary. Since some cohort studies had very few or no participants with less than primary education, the first two levels were combined and the three levels of education were: low (up to primary education), middle (secondary) and high (tertiary). Wealth was a harmonised variable indicating relative position of individuals within specific cohorts. Appropriate measures for personal or household income and finance (such as property, pension or insurance) were identified and divided into quintiles within cohorts (Q1: most deprived; Q5: most affluent). Comparable information was not available in Seniors-ENRICA and therefore this specific analysis only included seven cohort studies. More detailed information on harmonisation is provided in Supporting Information S3.
Analytical strategy
Since multilevel modelling (MLM) can be more flexible when incorporating time variation in follow-up waves across different cohort studies,19 random-effect model using the MLM framework was conducted to investigate trajectories of health metric scores and examine the effect of sociodemographic factors accounting for non-independence of repeated measures over time. The model was fitted to estimate fixed and random effects of intercept (baseline scores) and slope (change per year) by years of follow-up, allowing an unstructured covariance matrix of intercept and slope. To examine the impact of sociodemographic factors on the trajectories, the analysis first focused on baseline age and sex and included linear and quadratic terms of age, and the interaction between age and sex in different models. Based on the descriptive information in Supporting Information S1, the gaps of healthy ageing scores became greater in older age groups (Figure S2) and varied across men and women (Figure S3). Thus, a quadratic term of age and interaction between age and sex were fitted to fully account for their impacts on the trajectories. A variable indicating cohort studies was added to the model including age and sex to investigate potential variations across the eight cohort studies adjusting for the two basic demographic factors. Two socioeconomic factors, education and wealth, were further added to the adjusted model including age, sex and study and we examined their effects on intercept and slope estimates. To investigate whether education and wealth might have different impacts on healthy ageing across different cohorts and sex, the analysis further included their interaction terms regressing on intercept and slope. To examine whether specific chronic conditions might explain health inequalities, five types of harmonised chronic diseases, including cardiovascular diseases, hypertension, diabetes, chronic respiratory diseases and joint disorders, were identified at baseline and added to the best model including demographic and socioeconomic factors. To investigate whether the effect of education varied across birth cohorts, interaction terms between birth cohort and education were included in modelling. Model fitness was assessed using Bayesian information criterion (BIC)20 with lower values indicating better model fit. To contextualise the inequality findings, country-level Gini coefficients for population aged 65 or above (https://data.oecd.org/) were obtained to compare with the score differences across education and relative wealth levels.
Several sensitivity analyses were conducted. Quadratic terms of years of follow up were further added in the mixed models to investigate potential non-linear trajectories. Maximum likelihood estimation should provide unbiased estimates given the assumption of missing at random (MAR) mechanism.21 Since the percentages of missing data on education (N=2789, 2∙0%) and wealth (N=4519, 3∙3%) were small in relation to the whole study population, results reported here are based on those with complete information on education or wealth. Loss of statistical power was unlikely to be an issue given the large number of study population. The distributions of education and wealth levels were also found to similar across follow-up waves (Table S3, Supporting Information). To account for potential missing not at random (MNAR) due to mortality, a joint model of longitudinal data on healthy ageing scores and survival data on all-cause mortality was fitted combining multilevel modelling and parametric Weibull survival regression.22 All analyses were based on the ATHLOS harmonised dataset version 1.7 and conducted using Stata 15.1.
Results
Among the eight cohorts, the earliest studies started from 1992 (Table 1). Two larger cohorts, SHARE and HRS, recruited over 30,000 participants while ALSA and Seniors-ENRICA had less than 3,000. The length and frequency of follow-ups varied across studies. Most studies had follow-up every two years for a period of 10 years. The median follow-up period was six years with an interquartile range of nine years. ALSA had 13 waves over two decades while JSTAR only had 3 waves over four years.
Table 1.
Characteristics of study population by eight cohort studies
| Cohort | Location | Baseline age (years) | Sex | Baseline/last follow up year | Number of wave | Low education (<primary): N (%) Missing=2789 (2·0%) |
Wealth (least affluent quintile): N (%) Missing=4519 (3·3%) |
Number of participants | Health status scores: Mean (SD) | |
|---|---|---|---|---|---|---|---|---|---|---|
| Mean (SD) | [range] | Women: N (%) | ||||||||
| ALSA | Australia | 77·5 (5·9) | [70, 103] | 908 (46·6) | 1992/2014 | 13 | 602 (36·7) | 701 (37·3) | 1947 | 56·8 (14·0) |
| ELSA | UK | 62·8 (9·6) | [50, 94] | 7977 (53·1) | 2002/2015 | 7 | 5516 (39·4) | 2600 (18·6) | 15010 | 66·4 (16·8) |
| ENRICA | Spain | 68·7 (6·4) | [60, 93] | 1338 (53·1) | 2008/2015 | 3 | 1373 (54·5) | N/A | 2519 | 67·3 (14·8) |
| HRS | US | 61·20 (9·8) | [50, 103] | 18044 (53·7) | 1992/2012 | 11 | 9359 (27·9) | 6974 (20·8) | 33580 | 65·6 (18·9) |
| JSTAR | Japan | 62·9 (7·1) | [50, 77] | 2616 (50·8) | 2007/2011 | 3 | 1515 (29·6) | 677 (25·2) | 5144 | 76·9 (13·5) |
| KLOSA | S. Korea | 61·5 (11·0) | [45, 105] | 5791 (56·5) | 2006/2012 | 4 | 4651 (45·4) | 2097 (20·9) | 10254 | 68·9 (15·6) |
| MHAS | Mexico | 62·5 (9·6) | [50, 106] | 7310 (53·8) | 2001/2012 | 3 | 10627 (78·3) | 3128 (24·0) | 13601 | 63·9 (16·5) |
| SHARE | Europe | 64·20 (9·9) | [50, 103] | 32500 (54·9) | 2004/2013 | 5 | 15170 (26·3) | 11463 (19·5) | 59159 | 71·1 (17·1) |
| Total | 62·9 (10·1) | [45, 106] | 76484 (54·2) | 48813 (35·3) | 27640 (20·6) | 141214 | 67·5 (17·8) | |||
ALSA: Australian Longitudinal Study of Ageing; ELSA: English Longitudinal Study of Ageing; Seniors-ENRICA: Study on Nutrition and Cardiovascular Health in Older Adults in Spain; HRS: Health and Retirement Study (HRS); JSTAR: Japanese Study of Ageing and Retirement; KLOSA; Korean Longitudinal Study of Ageing; MHAS: Mexican Health and Ageing Study; SHARE: Survey of Health Ageing and Retirement in Europe
Among the 141,214 participants, the percentage of women was 54% (N=76,484) with a range from 47% (N=908) in ALSA and 57% (N=5,791) in KLOSA. The mean age at baseline was 62∙9 years (SD=10∙1) and the range was between 45 and 106 years. MHAS had 78% of participants with primary or no formal education (N=10,627) while HRS (N=9,359), SHARE (N=15,170) and JSTAR (N=1,515) had less than 30% participants with low education. The mean healthy ageing score was 67∙5 (SD=17∙8) across all data and decreased from 69∙5 (SD=17∙0) at baseline, 64∙1 (SD=18∙4) at year 10, to 62∙6 (SD=18∙2) at year 20. The distributions of healthy ageing scores by cohorts are provided in Table 1.
Table 2 reports the associations between trajectories of healthy ageing scores, age and sex. For participants aged 70 years, the baseline score was estimated to be 68∙25 (95% CI: 68∙13, 68∙37) and the decline rate was −1∙11 (95% CI: −1∙13, −1∙09) per year (Figure 1A). Older age was associated with a lower intercept in linear (−0∙66; 95% CI: −0∙68, −0∙65) and quadratic terms of age (−0∙02; 95% CI: −0∙02, −0∙01). Men had higher scores than women (4∙36; 95% CI: 4∙18, 4∙54) and this difference increased with baseline age (0∙05; 95% CI: 0∙04, 0∙07) (Figure 1B). The decline rate was slightly greater in men than women (−0∙02; 95% CI: −0∙04, 0∙00) but the effect size was small. After adjusting for age and sex, variation in intercept and slope was found across cohort studies (Figure 1C; Table S2, Supporting Information). Compared to HRS, a higher baseline score was found in JSTAR (8∙38; 95% CI: 7∙92, 8∙83) and a lower baseline in MHAS (−2∙85; 95% CI: −3∙15, −2∙56). Decline rates were generally greater in HRS and MHAS than other cohort studies.
Table 2.
The association between trajectories of health metrics, age and sex
| Model 1 | Model 2 | Model 3 | |
|---|---|---|---|
| Coeff. (95% CI) | Coeff. (95% CI) | Coeff. (95% CI) | |
| Baseline score | 68·25 (68·13, 68·37) | 66·21 (66·07, 66·36) | 66·19 (66·05, 66·34) |
| Age (years, at baseline) | −0·65 (−0·66, −0·64) | −0·66 (−0·68, −0·65) | −0·66 (−0·67, −0·65) |
| Age2 | −0·02 (−0.02, −0.02) | −0·02 (−0·02, −0·01) | −0·02 (−0·02, −0·01) |
| Sex (men vs women) | 4·36 (4·18, 4·54) | 4·41 (4·22, 4·59) | |
| Age*sex | 0·05 (0·04, 0·07) | 0·05 (0·04, 0·07) | |
| Decline rate (by year of follow-up) | −1·11 (−1.13, −1.09) | −1.11 (−1·12, −1·09) | −1·10 (−1·12, −1·08) |
| Age (years, at baseline) | −0·06 (−0·06, −0·06) | −0·06 (−0·06, −0·06) | −0·06 (−0·06, −0·06) |
| Age2 | 0·00 (0·00, 0·00) | 0·00 (0·00, 0·00) | 0·00 (0·00, 0·00) |
| Sex (men vs women) | −0·02 (−0·04, 0·00) | ||
| Variance | |||
| Intercept | 180·53 (178·81, 182·27) | 176·33 (174·63, 178·04) | 176·32 (174·63, 178·03) |
| Slope | 0·79 (0·77, 0·81) | 0·79 (0·77, 0·81) | 0·79 (0·77, 0·81) |
| Covariance | −2·08 (−2·24, −1·92) | −2·08 (−2·24, −1·91) | −2·07 (−2·23, −1·91) |
| Residual | 83·46 (83·02, 83·90) | 83·48 (83·04, 83·93) | 83·48 (83·04, 83·92) |
| Goodness of fit | |||
| BIC | 3854387 | 3851659 | 3851668 |
Figure 1.
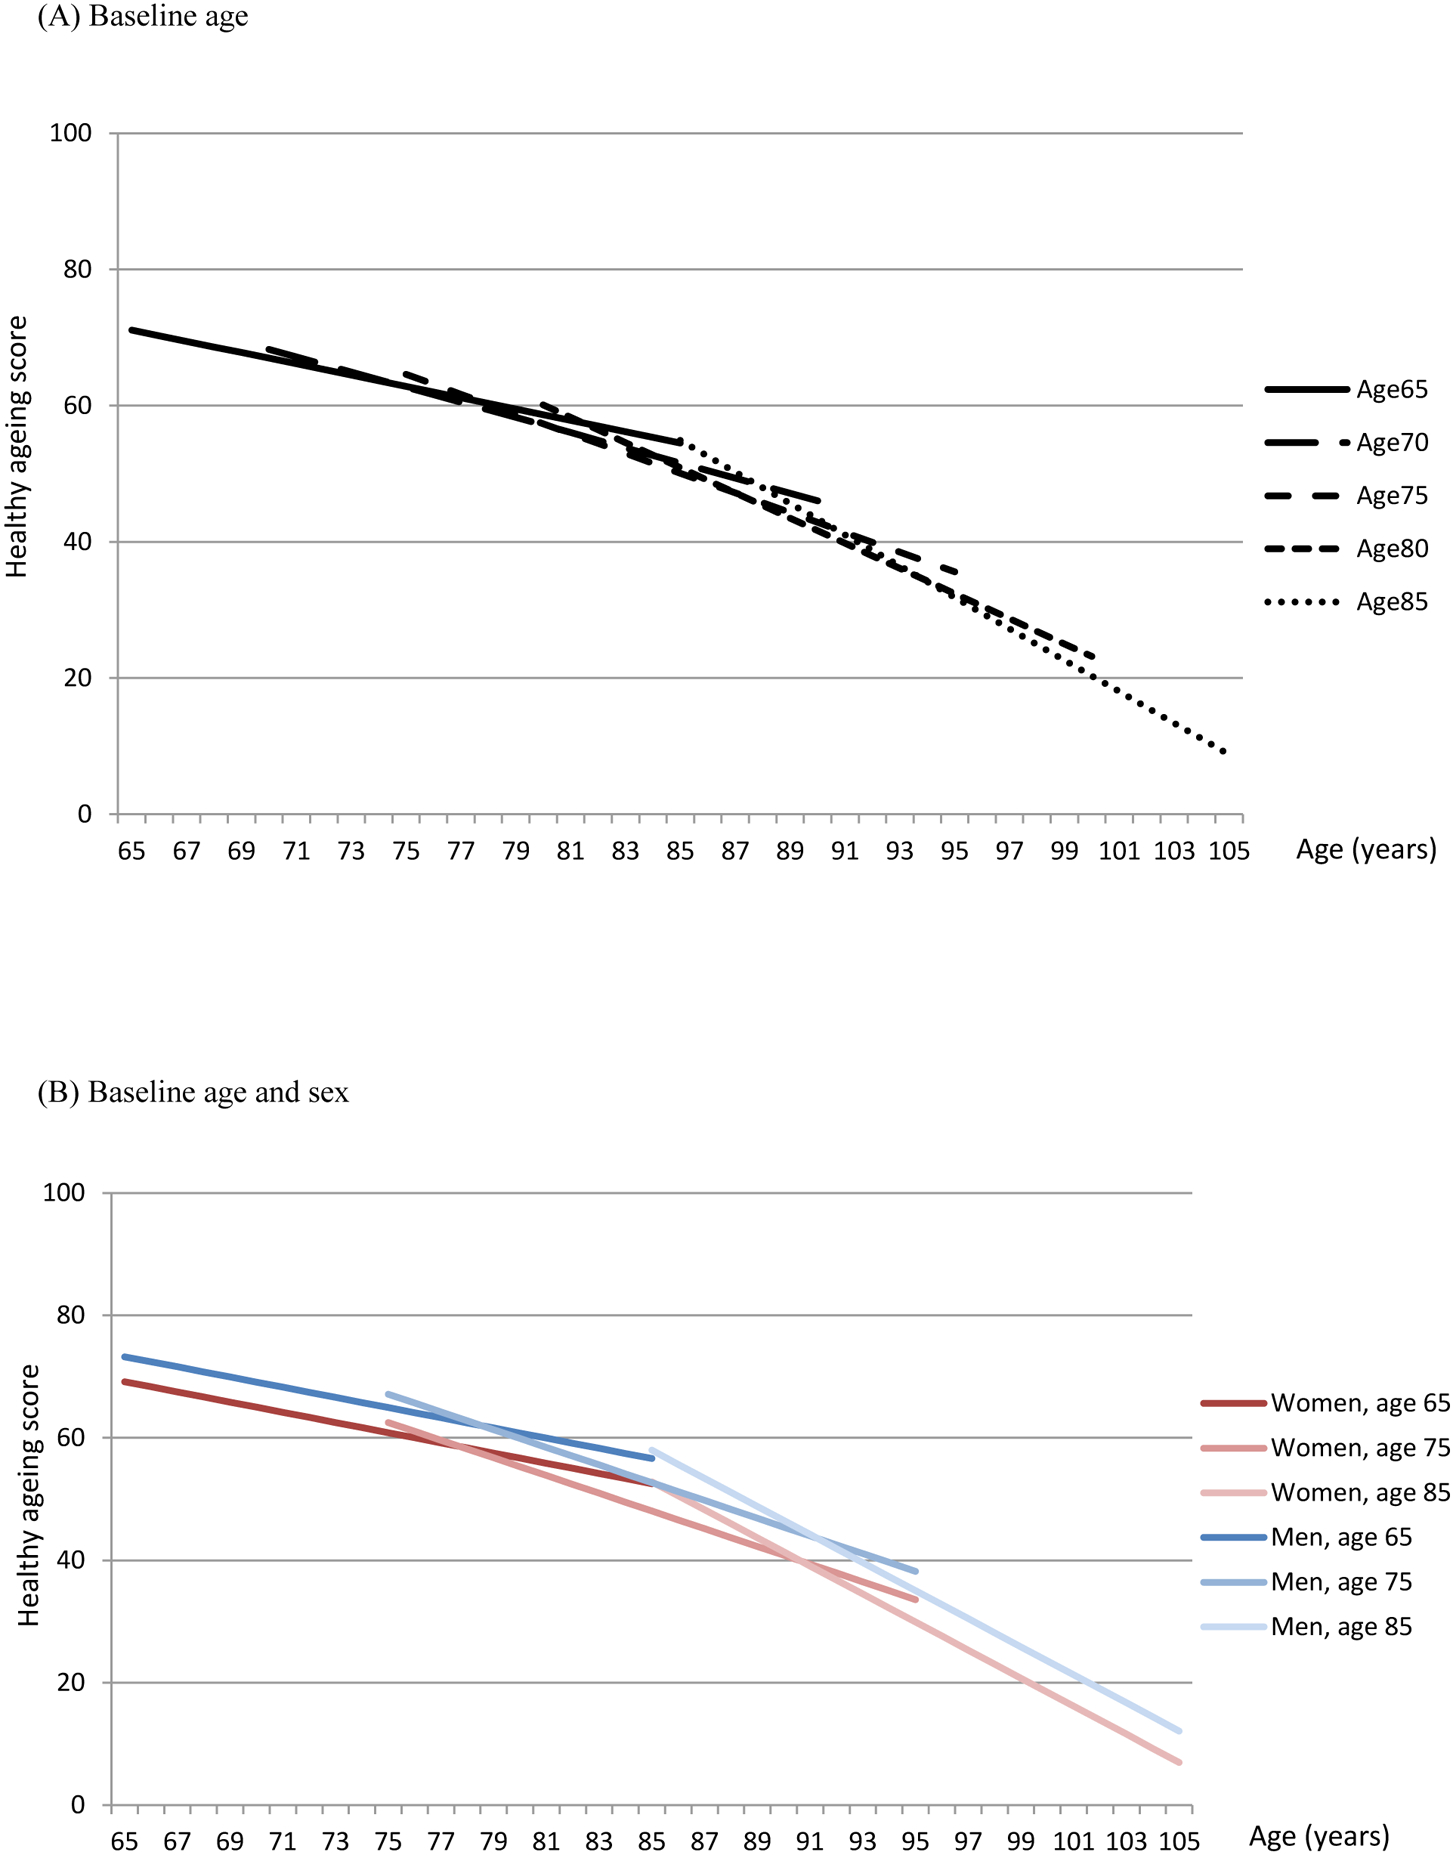
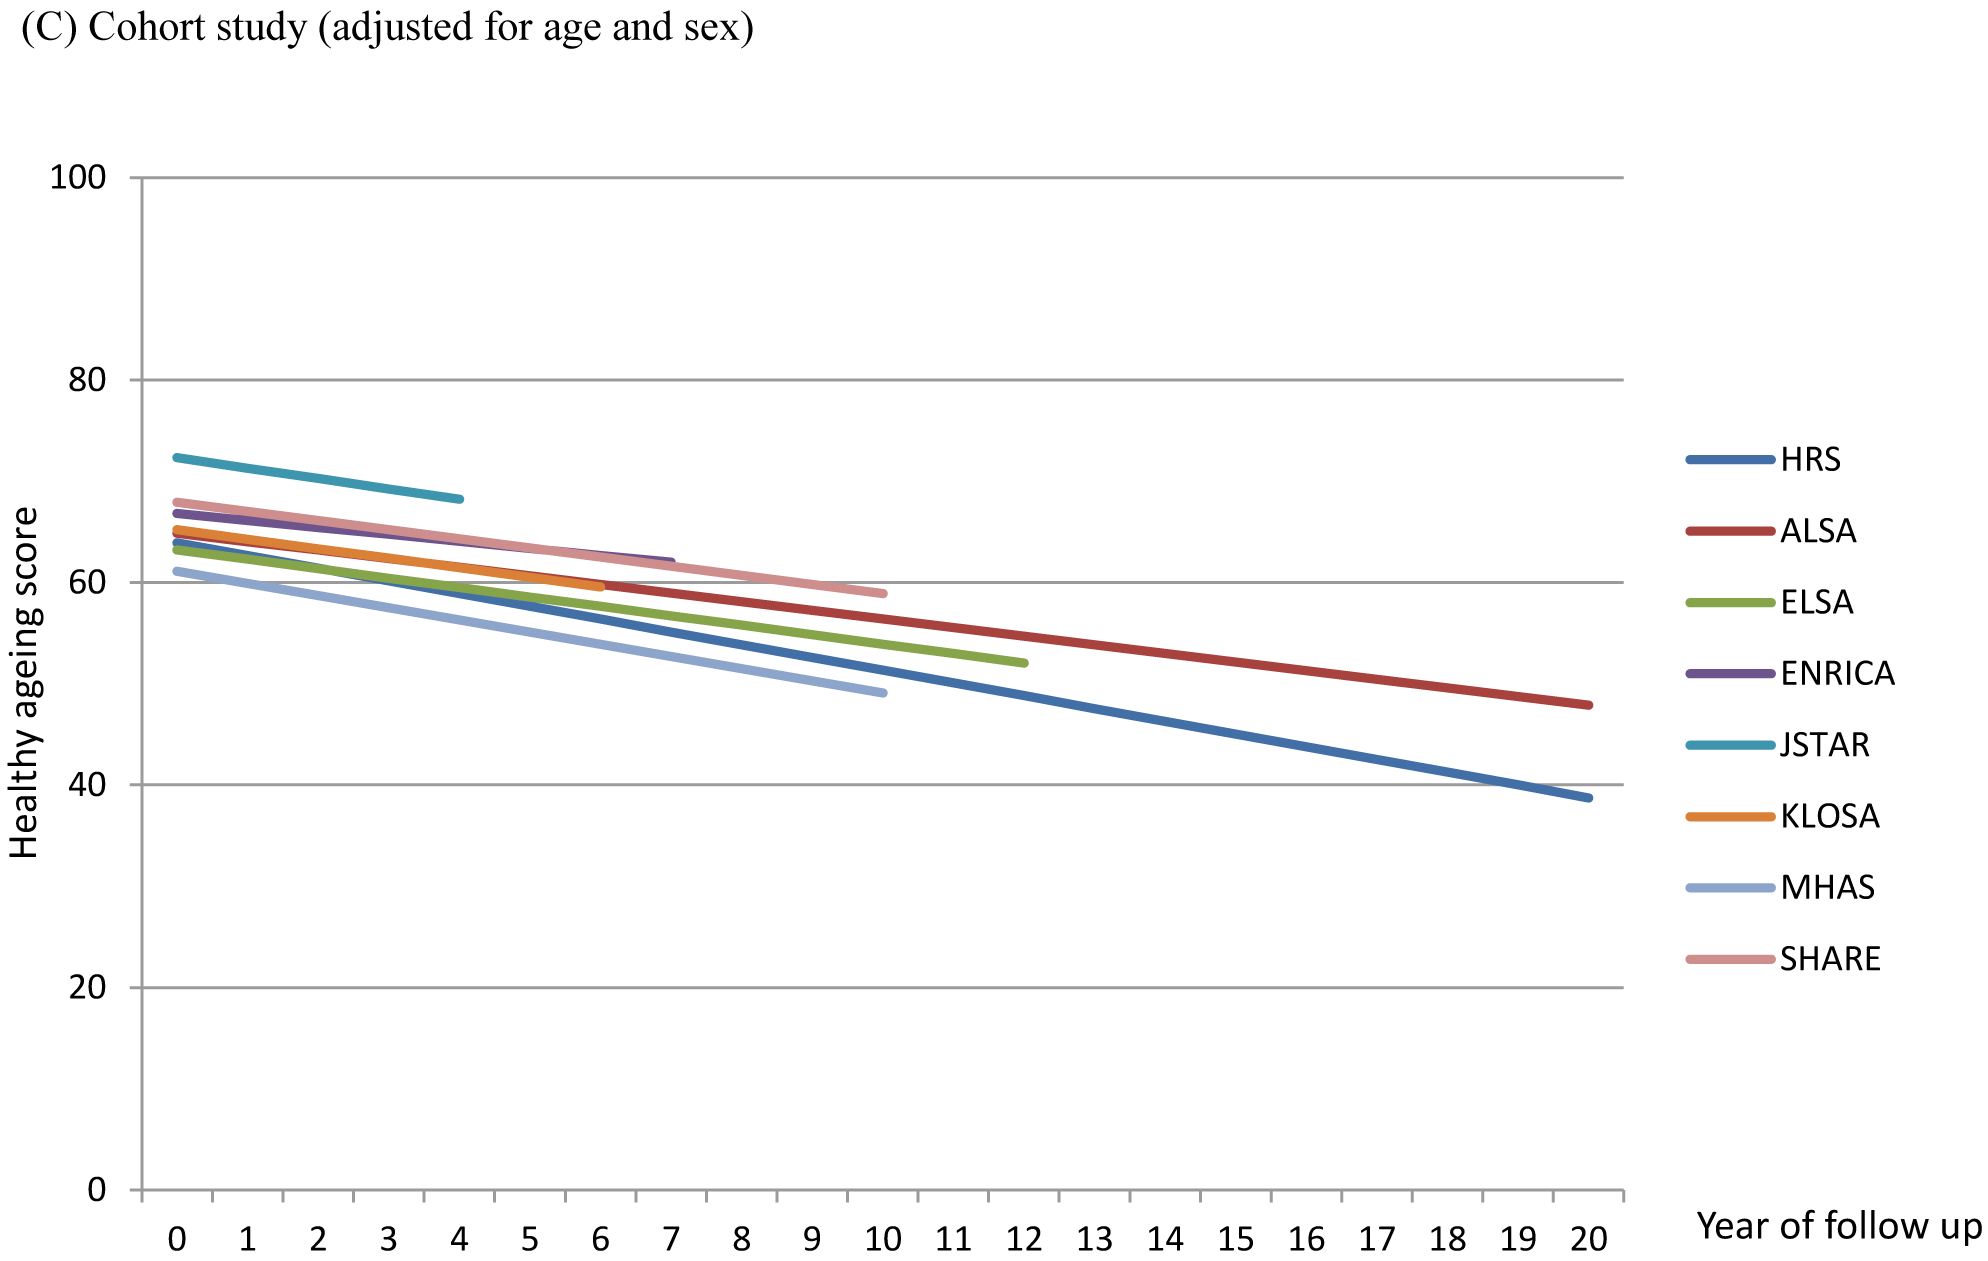
Estimated healthy ageing scores by baseline age, sex and cohort study
ALSA: Australian Longitudinal Study of Ageing; ELSA: English Longitudinal Study of Ageing; Seniors-ENRICA: Study on Nutrition and Cardiovascular Health in Older Adults in Spain; HRS: Health and Retirement Study (HRS); JSTAR: Japanese Study of Ageing and Retirement; KLOSA; Korean Longitudinal Study of Ageing; MHAS: Mexican Health and Ageing Study; SHARE: Survey of Health Ageing and Retirement in Europe
The associations between trajectories of health status, education and relative wealth are reported in Table 3. Both education and relative wealth had a strong influence on the baseline scores but a limited impact on decline rates after adjusting for age, sex and cohort study. Participants with secondary (5∙66; 95% CI: 5∙49, 5∙83) and tertiary education (10∙54; 95% CI: 10∙31, 10∙77) had higher baseline scores than those with primary education or less. Higher level of wealth was associated with higher baseline scores and the difference between the least and most affluent quintiles was 8∙98 points (95% CI: 8∙74, 9∙22). The effect of education and relative wealth on baseline scores varied across cohort studies. ELSA, HRS, MHAS and SHARE had larger variation across education levels (Figure 2A). In these cohort studies, participants with secondary education had higher baseline scores by approximate 6 points and the difference increased to nearly 10 points for those with tertiary education. In JSTAR, Seniors-ENRICA, ALSA and KLOSA, the difference between high and low education was less than 6 points. Although most studies showed increasing baseline scores from the least to the most affluent quintiles, ELSA, HRS and SHARE had stronger gradients compared to other cohort studies (Figure 2B). Due to small numbers of ALSA participants in the third and fourth quintiles, the confidence intervals were very wide. When including both education and relative wealth in one model, the effect sizes remained similar across all cohort studies (Table S4, Supporting Information S4). Education and relative wealth had similar impacts on trajectories of healthy ageing scores in both men and women with very clear gradients from lowest to highest levels of education and relative wealth (Table S5, Supporting Information S4). Further adding chronic conditions did not reduce the gaps across education and wealth levels (Table S6–7, Supporting Information S4) and the effect of education did not vary across birth cohorts (Table S9, Supporting Information S4). The scatter plot of Gini coefficients and effect sizes of inequalities across education and wealth (Figure S6, Supporting Information S4) did not show clear patterns.
Table 3.
The association between education, wealth and trajectories of health metrics (adjusted for age, sex and cohort study)
| Education | Wealth | |||
|---|---|---|---|---|
| Model 1 | Model 2 | Model 1 | Model 2 | |
| Coeff. (95% CI) | Coeff. (95% CI) | Coeff. (95% CI) | Coeff. (95% CI) | |
| Baseline score | 60·18 (59·96, 60·41) | 58·97 (58·85, 59·48) | 60·53 (60·28, 60·77) | 55·74 (55·38, 56·10) |
| Education | ||||
| Middle vs Low | 5·66 (5·49, 5·83) | 6·80 (6·44, 7·15) | ||
| High vs Low | 10·54 (10·31, 10·77) | 13·48 (13·02, 13·94) | ||
| Relative wealth | ||||
| Q2 vs Q1 | 2·24 (2·00, 2·47) | 6·17 (5·70, 6·65) | ||
| Q3 vs Q1 | 4·13 (3·89, 4·36) | 9·91 (9·44, 10·39) | ||
| Q4 vs Q1 | 6·55 (6·32, 6·79) | 13·14 (12·66, 13·62) | ||
| Q5 vs Q1 | 8·98 (8·74, 9·22) | 16·34 (15·86, 16·82) | ||
|
Decline rate (by year of follow-up) |
−1·26 (−1·28, −1·24) | −1·28 (−1·31, −1·25) | −1·27 (−1·29, −1·24) | −1·19 (−1·23, −1·16) |
| Education | ||||
| Middle vs Low | 0·01 (−0·03, 0·04) | |||
| High vs Low | 0·04 (0·00, 0·09) | |||
| Relative wealth | ||||
| Q2 vs Q1 | −0·08 (−0·13, −0·03) | |||
| Q3 vs Q1 | −0·13 (−0·18, −0·08) | |||
| Q4 vs Q1 | −0·11 (−0·16, −0·06) | |||
| Q5 vs Q1 | −0·08 (−0·13, −0·03) | |||
| Goodness of fit | ||||
| BIC | 3778816 | 3778487 | 3703900 | 3702573 |
Figure 2.
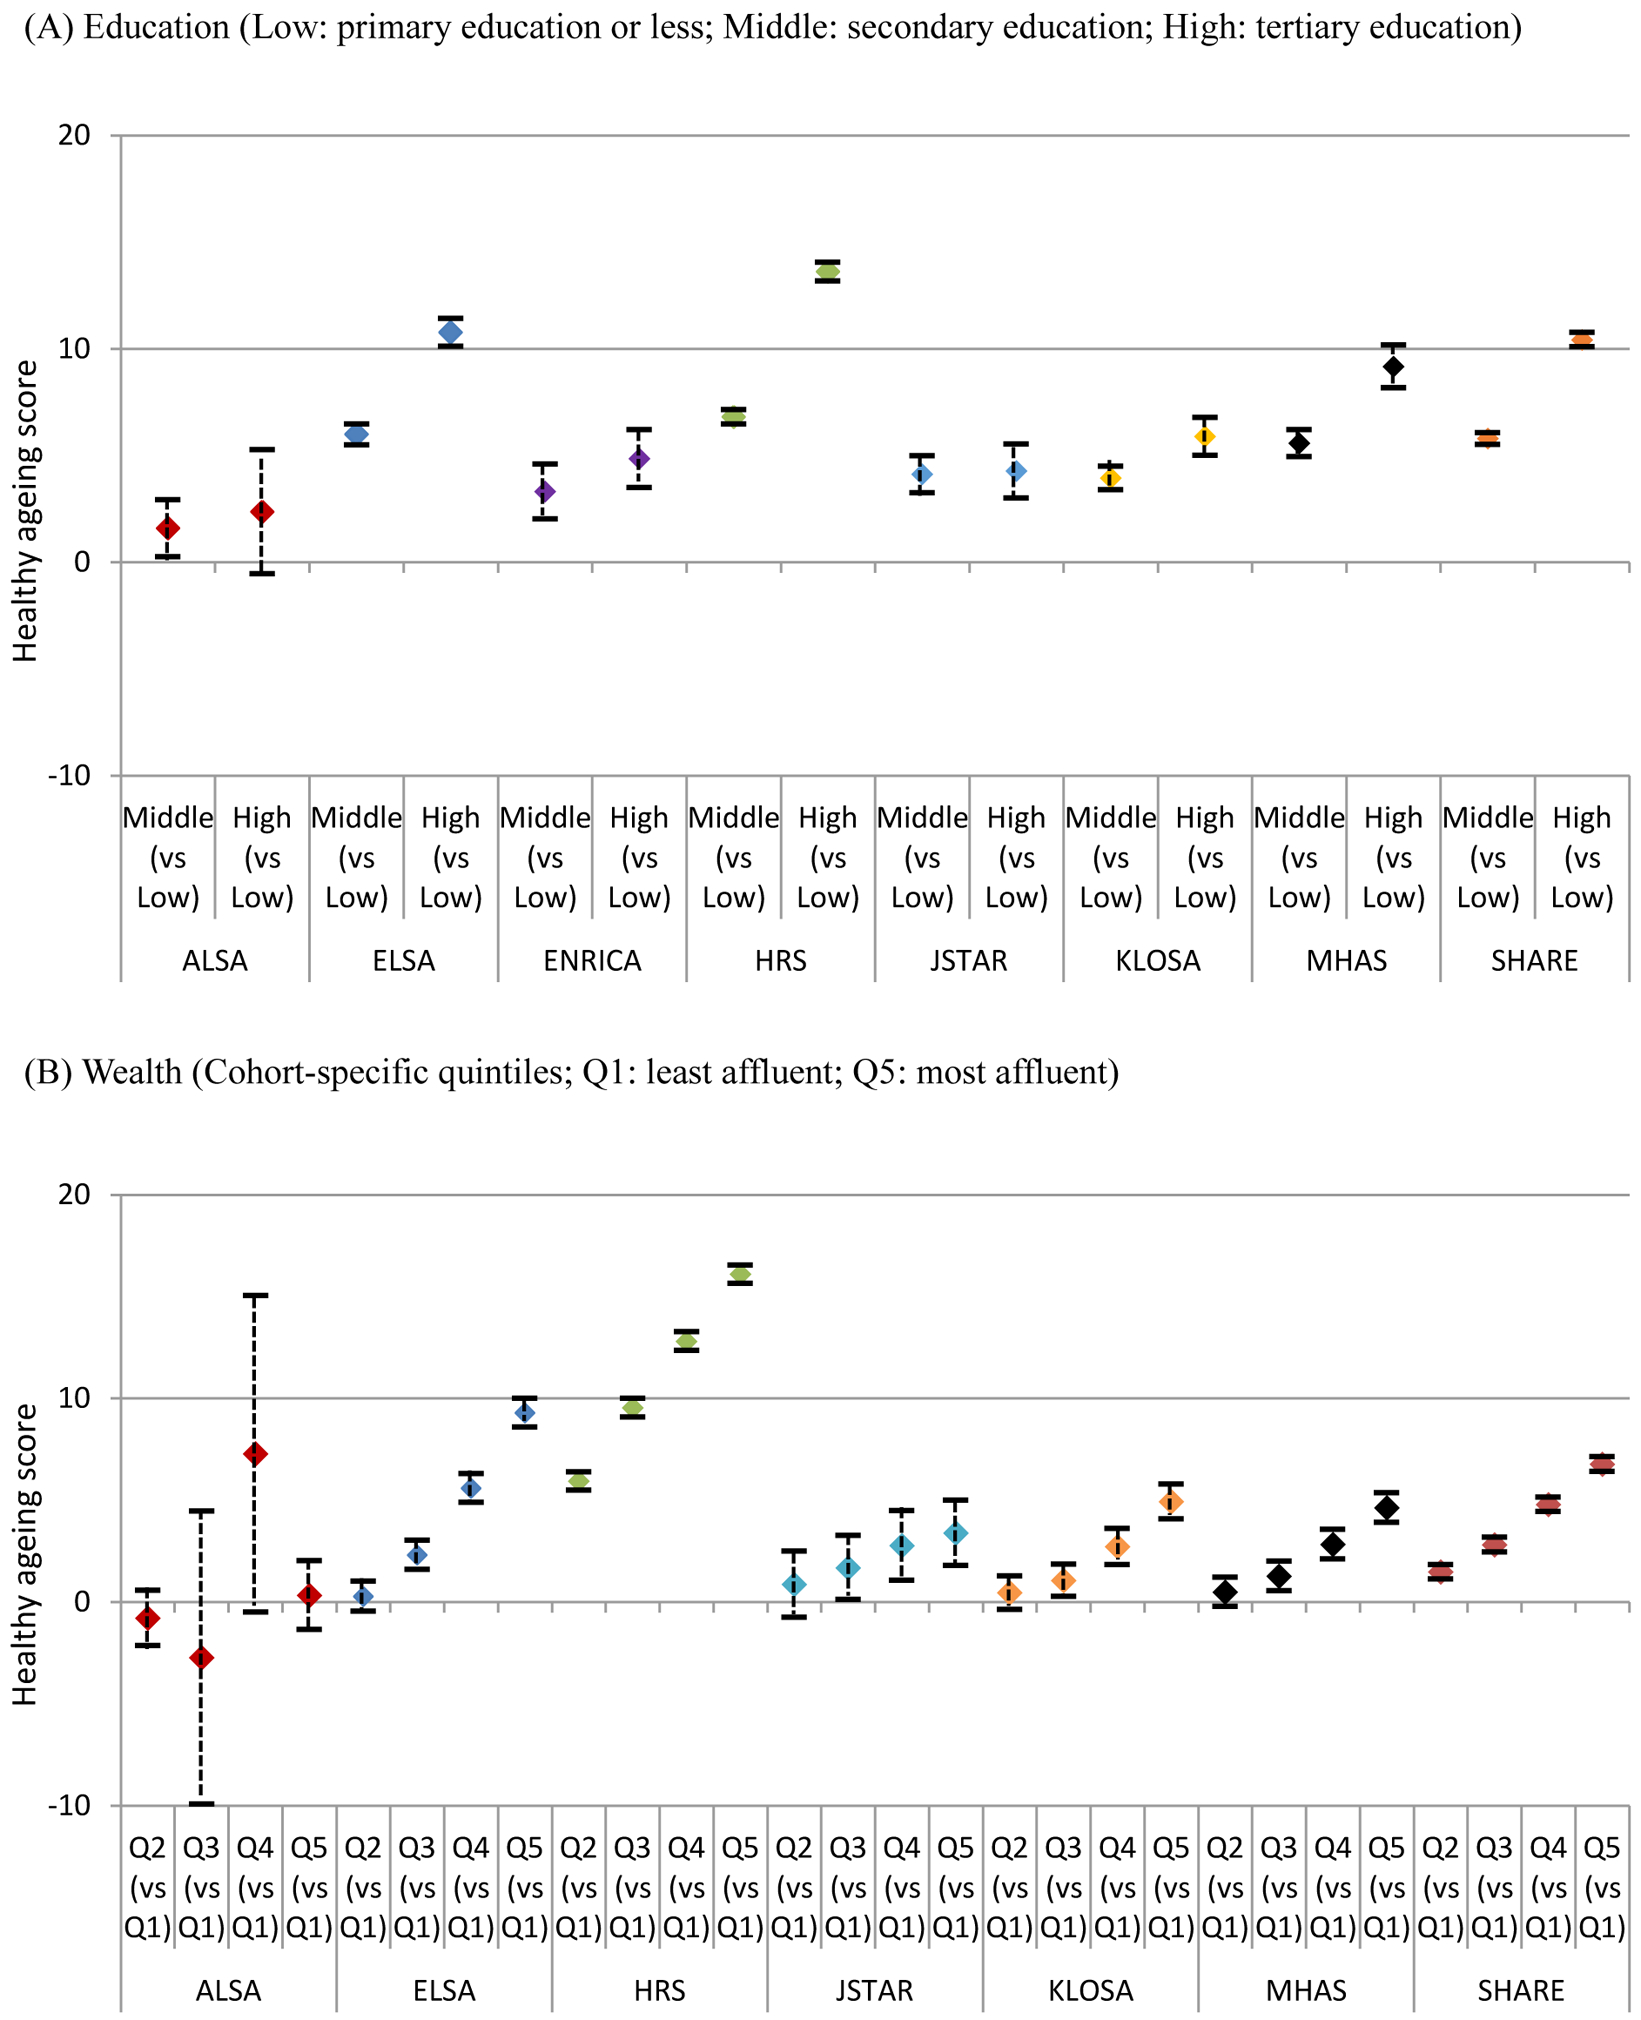
Differences in baseline healthy ageing scores across education levels and wealth quintiles by cohort studies (adjusted for age and sex)
ALSA: Australian Longitudinal Study of Ageing; ELSA: English Longitudinal Study of Ageing; Seniors-ENRICA: Study on Nutrition and Cardiovascular Health in Older Adults in Spain; HRS: Health and Retirement Study (HRS); JSTAR: Japanese Study of Ageing and Retirement; KLOSA; Korean Longitudinal Study of Ageing; MHAS: Mexican Health and Ageing Study; SHARE: Survey of Health Ageing and Retirement in Europe
The results of sensitivity analyses are provided in Supporting Information S5. Although the quadratic model showed better goodness of fit, the effect sizes of quadratic terms were small (Table S10, Supporting Information S5). The results of joint modelling showed a slightly greater decline rate (−1∙24; 95% CI: −1∙25, −1∙22) when including mortality data in the longitudinal analysis (Table S11, Supporting Information S5). A higher baseline score (Hazard ratio (HR): 0∙96; 95% CI: 0∙95, 0∙96) and slower decline rate (HR: 0∙57; 95% CI: 0∙55, 0∙58) were associated with lower risk of mortality after adjusting for age and sex.
Discussion
Using a harmonised dataset of eight ageing cohorts from USA, UK, Spain, Europe, Australia, Japan, Korea and Mexico, this study investigated changes in health and functioning over the ageing process and the potential impact of demographic and socioeconomic factors on the trajectories. Baselines scores and decline rates of healthy ageing scores varied across different age groups, sex and cohort studies. Education and wealth had a strong impact on baseline scores but almost no influence on the decline rates. Participants with lower levels of education and wealth generally had lower baseline healthy ageing scores but the effect sizes were different across cohort studies. Among the eight cohorts, the inequality gradients were found to be strongest in the HRS.
The ATHLOS consortium harmonised data from different ageing cohorts across the globe and provides a large sample size for longitudinal analysis. This study focused on eight population-based cohorts and included participants from different settings. Compared to harmonised datasets in the Gateway to Global Aging Data platform,23 this study incorporated additional cohort studies from Australia and Spain and an indicator for healthy ageing was generated comprising multiple domains of health and functioning measures across cohorts and follow-up waves. The healthy ageing concept highlights ‘what a person can do in older age’ rather than ‘what kinds of symptoms and pathological abnormalities in an older patient’, which has been the focus of other relevant but distinct concepts such as frailty.4 While cognitive/motor reserve also focuses on functioning processes and neural network, reserve is mainly determined by factors in earlier life stages.24 On the other hand, healthy ageing is considered to be a process of maintaining functional ability and interactions between individual and environmental factors that can modify this process in later life.
This study had some limitations. Most studies from low- and middle-income countries only had one or two waves of data and could not be included in this longitudinal analysis. Despite the process of data harmonisation, variation in methods of data collection or management across cohort studies might not be completely omitted and has to be considered when interpreting the findings. Variation in follow-up waves was accounted in multilevel modelling but only two studies (HRS and ALSA) had 20 years of follow-up and informed trajectories after 10 years of follow-up. The linear models might not sufficiently capture changes in decline rates particularly in the latter 10-year follow up period. However, decline rates seemed to be similar in the first 10-year period across cohorts and sensitivity analyses showed similar results. Another modelling approach could be using country as multilevel factor. Yet only SHARE included multiple countries and it would be difficult to generate specific estimates for each cohort study. Measures from different studies might collect slightly different information. Using the example of wealth quintiles, some studies only included a single question of household income while some used a series of questions to collect detailed income and financial information. Given such variation, we were not able to obtain a harmonised variable for absolute wealth and only focused on relative levels. The same issue might also affect items of the healthy ageing score. Variation in measurements might affect the associations between education, wealth and trajectories of healthy ageing. However, we adjusted for the study in the analysis and these two socioeconomic factors still had important impacts on baseline health scores. Although multiple imputation could be used to address missing or unavailable data on education and relative wealth,25 it was too challenging and computationally intensive to impute such large dataset while taking into account multilevel data structure. However, the effect sizes were unlikely to be over-estimated and statistical power should not be affected given the large study population. Some societal and historical factors such as health systems, welfare policies or economic crisis in different societies may affect health throughout the lifetime and explain health inequalities in later life. However, these measures were not available in the harmonised dataset. We attempted to include country-level Gini coefficients yet no apparaent relationships with health inequalities across education and relative wealth were observed.
Education and wealth were found to have limited impacts on decline rates of healthy ageing scores in older people across different cohorts. This corresponds to an earlier SHARE analysis, which identified several indicators for early-life socioeconomic circumstances (such as number of books at home, housing quality and overcrowding) and reported their consistent associations with baseline levels of physical, cognitive and emotional functioning but not decline rates.26 Given lack of effect on decline rates, cumulative disadvantage due to low socioeconomic status might have largely deteriorated health conditions in early life stages and lead to persistent differences throughout older age.
Inequalities in healthy ageing across education and wealth were apparent but the scale of the gradient varied across cohort studies. A wider gap was found in HRS, ELSA, MHAS and SHARE while the effect sizes were nearly half of the magnitude in other cohorts. This might be related to contextual factors in different societies, such as different absolute levels of income and material resources, variation in how education affects income or job opportunities, and also systematic differences in the distribution of education groups across sex, birth cohorts and time. Based on the theory of health inequality,27 education is widely used as a proxy measure for social position or status while wealth indicates a relative position in the income ladder. The subtle variation between these two measures might imply different pathways via material factors or behavioural and psychosocial factors. Wealth is likely to be related to material factors, such as financial difficulties, poor housing tenure, limited access to health care and insurance, which may have direct impacts on poor health across the lifetime and affect functional ability in older age.28,29 Education is likely to be related to behavioural and psychological factors such as smoking, diet and social support.27 These factors may also influence physical and mental health and capability to maintain functional ability in later life.8 In this study, both education and relative wealth had independent effects on trajectories of healthy ageing scores across cohort studies and the effect sizes remained similar when further including chronic conditions. Pathways via material, behavioural and psychological factors might all be important and the role of environmental factors in supporting healthy ageing should be explored.
The findings of this study highlight health inequalities in later life across education and wealth and their impacts may vary across different contexts. To identify potential mechanisms that explain the differential impact of education and wealth, a lifecourse approach is needed to understand how risk of poor health can accumulate since early life stages and investigate key material, behavioural and psychological factors that generate health inequalities in different societieis.27,30 More longitudinal studies need to be carried out in low- and middle-income countries in order to compare trajectories of healthy ageing across older populations living in various cultural, social and environmental contexts. This will inform policy planning on addressing determinants of healthy ageing across the world and reducing health inequalities in later life.
Supplementary Material
Research in context.
Evidence before this study
To summarise evidence on determinants of healthy ageing, the ATHLOS consortium has carried out a systematic review and a comprehensive report has been released on the project website in 2018. The search terms included ‘healthy ageing’ and other relevant terms such as ‘successful/ positive/ productive/ optimising/ unimpaired/ robust/ effective ageing’. The literature search was conducted in MEDLINE, EMBASE, Psychinfo and Cochrane Central from inception up to August 2016. The review included all longitudinal cohort studies using ‘healthy ageing’ as a main outcome measure. Since healthy ageing is considered a construct incorporating multiple domains of health, studies were excluded if a single component of healthy ageing (such as cognitive function, quality of life, or well-being alone) was used. There were no restrictions for language, time frame, setting, or characteristics of participants. Risk of bias was assessed using the Quality in Prognosis Studies (QUIPS) tool. The initial search identified 89905 publications after duplicates removal and 65 longitudinal cohort studies met the inclusion criteria. Among the 65 included studies, 25 investigated the associations between education and healthy ageing and 14 focused on the associations with income and economic status. The risk of bias were low in these studies. Despite the heterogeneity of measurement methods, high levels of education and income were found to be beneficial to healthy ageing.
Added value of this study
Although previous studies have suggested positive associations between education, income and healthy ageing, the strength of association reported from different cohorts may not be comparable due to variation in measurement methods. This study was based on a harmonised dataset of eight longitudinal cohorts from Australia, USA, Japan, South Korea, Mexico and Europe. Low levels of education and wealth was associated with poor health at baseline but had limited impacts on decline rates. The gradient of health inequalities at baseline differed across populations and the strongest gradient was found in the Health Retirement Study from the USA.
Implications of all the available evidence
Education and wealth appear to be important determinants of healthy ageing. To support maintenance of functional ability and reduce health inequalities in older age, public health policies should incorporate a lifecourse approach and address key determinants and risk factors from early life stages. Future research needs to understand how risk of poor health can accumulate over the lifecourse and investigate how variation in life experience, social, environmental and cultural factors can impact healthy ageing across different societies.
Acknowledgements
This work was supported by the five-year Ageing Trajectories of Health: Longitudinal Opportunities and Synergies (ATHLOS) project. The ATHLOS project has received funding from the European Union’s Horizon 2020 research and innovation programme under grant agreement No 635316. The authors thank the ATHLOS Consortium for useful discussions and gratefully acknowledge the funding of institutions and the work of people who carried out the studies and provided data for this paper.
Role of the funding source
The funders had no roles in study design, collection, analysis, interpretation of data, the writing of the report and the decision to submit the study for publication. The corresponding author had full access to all of the data and the final responsibility to submit for publication.
Footnotes
Declaration of interests
None.
Data availability statement
Documentation and metadata of the ATHLOS harmonisation process can be accessed at: https://github.com/athlosproject/athlos-project.github.io; https://athlos.pssjd.org. The original cohort data are publicly available (HRS, ELSA, KLOSA, MHAS, SHARE) or can be accessed via contacting the study management teams on reasonable request.
Ethics committee approval
This is a secondary data analysis project. All cohort studies have been approved by the relevant local research ethics committees.
References
- 1.Rechel B, Doyle Y, Grundy E, McKee M. How can health systems respond to population ageing? Geneva: World Health Organisation, 2009. Accessed 03/03/2020: http://www.euro.who.int/__data/assets/pdf_file/0004/64966/E92560.pdf [Google Scholar]
- 2.World Health Organisation. World report on ageing and health 2015. Geneva: World Health Organisation, 2015. Accessed 03/03/2020: http://www.who.int/ageing/events/world-report-2015-launch/en/ [Google Scholar]
- 3.Mitnitski AB, Mogilner AJ, Rockwood K. Accumulation of deficits as a proxy measure of aging. TheScientificWorld. 2001;1:323–336. Doi: 10.1100/tsw.2001.58. [DOI] [PMC free article] [PubMed] [Google Scholar]
- 4.Belloni G, Cesari M. Frailty and intrinsic capacity: two related but distinct constructs. Frontiers in Medicine. 2019;6:133 Doi: 10.3389/fmed.2019.00133. [DOI] [PMC free article] [PubMed] [Google Scholar]
- 5.Mackenbach JP, Kulhánová I, Artnik B, et al. Changes in mortality inequalities over two decades: register based study of European countries. BMJ. 2016;353. [DOI] [PMC free article] [PubMed] [Google Scholar]
- 6.Hendi AS. Trends in U.S. life expectancy gradients: the role of changing educational composition. International Journal of Epidemiology 2015;44(3):946–955. doi: 10.1093/ije/dyv062. [DOI] [PMC free article] [PubMed] [Google Scholar]
- 7.Dugravot A, Fayosse A, Dumurgier J, Bouillon K, Rayana TB, Schnitzler A. Social inequalities in multimorbidity, frailty, disability, and transitions to mortality: a 24-year follow-up of the Whitehall II cohort study. Lancet Public Health. 2020;5(1):e42–e50. Doi: 10.1016/S2468-2667(19)30226-9. [DOI] [PMC free article] [PubMed] [Google Scholar]
- 8.Kralj C, Daskalopoulou C, Rodríguez-Artalejo F, et al. Healthy ageing: a systematic review of risk factors. London: King’s College London, 2018. Accessed 03032020: http://athlosproject.eu/wp-content/uploads/2018/05/KIOPPN_HealthyAgeing-Report2018.pdf [Google Scholar]
- 9.Sanchez-Niubo A, Egea-Cortés L, Olaya B, et al. Cohort profile: the Ageing Trajectories of Health - Longitudinal Opportunities and Synergies (ATHLOS) project. Int J Epidemiol. 2019;48(4):1052–1053i. Doi: 10.1093/ije/dyz077. [DOI] [PMC free article] [PubMed] [Google Scholar]
- 10.Caballero FF, Soulis G, Engchuan W, et al. Advanced analytical methodologies for measuring healthy ageing and its determinants, using factor analysis and machine learning techniques: the ATHLOS project. Sci Rep. 2017;7:43955 Doi: 10.1038/srep43955. [DOI] [PMC free article] [PubMed] [Google Scholar]
- 11.Luszcz MA, Giles LC, Anstey KJ, Browne-Yung KC, Walker RA, Windsor TD. Cohort profile: the Australian Longitudinal Study of Ageing (ALSA). Int J Epidemiol. 2016;45(4):1054–1063. doi: 10.1093/ije/dyu196. [DOI] [PMC free article] [PubMed] [Google Scholar]
- 12.Steptoe A, Breeze E, Banks J, Nazroo J. Cohort profile: the English longitudinal study of ageing. Int J Epidemiol. 2013;42(6):1640–1648. doi: 10.1093/ije/dys168. [DOI] [PMC free article] [PubMed] [Google Scholar]
- 13.Ortolá R, Struijk EA, García-Esquinas E, Rodríguez-Artalejo F, Lopez-Garcia E. Changes in dietary intake of animal and vegetable protein and unhealthy aging. Am J Med. 2019. July 29. doi: 10.1016/j.amjmed.2019.06.051. [DOI] [PubMed] [Google Scholar]
- 14.Sonnega A, Faul JD, Ofstedal MB, Langa KM, Phillips JW, Weir DR. Cohort Profile: the Health and Retirement Study (HRS). Int J Epidemiol. 2014;43(2):576–585. doi: 10.1093/ije/dyu067. [DOI] [PMC free article] [PubMed] [Google Scholar]
- 15.Hidehiko I, Satoshi S, Hideki H. JSTAR first results 2009 report. Research Institute of Economy, Trade and Industry (RIETI). 2009. Accessed 03032020: https://www.rieti.go.jp/jp/publications/dp/09e047.pdf. [Google Scholar]
- 16.Park JH, Lim S, Lim JY, et al. An overview of the Korean Longitudinal Study on Health and Aging. Psychiatry Investig 2007;4:84–95. [Google Scholar]
- 17.Wong R, Michaels-Obregon A, Palloni A. Cohort profile: the Mexican Health and Aging Study (MHAS). Int J Epidemiol 2017;46:e2. [DOI] [PMC free article] [PubMed] [Google Scholar]
- 18.Börsch-Supan A, Brandt M, Hunkler C, et al. Data resource profile: the Survey of Health, Ageing and Retirement in Europe (SHARE). Int J Epidemiol. 2013;42(4):992–1001. doi: 10.1093/ije/dyt088. [DOI] [PMC free article] [PubMed] [Google Scholar]
- 19.Stoel RD, van den Wittenboer G, Hox J. Analyzing longitudinal data using multilevel regression and latent growth curve analysis. Metodologia de las Ciencias del Comportamiento. 2003;5(1):21–42. [Google Scholar]
- 20.Schwarz GE. Estimating the dimension of a model. Annals of Statistics 1978;6(2):461–464, doi: 10.1214/aos/1176344136. [DOI] [Google Scholar]
- 21.Dong Y, Peng CY. Principled missing data methods for researchers. Springerplus. 2013;2(1):222. doi: 10.1186/2193-1801-2-222. [DOI] [PMC free article] [PubMed] [Google Scholar]
- 22.Jones M, Mishra GD, Dobson A. Analytical results in longitudinal studies depended on target of inference and assumed mechanism of attrition. Journal of Clinical Epidemiology 2015;68(10):1165–1175. [DOI] [PubMed] [Google Scholar]
- 23.Stern Y Cognitive reserve. Neuropsychologia. 2009;47(10):2015–2028. doi: 10.1016/j.neuropsychologia.2009.03.004. [DOI] [PMC free article] [PubMed] [Google Scholar]
- 24.Resche‐Rigon M, White IR, Bartlett JW, Peters SAE, Thompson SG, on behalf of the PROG‐IMT Study Group. Multiple imputation for handling systematically missing confounders in meta‐analysis of individual participant data. Statist. Med 2013, 32 4890–4905. Doi: 10.1002/sim.5894. [DOI] [PubMed] [Google Scholar]
- 25.Gateway to Global Ageing Data. https://g2aging.org/ (Accessed 03032020).
- 26.Cheval B, Orsholits D, Sieber S, et al. Early-life socioeconomic circumstances explain health differences in old age, but not their evolution over time. J Epidemiol Community Health 2019;73:703–711. [DOI] [PubMed] [Google Scholar]
- 27.Bartley M Health Inequality: an introduction to theories, concepts and methods, 2nd Edition Cambridge: Polity Press, 2016. [Google Scholar]
- 28.Skalická V, van Lenthe F, Bambra C, Krokstad S, Mackenbach J. Material, psychosocial, behavioural and biomedical factors in the explanation of relative socio-economic inequalities in mortality: evidence from the HUNT study. Int J Epidemiol. 2009;38(5):1272–84. doi: 10.1093/ije/dyp262. [DOI] [PubMed] [Google Scholar]
- 29.van Oort FV, van Lenthe FJ, Mackenbach JP. Material, psychosocial, and behavioural factors in the explanation of educational inequalities in mortality in The Netherlands. J Epidemiol Community Health. 2005;59(3):214–20. [DOI] [PMC free article] [PubMed] [Google Scholar]
- 30.Kuruvilla S, Sadana R, Montesinos EV, et al. A life-course approach to health: synergy with sustainable development goals. Bulletin of the World Health Organization 2018;96(1):42–50. doi: 10.2471/BLT.17.198358. [DOI] [PMC free article] [PubMed] [Google Scholar]
Associated Data
This section collects any data citations, data availability statements, or supplementary materials included in this article.