

Abstract
The safe, highly effective measles vaccine has been recommended globally since 1974, yet in 2017 there were more than 17 million cases of measles and 83,400 deaths in children under 5 years old, and more than 99% of both occurred in low- and middle-income countries (LMICs)1–4. Globally comparable, annual, local estimates of routine first-dose measles-containing vaccine (MCV1) coverage are critical for understanding geographically precise immunity patterns, progress towards the targets of the Global Vaccine Action Plan (GVAP), and high-risk areas amid disruptions to vaccination programmes caused by coronavirus disease 2019 (COVID-19)5–8. Here we generated annual estimates of routine childhood MCV1 coverage at 5 × 5-km2 pixel and second administrative levels from 2000 to 2019 in 101 LMICs, quantified geographical inequality and assessed vaccination status by geographical remoteness. After widespread MCV1 gains from 2000 to 2010, coverage regressed in more than half of the districts between 2010 and 2019, leaving many LMICs far from the GVAP goal of 80% coverage in all districts by 2019. MCV1 coverage was lower in rural than in urban locations, although a larger proportion of unvaccinated children overall lived in urban locations; strategies to provide essential vaccination services should address both geographical contexts. These results provide a tool for decision-makers to strengthen routine MCV1 immunization programmes and provide equitable disease protection for all children.
Subject terms: Infectious diseases, Disease prevention, Public health
Although progress in the coverage of routine measles vaccination in children in low- and middle-income countries was made during 2000–2019, many countries remain far from the goal of 80% coverage in all districts by 2019.
Main
The safe, highly effective vaccine against measles has been recommended since 1974 by the Expanded Programme on Immunization of the WHO (World Health Organization)1–3. A single valid dose of any MCV is approximately 93% effective in providing individuals with lifelong protection from measles1. Still, in 2017, there were an estimated 17,767,037 new global cases and 83,439 deaths attributable to measles in children under 5 years old4. Although high-income regions, such as the USA and Europe, have recently started experiencing extended measles outbreaks due to a lapse in vaccination coverage, more than 99% of cases and deaths still occur in LMICs4,9.
Low vaccination rates and increasing vaccine hesitancy10–12 contribute to the persistence of measles as a major cause of childhood morbidity and mortality. National-level MCV1 estimates from the Global Burden of Diseases, Injuries and Risk Factors Study (GBD) 2019 identified only 72 out of 204 countries in which routine coverage reached approximate herd immunity targets (≥95%) in 2019, and global MCV1 coverage4,13 was 84.2%. Even in countries with high national coverage, these estimates mask important subnational heterogeneities that may sustain ongoing disease transmission and increase the risk of outbreaks14–17, especially in light of the current service disruptions associated with the COVID-19 pandemic7,8. Global vaccination initiatives, such as the GVAP and Immunization Agenda 2030, recognize the importance of eliminating subnational coverage disparities, aiming for at least 90% of the target population in every country and 80% in every district to be covered5,6.
Subnational routine MCV1 coverage
Since 2016, the WHO and UNICEF have collected subnational coverage data through their annual Joint Reporting process, although poor data quality and biases currently limit the use of administrative data to track progress towards GVAP targets18–20. For the 101 countries included in this study, 91 reported subnational data in 2018 in a total of 11,311 subnational geographical units. Of these countries, 71 reported MCV1 coverage greater than 100% in at least one unit and 55 reported such coverage in at least a quarter of units. Although researchers have estimated subnational MCV1 coverage in select countries or years for which there have been reliable surveys, to date, no comprehensive analysis of all available vaccine coverage data to produce subnational estimates of MCV1 coverage annually in all LMICs has been undertaken21–24.
Building from our previous work mapping diphtheria–tetanus–pertussis vaccine coverage in Africa14, here we present mapped high-spatial-resolution estimates of routine MCV1 coverage across 101 LMICs from 2000 to 2019, aggregated to policy-relevant second-level administrative units (hereafter districts). Using geolocated data on MCV1 coverage from 354 household-based surveys representing approximately 1.70 million children and a suite of environmental, sociodemographic and health-related geospatial and national-level covariates, we extended model-based geostatistical methods that have been used to map child mortality and its main components and risk factors25–28 to predict MCV1 coverage and uncertainty (Extended Data Figs. 1, 2), while calibrating estimates to results from GBD 2019. Using these estimates, we assessed trends in geographical inequality, progress towards global targets and differential vaccination status by geographical remoteness.
Extended Data Fig. 1. Data processing and geospatial modelling flowchart.

Survey data and the suite of covariates used in modelling are first compiled and processed (orange and grey). The modelling process (purple) consists of data being used in a stacked generalization ensemble modelling process via boosted regression tree, lasso and generalized additive models, fitting the second-stage spatiotemporal model using integrated nested Laplace approximation, and finally calibration to GBD estimates (blue). Steps in dark green and outputs in yellow indicate the post-estimation process when the full posterior distribution of predications is transformed to both 5 × 5-km2 and first and second administrative-unit-level maps and their various final results. Intermediate outputs throughout the process are shown in blue and overall processes are shown in light green.
Extended Data Fig. 2. Regions of countries used in modelling.

Analyses were divided into 13 regions based on the GBD super-regions to allow for locations similar in data availability and patterns of vaccine coverage to be analysed using similar covariate and modelling relationships. Each colour represents a different region, as described in the legend.
Tracking uneven progress
Despite marked global progress between 2000 and 2019, considerable inequalities in routine MCV1 coverage persist, both between and within countries (Fig. 1, Extended Data Figs. 3–7, see also our visualization tool (https://vizhub.healthdata.org/lbd/mcv)). MCV1 coverage among children living in the 101 countries included in this study was 65.6% (95% uncertainty interval, 64.2–67.1%) in 2000 and 81.0% (95% uncertainty interval, 79.2–82.7%) in 2019. Coverage increased at the national level in 69.9% (95% uncertainty interval, 64.4–75.2%) of countries between 2000 and 2019 and in 57.4% (95% uncertainty interval, 50.4–64.6%) of districts (n = 20,795 districts).
Fig. 1. Estimated MCV1 coverage among districts in 101 LMICs, 2000–2019.

a–c, MCV1 coverage among target population in districts in 2000 (a), 2010 (b) and 2019 (c). Countries excluded from the analysis and pixels classified as ‘barren or sparsely vegetated’ based on European Space Agency Climate Change Initiative (ESA-CCI) satellite data or with fewer than 10 people per 1 × 1-km2 pixel based on WorldPop estimates are masked in grey30,50.
Extended Data Fig. 3. National, first- and second-administrative-unit level, and pixel-level MCV1 coverage, 2000.

a–d, Posterior means are represented at the national (a), first-administrative-unit (b), second-administrative-unit (c) and 5 × 5-km2 pixel (d) levels. Pixels that are grey in colour are either not included in the analysis, or have been classified as being ‘barren or sparsely vegetated’ or had fewer than 10 people per 1 × 1-km2 pixel30,50.
Extended Data Fig. 7. National, first- and second-administrative-unit level, and pixel-level MCV1 coverage, 2019.

a–d, Posterior means are represented at the national (a), first-administrative-unit (b), second-administrative-unit (c) and 5 × 5-km2 pixel (d) levels. Pixels that are grey in colour are either not included in the analysis, or have been classified as being ‘barren or sparsely vegetated’ or had fewer than 10 people per 1 × 1-km2 pixel30,50.
The three districts with the lowest MCV1 coverage in 2000 were located in Hari Rasu, Ethiopia (4.0% (95% uncertainty interval, 1.1–9.7%)), Gabi Rasu, Ethiopia (4.8% (95% uncertainty interval, 1.4–11.4%)), and Isa, Nigeria (4.9% (95% uncertainty interval, 1.5–10.8%)). In 2000, 60 districts had a coverage below 10%; there was one such district in 2019. The three lowest-coverage districts in 2019 were all located in Afghanistan: Poruns (9.2% (95% uncertainty interval, 2.0–25.5%)), Wama (12.1% (95% uncertainty interval, 2.8–32.6%)) and Waygal (12.7% (95% uncertainty interval, 3.0–34.2%)).
In the period from 2000 to 2010, there were substantial increases in coverage and progress towards reducing subnational heterogeneity. The period from 2010 to 2019, however, showed slowing progress and, in some cases, regression of coverage compared to the 2000–2010 period (Fig. 2). Between 2000 and 2010, 70.5% (95% uncertainty interval, 66.0–75.4%) of districts increased coverage, but between 2010 and 2019, coverage increased in only 40.1% (95% uncertainty interval, 34.2–46.9%) of districts (Extended Data Fig. 8). This finding persists even when accounting for the starting level of coverage (Supplementary Information section 2.3).
Fig. 2. Estimated absolute changes in MCV1 coverage in the early (2000–2010) and late (2010–2019) study periods.

a, b, Mean district-level absolute differences in MCV1 coverage from 2000 to 2010 (a) and from 2010 to 2019 (b). Countries excluded from the analysis and pixels classified as ‘barren or sparsely vegetated’ based on ESA-CCI satellite data or with fewer than 10 people per 1 × 1-km2 pixel based on WorldPop estimates are masked in grey30,50.
Extended Data Fig. 8. Probability of increased or decreased coverage from 2000 to 2010 and 2010 to 2019.

a–d, Probability of an increase in coverage in each district (a, b) and probability of decrease in coverage in each district (c, d) from 2000 to 2010 (a, c) and 2010 to 2019 (b, d).
Although district-level MCV1 coverage generally increased between 2000 and 2019, further gains are required to reach both 80% and 95% key coverage targets (Extended Data Fig. 9). In 2000, 38.4% of districts had a high probability (>95% posterior probability) of reaching the GVAP target of 80% district-level MCV1 coverage, which remained stagnant at 33.2% of districts in 2019. Only 15 countries had a high probability of reaching the GVAP target of greater than 80% district-level coverage in all districts.
Extended Data Fig. 9. Estimated district-level probabilities of reaching MCV1 coverage targets in 2019.

a, b, Probability of districts having achieved 80% GVAP and Measles Rubella Initiative targets (a) and 95% critical proportion to immunize coverage targets to reach herd immunity (b). Countries excluded from the analysis and pixels classified as ‘barren or sparsely vegetated’ based on ESA-CCI satellite data or with fewer than 10 people per 1 × 1-km2 pixel based on WorldPop estimates are masked in grey30,50.
Quantifying geographical inequalities
To further assess the effect of geographical heterogeneity in MCV1 coverage, we computed the absolute geographical inequality, a Gini-coefficient-derived metric that ranges between zero (perfectly homogenous coverage) and one (perfectly heterogeneous coverage), at the 5 × 5-km2 level. In 2000, nine countries (Cameroon, Democratic Republic of the Congo, Guinea, India, Laos, Madagascar, Mali, Nigeria and Yemen) had high absolute geographical inequality (above 0.15). In 2019, only five countries had high absolute geographical inequality (Angola, Ethiopia, Madagascar, Nigeria and Pakistan). Nigeria had absolute geographical inequality above or equal to 0.2 in both 2000 and 2019, and 25 countries had increased absolute geographical inequality in 2019 compared with 2000. Notably, absolute geographical inequality decreased considerably in India, from 0.23 in 2000 to 0.07 in 2019.
In general, and as expected, improvements in national-level coverage over time were accompanied by reductions in subnational absolute geographical inequality (Fig. 3). Changes in coverage were negatively correlated (ρ = −0.47, Pearson’s product moment test statistic = −5.36, P < 0.001) with changes in absolute inequality. India is a true exemplar in this trend, with sizeable reductions in inequality occurring as coverage increased. This improvement was not the only pathway for a country, however; some countries with increasing coverage also experienced increasing inequality, such as Chad and Ethiopia. Other countries experienced decreasing coverage alongside increasing inequality, such as Angola.
Fig. 3. Absolute geographical inequality of MCV1 coverage in 2000 and 2019.
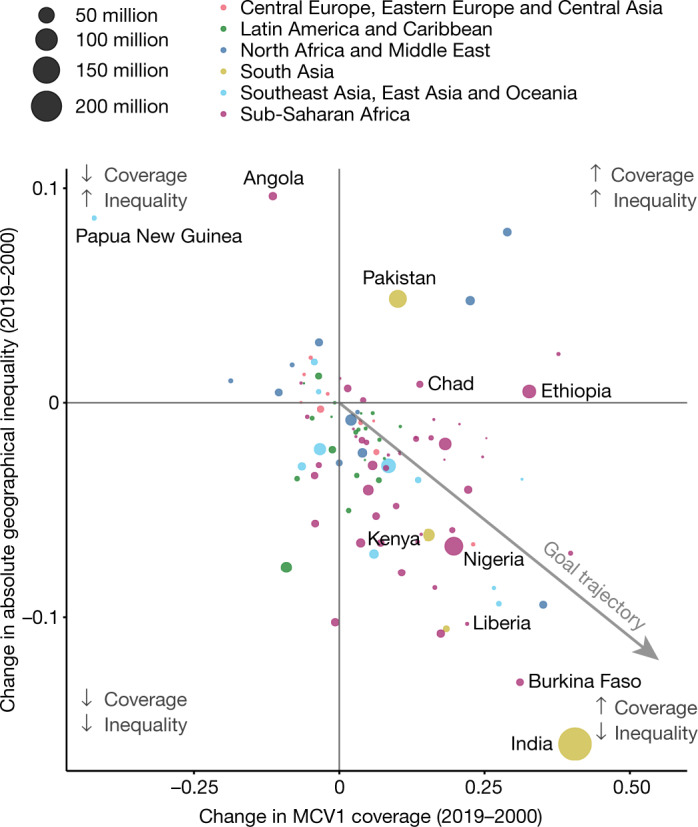
We compared the change in geographical absolute inequality to change in national-level coverage from 2000 to 2019. Points are sized by under-5 population size.
Coverage in urban and rural areas
In a post hoc analysis, we compared vaccination status in urban and remote rural settings, using proxies of travel time of ≤30 min and ≥3 h, respectively, to the nearest major city or settlement29 and the number of children under 5 years old30 from gridded estimates. In 2019, MCV1 coverage was relatively lower in remote rural areas: in remote rural locations, 33.3% of children were MCV-unvaccinated, compared with 15.2% of children living in urban areas. Owing to the concentration of populations in urban centres, however, more unvaccinated children lived in urban locations (47.9% of all unvaccinated children) than remote rural areas (16.0% of all unvaccinated children) in 2019, although this pattern varied across countries and regions (Fig. 4). For example, in Chad, 19.3% of unvaccinated children lived in urban locations and 44.4% lived in remote rural locations in 2019. In Mexico in 2019, 72.3% of unvaccinated children lived in urban locations and 3.4% lived in remote rural locations (Extended Data Fig. 10).
Fig. 4. Vaccination status in 2019 and geographical remoteness.
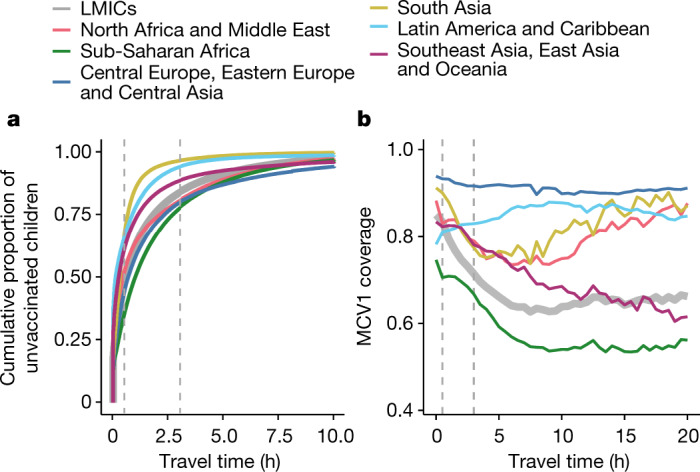
Cumulative proportion of unvaccinated children living within the spectrum of the travel time (in hours) to a major city or settlement per region (left) and coverage among children living within the spectrum of travel time to a major city or settlement per region (right). Vertical dashed grey line shows thresholds for ‘urban’ and ‘remote rural’, living within 30 min and at least 3 h from a major city or settlement, respectively.
Extended Data Fig. 10. Country examples of concentration curves.

Concentration curves of the cumulative proportion of unvaccinated children as a function of travel time (in hours) in Chad (a), Madagascar (b), India (c) and Mexico (d). Curves for both the indicated countries (blue) and all LMICs (grey) are shown.
Our results show the variability of urban and rural contributions to unvaccinated populations in each country and region. In Latin America and the Caribbean, for example, MCV1 coverage is generally similar between urban and rural settings (Fig. 4); the urban–remote rural distribution of unvaccinated children therefore largely reflects the underlying population distribution. In other regions, the interaction between population and coverage is more complex. In South Asia, for example, 21 times more unvaccinated children live in urban locations compared with remote rural locations. Strategies focused solely on reaching the most unvaccinated children possible in that region, therefore, might reasonably prioritize urban areas. Overall, however, MCV1 coverage in urban areas of South Asia averages 90.7%, compared to only 77.4% in remote rural areas. Approaches that focus primarily on reaching urban areas, therefore, would probably exacerbate existing urban–rural coverage inequalities.
Discussion
Our MCV1 coverage estimates show overall progress from 2000 to 2019, corresponding to the creation of benchmark targets from the Measles and Rubella Initiative and GVAP, as well as substantial financial support for comprehensive vaccination programming generated by the introduction of Gavi, the Vaccine Alliance5,6,31–34. Moreover, 62 out of 101 countries increased national-level MCV1 coverage while reducing subnational geographical inequalities over time, a noteworthy achievement.
This remarkable global progress should be celebrated, but this trend was not universal. Our results show a decline and stagnation in routine MCV1 coverage in certain locations, particularly since 2010, that may be related to conflict, vaccine scepticism, available funding support and supply disruptions35. Among countries with stagnant or declining coverage rates, the Central African Republic and Nigeria are experiencing ongoing political instability and conflict, which serve as major barriers to the success of vaccination programmes36–38. Supply disruptions also present a major barrier to achieving and sustaining high levels of MCV coverage. For example, in 2018, the Philippines reported a national-level MCV stockout39. The stockout, alongside waning public confidence in vaccination programmes stemming from misinformation related to risks of the Dengvaxia dengue vaccine, contributed to a national-level drop in coverage from 80% to 69% between 2017 and 201840. In Angola, economic turmoil led to a 28% decrease in governmental health spending per capita between 2010 and 2018, which may have also contributed to declines in vaccination coverage41. While global immunization initiatives have often focused on low-income countries, districts in middle-income countries also experienced recent declines, emphasizing the need for reliable immunization programmes and monitoring in these nations42. In Indonesia, for instance, 3 districts had coverage that reached 95% in 2000, increasing to 13 in 2010, but decreasing back to zero in 2019. In addition, countries with higher than average vaccine scepticism, such as Peru and Moldova, also experienced decreasing coverage rates and increasing within-country inequality43.
Overlaid on these persistent challenges, the ongoing COVID-19 pandemic has caused the cancellation of supplementary measles immunization campaigns and puts the delivery of critical routine immunization services at risk7,8. Baseline subnational estimates of routine MCV1 immunization in LMICs can help to define the geographical areas of highest vulnerability to pandemic-associated disruptions. To mitigate the risk of measles outbreaks in the setting of the COVID-19 pandemic, the maintenance of routine immunization services is crucial44—particularly in areas with pre-existing routine immunization weaknesses.
Even before the current pandemic, few countries reached the GVAP target of 80% coverage in all districts by 2019. Stagnant progress between 2010 and 2019 further suggests that new approaches are needed to reach unvaccinated children and resolve geographical inequalities. As the era of GVAP draws to a close and the Immunization Agenda 2030 begins, these results provide a platform to identify successes and inform strategies for the next decade. India, for instance, saw exemplary improvement in both national-level coverage and geographical equality over time. This may be attributable to specific interventions such as Mission Indradhanush, launched in 2014 with the goal of targeting underserved unvaccinated populations45. In addition, India introduced a second dose of MCV (MCV2) in select subnational geographies with MCV1 coverage below 80% starting in 2008, and expanded MCV2 to cover all districts in 2010 through the strengthening of both routine and supplementary immunization programmes46,47. The introduction of MCV2 into the national schedule may provide a second opportunity for first-dose vaccination among children who missed the scheduled MCV1 dose. Understanding the specific drivers of simultaneous coverage and equality gains may provide critical insights for the immunization agenda in countries and regions that have fallen behind.
The Equity Reference Group for Immunization highlights the need for increased attention on vaccinating vulnerable children who live in remote rural, urban poor and conflict settings, as well as for equality in coverage by gender48. These recommendations suggest that the agenda to leave no child unvaccinated, set by global partners and the Sustainable Development Goals, should transcend geography types and aim to eliminate coverage gaps among children who live in both urban and remote rural areas49. These geographically resolved MCV1 estimates provide a tool for decision-makers to plan supplementary immunization activities and routine immunization strengthening programmes, to reach both the urban and remote rural communities where unvaccinated children live.
Despite large improvements made in MCV1 coverage from routine immunization programmes between 2000 and 2019, stalling progress and substantial subnational variation remain in many LMICs, leaving children at risk of preventable death. Policymakers should note where progress is most critically needed to successfully meet global immunization targets and protect the most-vulnerable children against measles. Our subnational estimates of routine MCV1 coverage at policy-relevant scales provide a tool for decision-makers to use in advocating for strong, sustainable immunization programmes that provide equitable protection for all children.
Methods
Data reporting
As this is a modelling study, no statistical methods were used to predetermine sample size, the experiments were not randomized and the investigators were not blinded to allocation during experiments and outcome assessment.
Overview
Building from our previous study of diphtheria–tetanus–pertussis vaccination coverage in Africa14, we fitted a geostatistical model with correlated errors across space and time to predict 5 × 5-km2 level estimates of MCV1 coverage from 2000 to 2019 using a suite of geospatial and national-level covariates for 101 LMICs. This overall process has been summarized in Extended Data Fig. 1. We spatially aggregated estimates using population-weighted averages to second administrative units from a modified version of the Database of Global Administrative Units (GADM), referred to as districts, and performed post hoc analyses to assess geographical inequality to examine progress towards GVAP targets, absolute geographical inequality and vaccination status as a function of geographical remoteness5. This study is compliant with the Guidelines for Accurate and Transparent Health Estimates Reporting (GATHER) recommendations51 (Supplementary Table 1).
We defined routine MCV1 coverage as evidence of receipt of at least one dose of a MCV from either a home-based record (HBR) or parental recall among the target population in concordance with country-specific vaccination schedules in 201952. Despite our best efforts to remove doses delivered through supplemental immunizion activities (SIAs) (Supplementary Information section 1.3.4), there is likely to be residual misclassification of some SIA doses due to the limitations of the available data, and these estimates of routine coverage should be viewed in the context of this limitation.
Countries were selected for this analysis if they were a LMIC or were a ‘Decade of Vaccine’ priority country with available subnational survey data on MCV1 coverage between 2000 and 201953. We defined LMICs based on the socio-demographic index, a metric combining education, fertility and income to summarize development, as determined by GBD 201954. For 13 countries (Bhutan, Brazil, China, Dominica, Georgia, Grenada, Libya, Oman, Palestine, Saint Lucia, Saint Vincent and the Grenadines, Seychelles and Venezuela), no available subnational vaccine coverage data met the inclusion and exclusion criteria; these countries were therefore excluded from this analysis. A full list of included countries is provided in Supplementary Table 3. Countries were assigned to one of 13 continuous geographical modelling regions. These regions were adapted from regions defined by GBD 2019, which are constructed to group countries together by epidemiological similarity and geographical proximity (Extended Data Fig. 2).
Data
Using the Global Health Data Exchange (GHDx)55, we identified and compiled a total of 354 population-based household surveys from 101 LMICs from 2000 to 2019 containing individual MCV1 vaccination status and subnational geolocation information. Surveys were included if they contained MCV1 coverage information and subnational geolocation, and excluded if they contained areal data and were missing key survey design variables (strata, primary sampling units and design weights), did not include children aged 12–59 months, contained no subnational individual-level geographical information or if coverage estimates were implausible (Supplementary Tables 4, 5).
Coverage was computed at the cluster level when global positioning system (GPS) data were available. If GPS information was not collected or was not available, we calculated mean coverage at the most-granular geographical area possible while accounting for sampling weights and survey design. These aggregated coverage estimates were then included in the geospatial modelling process using a previously described method14,56 that leverages population weights and a k-means clustering algorithm to propose a set of GPS coordinates as a proxy for locations where survey data collection could have occurred (Supplementary Fig. 3). These coordinates were then used to represent the areal data in the geospatial model. The following data were extracted from each survey source: vaccine card or HBR doses, parental recall vaccine doses, age (in months), survey weight and design variables, and GPS cluster or areal location. Individuals with evidence of vaccination either from HBR or recall were considered to have been vaccinated. Individuals were excluded from the analysis if they were missing age, spatial or survey design information or were outside of the study age or year range. The study included all years between 2000 and 2019. A comprehensive overview of data from all study geographies included can be found in Supplementary Figs. 1, 2.
Individual age, in months, at the time of survey collection was used to assign each child to a birth cohort (12–23 months, 24–35 months, 36–47 months and 48–59 months). Data corresponding to each birth cohort were included in the modelling process in the year in which that birth cohort was aged 0–12 months old. For countries recommending MCV1 within the first year of life, we included data from children aged 12–47 months. If the first dose was not recommended until the second year of life, we included data from children aged 24–59 months. A full list of schedules by country can be found in Supplementary Table 2. This yielded a dataset of 1,697,570 total children. This method allows the inclusion of additional individuals, which increases overall geographical representation but requires assumptions such as negligible catch-up vaccination and no differential mortality or migration. However, the overall influence of including older cohorts in our model on the key findings appeared to be minor (Supplementary Information section 2.2). Additional information on the benefits and limitations of this approach can be found in the Supplementary Information sections 1.3.4, 2.2, Supplementary Figs. 18–20 and Supplementary Tables 14, 15.
We included 26 geospatial covariates as possible predictors of MCV1 coverage in the modelling process, including maternal education, access to major cities or settlements, a binary urban or rural indicator, total population and a suite of 22 environmental covariates (Supplementary Fig. 4 and Supplementary Table 6). Four national-level covariates were also included: lag-distributed income, prevalence of the completion of the fourth antenatal care visit among pregnant women, mortality due to war and terror, and bias-adjusted national-level administrative data on MCV1 coverage reported through the WHO/UNICEF Joint Reporting Form (Supplementary Information section 1.5.1). For each region, an optimized set of geospatial covariates was selected from these 26 possible covariates, using a variance inflation factor (VIF) algorithm57 in which covariates were selected with a VIF < 3. This method was used to ensure non-collinearity between covariates within each region to facilitate model convergence. Selected covariates varied by region (Supplementary Table 7).
Other spatial data used in our analyses included gridded population estimates, administrative boundaries and gridded estimates of travel time to major cities or settlements. These sources are described in detail in Supplementary Information section 1.3.
Geostatistical model
First, stacked generalization was used to capture potential nonlinear and complex relationships between covariates and vaccination coverage. This approach has previously been shown to increase the predictive accuracy of geospatial models58. Using the optimized set of covariates selected for each region by the VIF algorithm, three different child models—generalized additive models, lasso regression and boosted regression trees—were fit, with each model predicting MCV1 coverage as the outcome of interest. When fitting boosted regression trees, country-level fixed effects were included to allow relationships between coverage and covariates to differ by country. In this initial modelling step, there were no explicitly defined temporal or spatial effects included in the models beyond those inherently present in the covariate patterns and correlations between covariates.
Each child model was fit using fivefold cross-validation to avoid overfitting. This generated out-of-sample predictions of coverage for each location and year per region. Each model in each region was also fit using the full set of vaccine coverage outcome data, which yielded a corresponding set of in-sample predictions. The predictions of MCV1 coverage obtained from each child model were in turn used as predictors in the second-step geostatistical model described below. Out-of-sample predictions from each child model were used as explanatory covariates when fitting the geostatistical model. In-sample predictions from each model and region were used when generating predictions from the fitted geostatistical model.
After the first step (stacked generalization), a second-step Bayesian geostatistical modelling framework was used to model vaccination coverage as counts in a binomial space with a logit link through a generalized linear regression with explicit spatial and temporal terms. This second step leverages the covariate relationships estimated through stacked generalization while also accounting for additional correlation in coverage across space and time.
A separate model of MCV1 coverage was fit for each of the 13 regions as defined below:
This model, adopted from widely used Bayesian hierarchical models59,60, has been described in detail in other work14,25,56,61,62. In brief, this method estimates the number of children, C, in cluster d at location i and time t with sample size N that have been vaccinated with a specific antigen-dose combination. pi(d),t(d) is the proportion of children vaccinated with MCV1 among the target age population in cluster d. Each child model generates a prediction Xi,t for each child model h. Residual terms are unique to each particular location in space and time across all modelled geographies and years.
In this generalized linear regression framework, the proportion of children vaccinated pi,t is modelled using the out-of-sample predictions of vaccine coverage Xi,t from each of three stacked generalization child models (h) as explanatory variables. The βh coefficients are constrained to sum to 1, via the ‘extraconstr’ R-INLA parameter63, to improve computational tractability58 and are representative of the predictive weighting used in the stacking process.
represents a country-level random effect. represents an independent nugget effect for irreducible error for a given observation, which accounts for true variation that is unable to be captured by the model and variation from measurement error. Zi,t represents a correlated spatiotemporal error term, for any residual autocorrelation across space and time that remains after accounting for the predictive capacity of the stacked-modelled covariates, country-specific variation in vaccine coverage and observation-specific irreducible error.
These additional spatiotemporal residuals Zi,t were modelled as a three-dimensional spatiotemporal Gaussian process with a mean of zero and a covariance matrix formed from the Kronecker product of spatial and temporal covariance kernels. The temporal covariance Σtime was modelled via an annual autoregressive order 1 function from all study years from 2000 to 2019, where ρ is the autocorrelation function and k and j are points in the annual time series. The spatial covariance Σspace was assumed to be an isotropic, stationary Matérn function, where Γ is the gamma function, Κv is the modified Bessel function of the second kind of order v > 0, is the marginal variance, v is a scaling constant, δ is a range parameter with a penalized complexity prior, and D is a spatial distance matrix64, measured along the great circle in kilometres. The generalized linear model was fitted using an integrated nested Laplace approximation in R-INLA with a stochastic partial differential equation (SPDE) solver in package SPDE65. Additional detailed information on priors, spatial mesh construction and model fitting is provided in Supplementary Information sections 1.4.2–1.4.6 and Supplementary Fig. 5. This process produces a set of 1,000 posterior draws, each representing an estimate of vaccine coverage for each location and year— in other words, a set of 1000 candidate maps of coverage from 2000 to 2019.
Post-estimation
To leverage data from additional national-level sources, including administrative data, and maintain internal consistency, the set of candidate maps was calibrated to MCV1 coverage estimates produced for GBD 2019. This post hoc calibration preserves the overall spatial variation of estimates, while ensuring that the population-weighted averages of the geospatial estimates are equivalent to those produced by GBD4. This step allows for the calibrated estimates to reflect information from data sources that are only available at the national level, such as surveys for which no subnational data are available, which are included in the GBD estimates but excluded from the geospatial model described in the ‘Geostatistical model’ section. A description of the estimation of MCV1 coverage for GBD 2019 can be found in Supplementary Information section 1.5.1.
In this calibration process, each 5 × 5-km2 pixel in each modelled region was first assigned to a second-level administrative unit. In locations in which boundary definitions transect a given pixel, the fraction of area of that pixel belonging to each overlapping second-level administrative unit was calculated. Because of the nested hierarchy of administrative units, this additionally allowed for the assignment of pixels and partial pixels to first administrative units and countries. Assuming that the population density within each pixel was uniform, WorldPop population values of children under 5 years old were divided for each whole or partial pixel proportional to fractional area. After pixel and partial pixel populations were assigned, population-level estimates were calibrated to GBD population estimates for each country and year.
Calibration methods similar to those used in this study have been described previously14. To ensure vaccination coverage estimates post-calibration remained between 0 and 100%, calibration was performed in logit space such that for each country c and year t, national-level estimates of coverage from GBD (VGBD,c,t) and population-weighted national averages of coverage from the model-based geostatistical (MBG) model (VMBG,c,t) can be related via a country-year-specific calibration factor (kc,t) in the following equation:
Calibration factors were applied to each 5 × 5-km2 pixel and partial pixel per draw per country-year. Pixels that were fractionally assigned to multiple countries were combined using a weighted average proportional to the fraction of each area. This process resulted in a set of calibrated draw-level estimates of vaccination coverage, which were used for all subsequent analyses.
Population-weighted averages of coverage for each pixel or partial pixel within a first or second administrative unit were then calculated. Fractional pixel membership was determined as described above. This process was repeated for each of the 1,000 posterior pixel-level draws, which yielded 1,000 posterior draws of MCV1 coverage per administrative unit per year. Estimates for first and second administrative units with uncertainty were derived from mean, 2.5th and 97.5th percentiles.
Model validation
We assessed the predictive performance of the models using fivefold out-of-sample cross-validation. We stratified data by first and second administrative units and ran models leaving out one-fifth of the spatially stratified data at a time. Predicted estimates of MCV1 coverage were then compared to the withheld observed data by calculating the mean error, root mean square error, correlation and other predictive validity metrics for all years for which survey data were available (2000–2018). Fitted model parameters can be found in Supplementary Table 8. Metrics and validity figures can be found in Supplementary Tables 9–12 and Supplementary Figs. 6–13, respectively. Additional information regarding uncertainty of estimates can be found in Supplementary Figs. 14–17.
Post hoc geospatial inequality analyses
Lorenz curves were generated using the relationship between the number of children and the number of vaccinated children for each pixel. Pixel-level Gini coefficients were calculated for 2000 and 2019 from corresponding Lorenz curves66,67 (Supplementary Table 13). Absolute geographical inequality per country was calculated from the national-level Gini coefficients and national MCV1 coverage using the following formula:
We chose to use the absolute geographical inequality metric to represent inequality over the Gini coefficient alone. As the mean is related to Gini, we wanted to account for this relationship. Estimates are scaled by 2 as this puts the absolute geographical inequality coefficient back to the same scale as the mean68.
Additionally, we assessed vaccination status as a function of geographical remoteness. Using a gridded surface of travel time to major cities or settlements, we classified each 5 × 5-km2 pixel as remote rural, urban or neither29. Pixels with travel times of less than 30 min were classified as urban, and pixels with travel times greater than 3 h were classified as remote rural. Overlaid with a gridded population surface from WorldPop30, the number of unvaccinated children per pixel was also calculated.
We constructed concentration curves of the cumulative proportion of unvaccinated children as well as plots of MCV1 coverage by travel time to assess patterns across countries and regions. Country-specific concentration curves of the cumulative proportion of unvaccinated children as a function of travel time for select countries are shown in Extended Data Fig. 10. Summary metrics, such as the proportion of unvaccinated individuals living in each urban and remote rural location, were computed.
Limitations
This work is subject to several limitations. First, the primary data used in this analysis came from child-level survey data with varying degrees of representativeness, consistency, accuracy and comparability, from both HBR and parental recall69,70. The magnitude and direction of recall bias varies, and we therefore were unable to correct for it71. We estimate coverage using data from children aged 12–59 months, and while we accounted for target age at vaccination, this does not fully account for differential mortality due to vaccine status or catch-up vaccination. We aim to estimate routine coverage and have excluded doses delivered via SIAs from the analysed survey data wherever possible (Supplementary Information section 1.3.4), but misclassification of SIA doses is still likely, particularly in cases of parental recall—especially for older children—and in cases in which survey methodology does not distinguish clearly between SIA and routine doses.
In data-sparse areas for which covariate relationships may not fully capture coverage patterns, results may be biased. Additionally, data representativeness among vulnerable populations, such as those living in urban slums or migrant populations, might vary due to data collection in survey design. We include as much data on MCV1 coverage as possible, including data that are only geo-resolved to areal locations. The methodology that we used to assign areal data to specific locations for modelling could lead to oversmoothing in final estimates, obscure relationships between coverage and covariates, and underestimate uncertainty, but this method has been shown to have a higher predictive validity compared with the exclusion of the data72. Limitations due to data availability should not be taken lightly and should reinforce to stakeholders and policymakers the need for additional resources to collect high-quality data that are representative of all populations, especially the most vulnerable for being unvaccinated, and to increase the quality of routinely collected subnational administrative data.
Because the estimates that we used to assess geographical remoteness in post hoc analyses were also used as spatial covariates in the geospatial model, these results are limited by the possibility of circularity and subsequent confounding. In addition, we used a stacked generalization method to allow for complex and nonlinear relationships between covariates and vaccination coverage. These methods are optimized for prediction, not causal inference. For that reason, these results cannot be used to identify the specific effect of any particular covariate on MCV1 coverage. In addition, owing to limitations in the underlying data and computational feasibility, we were unable to incorporate several potentially important sources of uncertainty into this analysis, including from covariates, population estimates, the incorporation of areal data and the stacked generalization process.
We fitted our geostatistical models using R-INLA, as opposed to a full Markov chain Monte Carlo sampler. Although using a more traditional Bayesian model fitting approach that takes true samples from the posterior typically results in increased parameter identifiability, the Laplace approximation approach used by R-INLA is more computationally feasible given our current modelling scale. Our model is separable, yet symmetric, across time and space. This approach assumes that, for each region, the covariance has the same functional form between years and locations regardless of the locations themselves; the use of a non-separable covariance function could relax these assumptions73,74. However, owing to the additional computational challenges associated with fitting a non-separable model, as well as data sparsity in several regions throughout space and time, we determined that fitting a non-separable model would be challenging and complex, and would probably yield little benefit compared to our current modelling approach.
In some settings with high levels of natural immunity (derived from previous infection), greater than 95% vaccination coverage may not be required to prevent disease transmission75. These estimates only focus on the first routine dose of MCV, and immunity can also be obtained through later vaccination via SIA or natural infection. In an ideal long-term measles elimination scenario, all immunity would be vaccine-derived, and no natural infections would occur. A 95% coverage target for routine immunization, therefore, still has practical programmatic relevance.
Finally, our study describes spatial heterogeneity in coverage, but not pockets of low coverage within social or age groupings that can facilitate ongoing disease transmission, particularly in densely populated areas, despite nominally high average vaccine coverage76. Although these results provide a powerful tool for policymakers to identify weaknesses in routine immunization systems and plan for SIA, they should be used in conjunction with other data sources that can be used to make decisions about vaccine policy, including analyses of cost effectiveness, determinants of high or low coverage, and specific coverage initiatives to reduce disease burden.
Reporting summary
Further information on research design is available in the Nature Research Reporting Summary linked to this paper.
Online content
Any methods, additional references, Nature Research reporting summaries, source data, extended data, supplementary information, acknowledgements, peer review information; details of author contributions and competing interests; and statements of data and code availability are available at 10.1038/s41586-020-03043-4.
Supplementary information
This file contains Supplementary Methods, Supplementary Results and Discussion, Supplementary Figures 1-20 and Supplementary Tables 1-15.
Acknowledgements
This work was primarily supported by grants from the Bill & Melinda Gates Foundation (OPP1182474, OPP11093011 and OPP1132415). S.I.H. is funded by additional grants from the Bill & Melinda Gates Foundation (OPP1119467 and OPP1106023). The opinions expressed in this paper are those of the authors and not necessarily those of the World Health Organization. J.-W.D.N. was supported by the Alexander von Humboldt Foundation. C.H. is partially supported by a grant of the Romanian National Authority for Scientific Research and Innovation, CNDS-UEFISCDI, project number PN-III-P4-ID-PCCF-2016-0084, and a grant co-funded by the European Fund for Regional Development through Operational Program for Competitiveness, Project ID P_40_382. Y.J.K. acknowledges support by the Research Management Centre, Xiamen University Malaysia (XMUMRF/2018-C2/ITCM/0001). K. Krishan is supported by a DST PURSE Grant and UGC Centre of Advanced Study awarded to the Department of Anthropology, Panjab University, Chandigarh, India. B.L. acknowledges support from the NIHR Oxford Biomedical Research Centre and the BHF Centre of Research Excellence, Oxford. M.A.M. acknowledges NIGEB and NIMAD grants. A. Sheikh acknowledges support by Health Data Research UK. S.B.Z. acknowledges support from the Australian Government research training program (RTP) for his academic career.
Extended data figures and tables
Extended Data Fig. 4. National, first- and second-administrative level, and pixel-level MCV1 coverage, 2005.

a–d, Posterior means are represented at the national (a), first-administrative-unit (b), second-administrative-unit (c) and 5 × 5-km2 pixel (d) levels. Pixels that are grey in colour are either not included in the analysis, or have been classified as being ‘barren or sparsely vegetated’ or had fewer than 10 people per 1 × 1-km2 pixel30,50.
Extended Data Fig. 5. National, first- and second-administrative-unit level, and pixel-level MCV1 coverage, 2010.

a–d, Posterior means are represented at the national (a), first-administrative-unit (b), second-administrative-unit (c) and 5 × 5-km2 pixel (d) levels. Pixels that are grey in colour are either not included in the analysis, or have been classified as being ‘barren or sparsely vegetated’ or had fewer than 10 people per 1 × 1-km2 pixel30,50.
Extended Data Fig. 6. National, first- and second-administrative-unit level, and pixel-level MCV1 coverage, 2015.

a–d, Posterior means are represented at the national (a), first-administrative-unit (b), second-administrative-unit (c) and 5 × 5-km2 pixel (d) levels. Pixels that are grey in colour are either not included in the analysis, or have been classified as being ‘barren or sparsely vegetated’ or had fewer than 10 people per 1 × 1-km2 pixel30,50.
Author contributions
J.F.M., A.N.S., S.S.L. and S.I.H. conceived and planned the study. A.N.S., J.F.M., S.R., J.Q.N. and N.C.G. identified and vetted data for this analysis. S.R. and J.Q.N. extracted, processed and geo-positioned the data. A.N.S. carried out the statistical analyses with assistance and input from J.F.M., S.S.L. and C.J.L.M. A.N.S., L.E., S.R. and J.Q.N. prepared figures and tables. A.N.S. wrote the first draft of the manuscript with assistance from J.F.M, S.S.L, S.I.H. and M.K.M.-P. and all authors contributed to subsequent revisions. All authors provided intellectual input into aspects of this study.
Data availability
The findings of this study are supported by data available in public online repositories and data publicly available upon request from the data provider. A detailed table of data sources and availability can be found in Supplementary Table 4 and at http://ghdx.healthdata.org/lbd-publication-data-input-sources. Administrative boundaries were modified from the Database for Global Administrative Areas (GADM) dataset77. Populations were retrieved from WorldPop30, and gridded estimates of travel time to the nearest city or settlement were available online from a previously published study29. This study complies with the GATHER recommendations51.
Code availability
This study is compliant with the GATHER recommendations51; as such, all computer code is available from GitHub (https://github.com/ihmeuw/lbd/tree/mcv1-lmic-2020). All maps and figures presented in this study are generated by the authors using RStudio (R version 3.6.1), ArcGIS Desktop 10.6 and Python 2.7.
Competing interests
This study was funded by the Bill & Melinda Gates Foundation. Authors employed by the Bill & Melinda Gates Foundation provided feedback on initial maps and drafts of this manuscript. Otherwise, the funders of the study had no role in study design, data collection, data analysis, data interpretation, or writing of the final report. The corresponding authors had full access to all the data in the study and had final responsibility for the decision to submit for publication. O.O.A. is supported by DSI-NRF Centre of Excellence for Epidemiological Modelling and Analysis (SACEMA). C.A.T.A. reports personal fees from Johnson & Johnson (The Philippines), outside the submitted work. M.L.B. reports grants from the US Environmental Protection Agency, the National Institutes of Health (NIH) and the Wellcome Trust Foundation, during the conduct of the study. M.L.B. also reports honoraria and/or travel reimbursements from the NIH (for the review of grant proposals), American Journal of Public Health (participation as editor), Global Research Laboratory and Seoul National University, Royal Society London UK, Ohio University, Atmospheric Chemistry Gordon Research Conference, Johns Hopkins Bloomberg School of Public Health, Arizona State University, Ministry of the Environment Japan, Hong Kong Polytechnic University, University of Illinois–Champaign, and University of Tennessee–Knoxville. S. Basu reports grants from the NIH, grants from the US Centers for Disease Control and Prevention, grants from the US Department of Agriculture, grants from Robert Wood Johnson Foundation, personal fees from Research Triangle Institute, personal fees from Collective Health, personal fees from KPMG, personal fees from HealthRight360, personal fees from PLOS Medicine, personal fees from The New England Journal of Medicine, outside the submitted work. F.D. reports grants from the Bill & Melinda Gates Foundation, during the conduct of the study. A. Deshpande reports grants from the Bill & Melinda Gates Foundation, during the conduct of the study. S.J.D. reports grants from The Fleming Fund at the UK Department of Health & Social Care, during the conduct of the study. S.M.S.I. received funding from the National Heart Foundation of Australia. J.J.J. reports personal fees from AMGEN, personal fees from ALAB, personal fees from TEVA, personal fees from SYNEXUS, personal fees from BOEHRINGER INGELHEIM and personal fees from VALEANT, outside the submitted work. H.J.L. reports grants from GSK, outside the submitted work. W.M. is Program Analyst in Population and Development at the United Nations Population Fund (UNFPA), an institution which does not necessarily endorse this study. T. Pilgrim reports grants and personal fees from Biotronik, grants and personal fees from Boston Scientific and grants from Edwards Lifesciences, outside the submitted work. M.J.P. reports grants and personal fees from MSD, GSK, Pfizer, Boehringer Ingelheim, BMS, Novavax, Astra Zeneca, Sanofi, IQVIA and other pharmaceutical industries, personal fees from Quintiles, Novartis, Pharmerit and Seqirus, grants from Bayer, BioMerieux, WHO, EU, FIND, Antilope, DIKTI, LPDP, Budi, and other from Ingress Health, Pharmacoeconomics Advice Groningen (PAG Ltd), Asc Academics, outside the submitted work. M.J.P. holds stocks in Ingress Health and PAG Ltd and is advisor to Asc Academics, all of which are pharmacoeconomic consultancy companies, outside of submitted work. J. A. Singh reports personal fees from Crealta/Horizon, Medisys, Fidia, UBM LLC, Trio Health, Medscape, WebMD, Clinical Care Options, Clearview Healthcare Partners, Putnam Associates, Spherix, Practice Point Communications, the NIH and the American College of Rheumatology, personal fees from the speaker’s bureau of Simply Speaking, stock options in Amarin Pharmaceuticals and Viking Pharmaceuticals, non-financial support from the steering committee of OMERACT, an international organization that develops measures for clinical trials and receives arm’s length funding from 12 pharmaceutical companies, outside of the submitted work. J. A. Singh serves on the FDA Arthritis Advisory Committee, is a member of the Veterans Affairs Rheumatology Field Advisory Committee, and is the editor and the Director of the UAB Cochrane Musculoskeletal Group Satellite Center on Network Meta-analysis, all outside the submitted work. R.U. reports other financial activities from Deakin University, outside the submitted work. J.F.M. reports grants from the Bill and Melinda Gates Foundation, during the conduct of the study.
Footnotes
Peer review information Nature thanks C. Edson Utazi and the other, anonymous, reviewer(s) for their contribution to the peer review of this work. Peer reviewer reports are available.
Publisher’s note Springer Nature remains neutral with regard to jurisdictional claims in published maps and institutional affiliations.
These authors jointly supervised this work: Simon I. Hay, Stephen S. Lim, Jonathan F. Mosser
Contributor Information
Local Burden of Disease Vaccine Coverage Collaborators:
Alyssa N. Sbarra, Sam Rolfe, Jason Q. Nguyen, Lucas Earl, Natalie C. Galles, Ashley Marks, Kaja M. Abbas, Mohsen Abbasi-Kangevari, Hedayat Abbastabar, Foad Abd-Allah, Ahmed Abdelalim, Mohammad Abdollahi, Kedir Hussein Abegaz, Hailemariam Abiy Alemu Abiy, Hassan Abolhassani, Lucas Guimarães Abreu, Michael R. M. Abrigo, Abdelrahman I. Abushouk, Manfred Mario Kokou Accrombessi, Maryam Adabi, Oladimeji M. Adebayo, Victor Adekanmbi, Olatunji O. Adetokunboh, Davoud Adham, Mohsen Afarideh, Mohammad Aghaali, Tauseef Ahmad, Raman Ahmadi, Keivan Ahmadi, Muktar Beshir Ahmed, Fahad Mashhour Alanezi, Turki M. Alanzi, Jacqueline Elizabeth Alcalde-Rabanal, Birhan Tamene Alemnew, Beriwan Abdulqadir Ali, Muhammad Ali, Mehran Alijanzadeh, Cyrus Alinia, Reza Alipoor, Vahid Alipour, Hesam Alizade, Syed Mohamed Aljunid, Ali Almasi, Amir Almasi-Hashiani, Hesham M. Al-Mekhlafi, Khalid A. Altirkawi, Bekalu Amare, Saeed Amini, Mostafa Amini-Rarani, Fatemeh Amiri, Arianna Maever L. Amit, Dickson A. Amugsi, Robert Ancuceanu, Catalina Liliana Andrei, Mina Anjomshoa, Fereshteh Ansari, Alireza Ansari-Moghaddam, Mustafa Geleto Ansha, Carl Abelardo T. Antonio, Ernoiz Antriyandarti, Davood Anvari, Jalal Arabloo, Morteza Arab-Zozani, Olatunde Aremu, Bahram Armoon, Krishna K. Aryal, Afsaneh Arzani, Mehran Asadi-Aliabadi, Samaneh Asgari, Zahra Atafar, Marcel Ausloos, Nefsu Awoke, Beatriz Paulina Ayala Quintanilla, Martin Amogre Ayanore, Yared Asmare Aynalem, Abbas Azadmehr, Samad Azari, Ebrahim Babaee, Alaa Badawi, Ashish D. Badiye, Mohammad Amin Bahrami, Atif Amin Baig, Ahad Bakhtiari, Senthilkumar Balakrishnan, Maciej Banach, Palash Chandra Banik, Aleksandra Barac, Zahra Baradaran-Seyed, Adhanom Gebreegziabher Baraki, Sanjay Basu, Mohsen Bayati, Yibeltal Tebekaw Bayou, Neeraj Bedi, Masoud Behzadifar, Michelle L. Bell, Dessalegn Ajema Berbada, Kidanemaryam Berhe, Suraj Bhattarai, Zulfiqar A. Bhutta, Ali Bijani, Minyichil Birhanu, Donal Bisanzio, Atanu Biswas, Somayeh Bohlouli, Srinivasa Rao Bolla, Shiva Borzouei, Oliver J. Brady, Nicola Luigi Bragazzi, Andrey Nikolaevich Briko, Nikolay Ivanovich Briko, Sharath Burugina Nagaraja, Zahid A. Butt, Luis Alberto Cámera, Ismael R. Campos-Nonato, Josip Car, Rosario Cárdenas, Felix Carvalho, João Maurício Castaldelli-Maia, Franz Castro, Vijay Kumar Chattu, Mohammad Chehrazi, Ken Lee Chin, Dinh-Toi Chu, Aubrey J. Cook, Natalie Maria Cormier, Brandon Cunningham, Saad M. A. Dahlawi, Giovanni Damiani, Rakhi Dandona, Lalit Dandona, M. Carolina Danovaro, Emily Dansereau, Farah Daoud, Aso Mohammad Darwesh, Amira Hamed Darwish, Jai K. Das, Nicole Davis Weaver, Jan-Walter De Neve, Feleke Mekonnen Demeke, Asmamaw Bizuneh Demis, Edgar Denova-Gutiérrez, Assefa Desalew, Aniruddha Deshpande, Desilu Mahari Desta, Samath Dhamminda Dharmaratne, Govinda Prasad Dhungana, Mostafa Dianatinasab, Daniel Diaz, Isaac Oluwafemi Dipeolu, Shirin Djalalinia, Hoa Thi Do, Fariba Dorostkar, Leila Doshmangir, Kerrie E. Doyle, Susanna J. Dunachie, Andre Rodrigues Duraes, Mohammad Ebrahimi Kalan, Hamed Ebrahimzadeh Leylabadlo, Hisham Atan Edinur, Andem Effiong, Aziz Eftekhari, Iman El Sayed, Maysaa El Sayed Zaki, Teshome Bekele Elema, Hala Rashad Elhabashy, Shaimaa I. El-Jaafary, Aisha Elsharkawy, Mohammad Hassan Emamian, Shymaa Enany, Babak Eshrati, Khalil Eskandari, Sharareh Eskandarieh, Saman Esmaeilnejad, Firooz Esmaeilzadeh, Alireza Esteghamati, Atkilt Esaiyas Etisso, Mohammad Farahmand, Emerito Jose A. Faraon, Mohammad Fareed, Roghiyeh Faridnia, Andrea Farioli, Farshad Farzadfar, Nazir Fattahi, Mehdi Fazlzadeh, Seyed-Mohammad Fereshtehnejad, Eduarda Fernandes, Irina Filip, Florian Fischer, Nataliya A. Foigt, Morenike Oluwatoyin Folayan, Masoud Foroutan, Takeshi Fukumoto, Nancy Fullman, Mohamed M. Gad, Biniyam Sahiledengle Geberemariyam, Tsegaye Tewelde Gebrehiwot, Abiyu Mekonnen Gebrehiwot, Kidane Tadesse Gebremariam, Ketema Bizuwork Gebremedhin, Gebreamlak Gebremedhn Gebremeskel, Assefa Ayalew Gebreslassie, Getnet Azeze Gedefaw, Kebede Embaye Gezae, Keyghobad Ghadiri, Reza Ghaffari, Fatemeh Ghaffarifar, Mahsa Ghajarzadeh, Reza Ghanei Gheshlagh, Ahmad Ghashghaee, Hesam Ghiasvand, Asadollah Gholamian, Syed Amir Gilani, Paramjit Singh Gill, Alem Girmay, Nelson G. M. Gomes, Sameer Vali Gopalani, Bárbara Niegia Garcia Goulart, Ayman Grada, Rafael Alves Guimarães, Yuming Guo, Rahul Gupta, Nima Hafezi-Nejad, Arvin Haj-Mirzaian, Arya Haj-Mirzaian, Demelash Woldeyohannes Handiso, Asif Hanif, Hamidreza Haririan, Ahmed I. Hasaballah, Md Mehedi Hasan, Edris Hasanpoor, Amir Hasanzadeh, Soheil Hassanipour, Hadi Hassankhani, Reza Heidari-Soureshjani, Nathaniel J. Henry, Claudiu Herteliu, Fatemeh Heydarpour, Gillian I. Hollerich, Enayatollah Homaie Rad, Praveen Hoogar, Naznin Hossain, Mostafa Hosseini, Mehdi Hosseinzadeh, Mowafa Househ, Guoqing Hu, Tanvir M. Huda, Ayesha Humayun, Segun Emmanuel Ibitoye, Gloria Ikilezi, Olayinka Stephen Ilesanmi, Irena M. Ilic, Milena D. Ilic, Mohammad Hasan Imani-Nasab, Leeberk Raja Inbaraj, Usman Iqbal, Seyed Sina Naghibi Irvani, Sheikh Mohammed Shariful Islam, M. Mofizul Islam, Chinwe Juliana Iwu, Chidozie C. D. Iwu, Farhad Jadidi-Niaragh, Morteza Jafarinia, Nader Jahanmehr, Mihajlo Jakovljevic, Amir Jalali, Farzad Jalilian, Javad Javidnia, Ensiyeh Jenabi, Vivekanand Jha, John S. Ji, Oommen John, Kimberly B. Johnson, Farahnaz Joukar, Jacek Jerzy Jozwiak, Zubair Kabir, Ali Kabir, Hamed Kalani, Leila R. Kalankesh, Rohollah Kalhor, Zul Kamal, Tanuj Kanchan, Neeti Kapoor, Manoochehr Karami, Behzad Karami Matin, André Karch, Salah Eddin Karimi, Gbenga A. Kayode, Ali Kazemi Karyani, Peter Njenga Keiyoro, Yousef Saleh Khader, Morteza Abdullatif Khafaie, Mohammad Khammarnia, Muhammad Shahzeb Khan, Ejaz Ahmad Khan, Junaid Khan, Md Nuruzzaman Khan, Khaled Khatab, Mona M. Khater, Mahalaqua Nazli Khatib, Maryam Khayamzadeh, Mojtaba Khazaei, Salman Khazaei, Ardeshir Khosravi, Jagdish Khubchandani, Neda Kianipour, Yun Jin Kim, Ruth W. Kimokoti, Damaris K. Kinyoki, Adnan Kisa, Sezer Kisa, Tufa Kolola, Hamidreza Komaki, Soewarta Kosen, Parvaiz A. Koul, Ai Koyanagi, Moritz U. G. Kraemer, Kewal Krishan, Barthelemy Kuate Defo, Manasi Kumar, Pushpendra Kumar, G. Anil Kumar, Dian Kusuma, Carlo La Vecchia, Ben Lacey, Sheetal D. Lad, Dharmesh Kumar Lal, Felix Lam, Faris Hasan Lami, Van Charles Lansingh, Heidi Jane Larson, Savita Lasrado, Shaun Wen Huey Lee, Paul H. Lee, Kate E. LeGrand, Tsegaye Lolaso Lenjebo, Shanshan Li, Xiaofeng Liang, Patrick Y. Liu, Platon D. Lopukhov, Daiane Borges Machado, Phetole Walter Mahasha, Mokhtar Mahdavi Mahdavi, Mina Maheri, Narayan B. Mahotra, Venkatesh Maled, Shokofeh Maleki, Manzoor Ahmad Malik, Deborah Carvalho Malta, Fariborz Mansour-Ghanaei, Borhan Mansouri, Morteza Mansourian, Mohammad Ali Mansournia, Francisco Rogerlândio Martins-Melo, Anthony Masaka, Benjamin K. Mayala, Man Mohan Mehndiratta, Fereshteh Mehri, Kala M. Mehta, Peter T. N. Memiah, Walter Mendoza, Ritesh G. Menezes, Meresa Berwo Mengesha, Endalkachew Worku Mengesha, Tomislav Mestrovic, Kebadnew Mulatu Mihretie, Molly K. Miller-Petrie, Edward J. Mills, George J. Milne, Parvaneh Mirabi, Erkin M. Mirrakhimov, Roya Mirzaei, Maryam Mirzaei, Hamid Reza Mirzaei, Hamed Mirzaei, Mehdi Mirzaei-Alavijeh, Babak Moazen, Masoud Moghadaszadeh, Efat Mohamadi, Dara K. Mohammad, Yousef Mohammad, Karzan Abdulmuhsin Mohammad, Naser Mohammad Gholi Mezerji, Abolfazl Mohammadbeigi, Abdollah Mohammadian-Hafshejani, Reza Mohammadpourhodki, Shafiu Mohammed, Ammas Siraj Mohammed, Hussen Mohammed, Farnam Mohebi, Ali H. Mokdad, Lorenzo Monasta, Mohammad Amin Moosavi, Mahmood Moosazadeh, Ghobad Moradi, Masoud Moradi, Mohammad Moradi-Joo, Maziar Moradi-Lakeh, Rahmatollah Moradzadeh, Paula Moraga, Abbas Mosapour, Simin Mouodi, Seyyed Meysam Mousavi, Amin Mousavi Khaneghah, Ulrich Otto Mueller, Atalay Goshu Muluneh, Sandra B. Munro, Christopher J. L. Murray, G. V. S. Murthy, Saravanan Muthupandian, Mehdi Naderi, Ahamarshan Jayaraman Nagarajan, Mohsen Naghavi, Vinay Nangia, Jobert Richie Nansseu, Vinod C. Nayak, Javad Nazari, Duduzile Edith Ndwandwe, Ionut Negoi, Josephine W. Ngunjiri, Huong Lan Thi Nguyen, Chuc T. K. Nguyen, Trang Huyen Nguyen, Yeshambel T. Nigatu, Rajan Nikbakhsh, Shekoufeh Nikfar, Amin Reza Nikpoor, Dina Nur Anggraini Ningrum, Chukwudi A. Nnaji, In-Hwan Oh, Morteza Oladnabi, Andrew T. Olagunju, Jacob Olusegun Olusanya, Bolajoko Olubukunola Olusanya, Ahmed Omar Bali, Muktar Omer Omer, Obinna E. Onwujekwe, Aaron E. Osgood-Zimmerman, Mayowa O. Owolabi, Mahesh P A, Jagadish Rao Padubidri, Keyvan Pakshir, Adrian Pana, Anamika Pandey, Victoria Pando-Robles, Tahereh Pashaei, Deepak Kumar Pasupula, Angel J. Paternina-Caicedo, George C. Patton, Hamidreza Pazoki Toroudi, Veincent Christian Filipino Pepito, Julia Moreira Pescarini, David M. Pigott, Thomas Pilgrim, Meghdad Pirsaheb, Mario Poljak, Maarten J. Postma, Hadi Pourjafar, Farshad Pourmalek, Reza Pourmirza Kalhori, Sergio I. Prada, Sanjay Prakash, Zahiruddin Quazi Syed, Hedley Quintana, Navid Rabiee, Mohammad Rabiee, Amir Radfar, Alireza Rafiei, Fakher Rahim, Fatemeh Rajati, Muhammed Ahmed Rameto, Kiana Ramezanzadeh, Chhabi Lal Ranabhat, Sowmya J. Rao, Davide Rasella, Prateek Rastogi, Priya Rathi, Salman Rawaf, David Laith Rawaf, Lal Rawal, Reza Rawassizadeh, Ramu Rawat, Vishnu Renjith, Andre M. N. Renzaho, Bhageerathy Reshmi, Melese Abate Reta, Nima Rezaei, Mohammad Sadegh Rezai, Aziz Rezapour, Seyed Mohammad Riahi, Ana Isabel Ribeiro, Jennifer Rickard, Maria Rios-Blancas, Carlos Miguel Rios-González, Leonardo Roever, Morteza Rostamian, Salvatore Rubino, Godfrey M. Rwegerera, Anas M. Saad, Seyedmohammad Saadatagah, Siamak Sabour, Ehsan Sadeghi, Sahar Saeedi Moghaddam, Shahram Saeidi, Rajesh Sagar, Amirhossein Sahebkar, Mohammad Ali Sahraian, S. Mohammad Sajadi, Mohammad Reza Salahshoor, Nasir Salam, Hosni Salem, Marwa Rashad Salem, Joshua A. Salomon, Hossein Samadi Kafil, Evanson Zondani Sambala, Abdallah M. Samy, Sivan Yegnanarayana Iyer Saraswathy, Rodrigo Sarmiento-Suárez, Satish Saroshe, Benn Sartorius, Arash Sarveazad, Brijesh Sathian, Thirunavukkarasu Sathish, Lauren E. Schaeffer, David C. Schwebel, Subramanian Senthilkumaran, Hosein Shabaninejad, Saeed Shahabi, Amira A. Shaheen, Masood Ali Shaikh, Ali S. Shalash, Mehran Shams-Beyranvand, MohammadBagher Shamsi, Morteza Shamsizadeh, Kiomars Sharafi, Hamid Sharifi, Aziz Sheikh, Abbas Sheikhtaheri, Ranjitha S. Shetty, Wondimeneh Shibabaw Shiferaw, Mika Shigematsu, Jae Il Shin, Reza Shirkoohi, Soraya Siabani, Tariq Jamal Siddiqi, Jonathan I. S. Silverberg, Biagio Simonetti, Jasvinder A. Singh, Dhirendra Narain Sinha, Abiy H. Sinke, Amin Soheili, Anton Sokhan, Shahin Soltani, Moslem Soofi, Muluken Bekele Sorrie, Ireneous N. Soyiri, Adel Spotin, Emma Elizabeth Spurlock, Chandrashekhar T. Sreeramareddy, Agus Sudaryanto, Mu’awiyyah Babale Sufiyan, Hafiz Ansar Rasul Suleria, Rizwan Suliankatchi Abdulkader, Amir Taherkhani, Leili Tapak, Nuno Taveira, Parvaneh Taymoori, Yonatal Mesfin Tefera, Arash Tehrani-Banihashemi, Berhane Fseha Teklehaimanot, Gebretsadkan Hintsa Tekulu, Berhe Etsay Tesfay, Zemenu Tadesse Tessema, Belay Tessema, Kavumpurathu Raman Thankappan, Hamid Reza Tohidinik, Roman Topor-Madry, Marcos Roberto Tovani-Palone, Bach Xuan Tran, Riaz Uddin, Irfan Ullah, Chukwuma David Umeokonkwo, Bhaskaran Unnikrishnan, Era Upadhyay, Muhammad Shariq Usman, Maryam Vaezi, Sahel Valadan Tahbaz, Pascual R. Valdez, Yasser Vasseghian, Yousef Veisani, Francesco S. Violante, Sebastian Vollmer, Yasir Waheed, Jon Wakefield, Yafeng Wang, Yuan-Pang Wang, Girmay Teklay Weldesamuel, Andrea Werdecker, Ronny Westerman, Taweewat Wiangkham, Kirsten E. Wiens, Charles Shey Wiysonge, Gebremariam Woldu, Dawit Zewdu Wondafrash, Tewodros Eshete Wonde, Ai-Min Wu, Ali Yadollahpour, Seyed Hossein Yahyazadeh Jabbari, Tomohide Yamada, Sanni Yaya, Vahid Yazdi-Feyzabadi, Tomas Y. Yeheyis, Yigizie Yeshaw, Christopher Sabo Yilgwan, Paul Yip, Naohiro Yonemoto, Mustafa Z. Younis, Zabihollah Yousefi, Mahmoud Yousefifard, Taraneh Yousefinezhadi, Chuanhua Yu, Hasan Yusefzadeh, Siddhesh Zadey, Telma Zahirian Moghadam, Leila Zaki, Sojib Bin Zaman, Mohammad Zamani, Maryam Zamanian, Hamed Zandian, Alireza Zangeneh, Fatemeh Zarei, Taddese Alemu Zerfu, Yunquan Zhang, Zhi-Jiang Zhang, Xiu-Ju George Zhao, Maigeng Zhou, Arash Ziapour, Simon I. Hay, Stephen S. Lim, and Jonathan F. Mosser
Extended data
is available for this paper at 10.1038/s41586-020-03043-4.
Supplementary information
is available for this paper at 10.1038/s41586-020-03043-4.
References
- 1.McLean HQ, Fiebelkorn AP, Temte JL, Wallace GS. Prevention of measles, rubella, congenital rubella syndrome, and mumps, 2013: summary recommendations of Advisory Committee on Immunization Practices (ACIP) MMWR Morb. Mortal. Wkly Rep. 2013;62:1–34. [PubMed] [Google Scholar]
- 2.Keja K, Chan C, Hayden G, Henderson RH. Expanded programme on immunization. World Health Stat. Q. 1988;41:59–63. [PubMed] [Google Scholar]
- 3.World Health Assembly. WHO Expanded Programme on Immunization (World Health Organization, 1974).
- 4.GBD 2019 Diseases and Injuries Collaborators Global burden of 369 diseases and injuries in 204 countries and territories, 1990–2019: a systematic analysis for the Global Burden of Disease Study 2019. Lancet. 2020;396:1204–1222. doi: 10.1016/S0140-6736(20)30925-9. [DOI] [PMC free article] [PubMed] [Google Scholar]
- 5.WHO. Global Vaccine Action Plan 2011–2020. http://www.who.int/immunization/global_vaccine_action_plan/GVAP_doc_2011_2020/en/ (2012).
- 6.WHO. Immunization Agenda 2030: A Global Strategy to Leave No One Behind. http://www.who.int/immunization/immunization_agenda_2030/en/ (2020). [DOI] [PubMed]
- 7.Roberts, L. Polio, measles, other diseases set to surge as COVID-19 forces suspension of vaccination campaigns. Sciencehttps://www.sciencemag.org/news/2020/04/polio-measles-other-diseases-set-surge-covid-19-forces-suspension-vaccination-campaigns (9 April 2020).
- 8.Nelson R. COVID-19 disrupts vaccine delivery. Lancet Infect. Dis. 2020;20:546. doi: 10.1016/S1473-3099(20)30304-2. [DOI] [PMC free article] [PubMed] [Google Scholar]
- 9.WHO. New Measles Surveillance Data from WHO. http://www.who.int/immunization/newsroom/new-measles-data-august-2019/en/ (2019).
- 10.Center for Disease Control and Prevention. Global Measles Outbreaks. https://www.cdc.gov/globalhealth/measles/globalmeaslesoutbreaks.htm (2019).
- 11.Glass K, Kappey K, Grenfell BT. The effect of heterogeneity in measles vaccination on population immunity. Epidemiol. Infect. 2004;132:675–683. doi: 10.1017/s0950268804002080. [DOI] [PMC free article] [PubMed] [Google Scholar]
- 12.Larson HJ, et al. The state of vaccine confidence 2016: global insights through a 67-country survey. EBioMedicine. 2016;12:295–301. doi: 10.1016/j.ebiom.2016.08.042. [DOI] [PMC free article] [PubMed] [Google Scholar]
- 13.Plotkin, S., Orenstein, W., Offit, P. & Edwards, K. M. Plotkin’s Vaccines (Elsevier, 2017).
- 14.Mosser JF, et al. Mapping diphtheria-pertussis-tetanus vaccine coverage in Africa, 2000–2016: a spatial and temporal modelling study. Lancet. 2019;393:1843–1855. doi: 10.1016/S0140-6736(19)30226-0. [DOI] [PMC free article] [PubMed] [Google Scholar]
- 15.Truelove SA, et al. Characterizing the impact of spatial clustering of susceptibility for measles elimination. Vaccine. 2019;37:732–741. doi: 10.1016/j.vaccine.2018.12.012. [DOI] [PMC free article] [PubMed] [Google Scholar]
- 16.Verguet S, et al. Measles control in sub-Saharan Africa: South Africa as a case study. Vaccine. 2012;30:1594–1600. doi: 10.1016/j.vaccine.2011.12.123. [DOI] [PubMed] [Google Scholar]
- 17.Ferrari MJ, Grenfell BT, Strebel PM. Think globally, act locally: the role of local demographics and vaccination coverage in the dynamic response of measles infection to control. Phil. Trans. R. Soc. B. 2013;368:20120141. doi: 10.1098/rstb.2012.0141. [DOI] [PMC free article] [PubMed] [Google Scholar]
- 18.WHO. WHO/UNICEF Joint Reporting Process. http://www.who.int/immunization/monitoring_surveillance/routine/reporting/en/ (2019).
- 19.Brown DW. Definition and use of “valid” district level vaccination coverage to monitor Global Vaccine Action Plan (GVAP) achievement: evidence for revisiting the district indicator. J. Glob. Health. 2018;8:020404. doi: 10.7189/jogh.08.020404. [DOI] [PMC free article] [PubMed] [Google Scholar]
- 20.Lim SS, Stein DB, Charrow A, Murray CJ. Tracking progress towards universal childhood immunisation and the impact of global initiatives: a systematic analysis of three-dose diphtheria, tetanus, and pertussis immunisation coverage. Lancet. 2008;372:2031–2046. doi: 10.1016/S0140-6736(08)61869-3. [DOI] [PubMed] [Google Scholar]
- 21.Utazi CE, et al. High resolution age-structured mapping of childhood vaccination coverage in low and middle income countries. Vaccine. 2018;36:1583–1591. doi: 10.1016/j.vaccine.2018.02.020. [DOI] [PMC free article] [PubMed] [Google Scholar]
- 22.Takahashi S, Metcalf CJE, Ferrari MJ, Tatem AJ, Lessler J. The geography of measles vaccination in the African Great Lakes region. Nat. Commun. 2017;8:15585. doi: 10.1038/ncomms15585. [DOI] [PMC free article] [PubMed] [Google Scholar]
- 23.Kundrick A, et al. Sub-national variation in measles vaccine coverage and outbreak risk: a case study from a 2010 outbreak in Malawi. BMC Public Health. 2018;18:741. doi: 10.1186/s12889-018-5628-x. [DOI] [PMC free article] [PubMed] [Google Scholar]
- 24.Utazi CE, et al. Mapping vaccination coverage to explore the effects of delivery mechanisms and inform vaccination strategies. Nat. Commun. 2019;10:1633. doi: 10.1038/s41467-019-09611-1. [DOI] [PMC free article] [PubMed] [Google Scholar]
- 25.Dwyer-Lindgren L, et al. Mapping HIV prevalence in sub-Saharan Africa between 2000 and 2017. Nature. 2019;570:189–193. doi: 10.1038/s41586-019-1200-9. [DOI] [PMC free article] [PubMed] [Google Scholar]
- 26.Burstein R, et al. Mapping 123 million neonatal, infant and child deaths between 2000 and 2017. Nature. 2019;574:353–358. doi: 10.1038/s41586-019-1545-0. [DOI] [PMC free article] [PubMed] [Google Scholar]
- 27.Local Burden of Disease Educational Attainment Collaborators Mapping disparities in education across low- and middle-income countries. Nature. 2020;577:235–238. doi: 10.1038/s41586-019-1872-1. [DOI] [PMC free article] [PubMed] [Google Scholar]
- 28.Local Burden of Disease Child Growth Failure Collaborators Mapping child growth failure across low- and middle-income countries. Nature. 2020;577:231–234. doi: 10.1038/s41586-019-1878-8. [DOI] [PMC free article] [PubMed] [Google Scholar]
- 29.Weiss DJ, et al. A global map of travel time to cities to assess inequalities in accessibility in 2015. Nature. 2018;553:333–336. doi: 10.1038/nature25181. [DOI] [PubMed] [Google Scholar]
- 30.Tatem AJ. WorldPop, open data for spatial demography. Sci. Data. 2017;4:170004. doi: 10.1038/sdata.2017.4. [DOI] [PMC free article] [PubMed] [Google Scholar]
- 31.WHO. Global Measles and Rubella Strategic Plan: 2012–2020. http://apps.who.int/iris/bitstream/10665/44855/1/9789241503396%5Feng.pdf (2012).
- 32.Global Burden of Disease Health Financing Collaborator Network Past, present, and future of global health financing: a review of development assistance, government, out-of-pocket, and other private spending on health for 195 countries, 1995–2050. Lancet. 2019;393:2233–2260. doi: 10.1016/S0140-6736(19)30841-4. [DOI] [PMC free article] [PubMed] [Google Scholar]
- 33.Muraskin, W. et al. in Public–Private Partnerships for Public Health Ch. 6 (ed. Reich, M. R.) 115–168 (Harvard Center for Population and Development Studies, 2002).
- 34.Ikilezi G, Augusto OJ, Dieleman JL, Sherr K, Lim SS. Effect of donor funding for immunization from Gavi and other development assistance channels on vaccine coverage: evidence from 120 low and middle income recipient countries. Vaccine. 2020;38:588–596. doi: 10.1016/j.vaccine.2019.10.057. [DOI] [PubMed] [Google Scholar]
- 35.Piot P, et al. Immunization: vital progress, unfinished agenda. Nature. 2019;575:119–129. doi: 10.1038/s41586-019-1656-7. [DOI] [PubMed] [Google Scholar]
- 36.Council on Foreign Relations. Violence in the Central African Republic. Global Conflict Trackerhttps://cfr.org/interactive/global-conflict-tracker/conflict/violence-central-african-republic (2019).
- 37.Mashal T, Nakamura K, Kizuki M, Seino K, Takano T. Impact of conflict on infant immunisation coverage in Afghanistan: a countrywide study 2000–2003. Int. J. Health Geogr. 2007;6:23. doi: 10.1186/1476-072X-6-23. [DOI] [PMC free article] [PubMed] [Google Scholar]
- 38.Council on Foreign Relations. Boko Haram in Nigeria. Global Conflict Trackerhttps://cfr.org/interactive/global-conflict-tracker/conflict/boko-haram-nigeria (2019).
- 39.WHO. Data, Statistics and Graphics. http://www.who.int/immunization/monitoring_surveillance/data/en/ (accessed 30 April 2020).
- 40.Larson HJ, Hartigan-Go K, de Figueiredo A. Vaccine confidence plummets in the Philippines following dengue vaccine scare: why it matters to pandemic preparedness. Hum. Vaccin. Immunother. 2019;15:625–627. doi: 10.1080/21645515.2018.1522468. [DOI] [PMC free article] [PubMed] [Google Scholar]
- 41.Institute for Health Metrics and Evaluation (IHME). Financing Global Health 2018: Countries and Programs in Transition. http://www.healthdata.org/sites/default/files/files/policy_report/FGH/2019/FGH_2018_full-report.pdf (University of Washington, 2019).
- 42.Berkley S. Vaccination lags behind in middle-income countries. Nature. 2019;569:309. doi: 10.1038/d41586-019-01494-y. [DOI] [PubMed] [Google Scholar]
- 43.Wellcome Trust. Wellcome Global Monitor 2018: How does the World feel about Science and Health?https://wellcome.ac.uk/sites/default/files/wellcome-global-monitor-2018.pdf (2019).
- 44.WHO. Maintaining Essential Health Services: Operational Guidance for the COVID-19 Context Interim Guidance. https://www.who.int/publications-detail/covid-19-operational-guidance-for-maintaining-essential-health-services-during-an-outbreak (2020).
- 45.Gurnani V, et al. Improving vaccination coverage in India: lessons from Intensified Mission Indradhanush, a cross-sectoral systems strengthening strategy. Br. Med. J. 2018;363:k4782. doi: 10.1136/bmj.k4782. [DOI] [PMC free article] [PubMed] [Google Scholar]
- 46.Centers for Disease Control and Prevention Progress in implementing measles mortality reduction strategies—India, 2010–2011. MMWR Morb. Mortal. Wkly Rep. 2011;60:1315–1319. [PubMed] [Google Scholar]
- 47.Masresha BG, et al. Introduction of the second dose of measles containing vaccine in the childhood vaccination programs within the WHO Africa Region – lessons learnt. J. Immunol. Sci. 2018;S017:113–121. [PMC free article] [PubMed] [Google Scholar]
- 48.ERG. Equality Reference Group for Immunization: Advocacy Brief. https://sites.google.com/view/erg4immunisation (accessed 30 April 2020).
- 49.United Nations Department of Economic and Social Affairs (UNDESA). Sustainable Development Goals: The 17 Goals. https://sustainabledevelopment.un.org/?menu=1300 (2019).
- 50.ESA-CCI Project. Land Cover Classification Gridded Maps from 1992 to Present Derived from Satellite Observations. https://cds.climate.copernicus.eu/cdsapp#!/dataset/satellite-land-cover?tab=overview (accessed 30 April 2020).
- 51.Stevens, G. A. et al. Guidelines for accurate and transparent health estimates reporting: the GATHER statement. Lancet388, e19–e23 (2016). [DOI] [PubMed]
- 52.World Health Organization. WHO Vaccine-preventable Diseases: Monitoring System. 2020 Global Summary. Immunization Schedule by Disease covered by Antigens within Age Range Selection Centre. https://apps.who.int/immunization_monitoring/globalsummary/diseases (2019).
- 53.WHO. Decade of Vaccines — Global Vaccine Action Plan 2011–2020. https://www.who.int/immunization/global_vaccine_action_plan/DoV_GVAP_2012_2020/en/ (accessed 30 April 2020).
- 54.GBD 2017 Population and Fertility Collaborators Population and fertility by age and sex for 195 countries and territories, 1950–2017: a systematic analysis for the Global Burden of Disease Study 2017. Lancet. 2018;392:1995–2051. doi: 10.1016/S0140-6736(18)32278-5. [DOI] [PMC free article] [PubMed] [Google Scholar]
- 55.Institute for Health Metrics and Evaluation. Global Health Data Exchange (GHDx). http://ghdx.healthdata.org/ (2019).
- 56.Osgood-Zimmerman A, et al. Mapping child growth failure in Africa between 2000 and 2015. Nature. 2018;555:41–47. doi: 10.1038/nature25760. [DOI] [PMC free article] [PubMed] [Google Scholar]
- 57.Faraway, J. J. Linear Models with R (Chapman and Hall/CRC, 2009).
- 58.Bhatt S, et al. Improved prediction accuracy for disease risk mapping using Gaussian process stacked generalization. J. R. Soc. Interface. 2017;14:20170520. doi: 10.1098/rsif.2017.0520. [DOI] [PMC free article] [PubMed] [Google Scholar]
- 59.Banerjee, S., Carlin, B. P. & Gelfand, A. E. Hierarchical Modeling and Analysis for Spatial Data (Chapman and Hall/CRC, 2014).
- 60.Cressie, N. & Wikle, C. K. Statistics for Spatio-Temporal Data (Wiley, 2011).
- 61.Reiner RC, Jr, et al. Variation in childhood diarrheal morbidity and mortality in Africa, 2000–2015. N. Engl. J. Med. 2018;379:1128–1138. doi: 10.1056/NEJMoa1716766. [DOI] [PMC free article] [PubMed] [Google Scholar]
- 62.Golding N, et al. Mapping under-5 and neonatal mortality in Africa, 2000–15: a baseline analysis for the Sustainable Development Goals. Lancet. 2017;390:2171–2182. doi: 10.1016/S0140-6736(17)31758-0. [DOI] [PMC free article] [PubMed] [Google Scholar]
- 63.Gomez-Rubio, V. Bayesian Inference with INLA (Chapman and Hall/CRC, 2020).
- 64.Stein, M. L. Interpolation of Spatial Data: Some Theory for Kriging (Springer-Verlag, 1999).
- 65.Martins TG, Simpson D, Lindgren F, Rue H. Bayesian computing with INLA: new features. Comput. Stat. Data Anal. 2013;67:68–83. [Google Scholar]
- 66.De Maio FG. Income inequality measures. J. Epidemiol. Community Health. 2007;61:849–852. doi: 10.1136/jech.2006.052969. [DOI] [PMC free article] [PubMed] [Google Scholar]
- 67.Sen, A. et al. On Economic Inequality (Clarendon, 1997).
- 68.Ray, D. Development Economics (Princeton Univ. Press, 1998).
- 69.Cutts FT, Claquin P, Danovaro-Holliday MC, Rhoda DA. Monitoring vaccination coverage: defining the role of surveys. Vaccine. 2016;34:4103–4109. doi: 10.1016/j.vaccine.2016.06.053. [DOI] [PMC free article] [PubMed] [Google Scholar]
- 70.Cutts FT, Izurieta HS, Rhoda DA. Measuring coverage in MNCH: design, implementation, and interpretation challenges associated with tracking vaccination coverage using household surveys. PLoS Med. 2013;10:e1001404. doi: 10.1371/journal.pmed.1001404. [DOI] [PMC free article] [PubMed] [Google Scholar]
- 71.Dansereau E, Brown D, Stashko L, Danovaro-Holliday MC. A systematic review of the agreement of recall, home-based records, facility records, BCG scar, and serology for ascertaining vaccination status in low and middle-income countries. Gates Open Res. 2020;3:923. doi: 10.12688/gatesopenres.12916.1. [DOI] [PMC free article] [PubMed] [Google Scholar]
- 72.Marquez, N. & Wakefield, J. Harmonizing child mortality data at disparate geographic levels. Preprint at https://arxiv.org/abs/2002.00089 (2020). [DOI] [PMC free article] [PubMed]
- 73.Stein ML. Space–time covariance functions. J. Am. Stat. Assoc. 2005;100:310–321. [Google Scholar]
- 74.Gneiting T. Nonseparable, stationary covariance functions for space–time data. J. Am. Stat. Assoc. 2002;97:590–600. [Google Scholar]
- 75.Perisic A, Bauch CT. Social contact networks and disease eradicability under voluntary vaccination. PLOS Comput. Biol. 2009;5:e1000280. doi: 10.1371/journal.pcbi.1000280. [DOI] [PMC free article] [PubMed] [Google Scholar]
- 76.Streefland P, Chowdhury AMR, Ramos-Jimenez P. Patterns of vaccination acceptance. Soc. Sci. Med. 1999;49:1705–1716. doi: 10.1016/s0277-9536(99)00239-7. [DOI] [PubMed] [Google Scholar]
- 77.Global Administrative Areas. GADM Maps and Data. v.3.6 https://gadm.org/ (2019).
Associated Data
This section collects any data citations, data availability statements, or supplementary materials included in this article.
Supplementary Materials
This file contains Supplementary Methods, Supplementary Results and Discussion, Supplementary Figures 1-20 and Supplementary Tables 1-15.
Data Availability Statement
The findings of this study are supported by data available in public online repositories and data publicly available upon request from the data provider. A detailed table of data sources and availability can be found in Supplementary Table 4 and at http://ghdx.healthdata.org/lbd-publication-data-input-sources. Administrative boundaries were modified from the Database for Global Administrative Areas (GADM) dataset77. Populations were retrieved from WorldPop30, and gridded estimates of travel time to the nearest city or settlement were available online from a previously published study29. This study complies with the GATHER recommendations51.
This study is compliant with the GATHER recommendations51; as such, all computer code is available from GitHub (https://github.com/ihmeuw/lbd/tree/mcv1-lmic-2020). All maps and figures presented in this study are generated by the authors using RStudio (R version 3.6.1), ArcGIS Desktop 10.6 and Python 2.7.