

Abstract
Appropriate use and interpretation of serological tests for assessments of SARS-CoV-2 exposure, infection and potential immunity require accurate assay performance data. We conducted a head-to-head evaluation of 10 point-of-care (POC) style lateral flow assays (LFAs) and two laboratory-based enzyme-linked immunosorbent assays (ELISAs) to detect anti-SARS-CoV-2 IgM and IgG antibodies by 5-day time intervals from symptom onset and the specificity of each assay in pre-COVID-2019 specimens. The percent of seropositive individuals increased with time, peaking in the latest time interval tested (>20 days after symptom onset). Test specificity was heterogeneous (ranging from 84.3–100.0%) and was predominantly affected by variability in IgM results. LFA specificity could be increased by considering weak bands as negative, but this decreased detection of antibodies in a subset of SARS-CoV-2 real-time polymerase chain reaction (RT-PCR)-positive cases. Our results indicate the importance of seropositivity threshold determination and reader training for reliable LFA deployment. Informed use of serology will require evaluations covering the full spectrum of SARS-CoV-2 infections, from asymptomatic and mild infection to severe disease, and later convalescence. Well-designed studies to elucidate the mechanisms and serological correlates of protective immunity will be crucial to guide rational clinical and public health policies.
INTRODUCTION
To date, hundreds of thousands of deaths have been attributed to Coronavirus Disease 2019 (COVID-19).1 Millions of infections by SARS-CoV-2, the virus responsible for COVID-19, have been reported, though its full extent has yet to be determined due to limited testing.2 Government interventions to slow viral spread have disrupted daily life and economic activity for billions of people. Strategies to ease restraints on human mobility and interaction, without provoking major resurgence of transmission and mortality, will depend on accurate estimates of population levels of infection and immunity.3 Current testing for the virus largely depends on labor-intensive molecular techniques.4 Individuals with positive molecular tests represent only a small fraction of all infections, given limited deployment and the brief time window when RT-PCR testing has the highest sensitivity.5–7 The proportion of undocumented cases in the original epidemic focus was estimated to be as high as 86%,8 and asymptomatic infections are suspected to play a substantial role in transmission.9–14
Widely available, reliable antibody detection assays would enable more accurate estimates of SARS-CoV-2 prevalence and incidence. On February 4, 2020, the Secretary of the US Department of Health and Human Services issued emergency use authorization (EUA) for diagnosis of SARS-CoV-2,15 allowing nucleic acid detection and immunoassay tests to be offered based on manufacturer-reported data without formal FDA clearance.16 In response, dozens of companies began to market laboratory-based immunoassays and point-of-care (POC) tests. Rigorous, comparative performance data are crucial to inform clinical care and public health responses.
We conducted a head-to-head comparison of serology tests available to our group in early April, comprising 10 immunochromatographic LFAs and 2 ELISAs (for details, see Supplementary Table 1). Specimens were obtained from SARS-CoV-2 patients confirmed by RT-PCR, contemporaneous patients with other respiratory pathogen testing and/or without SARS-CoV2 by RT-PCR, and blood donor specimens collected before 2019. We included analyses of performance by time from symptom onset and disease severity. Our goal was to provide well-controlled performance data to help guide the use of serology in the response to COVID-19.
RESULTS
Study population
The study included 128 plasma or serum specimens from 79 SARS-CoV-2-positive individuals diagnosed in the University of California, San Francisco (UCSF) hospital system and Zuckerberg San Francisco General (ZSFG) Hospital. Patients ranged from 22 to >90 years of age (Table 1). The majority of patients were Hispanic/Latinx (68%), reflecting the ZSFG patient population and demographics of the epidemic in San Francisco.17,18 Most presented with cough (91%) and fever (86%). Chronic medical conditions, such as hypertension, type 2 diabetes mellitus, obesity, and chronic kidney disease, were frequent. Of the 79 cases, 18% were outpatients, 46% inpatients without ICU care, and 37% required ICU care; there were no reported deaths at the time of chart review.
Table 1: Demographics and clinical characteristics of SARS-CoV-2 RT-PCR positive patients.
Baseline demographic characteristics, presenting symptoms, chronic medical conditions, initial disposition and highest-level outcome for all participants whose samples were included in each time interval for serological testing. Only one sample per patient was included in each time interval, and some individuals are represented by multiple samples in different time intervals. In total, we tested 128 samples taken from 79 SARS-CoV-2 RT-PCR-positive cases.
| Variable | All Patients (N=79) |
0-5d (N=28) |
6-10d (N=36) |
11-15d (N=34) |
16-20d (N=19) |
>20d (N=11) |
|---|---|---|---|---|---|---|
| Age, mean (S.D.) | 52.9 (15) | 48.2 (15.0) | 53.3 (15.1) | 58.1±15.1 | 56.6 (13.2) | 55.5 (14.8) |
| Male sex (%) | 54 (68) | 15 (54) | 24 (67) | 21 (62) | 12 (63) | 8 (73) |
| Racial or ethnic group | ||||||
| Hispanic/Latinx (%) | 54 (68) | 18 (64) | 29 (81) | 23 (68) | 12 (63) | 7 (64) |
| Asian (%) | 7 (9) | 3 (11) | 2 (6) | 4 (12) | 3 (16) | 0 (0) |
| White (%) | 7 (9) | 3 (11) | 1 (3) | 2 (6) | 2 (11) | 0 (0) |
| Black (%) | 6 (8) | 2 (7) | 3 (8) | 4 (12) | 1 (5) | 2 (18) |
| Other/not reported (%) | 5 (6) | 2 (7) | 1 (3) | 1 (3) | 1 (5) | 2 (18) |
| Presenting symptoms | ||||||
| Cough (%) | 72 (91) | 24 (86) | 33 (92) | 31 (91) | 17 (89) | 9 (82) |
| Fever (%) | 68 (86) | 23 (82) | 30 (83) | 29 (85) | 17 (89) | 9 (82) |
| Myalgia (%) | 29 (37) | 8 (29) | 12 (33) | 13 (38) | 8 (42) | 3 (27) |
| Chest pain (%) | 20 (25) | 5 (18) | 8 (22) | 7 (21) | 5 (26) | 4 (36) |
| Headache (%) | 20 (25) | 4 (14) | 11 (31) | 9 (26) | 6 (32) | 4 (36) |
| Chills (%) | 19 (24) | 5 (18) | 9 (25) | 7 (21) | 7 (37) | 2 (18) |
| Sore throat (%) | 19 (24) | 4 (14) | 11 (31) | 8 (24) | 5 (26) | 3 (27) |
| Malaise (%) | 17 (22) | 4 (14) | 7 (19) | 9 (26) | 4 (21) | 1 (9) |
| Diarrhea (%) | 13 (16) | 4 (14) | 7 (19) | 6 (18) | 4 (21) | 1 (9) |
| Anorexia (%) | 8 (10) | 2 (7) | 1 (3) | 2 (6) | 4 (21) | 1 (9) |
| Nausea and/or vomiting (%) | 8 (10) | 2 (7) | 2 (6) | 2 (6) | 2 (11) | 1 (9) |
| Anosmia and/or dysgeusia (%) | 4 (5) | 1 (4) | 1 (3) | 2 (6) | 0 (0) | 1 (9) |
| Chronic medical conditions | ||||||
| Hypertension (%) | 36 (46) | 11 (39) | 17 (47) | 21 (62) | 11 (58) | 6 (55) |
| T2DM (%) | 33 (42) | 11 (39) | 17 (47) | 19 (56) | 8 (42) | 6 (55) |
| Obesity (%) | 19 (24) | 7 (25) | 9 (25) | 11 (32) | 6 (32) | 6 (55) |
| CKD (%) | 10 (13) | 4 (14) | 3 (8) | 6 (18) | 4 (21) | 3 (27) |
| Hypothyroid (%) | 6 (8) | 3 (11) | 3 (8) | 3 (9) | 0 (0) | 0 (0) |
| Solid organ transplant (%) | 6 (8) | 2 (7) | 0 (0) | 2 (6) | 2 (11) | 2 (18) |
| CAD (%) | 5 (6) | 1 (4) | 1 (3) | 2 (6) | 2 (11) | 3 (27) |
| Asthma (%) | 4 (5) | 1 (4) | 1 (3) | 3 (9) | 2 (11) | 0 (0) |
| CHF (%) | 3 (4) | 2 (7) | 2 (6) | 2 (6) | 1 (5) | 0 (0) |
| Liver disease (%) | 3 (4) | 0 (0) | 1 (3) | 2 (6) | 1 (5) | 1 (9) |
| Malignancy (%) | 3 (4) | 1 (4) | 2 (6) | 1 (3) | 2 (11) | 0 (0) |
| Emphysema (%) | 2 (3) | 0 (0) | 1 (3) | 1 (3) | 1 (5) | 1 (9) |
| Prior stroke (%) | 2 (3) | 1 (4) | 0 (0) | 0 (0) | 0 (0) | 1 (9) |
| HIV (%) | 1 (1) | 1 (4) | 0 (0) | 0 (0) | 0 (0) | 0 (0) |
| Other immune compromised condition* (%) | 5 (6) | 1 (4) | 1 (3) | 3 (9) | 2 (11) | 1 (9) |
| Highest-level of care | ||||||
| Ambulatory** (%) | 14 (18) | 9 (32) | 2 (6) | 3 (9) | 0 (0) | 0 (0) |
| Admitted (%) | 36 (46) | 11 (39) | 19 (53) | 12 (35) | 5 (26) | 4 (36) |
| ICU (%) | 29 (37) | 8 (29) | 15 (42) | 19 (56) | 14 (74) | 7 (64) |
Other immune compromised condition includes rheumatology patients (rheumatoid arthritis, psoriasis, Crohn’s disease, ankylosing spondylitis, and reactive arthritis), all of whom were taking immune modulating/suppressing therapies.
Ambulatory care includes outpatient as well as patients seen in ED and not admitted.
Test Performance
The percentage of specimens testing positive rose with increasing time from symptom onset (Table 2, Fig. 1a), reaching the highest levels in the 16–20 and >20 day time intervals. The highest detection rate was achieved by combining IgM and IgG results (Fig. 1b). However, 95% confidence intervals for later time intervals showed substantial overlap with those for earlier intervals (Fig. 1b). Four assays (Bioperfectus, Premier, Wondfo, in-house ELISA) achieved >80% positivity in the later two time intervals (16–20 days and >20 days) while maintaining >95% specificity. Some tests were not performed on a subset of specimens due to exhausted sample material, which may have affected reported percent positivity; the sample size tested is reflected in 95% confidence intervals. IgM detection was less consistent than IgG for nearly all assays. Kappa agreement statistic ranged from 0.95 to 0.99 for IgG and 0.81 to 1.00 for IgM for standardized intensity score (Supplementary Table 2 and Supplementary Figure 2). Details on establishing intensity score values and reader training are available under Immunochromatographic LFAs section within the Online Methods. Although mean band intensities varied among different assays, the approximate rate of sample positivity was generally consistent (Figure 2). For ELISA tests, a normalized value of sample optical density at 450 nanometers (OD450) divided by calculated cutoff (signal-to-cutoff, S/CO) was used to capture quantitative data about antibody levels for each specimen. S/CO values provide a quantitative value comparable between plates. Ability to perform end-point dilutions was limited by specimen and assay availability.
Table 2: Summary statistics for immunochromatographic lateral flow assays (LFAs) and Enzyme-Linked Immunosorbent Assays (ELISAs).
Samples are binned by time after patient-reported symptom onset for SARS-CoV-2 RT-PCR-positive cases. Percent of seropositivity assessed by each assay in SARS-CoV-2 RT-PCR-positive samples is reported with 95% Confidence Intervals (95% CI). The column “IgM or IgG” refers to positivity of either isotype. Specificity is determined relative to pre-COVID-19 negative control serum samples. Percent of seropositivity assessed by each assay is reported with 95% confidence intervals for samples from individuals who were positive for non-SARS-CoV-2 viral infections and/or tested negative for SARS-CoV-2 by RT-PCR.
| Percentage of positive specimens from patients with positive SARS-CoV2 RT-PCR by days since symptom onset | ||||||||||||
|---|---|---|---|---|---|---|---|---|---|---|---|---|
| IgM | IgG | IgM or IgG | ||||||||||
| Assay | Total N | positive | % | 95% CI | Total N | positive | % | 95% CI | Total N | positive | % | 95% CI |
|
Immunochromatographic Lateral Flow Assays | ||||||||||||
| Biomedomics | ||||||||||||
| 1-5 days | 27 | 7 | 25.9 | 11.1 - 46.3 | 27 | 6 | 22.2 | 8.6 - 42.3 | 27 | 8 | 29.6 | 13.8 - 50.2 |
| 6-10 days | 36 | 22 | 61.1 | 43.5 - 76.9 | 36 | 19 | 52.8 | 35.5 - 69.6 | 36 | 23 | 63.9 | 46.2 - 79.2 |
| 11-15 days | 33 | 25 | 75.8 | 57.7 - 88.9 | 33 | 23 | 69.7 | 51.3 - 84.4 | 33 | 26 | 78.8 | 61.1 - 91.0 |
| 16-20 days | 19 | 16 | 84.2 | 60.4 - 96.6 | 19 | 14 | 73.7 | 48.8 - 90.9 | 19 | 17 | 89.5 | 66.9 - 98.7 |
| >20 days | 11 | 9 | 81.8 | 48.2 - 97.7 | 11 | 9 | 81.8 | 48.2 - 97.7 | 11 | 9 | 81.8 | 48.2 - 97.7 |
| Bioperfectus | ||||||||||||
| 1-5 days | 28 | 11 | 39.3 | 21.5 - 59.4 | 28 | 7 | 25.0 | 10.7 - 44.9 | 28 | 11 | 39.3 | 21.5 - 59.4 |
| 6-10 days | 35 | 26 | 74.3 | 56.7 - 87.5 | 35 | 23 | 65.7 | 47.8 - 80.9 | 35 | 27 | 77.1 | 59.9 - 89.6 |
| 11-15 days | 34 | 28 | 82.4 | 65.5 - 93.2 | 34 | 27 | 79.4 | 62.1 - 91.3 | 34 | 30 | 88.2 | 72.5 - 96.7 |
| 16-20 days | 19 | 16 | 84.2 | 60.4 - 96.6 | 19 | 14 | 73.7 | 48.8 - 90.9 | 19 | 17 | 89.5 | 66.9 - 98.7 |
| >20 days | 10 | 10 | 100.0 | 69.2 - 100.0 | 10 | 9 | 90.0 | 55.5 - 99.7 | 10 | 10 | 100.0 | 69.2 - 100.0 |
| DecomBio | ||||||||||||
| 1-5 days | 26 | 8 | 30.8 | 14.3 - 51.8 | 26 | 7 | 26.9 | 11.6 - 47.8 | 26 | 8 | 30.8 | 14.3 - 51.8 |
| 6-10 days | 36 | 24 | 66.7 | 49.0 - 81.4 | 36 | 24 | 66.7 | 49.0 - 81.4 | 36 | 24 | 66.7 | 49.0 - 81.4 |
| 11-15 days | 33 | 29 | 87.9 | 71.8 - 96.6 | 33 | 29 | 87.9 | 71.8 - 96.6 | 33 | 29 | 87.9 | 71.8 - 96.6 |
| 16-20 days | 18 | 14 | 77.8 | 52.4 - 93.6 | 18 | 14 | 77.8 | 52.4 - 93.6 | 18 | 14 | 77.8 | 52.4 - 93.6 |
| >20 days | 11 | 10 | 90.9 | 58.7 - 99.8 | 11 | 10 | 90.9 | 58.7 - 99.8 | 11 | 10 | 90.9 | 58.7 - 99.8 |
| DeepBlue | ||||||||||||
| 1-5 days | 28 | 12 | 42.9 | 24.5 - 62.8 | 28 | 6 | 21.4 | 8.3 - 41.0 | 28 | 12 | 42.9 | 24.5 - 62.8 |
| 6-10 days | 36 | 28 | 77.8 | 60.8 - 89.9 | 36 | 18 | 50.0 | 32.9 - 67.1 | 36 | 28 | 77.8 | 60.8 - 89.9 |
| 11-15 days | 34 | 28 | 82.4 | 65.5 - 93.2 | 34 | 21 | 61.8 | 43.6 - 77.8 | 34 | 28 | 82.4 | 65.5 - 93.2 |
| 16-20 days | 19 | 16 | 84.2 | 60.4 - 96.6 | 19 | 15 | 78.9 | 54.4 - 93.9 | 19 | 17 | 89.5 | 66.9 - 98.7 |
| >20 days | 11 | 10 | 90.9 | 58.7 - 99.8 | 11 | 9 | 81.8 | 48.2 - 97.7 | 11 | 10 | 90.9 | 58.7 - 99.8 |
| Innovita | ||||||||||||
| 1-5 days | 27 | 4 | 14.8 | 4.2 - 33.7 | 27 | 7 | 25.9 | 11.1 - 46.3 | 27 | 7 | 25.9 | 11.1 - 46.3 |
| 6-10 days | 36 | 12 | 33.3 | 18.6 - 51.0 | 36 | 17 | 47.2 | 30.4 - 64.5 | 36 | 20 | 55.6 | 38.1 - 72.1 |
| 11-15 days | 31 | 12 | 38.7 | 21.8 - 57.8 | 32 | 25 | 78.1 | 60.0 - 90.7 | 32 | 25 | 78.1 | 60.0 - 90.7 |
| 16-20 days | 13 | 4 | 30.8 | 9.1 - 61.4 | 13 | 9 | 69.2 | 38.6 - 90.9 | 13 | 9 | 69.2 | 38.6 - 90.9 |
| >20 days | 6 | 1 | 16.7 | 0.4 - 64.1 | 6 | 4 | 66.7 | 22.3 - 95.7 | 6 | 5 | 83.3 | 35.9 - 99.6 |
| Premier | ||||||||||||
| 1-5 days | 28 | 10 | 35.7 | 18.6 - 55.9 | 28 | 6 | 21.4 | 8.3 - 41.0 | 28 | 10 | 35.7 | 18.6 - 55.9 |
| 6-10 days | 35 | 25 | 71.4 | 53.7 - 85.4 | 35 | 18 | 51.4 | 34.0 - 68.6 | 35 | 25 | 71.4 | 53.7 - 85.4 |
| 11-15 days | 34 | 28 | 82.4 | 65.5 - 93.2 | 34 | 22 | 64.7 | 46.5 - 80.3 | 34 | 29 | 85.3 | 68.9 - 95.0 |
| 16-20 days | 19 | 16 | 84.2 | 60.4 - 96.6 | 19 | 14 | 73.7 | 48.8 - 90.9 | 19 | 17 | 89.5 | 66.9 - 98.7 |
| >20 days | 11 | 10 | 90.9 | 58.7 - 99.8 | 11 | 9 | 81.8 | 48.2 - 97.7 | 11 | 10 | 90.9 | 58.7 - 99.8 |
| Sure | ||||||||||||
| 1-5 days | 28 | 3 | 10.7 | 2.3 - 28.2 | 28 | 5 | 17.9 | 6.1 - 36.9 | 28 | 5 | 17.9 | 6.1 - 36.9 |
| 6-10 days | 35 | 15 | 42.9 | 26.3 - 60.6 | 35 | 19 | 54.3 | 36.6 - 71.2 | 35 | 19 | 54.3 | 36.6 - 71.2 |
| 11-15 days | 34 | 22 | 64.7 | 46.5 - 80.3 | 34 | 25 | 73.5 | 55.6 - 87.1 | 34 | 25 | 73.5 | 55.6 - 87.1 |
| 16-20 days | 19 | 14 | 73.7 | 48.8 - 90.9 | 19 | 14 | 73.7 | 48.8 - 90.9 | 19 | 15 | 78.9 | 54.4 - 93.9 |
| >20 days | 11 | 8 | 72.7 | 39.0 - 94.0 | 11 | 10 | 90.9 | 58.7 - 99.8 | 11 | 10 | 90.9 | 58.7 - 99.8 |
| UCP | ||||||||||||
| 1-5 days | 28 | 7 | 25.0 | 10.7 - 44.9 | 28 | 7 | 25.0 | 10.7 - 44.9 | 28 | 7 | 25.0 | 10.7 - 44.9 |
| 6-10 days | 36 | 21 | 58.3 | 40.8 - 74.5 | 36 | 18 | 50.0 | 32.9 - 67.1 | 36 | 21 | 58.3 | 40.8 - 74.5 |
| 11-15 days | 34 | 26 | 76.5 | 58.8 - 89.3 | 34 | 25 | 73.5 | 55.6 - 87.1 | 34 | 27 | 79.4 | 62.1 - 91.3 |
| 16-20 days | 19 | 15 | 78.9 | 54.4 - 93.9 | 19 | 14 | 73.7 | 48.8 - 90.9 | 19 | 15 | 78.9 | 54.4 - 93.9 |
| >20 days | 11 | 10 | 90.9 | 58.7 - 99.8 | 11 | 9 | 81.8 | 48.2 - 97.7 | 11 | 10 | 90.9 | 58.7 - 99.8 |
| VivaChek | ||||||||||||
| 1-5 days | 25 | 7 | 28.0 | 12.1 - 49.4 | 25 | 7 | 28.0 | 12.1 - 49.4 | 25 | 7 | 28.0 | 12.1 - 49.4 |
| 6-10 days | 35 | 22 | 62.9 | 44.9 - 78.5 | 35 | 22 | 62.9 | 44.9 - 78.5 | 35 | 22 | 62.9 | 44.9 - 78.5 |
| 11-15 days | 30 | 26 | 86.7 | 69.3 - 96.2 | 30 | 25 | 83.3 | 65.3 - 94.4 | 30 | 26 | 86.7 | 69.3 - 96.2 |
| 16-20 days | 19 | 15 | 78.9 | 54.4 - 93.9 | 19 | 14 | 73.7 | 48.8 - 90.9 | 19 | 15 | 78.9 | 54.4 - 93.9 |
| >20 days | 10 | 9 | 90.0 | 55.5 - 99.7 | 10 | 9 | 90.0 | 55.5 - 99.7 | 10 | 9 | 90.0 | 55.5 - 99.7 |
| WondFo | ||||||||||||
| 1-5 days | 26 | 10 | 38.5 | 20.2 - 59.4 | ||||||||
| 6-10 days | 36 | 24 | 66.7 | 49.0 - 81.4 | ||||||||
| 11-15 days | 32 | 27 | 84.4 | 67.2 - 94.7 | ||||||||
| 16-20 days | 19 | 17 | 89.5 | 66.9 - 98.7 | ||||||||
| >20 days | 11 | 9 | 81.8 | 48.2 - 97.7 | ||||||||
|
ELISAs | ||||||||||||
| Epitope | ||||||||||||
| 1-5 days | 28 | 5 | 17.9 | 6.1 - 36.9 | 28 | 11 | 39.3 | 21.5 - 59.4 | 28 | 11 | 39.3 | 39.3 - 21.5 |
| 6-10 days | 36 | 19 | 52.8 | 35.5 - 69.6 | 36 | 28 | 77.8 | 60.8 - 89.9 | 36 | 29 | 80.6 | 80.6 - 64.0 |
| 11-15 days | 34 | 27 | 79.4 | 62.1 - 91.3 | 34 | 31 | 91.2 | 76.3 - 98.1 | 34 | 31 | 91.2 | 91.2 - 76.3 |
| 16-20 days | 19 | 14 | 73.7 | 48.8 - 90.9 | 19 | 16 | 84.2 | 60.4 - 96.6 | 19 | 17 | 89.5 | 89.5 - 66.9 |
| >20 days | 11 | 9 | 81.8 | 48.2 - 97.7 | 11 | 10 | 90.9 | 58.7 - 99.8 | 11 | 10 | 90.9 | 90.9 - 58.7 |
| In-House* | ||||||||||||
| 1-5 days | 28 | 10 | 35.7 | 18.6 - 55.9 | ||||||||
| 6-10 days | 36 | 26 | 72.2 | 54.8 - 85.8 | ||||||||
| 11-15 days | 34 | 32 | 94.1 | 80.3 - 99.3 | ||||||||
| 16-20 days | 19 | 17 | 89.5 | 66.9 - 98.7 | ||||||||
| >20 days | 11 | 9 | 81.8 | 48.2 - 97.7 | ||||||||
| Specificity in 108 blood donor plasma specimens collected before July 2018 | ||||||||||||
| IgM | IgG | IgM or IgG | ||||||||||
| Assay | Total N | positive | spec (%) | 95% CI | Total N | positive | spec (%) | 95% CI | Total N | positive | spec (%) | 95% CI |
|
Immunochromatographic Lateral Flow Assays | ||||||||||||
| Biomedomics | 107 | 13 | 87.9 | 80.1 - 93.4 | 107 | 4 | 96.3 | 90.7 - 99.0 | 107 | 14 | 86.9 | 79.0 - 92.7 |
| Bioperfectus | 104 | 3 | 97.1 | 91.8 - 99.4 | 104 | 2 | 98.1 | 93.2 - 99.8 | 104 | 5 | 95.2 | 89.1 - 98.4 |
| DecomBio | 107 | 10 | 90.7 | 83.5 - 95.4 | 107 | 9 | 91.6 | 84.6 - 96.1 | 107 | 11 | 89.7 | 82.3 - 94.8 |
| DeepBlue | 108 | 17 | 84.3 | 76.0 - 90.6 | 108 | 1 | 99.1 | 94.9 - 100.0 | 108 | 17 | 84.3 | 76.0 - 90.6 |
| Innovita | 108 | 4 | 96.3 | 90.8 - 99.0 | 108 | 0 | 100.0 | 96.6 - 100.0 | 108 | 4 | 96.3 | 90.8 - 99.0 |
| Premier | 108 | 2 | 98.1 | 93.5 - 99.8 | 108 | 1 | 99.1 | 94.9 - 100.0 | 108 | 3 | 97.2 | 92.1 - 99.4 |
| Sure | 108 | 0 | 100.0 | 96.6 - 100.0 | 108 | 0 | 100.0 | 96.6 - 100.0 | 108 | 0 | 100.0 | 96.6 - 100.0 |
| UCP | 107 | 2 | 98.1 | 93.4 - 99.8 | 107 | 2 | 98.1 | 93.4 - 99.8 | 107 | 2 | 98.1 | 93.4 - 99.8 |
| VivaChek | 99 | 5 | 94.9 | 88.6 - 98.3 | 99 | 4 | 96.0 | 90.0 - 98.9 | 99 | 5 | 94.9 | 88.6 - 98.3 |
| WondFo | 106 | 1 | 99.1 | 94.9 - 100.0 | ||||||||
|
ELISAs | ||||||||||||
| Epitope | 108 | 3 | 97.2 | 92.1 - 99.4 | 108 | 10 | 90.7 | 83.6 - 95.5 | 108 | 11 | 89.8 | 82.5 - 94.8 |
| In-House* | 108 | 1 | 99.1 | 94.9 - 100.0 | ||||||||
| Percentage of positive specimens from individuals who were positive for non-SARS-CoV-2 viral infections and/or tested negative for SARS-CoV-2 by RT-PCR | ||||||||||||
| IgM | IgG | IgM or IgG | ||||||||||
| Assay | Total N | positive | % | 95% CI | Total N | positive | % | 95% CI | Total N | positive | % | 95% CI |
|
Immunochromatographic Lateral Flow Assays | ||||||||||||
| Biomedomics | 51 | 8 | 15.7 | 7.0 - 28.6 | 51 | 4 | 7.8 | 2.2 - 18.9 | 51 | 11 | 21.6 | 11.3 - 35.3 |
| Bioperfectus | 45 | 5 | 11.1 | 3.7 - 24.1 | 45 | 6 | 13.3 | 5.1 - 26.8 | 45 | 8 | 17.8 | 8.0 - 32.1 |
| DecomBio | 51 | 5 | 9.8 | 3.3 - 21.4 | 51 | 2 | 3.9 | 0.5 - 13.5 | 51 | 6 | 11.8 | 4.4 - 23.9 |
| DeepBlue | 51 | 14 | 27.5 | 15.9 - 41.7 | 51 | 7 | 13.7 | 5.7 - 26.3 | 51 | 14 | 27.5 | 15.9 - 41.7 |
| Innovita | 28 | 2 | 7.1 | 0.9 - 23.5 | 28 | 2 | 7.1 | 0.9 - 23.5 | 28 | 3 | 10.7 | 2.3 - 28.2 |
| Premier | 51 | 0 | 0.0 | 0.0 - 7.0 | 51 | 1 | 2.0 | 0.0 - 10.4 | 51 | 2 | 3.9 | 0.5 - 13.5 |
| Sure | 51 | 0 | 0.0 | 0.0 - 7.0 | 51 | 0 | 0.0 | 0.0 - 7.0 | 51 | 0 | 0.0 | 0.0 - 7.0 |
| UCP | 51 | 3 | 5.9 | 1.2 - 16.2 | 51 | 2 | 3.9 | 0.5 - 13.5 | 51 | 3 | 5.9 | 1.2 - 16.2 |
| VivaChek | 48 | 4 | 8.3 | 2.3 - 20.0 | 48 | 1 | 2.1 | 0.1 - 11.1 | 48 | 4 | 8.3 | 2.3 - 20.0 |
| WondFo | 41 | 0 | 0.0 | 0.0 - 8.6 | ||||||||
|
ELISAs | ||||||||||||
| Epitope | 51 | 2 | 3.9 | 0.5 - 13.5 | 51 | 7 | 13.7 | 5.7 - 26.3 | 51 | 8 | 15.7 | 7.0 - 28.6 |
| In-House* | 51 | 7 | 13.7 | 5.7 - 26.3 | ||||||||
In-house ELISA secondary antibody is directed against human IgG F(ab’)2. Some cross-reactivity with IgM and IgA isotypes cannot be excluded.
Figure 1:
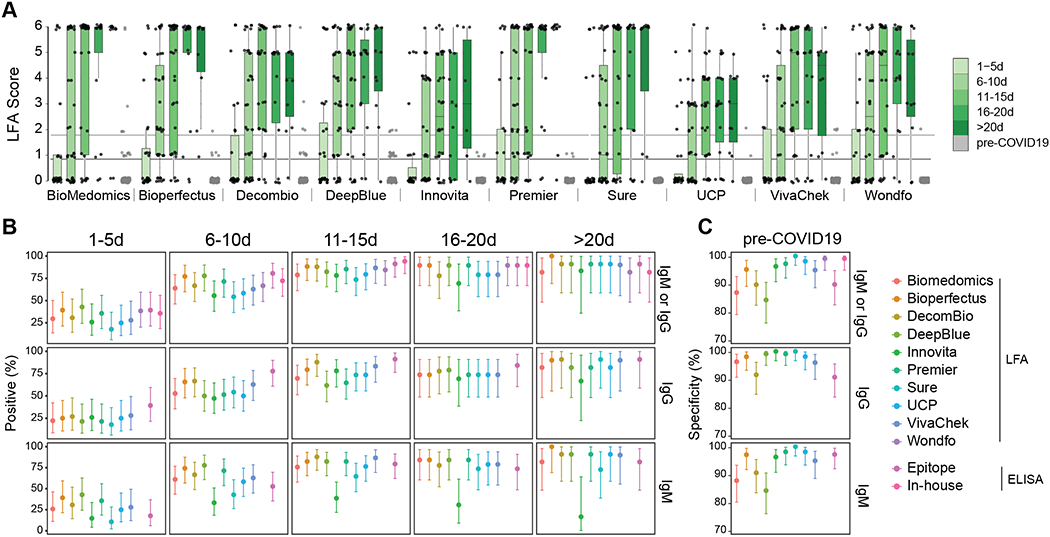
Performance data for immunochromatographic lateral flow assays (LFAs). (a) The second reader’s score (0–6 based on band intensity) is reported for each assay, binned by time after patient-reported symptom onset. Biologically independent samples for each test are as follows, n=126, Biomedomics; n=126, Bioperfectus; n=124, Decombio; n=128, DeepBlue; n=114, Innovita; n=127, Premier; n=127, Sure; n=128, UCP; n=119, VivaChek; n=124, Wondfo. Second reader’s score for Pre-COVID-19 samples is also displayed (n=107, Biomedomics; n=104, Bioperfectus; n=107, Decombio; n=108, DeepBlue; n=108, Innovita; n=108, Premier; n=108, Sure; n=107, UCP; n=99, VivaChek; n=106, Wondfo). For tests with separate IgG and IgM bands, the higher score is reported. Joint IgM/IgG signal is represented by a single band in Wondfo. The lower, dark grey line refers to the positivity threshold (Score greater than or equal to 1) used in this study. The upper, light grey line refers to an alternative positivity threshold (Score greater than or equal to 2) discussed in the text and Figure 3. Box spans 25th to 75th percentile with median indicated by black bar; whiskers show maximum and minimum value within 1.5 x the interquartile range from the box. (b) Percent of SARS-CoV-2 RT-PCR-positive samples testing positive by each LFA and ELISA are plotted relative to time after patient-reported symptom onset (n=126, Biomedomics; n=126, Bioperfectus; n=124, Decombio; n=128, DeepBlue; n=114, Innovita; n=127, Premier; n=127, Sure; n=128, UCP; n=119, VivaChek; n=124, Wondfo; n=128, Epitope; n=128, In-house). The ‘IgM or IgG’ category refers to positivity of either isotype. (c) Specificity is plotted for each test using pre-COVID-19 negative control samples (n=107, Biomedomics; n=104, Bioperfectus; n=107, Decombio; n=108, DeepBlue; n=108, Innovita; n=108, Premier; n=108, Sure; n=107, UCP; n=99, VivaChek; n=106, Wondfo; n=108, Epitope; n=108, In-house). For (b,c) all nodes refer to the calculated percent positivity or specificity, respectively. Error bars signify 95% confidence intervals.
Figure 2.
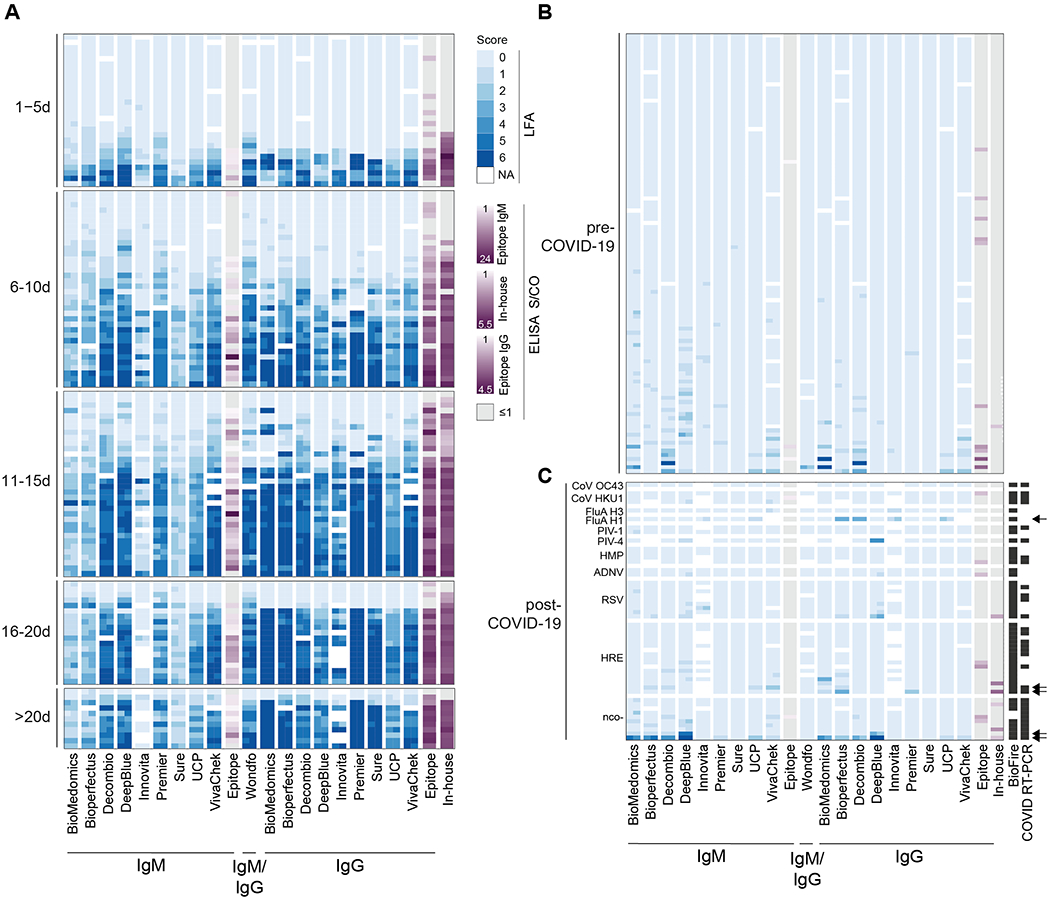
LFA and ELISA values by serological assay. (a) LFA scores for each of two readers (blue) and mean ELISA S/CO (purple) for each specimen are grouped by binned time after patient-reported symptom onset and plotted by assay. White cells indicate samples not run with the corresponding assay. For ELISAs, grey indicates S/CO less than or equal to 1. The same legend applies to Panels B and C. The F(ab’)2 specific secondary antibody used in our in-house ELISA preferentially binds the IgG light chain but has some reactivity for other isotypes (IgM, IgA). (b) LFA score and ELISA S/CO values are plotted for pre-COVID-19 historical control serum samples to determine assay specificity.(c) LFA score and ELISA S/CO values are plotted for serum samples obtained from 51 individuals after the emergence of COVID-19 (post-COVID-19), some of which received Biofire FilmArray (BioFire Diagnostics, Salt Lake City, UT) and/or SARS-CoV-2 RT-PCR testing (all negative) as indicated (black cells) in the appropriate columns. Arrows highlight specimens from five individuals with moderate to strong band intensity further discussed in the text. Specimens are grouped by positive testing for Coronavirus HKU1 (CoV HKU1), Coronavirus OC43 (CoV OC43), Influenza A Virus A/H3 (FluA H3), Influenza A Virus A/H1 2009 (FluA H1), Parainfluenza Type 1 Virus (PIV-1), Parainfluenza Type 4 Virus (PIV-4), Human Metapneumovirus (HMP), Adenovirus (ADNV), Respiratory Syncytial Virus (RSV), Human Rhinovirus/Enterovirus (HRE), or negative testing for SARS-CoV-2 and other viruses (nco-).
We observed a trend towards higher percent positivity by LFA for patients admitted to the ICU compared with those having milder disease, but the specimen numbers per time interval were low, limiting statistical power (Supplementary Fig. 3).
Test specificity in 108 pre-COVID-19 blood donor plasma samples ranged from 84.3–100.0%, with 39 samples demonstrating false positive results by at least one LFA (Table 2 and Fig. 2b). Of the false positive results, 61.5% (24/39) had a weak intensity score of 1. Intensity scores of 2–3 were seen in 30.8% (12/39) and scores of 4–6 were seen in 7.7% (3/39).
We evaluated the tradeoff between percent positivity in samples from RT-PCR positive individual and specificity as a function of LFA reader score. RT-PCR measures the presence of viral nucleotides. Individuals with RT-PCR proven SARS-CoV-2 infection are expected to seroconvert and develop anti-SARS-CoV-2 antibodies, although frequency and kinetics of seroconversion can vary.5,6,19–22 We therefore assessed percent positivity at various time intervals after onset of symptoms. Changing the positive LFA threshold from 1 to 2 decreased the mean overall percent positivity across tests from 67.2% (range 57.9–75.4%) to 57.8% (range 44.7–65.6%) and increased the average specificity from 94.2% (range 84.3–100.0%) to 98.1% (range 94.4–100.0%) (Fig. 3).
Figure 3.
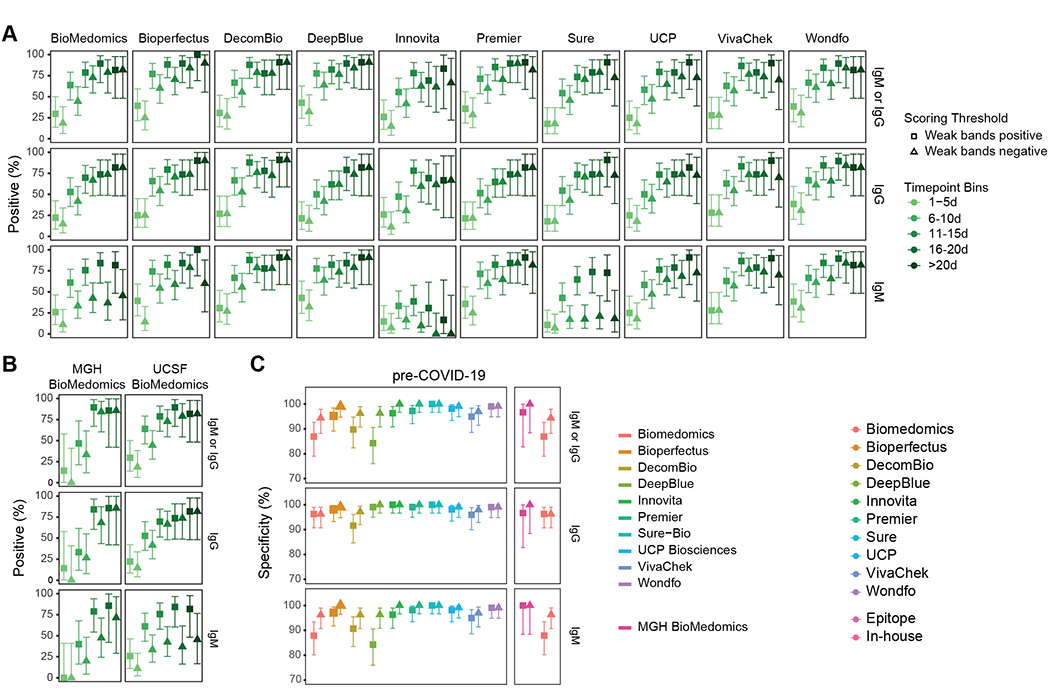
Comparison of the effect of different positivity thresholds on percent positivity and specificity. (a) The percent positivity of each assay tested on serum from SARS-CoV-2 RT-PCR-positive patients is plotted by time after patient-reported symptom onset. Biologically independent samples for each test are as follow, n=126, Biomedomics; n=126, Bioperfectus; n=124, Decombio; n=128, DeepBlue; n=114, Innovita; n=127, Premier; n=127, Sure; n=128, UCP; n=119, VivaChek; n=124, Wondfo. Squares indicate percent positivity using Reader Score > 0 (‘Weak bands positive’) as the positivity threshold. Triangles indicate percent positivity using Reader Score > 1 (‘Weak bands negative’) as the positivity threshold. ‘IgM or IgG’ signifies detection of either isotype. Wondfo reports a single band for IgM and IgG together, and the results are plotted here as both ‘IgM’ and ‘IgG’ for horizontal comparison across assays. (b) Comparison of percent positivity at each timepoint for BioMedomics assay at either the MGH (left, n=48) or UCSF (right, n=126) study site using low (square) or high (triangle) positivity thresholds. Note that a weak score at MGH is not directly equivalent to a 1 at UCSF due to difference in reader training. (c) The specificity of all assays on historical pre-COVID-19 serum using low (square) or high (triangle) positivity thresholds. UCSF BioMedomics data is plotted again in the right subpanel column for direct comparison to MGH BioMedomics data. All nodes refer to the calculated percent positivity or specificity (as designated) and all error bars indicate 95% confidence intervals.
An independent study at Massachusetts General Hospital (MGH) compared three LFAs, of which BioMedomics was also assessed in the current study (Supplementary Table 3). Although study design and methods differed between sites, precluding direct comparison of results (see Study Design under Online Methods), test validation efforts at another site provided additional useful data. Overall, both studies showed a trend for increased detection of SARS-CoV-2 specific antibodies with increased time from symptom onset. However, the MGH study displayed increased specificity with lower percent positivity at early timepoints after symptom onset. MGH positivity thresholds were set higher to prioritize test specificity (Fig. 3b,c).
A set of specimens collected during the COVID-19 outbreak that had negative SARS-CoV-2 RT-PCR testing and/or alternative respiratory pathogen testing demonstrated higher numbers of positive results compared with the pre-COVID-19 sample set (Fig. 2c). Five specimens had positives results by >3 tests, all with respiratory symptoms and concurrent negative or unperformed SARS-CoV-2 RT-PCR testing (Fig. 2c, arrows). One patient was positive on 8 different tests, including the in-house ELISA. In this limited panel, no consistent pattern of cross-reactivity was identified with non-SARS-CoV-2 respiratory viruses, including 2 strains of seasonal coronavirus (1 coronavirus OC43, 3 coronavirus HKU1).
Agreement among results of LFAs with those of IgG and IgM Epitope ELISAs ranged from 75.7—85.6%, whereas agreement with the in-house ELISA ranged from 83.5—94.8% (Fig. 4a). LFA band intensity scores showed a direct correlation with ELISA S/CO values (Fig. 4b).
Figure 4:
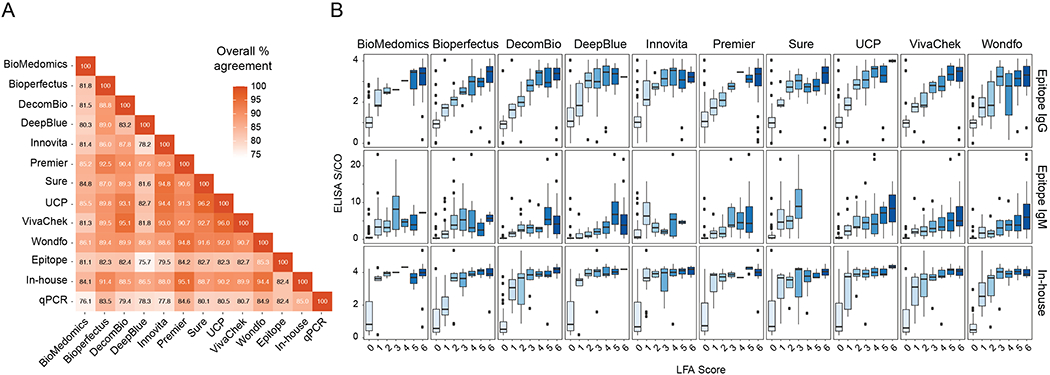
Agreement of serological assays for SARS-CoV-2. (a) Percent agreement is plotted across all assay combinations, and values signify the binomial regression of the two assays across all tests. Samples were labeled ‘positive’ if any antibody isotype was detected for each assay. (b) IgM or IgG LFA scores for each assay are compared with S/CO from three different ELISAs for all SARS-CoV-2 RT-PCR-positive samples. Biologically independent samples for each test are as follow, n=126, Biomedomics; n=126, Bioperfectus; n=124, Decombio; n=128, DeepBlue; n=114, Innovita; n=127, Premier; n=127, Sure; n=128, UCP; n=119, VivaChek; n=124, Wondfo. Joint IgM/IgG signal is represented by a single band in Wondfo, so data were plotted as IgM or IgG depending on ELISA comparison. The F(ab’)2 specific secondary antibody used in our in-house ELISA preferentially binds the IgG light chain but contains some reactivity for other isotypes (IgM, IgA). For (b), the box spans 25th to 75th percentile with median indicated by black bar; whiskers show maximum and minimum value within 1.5 x the interquartile range from the box.
DISCUSSION
This study describes test performance for 12 COVID-19 serology assays on a panel of 128 samples from 79 individuals with RT-PCR-confirmed SARS-CoV-2 infection and 108 pre-COVID-19 specimens. In April 2020, when we performed this analysis, there was no assay with sufficient performance data for use as a proven reference standard, only three serological assays had FDA EUA,23 and anti-SARS-CoV-2 IgM and IgG kinetics were poorly understood. We therefore chose a specimen set covering the first several weeks after illness onset in patients with SARS-CoV-2 proven by RT-PCR to avoid the potential bias of assuming superiority of one assay over the others. To date, no single assay or combination of assays has been accepted as a gold standard comparator for antibody testing. Additionally, we surveyed 51 specimens from individuals who were tested for other respiratory viral pathogens and/or had negative molecular testing for SARS-CoV-2 to evaluate potential cross-reactivity or infections detected only by serology. Our data are also available on a dedicated website (https://covidtestingproject.org). We hope these data will inform the use of serology by the medical and public health communities and provide feedback to test developers about areas of success and necessary improvement.
We focused on comparisons of percent positivity by time interval, rather than reporting the ‘sensitivity’ of each assay, both because of the lack of a gold standard to test against and our expectation that percent positivity would rise with increasing time after symptom onset.5,6,19,20,22,24–26 Percent positivity above 80% was not reached until at least 2 weeks into clinical illness; diagnosis early in the course of illness remains dependent on viral detection methods. Our data are consistent with growing evidence that IgM and IgG tend to rise around the same time in COVID-19.5,19 The assays showed a trend to higher positive rates within time intervals for more severe disease, but this finding should be interpreted with caution, due to the limited data from ambulatory cases. The majority of samples >20 days post-symptom onset had detectable anti-SARS-CoV-2 antibodies, suggesting good-to-excellent sensitivity for all evaluated tests in hospitalized patients three or more weeks into their disease course. Additional studies assessing frozen versus fresh specimens and matrix effects between serum versus plasma will be useful in understanding potential limitations of our current test performance evaluations. Looking forward, well-powered studies testing ambulatory or asymptomatic individuals, including LFA performance with fresh capillary blood, will be essential to guide appropriate use of serology.
Our data demonstrate specificity >95% for the majority of tests evaluated and >99% for 2 LFAs (Wondfo, Sure Biotech) and the in-house ELISA (adapted from Amanat et al., 2020).27 We observed moderate-to-strong positive bands in several pre-COVID-19 blood donor specimens, some of them positive by multiple assays, suggesting the possibility of non-specific binding of plasma proteins, non-specific antibodies (potentially including autoantibodies), or cross-reactivity with antibodies against other viruses. Three of the pre-COVID-19 specimens (2.8%) were scored positive by more than three assays. Intriguingly, the fraction of positive tests was higher in a set of recent specimens obtained during the COVID-19 outbreak from individuals undergoing respiratory infection workup, many with negative SARS-CoV-2 RT-PCR. Five of these (9.8%) had positive results by more than three assays, without relation to a specific viral pathogen, suggesting non-specific reactivity and/or missed COVID-19 diagnosis. Recent reports demonstrate that RT-PCR from nasopharyngeal swabs may yield false negative results in over 20% of cases5,28 and co-infection with other respiratory pathogens may be significantly higher than previously anticipated.29 One specimen was positive by 8 of 12 assays, including the in-house ELISA. The patient was >90 years old and presented with altered mental status, fever, and ground glass opacities on chest radiological imaging. SARS-CoV-2 RT-PCR was negative and ancillary laboratory testing suggested a urinary tract infection. This case could represent COVID-19 not detected by RT-PCR, reinforcing the importance of caution in interpreting negative molecular results as ruling out the infection. Appropriate algorithms for serology testing, including confirmatory or reflexive testing, have yet to be determined. These algorithms will be affected by test performance characteristics and prevalence of disease, as well as pretest probability of infection.
Importantly, we still do not know the extent to which positive results by serology reflect a protective immune response nor how long such protection might last.30 Neutralization assays measure the ability of blood-derived samples to prevent viral (most commonly pseudovirus) infection of cultured cells in vitro.31,32 Although these assays provide information on the functional capabilities of an individual’s antibodies, their correlation with total IgG antibodies to serological test antigens (primarily spike and nucleocapsid proteins) is not well established. Additionally, most antibody neutralization assays are research laboratory-based with limited test performance data and inter-lab standardization measures. Antibody neutralization assays should be harmonized across laboratories to establish the extent to which conventional serology assays correlate with neutralization. Further studies are needed to assess the relationships among positive serological testing, in vitro viral neutralization results, and clinical protection from future SARS-CoV2 infection and transmission. Epidemiological data and results from convalescent plasma treatment trials should help guide clinical and public health policies for use of serological testing.
High specificity testing is crucial in low-prevalence settings. One approach to increase specificity would employ confirmatory testing with an independent assay (perhaps recognizing a distinct epitope or antigen). Our comparison of UCSF and MGH data suggests that reclassifying faint bands as ‘negative’ or ‘inconclusive’ can change test performance characteristics by increasing specificity, albeit at the expense of sensitivity. However, the subjectivity of calling faint bands by individual readers may be difficult to standardize without specific control materials, operator training, and/or objective methods of analyzing LFAs. In the clinical setting, these parameters and protocols should be independently assessed and validated by clinical laboratories for operation under the Clinical Laboratory Improvement Amendments (CLIA).33
Objective methods to standardize LFA reading, such as digital image analysis, are potentially attractive. Image analysis tools can be benchtop or mobile (e.g., smartphone applications). However, introduction of a separate device for reading LFAs will require specific validation. Variables, including lighting, camera quality, image compression, and quantification algorithms must all be assessed rigorously to ensure accuracy and precision.
A consensus has emerged that serological testing provides an essential tool in the pandemic response, but inadequate data on test performance characteristics in some early surveys and important gaps in immunological knowledge have impeded agreement on appropriate implementation strategies.34,35 Our study highlights the need for rigorous assay validation using standardized sample sets with: 1) known positives from individuals with a range of clinical presentations at multiple time points after onset of symptoms; 2) pre-COVID-19 outbreak samples for specificity; and 3) samples from individuals with other viral and inflammatory illnesses as cross-reactivity controls. Coordinated efforts to ensure widespread availability of validated sample sets would facilitate data-driven decisions on the use of serology. The updated guidance released by the FDA in early May 202036 and the initiative recently launched by US Food and Drug Administration and US National Cancer Institute/National Institutes of Health37 to systematize data generation for EUAs are substantive steps toward this goal, and will help build the essential evidence base to guide serological testing during the COVID-19 pandemic.
ONLINE METHODS
Ethical approvals:
This study was approved by institutional review boards at the University of California, San Francisco (UCSF)/Zuckerberg San Francisco General Hospital (ZSFG) and Massachusetts General Hospital (MGH).
Study Design:
The study population included individuals with symptomatic infection and positive SARS-CoV-2 RT-PCR testing of nasopharyngeal or oropharyngeal swabs, who had remnant serum and plasma specimens in clinical laboratories serving the UCSF and ZSFG Medical Center networks. All samples were obtained from venous blood draws, with serum being collected in either uncoated or serum separator tubes and plasma from lithium heparin tubes depending on other ancillary testing orders. All samples were drawn in an outpatient or hospital setting, professionally couriered to the clinical laboratory, and acquisitioned for routine testing within the clinical laboratory within the same day. Samples were stored at 4°C and aliquoted for freezing at −20°C within one week of the initial blood draw. Serum and plasma were used interchangeably. All but one assay (Epitope ELISA) noted either specimen type could be used. We included multiple specimens per individual, but no more than one sample per time interval (1–5, 6–10, 11–15, 16–20, and >20 days after symptom onset). If an individual had more than one specimen for a given time interval, only the later specimen was included. For specificity, we included 108 pre-COVID-19 plasma specimens from eligible blood donors collected prior to July 2018.1 We assessed detection of SARS-CoV-2 antibodies in 51 specimens from 2020: 49 with test results for detection of other respiratory viruses (Biofire FilmArray; BioFire Diagnostics, Salt Lake City, UT), and 31 with negative results by SARS-CoV-2 RT-PCR. For these specimens, the median days from symptom onset was 4 with a range of 0–107 days; the latter end of the range due to unresolving respiratory viral infection in the setting of HIV infection.
We based minimum sample size calculations on expected binomial exact 95% confidence limits. A total of 287 samples were included in the final analysis, including 128 from 79 SARS-CoV-2 RT-PCR-positive individuals. Some specimens were exhausted during the analysis and were not included in all tests. Data obtained from serial specimens that did not conform to our study design were excluded.
Clinical data were extracted from electronic health records and entered in a HIPAA-secure REDCap database hosted by UCSF. Data included demographic information, major co-morbidities, patient-reported symptom onset date, symptoms and indicators of severity.
Independent data from testing efforts at MGH, with slight deviations in methods, are included as Supplementary Data (Supplementary Figure 3). Briefly, 48 heat-inactivated serum/plasma samples from 44 SARS-CoV-2 RT-PCR-positive individuals were included. For specificity, the MGH study included 60 heat-inactivated, pre-COVID-19 samples from 30 asymptomatic adults and 30 individuals admitted with febrile and/or respiratory illness with a confirmed pathogen.
Sample Preparation:
Samples from UCSF and ZSFG were assigned a random well position in one of four 96-well plates. Samples were thawed at 37°C, and up to 200uL was transferred to the assigned well without heat inactivation. Samples were then sub-aliquoted (12.5μL) to replica plates for testing. Replica plates were stored at −20°C until needed, then thawed for ten minutes at room temperature and briefly centrifuged before testing. All sample handling followed UCSF biosafety committee-approved practices.
For the MGH study, samples were heat-inactivated at 56°C for 60 minutes, aliquoted, and stored at 4°C and −20°C. Samples stored at 4°C were used within 7 days. Frozen aliquots were stored until needed with only a single freeze-thaw cycle for any sample. All samples were brought to room temperature and briefly centrifuged before adding the recommended volume to the LFA cartridge.
Immunochromatographic LFAs:
Ten lateral flow assays were evaluated (Supplementary Table 1). At the time of testing, cartridges were labeled by randomized sample location (plate, well). The appropriate sample volume was transferred from the plate to the indicated sample port, followed by provided diluent, following manufacturer instructions. The lateral flow cartridges were incubated for the recommended time at room temperature before readings. Each cartridge was assigned an integer score (0 for negative, 1 to 6 for positive) for test line intensity by two independent readers blinded to specimen status and to each other’s scores (Supplementary Figure 1). Readers were trained to score intensity from images representative of each value from a prior LFA test performance evaluation.1 Test line scoring was performed for research purposes to capture semi-quantitative data about the LFA readout and reproducibility of subjective interpretation considering these are the major analytical factors that affect test performance. These tests are prescribed to be interpreted qualitatively and test performance characteristics in this report are derived from qualitative scoring of any interpreted band color. For some cartridges (DeepBlue, UCP, Bioperfectus), the positive control indicator failed to appear after addition of diluent in a significant fraction of tests. For these tests, two further drops of diluent were added to successfully recover control indicators in all affected tests. These results were included in analyses. During testing, two plates were transposed 180° and assays were run in the opposite order from the wells documented on cartridges. These data were corrected and accuracy was confirmed by empty well position and verification of a subset of results.
Enzyme-Linked Immunosorbent Assays (ELISAs):
Epitope Diagnostics assays were carried out according to manufacturer’s instructions with minor deviations, including the mixed use of plasma and serum specimens (instead of serum only), use of frozen specimens (versus same day), blanking all specimens and controls instead of using raw OD450 values, and performing samples in singlicate for 3 out of 4 96-well plates (instead of duplicate). Plate 4 was run in duplicate due to availability of samples and assay wells. For IgM detection, 100uL of control samples or 10ul of patient serum and 100ul of sample diluent were added to indicated wells. Plates were incubated for thirty minutes at 37°C and manually washed 5x in provided Wash Buffer. Each well received 100uL of HRP-labeled COVID-19 antigen, was incubated for thirty minutes at 37°C, and was manually washed 5x in provided Wash Buffer. Each well then received 100uL of colorimetric substrate, was incubated for twenty minutes, and then received 100uL of Stop Solution. The OD450 was measured using a Synergy H1 Microplate Reader (BioTek Instruments) within ten minutes of adding Stop Solution. Positive cutoff for IgM detection were calculated as described in the Epitope Diagnostics protocol: IgM Positive cutoff = 1.1 * ((average of negative control readings) + 0.10). Values less than or equal to the Positive cutoff were interpreted as negative. For IgG detection, 1uL of serum was diluted 1:100 in Sample Diluent and loaded into designated wells. Plates were incubated for thirty minutes at room temperature and manually washed 5x in provided Wash Buffer. Each well received 100uL of provided HRP-labeled COVID-19 Tracer Antibody, plates were incubated for thirty minutes at room temperature, and manually washed 5x in provided Wash Buffer. Then, each well received 100uL of Substrate, was incubated for twenty minutes, and then received 100uL of Stop Solution. The absorbance at OD450 was measured using a Synergy H1 Microplate Reader (BioTek Instruments) within ten minutes of adding Stop Solution. Positive cutoffs for IgG detection were calculated as described in the Epitope Diagnostics protocol: IgG Positive cutoff = 1.1 * ((average of negative control readings) + 0.18). Values less than or equal to the positive cutoff were interpreted as negative.
An in-house RBD-based ELISA was performed with minor deviations from a published protocol (Amanat et al. 2020, Krammer Lab, MSSM, New York, NY, USA). SARS-CoV-2 Receptor Binding Domain (RBD) protein was produced using the published construct (NR-52306, BEI Resources) by Aashish Manglik (UCSF). 96-well plates (3855, Thermo Scientific) were coated with 2ug/ml RBD protein and stored at 4°C for up to five days before use. Specimen aliquots (12uL) were diluted 1:5 in 1X PBS (10010-023, Gibco), mixed, and heat inactivated at 56°C for one hour. RBD-treated plates were washed 3x with PBS-Tween (PBST, BP337-500, Fisher Bioreagents) using a 405 TS Microplate Washer (BioTek Instruments) and blocked with PBST-Milk (3% w/v, AB10109-01000, AmericanBio) for one hour at 20°C. Samples were further diluted 1:10 (1:50 final) in PBST-Milk (1% w/v) and 100uL was transferred to the blocked ELISA plates in duplicate plates. Samples were incubated for two hours at 20°C and washed 3x with PBST. The peroxidase AffiniPure Goat Anti-human IgG (F(ab’)2 specific) secondary antibody (109-035-097, Lot 146576, Jackson ImmunoResearch) used in this study binds the IgG light chain and has some reactivity for other isotypes (IgM, IgA). This secondary antibody was diluted 1:750 in PBST-Milk (1% w/v), 50ul was added to each sample well, and samples were incubated for one hour at 20°C. Plates were subsequently washed 3x with PBST. We dispensed 100uL of 1x SigmaFast OPD Solution (P9187, Sigma-Aldrich) to each sample well and incubated plates for ten minutes at room temperature. We added 50ul of 3M HCl (A144-212, Fisher Chemical) to stop the reaction and immediately read the optical density at 490nm (OD490) using a Synergy H1 Microplate Reader (BioTek Instruments). OD490 values were corrected for each plate by subtracting the mean value of each plate’s blank wells. To determine a cutoff for positive values, we calculated the mean value of negative wells for each plate, plus three standard deviations.
Data Analysis:
For LFA testing, the second reader’s scores were used for performance calculations, and the first reader’s score was used to calculate inter-reader agreement statistics. Percent seropositivity among RT-PCR-confirmed cases was calculated by time interval from symptom onset. Specificity was based on results in pre-COVID-2019 samples. Binomial exact 95% confidence intervals were calculated for all estimates. Analyses were conducted in R (3.6.3) and SAS (9.4).
Data Accessibility Statement
The source data for figures are provided as a supplementary file or can be viewed at https://covidtestingproject.org.
Supplementary Material
Acknowledgements
We thank all members of the Marson lab and the Hsu lab, Peter Kim, Scott Boyd, Joe DeRisi, Steve Quake, Bryan Greenhouse, Christina Tato, Jennifer Doudna, Fyodor Urnov, David Friedberg, David Neeleman, John Hering, Cindy Cheng, Neal Khosla, Matt Krisiloff, Lachy Groom, Chenling Xu, Dave Fontenot, Jim Karkanias, Gajus Worthington, Bill Burkholder, Charlie Craik, XPrize Pandemic Alliance, Warris Bokhari, Zem Joaquin, Siavash Sarlati, Scott Nesbit, William Poe, Sam Broder, Verily, Charlie Kim, Aleksandra Kijac, Marc Solit and the Coronavirus Standards Working Group, Diane Havlir, Joanne Engel, Peter Farley, Jeff MacGregor, Kimberly Hou, Bob Sanders, Sarah Yang, and Sean Parker. We thank Yagahira Elizabeth Castro-Sesquen for sharing her semi-quantitative LFA scale, which was adapted for use in our current study. The work was supported by gifts from Anthem Blue Cross Blue Shield, the Chan Zuckerberg Biohub, and anonymous philanthropy. We thank the following sources for donation of test kits: the manufacturers of Bioperfectus, Decombio, Sure-Bio, UCP Biosciences; David Friedberg; John Hering; Henry Schein (Melville, NY). The Wilson Lab has received support from the Rachleff Family Foundation. The Hsu lab has received support from S. Altman, V. and N. Khosla, D. and S. Deb, the Curci Foundation, and Emergent Ventures. P.D.H. holds a Deb Faculty Fellowship from the UC Berkeley College of Engineering and is the recipient of the Rainwater Foundation Prize for Innovative Early-Career Scientist. The Marson lab has received gifts from J. Aronov, G. Hoskin, K. Jordan, B. Bakar, the Caufield family and funds from the Innovative Genomics Institute (IGI), the Northern California JDRF Center of Excellence and the Parker Institute for Cancer Immunotherapy (PICI). We thank the National Institutes of Health for their support (J.D.W. R38HL143581; A.E.G. F30AI150061; D.N.N. L40 AI140341; S.P.B. NHLBI R38HL143581; G.M.G., NHLBI R38HL143581; T.A.M. 1F30HD093116; D.W. 1F31NS106868-01; J.G.C. R01 AI40098; E.T.R., R.C.C. CDC U01CK000490; MSTP students supported by T32GM007618). R.Y. was supported by an AP Giannini Postdoctoral Fellowship. J.A.S. was supported by the Larry L. Hillblom Foundation (2019-D-006-FEL). A.M. holds a Career Award for Medical Scientists from the Burroughs Wellcome Fund, is an investigator at the Chan–Zuckerberg Biohub and is a recipient of The Cancer Research Institute (CRI) Lloyd J. Old STAR grant.
Competing Interests
This work was supported by gifts from Anthem Blue Cross Blue Shield, the Chan Zuckerberg Biohub, and anonymous philanthropy. C.Y.C. is the director of the UCSF-Abbott Viral Diagnostics and Discovery Center, receives research support funding from Abbott Laboratories and is on the Scientific Advisory Board of Mammoth Biosciences, Inc. C. J. Y. is cofounder of DropPrint Genomics and serves as an advisor to them. M.S.A. holds stock in Medtronic and Merck. P.D.H. is a cofounder of Spotlight Therapeutics and serves on the board of directors and scientific advisory board, and is an advisor to Serotiny. P.D.H. holds stock in Spotlight Therapeutics and Editas Medicine. A.M. is a cofounder of Spotlight Therapeutics and Arsenal Biosciences and serves on their boards of directors and scientific advisory boards. A.M. has served as an advisor to Juno Therapeutics, was a member of the scientific advisory board at PACT Pharma, and was an advisor to Trizell. A.M. owns stock in Arsenal Biosciences, Spotlight Therapeutics and PACT Pharma. R.Y. owns stock in AbbVie, Bluebird Bio, Bristol Myers Squibb, Cara Therapeutics, Editas Medicine, Esperion, and Gilead Sciences. Unrelated to this current work, the Marson lab has received sponsored research support from Juno Therapeutics, Epinomics, Sanofi, GlaxoSmith Kline, and a gift from Gilead.
REFERENCES
- 1.Johns Hopkins University. COVID-19 Dashboard by the Center for Systems Science and Engineering (CSSE) at Johns Hopkins University (JHU), <https://gisanddata.maps.arcgis.com/apps/opsdashboard/index.html#/bda7594740fd40299423467b48e9ecf6> (2020).
- 2.Infectious Diseases Society of America. IDSA Statement on COVID-19 Testing, <https://www.idsociety.org/globalassets/idsa/public-health/covid-19-idsa-testing-intro.pdf> (2020).
- 3.Weitz JS et al. Modeling shield immunity to reduce COVID-19 epidemic spread. Nat Med, doi: 10.1038/s41591-020-0895-3 (2020). [DOI] [PMC free article] [PubMed] [Google Scholar]
- 4.World Health Organization. Laboratory testing for coronavirus disease 2019 (COVID-19) in suspected human cases: interim guidance, 2 March 2020. (World Health Organization, Geneva, 2020). [Google Scholar]
- 5.Zhao J et al. Antibody responses to SARS-CoV-2 in patients of novel coronavirus disease 2019. Clin Infect Dis, doi: 10.1093/cid/ciaa344 (2020). [DOI] [PMC free article] [PubMed] [Google Scholar]
- 6.Wolfel R et al. Virological assessment of hospitalized patients with COVID-2019. Nature, doi: 10.1038/s41586-020-2196-x (2020). [DOI] [PubMed] [Google Scholar]
- 7.He X et al. Temporal dynamics in viral shedding and transmissibility of COVID-19. Nat Med, doi: 10.1038/s41591-020-0869-5 (2020). [DOI] [PubMed] [Google Scholar]
- 8.Li R et al. Substantial undocumented infection facilitates the rapid dissemination of novel coronavirus (SARS-CoV2). Science, doi: 10.1126/science.abb3221 (2020). [DOI] [PMC free article] [PubMed] [Google Scholar]
- 9.Bai Y et al. Presumed Asymptomatic Carrier Transmission of COVID-19. JAMA, doi: 10.1001/jama.2020.2565 (2020). [DOI] [PMC free article] [PubMed] [Google Scholar]
- 10.Du Z et al. Serial Interval of COVID-19 among Publicly Reported Confirmed Cases. Emerg Infect Dis 26, doi: 10.3201/eid2606.200357 (2020). [DOI] [PMC free article] [PubMed] [Google Scholar]
- 11.Kimball A et al. Asymptomatic and Presymptomatic SARS-CoV-2 Infections in Residents of a Long-Term Care Skilled Nursing Facility - King County, Washington, March 2020. MMWR Morb Mortal Wkly Rep 69, 377–381, doi: 10.15585/mmwr.mm6913e1 (2020). [DOI] [PMC free article] [PubMed] [Google Scholar]
- 12.Mizumoto K, Kagaya K, Zarebski A & Chowell G Estimating the asymptomatic proportion of coronavirus disease 2019 (COVID-19) cases on board the Diamond Princess cruise ship, Yokohama, Japan, 2020. Euro Surveill 25, doi: 10.2807/1560-7917.ES.2020.25.10.2000180 (2020). [DOI] [PMC free article] [PubMed] [Google Scholar]
- 13.Qiu H et al. Clinical and epidemiological features of 36 children with coronavirus disease 2019 (COVID-19) in Zhejiang, China: an observational cohort study. Lancet Infect Dis, doi: 10.1016/S1473-3099(20)30198-5 (2020). [DOI] [PMC free article] [PubMed] [Google Scholar]
- 14.Tong ZD et al. Potential Presymptomatic Transmission of SARS-CoV-2, Zhejiang Province, China, 2020. Emerg Infect Dis 26, 1052–1054, doi: 10.3201/eid2605.200198 (2020). [DOI] [PMC free article] [PubMed] [Google Scholar]
- 15.Secretary of Health and Human Services. DETERMINATION OF A PUBLIC HEAL TH EMERGENCY AND DECLARATION THAT CIRCUMSTANCES EXIST JUSTIFYING AUTHORIZATIONS PURSUANT TO SECTION 564(b) OF THE FEDERAL FOOD, DRUG, AND COSMETIC ACT, 21 U.S.C. § 360bbb-3 <https://www.fda.gov/media/135010/download> (2020).
- 16.Food and Drug Administration. Policy for Diagnostic Testsfor Coronavirus Disease-2019 during the Public Health Emergency, <https://www.fda.gov/media/135659/download> (2020).
- 17.San Francisco Department of Public Health. San Francisco Department of Public Health Annual Report 2017-2018, <https://www.sfdph.org/dph/files/reports/PolicyProcOfc/DPHAnnualReportFY17-18.pdf> (2018).
- 18.DataSF. San Francisco COVID-19 Data Tracker, <https://data.sfgov.org/stories/s/San-Francisco-COVID-19-Data-Tracker/fjki-2fab/> (2020).
- 19.Long QX et al. Antibody responses to SARS-CoV-2 in patients with COVID-19. Nat Med, doi: 10.1038/s41591-020-0897-1 (2020). [DOI] [PubMed] [Google Scholar]
- 20.Tan W et al. Viral Kinetics and Antibody Responses in Patients with COVID-19. medRxiv, 2020.2003.2024.20042382, doi: 10.1101/2020.03.24.20042382 (2020). [DOI] [Google Scholar]
- 21.Ng D et al. SARS-CoV-2 seroprevalence and neutralizing activity in donor and patient blood from the San Francisco Bay Area. medRxiv, doi: 10.1101/2020.05.19.20107482 (2020). [DOI] [PMC free article] [PubMed] [Google Scholar]
- 22.Lynch KL et al. Magnitude and kinetics of anti-SARS-CoV-2 antibody responses and their relationship to disease severity. medRxiv, 2020.2006.2003.20121525, doi: 10.1101/2020.06.03.20121525 (2020). [DOI] [PMC free article] [PubMed] [Google Scholar]
- 23.U.S. Food and Drug Administration. Emergency Use Authorization, <https://www.fda.gov/emergency-preparedness-and-response/mcm-legal-regulatory-and-policy-framework/emergency-use-authorization> (2020).
- 24.Lassaunière R et al. Evaluation of nine commercial SARS-CoV-2 immunoassays. medRxiv, 2020.2004.2009.20056325, doi: 10.1101/2020.04.09.20056325 (2020). [DOI] [Google Scholar]
- 25.To KK et al. Temporal profiles of viral load in posterior oropharyngeal saliva samples and serum antibody responses during infection by SARS-CoV-2: an observational cohort study. Lancet Infect Dis, doi: 10.1016/S1473-3099(20)30196-1 (2020). [DOI] [PMC free article] [PubMed] [Google Scholar]
- 26.Ng D et al. SARS-CoV-2 seroprevalence and neutralizing activity in donor and patient blood from the San Francisco Bay Area. medRxiv, 2020.2005.2019.20107482, doi: 10.1101/2020.05.19.20107482 (2020). [DOI] [PMC free article] [PubMed] [Google Scholar]
- 27.Amanat F et al. A serological assay to detect SARS-CoV-2 seroconversion in humans. medRxiv, 2020.2003.2017.20037713, doi: 10.1101/2020.03.17.20037713 (2020). [DOI] [PMC free article] [PubMed] [Google Scholar]
- 28.Wang W et al. Detection of SARS-CoV-2 in Different Types of Clinical Specimens. JAMA, doi: 10.1001/jama.2020.3786 (2020). [DOI] [PMC free article] [PubMed] [Google Scholar]
- 29.Kim D, Quinn J, Pinsky B, Shah NH & Brown I Rates of Co-infection Between SARS-CoV-2 and Other Respiratory Pathogens. JAMA, doi: 10.1001/jama.2020.6266 (2020). [DOI] [PMC free article] [PubMed] [Google Scholar]
- 30.Jiang S, Hillyer C & Du L Neutralizing Antibodies against SARS-CoV-2 and Other Human Coronaviruses. Trends Immunol, doi: 10.1016/j.it.2020.03.007 (2020). [DOI] [PMC free article] [PubMed] [Google Scholar]
- 31.Nie J et al. Establishment and validation of a pseudovirus neutralization assay for SARS-CoV-2. Emerg Microbes Infect 9, 680–686, doi: 10.1080/22221751.2020.1743767 (2020). [DOI] [PMC free article] [PubMed] [Google Scholar]
- 32.Crawford KHD et al. Protocol and Reagents for Pseudotyping Lentiviral Particles with SARS-CoV-2 Spike Protein for Neutralization Assays. Viruses 12, doi: 10.3390/v12050513 (2020). [DOI] [PMC free article] [PubMed] [Google Scholar]
- 33.Food and Drug Administration. Clinical Laboratory Improvement Amendments (CLIA), <https://www.fda.gov/medical-devices/ivd-regulatory-assistance/clinical-laboratory-improvement-amendments-clia> (2020).
- 34.Altmann DM, Douek DC & Boyton RJ What policy makers need to know about COVID-19 protective immunity. Lancet 395, 1527–1529, doi: 10.1016/S0140-6736(20)30985-5 (2020). [DOI] [PMC free article] [PubMed] [Google Scholar]
- 35.Weinstein MC, Freedberg KA, Hyle EP & Paltiel AD Waiting for Certainty on Covid-19 Antibody Tests - At What Cost? The New England journal of medicine, doi: 10.1056/NEJMp2017739 (2020). [DOI] [PubMed] [Google Scholar]
- 36.U.S. Food and Drug Administration. Policy for Coronavirus Disease-2019 Tests During the Public Health Emergency (Revised) <https://www.fda.gov/regulatory-information/search-fda-guidance-documents/policy-coronavirus-disease-2019-tests-during-public-health-emergency-revised> (2020).
- 37.National Cancer Institute. NCI Part of Federal Effort to Evaluate Antibody Tests for Novel Coronavirus, <https://www.cancer.gov/news-events/cancer-currents-blog/2020/covid-19-nci-antibody-testing-review> (2020).
- 38.Whitman JD et al. Chagas disease serological test performance in United States blood donor specimens. Journal of clinical microbiology, doi: 10.1128/JCM.01217-19 (2019). [DOI] [PMC free article] [PubMed] [Google Scholar]
METHODS-ONLY REFERENCES
- 1.Whitman JD et al. Chagas disease serological test performance in United States blood donor specimens. Journal of clinical microbiology, doi: 10.1128/JCM.01217-19 (2019). [DOI] [PMC free article] [PubMed] [Google Scholar]
Associated Data
This section collects any data citations, data availability statements, or supplementary materials included in this article.
Supplementary Materials
Data Availability Statement
The source data for figures are provided as a supplementary file or can be viewed at https://covidtestingproject.org.