

Abstract
The role of interferon-gamma (IFN-γ) in Chronic Myelogenous/Myeloid Leukemia (CML) and in the treatment of CML remains unclear; specifically, the effect of IFN-γ on apoptosis. There is reported interplay between IFN-γ and glycogen synthase kinase–3 (GSK-3), a kinase which has been implicated in both cell death and, conversely, cell survival. Thus, we utilized the CML-derived HAP1 cell line and a mutant HAP1 GSK-3β knocked-down cell line (GSK-3β 31bp) to investigate whether GSK-3 modulates IFN-γ’s action on CML cells. Significantly less GSK-3β 31bp cells, relative to HAP1 cells, were present after 48-hour treatment with IFN-γ. IFN-γ treatment significantly decreased GSK-3β 31bp substrate adhesiveness (relative to HAP1 cells); an observation often correlated with cell death. Fluorescence microscopy revealed that IFN-γ induces a modest level of apoptosis in the HAP1 cells and that IFN-γ induced apoptosis is significantly enhanced in GSK-3β 31bp cells. Utilizing a complementary GSK-3β knocked-down cell line (8bp) we found, via flow cytometric analysis, that IFN-γ induced apoptosis is significantly enhanced in GSK-3β 8bp cells relative to HAP1 cells. Combined, our findings suggest that IFN-γ induces apoptosis of CML cells and that loss of GSK-3β significantly augments IFN-γ-induced apoptosis.
Keywords: Interferon, Glycogen synthase kinase-3, leukemia, apoptosis, BCR-ABL, Philadelphia chromosome
1. Introduction
The Philadelphia chromosome is present in nearly all cases of Chronic Myelogenous/Myeloid Leukemia (CML) [1]. At the molecular level, the presence of the Philadelphia chromosome leads to active BCR-ABL protein, a tyrosine kinase (TK) [2,3]. This mutation engenders cell growth and resistance to apoptosis [3]. Since the discovery of BCR-ABL, TK inhibitors (TKIs) [3,4] have been developed and are now used to treat CML [2–4]. Despite the success of these drugs, some cancer cells become resistant to their therapeutic effect through BCR-ABL-independent mechanisms [3].
The mechanism of drug resistance is poorly understood but has been related to IFN-γ. Held et al. [3] proposed that IFN-γ, the only type II interferon, secreted from immune cells such as T and natural killer (NK) cells may prevent TKIs from inducing apoptosis. In related work, Schurch et al. [5] reported that cytotoxic T cells induce CML stem cell proliferation by secreting IFN-γ Conversely, IFN-γ has been shown to play a role in apoptosis [6] by upregulating or activating certain genes or proteins that inhibit cell growth through apoptosis or cell cycle arrest. For example, treating lymphocytes with IFN-γ has been shown to induce apoptosis and decrease the rate of growth if cells retain normal STAT1 activity [6]. Additionally, IFN-γ can decrease the proliferation of cells by activating antiproliferative genes or proteins such as p21, p27, Rb, p202, and Mad1 [6]. These proteins may cause arrest of the cell cycle or prevent transcription of genes required for certain phases of the cell cycle [6]. Moreover, IFN-γ can activate or upregulate proteins or genes that promote apoptosis, such as: protein kinase dsRNA-regulated (PKR), which can lead to NF-κB activation and eventually apoptosis; IRF-1; Caspase 1; DAPs; Cathepsin D; Fas/Fas ligand; and TNF-α receptors [6,7]. Finally, Castro et al. [8] devote an entire section of their IFN-γ review article to the antitumorigenic effects of IFN-γ, and Xia et al. [9] reported that IFN-γ induces apoptosis in the CML cell line K562. The combination of all the observations described in this paragraph motivate a further investigation into the effect of IFN-γ on CML cells.
Our laboratory has been exploring novel glycogen synthase kinase-3 (GSK-3) inhibitors [10,11]. GSK-3 is a constitutively active serine/threonine kinase composed of two isoforms: GSK-3α, a 51 KDa protein, and GSK-3β, a 47 KDa protein [12]. Although the two isoforms are similar, they may carry out different functions since complete knockout of one isoform cannot be fully rescued by the other isoform [13]. GSK-3 was first isolated from rabbit skeletal muscle and was found to modify the effects of glycogen synthase [14]. GSK-3 is one of the 518 known kinases in the human genome [15]. Although it is possible that GSK-3 acts on up to 500 substrates, GSK-3 has been shown to act on at least 100 substrates in vitro, but this number has not been confirmed in vivo [16,17]. That said, GSK-3 does appear to be a highly active kinase as the median number of substrates for a kinase is 12 and the average is 70 [17]. Not surprisingly, given the large number of GSK-3 substrates, GSK-3 plays a role in a plethora of physiological and pathophysiological processes [18]. In regards to cell survival, there is evidence that GSK-3 can both promote and protect the cell from apoptosis [19–22]. Jacobs et al. [19] infer that the role GSK-3 plays in apoptosis is dependent on the cell type and specific pathway involved. More specifically, Beurel and Jope [23] have reviewed the literature in the context of the paradoxical role of GSK-3 in apoptosis concluding that GSK-3 protects against the extrinsic apoptotic pathway and enhances the intrinsic apoptotic pathway.
Numerous studies have identified connections between IFN-γ and GSK-3 and several works, in aggregate, link IFN-γ, GSK-3 and apoptosis [8,9,23–25]. These observations, along with the fact that elucidating the molecular mechanisms involved in CML and its treatment will advance therapeutic approaches for CML, led us to probe the hypothesis that IFN-γ induces apoptosis in CML cells and the effect is modulated by GSK-3.
2. Materials and Methods
2.1. Cell Culture
HAP1 (Horizon: C631, Clone 31144; Lafayette, Colorado, USA), GSK-3β 31bp (Horizon: HZGHC000007c011; 31 bp deletion mutation) and GSK-3β 8bp (Horizon: HZGHC000007c024; 8 bp deletion mutation) cells were cultured in growth medium (IMDM – Gibco: 12440–053, Waltham, MA, USA; Fetal Bovine Serum - ScienCell: 0500, Carlsbad, CA, USA; Penicillin/Streptomycin - Gibco: 15140–122) according to the recommended Horizon protocol. The HAP1 are near-haploid cell lines derived from KBM-7 cells, which is a human male CML cell line. A detailed description of the generation of the HAP1, GSK-3β 31bp and GSK-3β 8bp cell lines can be found at the company web site and is summarized here. The KBM-7 cells (suspension) retrieved from the bone marrow were cloned and reprogrammed to become adherent HAP1 cells [26]. Specifically, the KBM-7 cells were edited to express OCT4/SOX2/c-Myc and KLF4 transcription factors, causing the cells to differentiate into adherent HAP1 cells [27,28]. The GSK-3β 31bp/8bp mutant cell lines were created through RNA-guided CRISPR/Cas9 technology targeting the GSK-3β gene in the HAP1 parental cell line causing a frameshift mutation in the GSK-3β gene and a truncated form of the GSK-3β protein [29]. The guide ARN (gRNA) sequence (CGGCTTGCAGCTCTCCGCAA) was designed according to Anderson et al. [30] which describes an efficient strategy to design highly specific gRNAs with low probability to target other genes (off-targets). In this case, there is only one sequence in the genome that matches the target completely and other target genes had three flaws (Mismatches, Deletions, and Insertions), which is typically enough to disrupt cleavage at a potential off-target site [30]. Thus, the gRNA is specific to GSK-3 gene and the two cell lines are considered GSK-3-specific mutant cell lines with no off-target mutations. Cell line HZGHC000007c011 has 31bp deletion in exon 1 that created an in frame start codon only 48bp away from the original start codon. We term this cell line GSK-3β 31bp. The cell line HZGHC000007c024 has an 8bp deletion in exon 1, which produced a frameshift mutation in the GSK-3β gene that resulted in a premature stop codon and the synthesis of a short peptide. We term this cell line GSK-3β 8bp.
2.2. Viability and Detachment Assays
HAP1 and GSK-3β 31bp cells were cultured in 24-well plates (Corning: 3524; Corning, NY, USA). Once the cells reached 35 to 50 percent confluency, the HAP1 and GSK-3β 31bp cells were treated with growth media, or growth media containing 100 U/mL human IFN-γ (Invitrogen: RP-8607; Waltham, MA, USA), or 1000 U/mL IFN-γ for 48 hours. At the 48-hour time point, the supernatant and attached cells from each well were harvested and washed. The recovered cells were resuspended in 500 μL of fresh growth medium and the concentration of cells present in the suspension determined using BIO-RAD TC20™ Automated Cell Counter, cell counting slides (BIO-RAD: 1450016; Hercules, CA, USA), and Trypan blue (Gibco: 15250061).
To investigate the effect of IFN-γ and GSK-3β on cell adhesiveness, a cell detachment assay was utilized. HAP1 and GSK-3β 31bp cells were incubated for 48 hours in growth media, or growth media supplemented with 100 U/mL IFN-γ, or 1000 U/mL IFN-γ. After the 48-hour incubation, the cells were imaged via brightfield microscopy and the images saved. After imaging, 200 μL of the supernatant was discharged, via a micropipette, over the interior of each well thrice to introduce a disruptive fluid force on the cell layers. The cells were again imaged and the images saved. ImageJ (NIH, Bethesda, MD) was used to analyze the saved images and determine the area occupied by the cells before and after introduction of the disruptive fluid force.
2.3. Microscopy and Image Analysis
HAP1 and GSK-3β 31bp cells were cultured in 96-well microscopy plates [i.e. microplates with black sides and clear bottoms (Corning: 3904)]. Once the cells reached 35 to 50 percent confluency, the cells were treated with fresh media or fresh media supplemented with 1000 U/mL IFN-γ. Forty-eight hours later, the supernatant was removed and the cells gently washed twice with phosphate buffered saline (PBS, ThermoFisher; Waltham, MA, USA). After the second washing step, 200 μL of Assay Buffer (included with kit described below) was added to each well. The appropriate volumes of Apopxin Green (100X) (Ex/Em = 490/525 nm) and 7-AAD (200X) (Ex/Em = 546/647 nm) [obtained as a kit (AB176749) from Abcam; Cambridge, MA, USA], prepared in 100% DMSO (Millipore Sigma: D2438; Burlington, MA, USA), were added to the appropriate wells and the cells allowed to incubate in the dark at room temperature for 30 minutes. Note that separate sets of cells were treated with serum-free media for 48 hours as a positive control for Apopxin Green or with 90% EtOH for 30 to 60 seconds as a positive control for 7-AAD.
After incubation, the cells were washed twice with PBS, covered again with Assay Buffer, and imaged using a fluorescent microscope. For each well, a brightfield image was recorded and subsequently sequential fluorescent images (one for each color according to each excitation and emission spectrum) were recorded. A composite fluorescent image was also recorded. Cells and fluorescent dyes were imaged through a 10x objective using a Leica DMI6000 inverted microscope (Leica Microsystems, Wetzlar, Germany) containing a filter cube wheel with the appropriate excitation and emission filters for the green and red dyes listed previously. Images were captured using a Nuance Multispectral Imaging System (PerkinElmer, Inc., Hopkinton, MA, USA), and each image was saved for later analysis using ImageJ. In ImageJ, recorded images, taken under brightfield microscopy, were used to determine the total cell area. Specifically, the regions occupied by cells were outlined and ImageJ was utilized to determine the area of the outlined regions. Similarly, the area of green fluorescence (apoptotic cells) and red fluorescence (necrotic cells) was determined. The area of green (or red) fluorescent cells was divided by the total cell area (determined from the bright field microscopy images), and this ratio was multiplied by 100 to obtain the percentage of apoptotic or necrotic cells, respectively.
2.4. Flow Cytometric Analysis of Apoptosis
The HAP1 and GSK-3β 8bp cell lines were cultured in 6-well plates. Once the cells reached 35 to 40 percent confluency, the cells were treated with fresh media or fresh media supplemented with 1000 U/mL IFN-γ. The Alexa Fluor® 488 annexin V and propidium iodide (PI) kit for flow cytometry (Invitrogen Carlsbad, CA, V13241) were used to detect viable, apoptotic, and necrotic cells. The human anticoagulant, annexin V, a 35–36 kDa Ca2+-dependent phospholipid-binding protein which has high affinity for phosphatidylserine exposed to the extracellular environment, and PI, a nucleic acid binding dye, were used for detection of apoptosis and necrosis, respectively. The assay was performed according to the manufacturer’s recommendation. Briefly, 48 hours after treatment, the cells were harvested, washed with cold Dulbecco’s phosphate buffer saline (containing no calcium and magnesium), and then resuspended in 100 μL diluted annexin V binding buffer 1x (50 mM HEPES, 700 mM NaCl, 12.5 mM CaCl2, pH7.4) to a final concentration of ~1 × 10⁷ cells per ml. Subsequently, 5 μL of Alexa Fluor® 488 annexin from the stock solution and 1 μL of diluted PI at a concentration of 100 μg/mL were added to the cell suspensions and the cells incubated at room temperature for 15 minutes in the dark. After the incubation, the samples were diluted further by adding 400 μL of the annexin V binding buffer (1x) and analyzed on a FACSAria Special Order Research Product cytometer/sorter (BD Bioscience, San Jose, CA). Annexin V (Ex/Em: 488/499 nm) fluorescence was excited with a 488 nm laser and emission detected with a 530 +/− 15 nm bandpass filter. PI fluorescence (Ex/Em: 535/617 nm) was excited with a 488 nm laser and emission detected via a 610 +/− 10 nm bandpass filter. The results were analyzed with FlowJo version 10 software (FlowJo, Ashland, OR).
2.5. GSK-3α/β Western Blot
HAP1, GSK-3β 31bp and GSK-3β 8bp whole-cell lysates were prepared in lysis buffer containing 10 mM Tris-HCl (pH 7.5), 150 mM NaCl, 1% Nonidet P-40, a mixture of protease inhibitors [Protease Inhibitor Calbiochem Cocktail (Set III, EDTA Free; Millipore Sigma: 539134)], and a phosphatase inhibitor (PhosSTOP EASYPack; Roche: 04906837001). Total protein was then quantified using the micro BCA protein assay kit (Thermo Fisher Scientific) and Nanodrop 2000 Micro-volume UV-Vis Spectrophotometer (Thermo Fisher Scientific). Whole-cell lysates (22–25 μg) were then electrophoresed on 4–12% Bis-Tris SDS-PAGE gradient gels using the NuPage system (Invitrogen) and transferred to nitrocellulose membranes (Invitrogen). Odyssey blocking buffer (LI-COR; Lincoln, NE) was used for blocking the membranes and antibody dilution. A rabbit anti-GSK-3α/β antibody (Cell Signaling Technology: 5676; Danvers, MA, USA) was used to detect GSK-3α/β, and a rabbit anti-β-actin antibody (Cell Signaling Technology: 4967) was used to detect β-actin. IRDye 680LT (LI-COR: 926–68021) and 800CW (LI-COR: 926–32211) goat anti-rabbit polyclonal secondary antibodies (LI-COR Biosciences) were used for primary antibody detection. Membranes were first probed for GSK-3α/β, stripped using LI-COR stripping buffer (LI-COR: 928–40030), and re-probed for β-actin as a loading control. The LI-COR Odyssey Infrared Imaging System was then used for visualization and quantification of signals as previously described [10]. For normalization to loading control, the values for the GSK-3α or β Integrated Intensity (I.I.) bands were divided by the value of the corresponding β-actin bands for that lane as a loading control.
2.6. Statistics
Statistical analysis (ANOVA, and post-hoc tests) was used to determine the significance of observed differences between the treatment groups.
3. Results
3.1. GSK-3β Protects Against IFN-γ-Reduced HAP1 Cell Viability
To investigate a possible connection between GSK-3 and IFN-γ in CML, we chose to use commercially available CML cells that have been modified to grow attached, i.e. HAP1 cells, and HAP1 cells that had GSK-3β knocked down, i.e. GSK-3β 31bp cells. As shown in Figure 1, the GSK-3β protein was indeed knocked down in the GSK-3β 31bp cells. Specifically, there was no band present in the lysates obtained from the GSK-3β 31bp cells at the molecular weight of the GSK-3β obtained from the HAP1 cells (Figure 1A). The lower molecular weight band which was present in the lysates from the GSK-3β 31bp cells, and not the parental HAP1 cells (Figure 1A), likely reflects the presence of truncated GSK-3β resulting from the CRISPR/Cas9 targeting. Indeed, the 31bp deletion created a start codon 48bp away from the original start codon. A One-Factor ANOVA revealed that there was a significant difference in Integrated Intensity among the bands (Figure 1B). A post-hoc Tukey’s test revealed there was a significantly higher level of GSK-3β in the HAP1 cells (~ 3 fold higher) than the GSK-3β 31bp cells while the level of GSK-3α was not statistically different between the two cell types, demonstrating that GSK-3β was selectively knocked down in the GSK-3β 31bp cells (Figure 1B). Note that the putative truncated GSK-3β band present in the GSK-3β 31bp lanes (Figure 1A) was used in this analysis (Figure 1B) and gives an upper bound on the level of GSK-3β, even if truncated, present in the GSK-3β 31bp cells.
Figure 1.
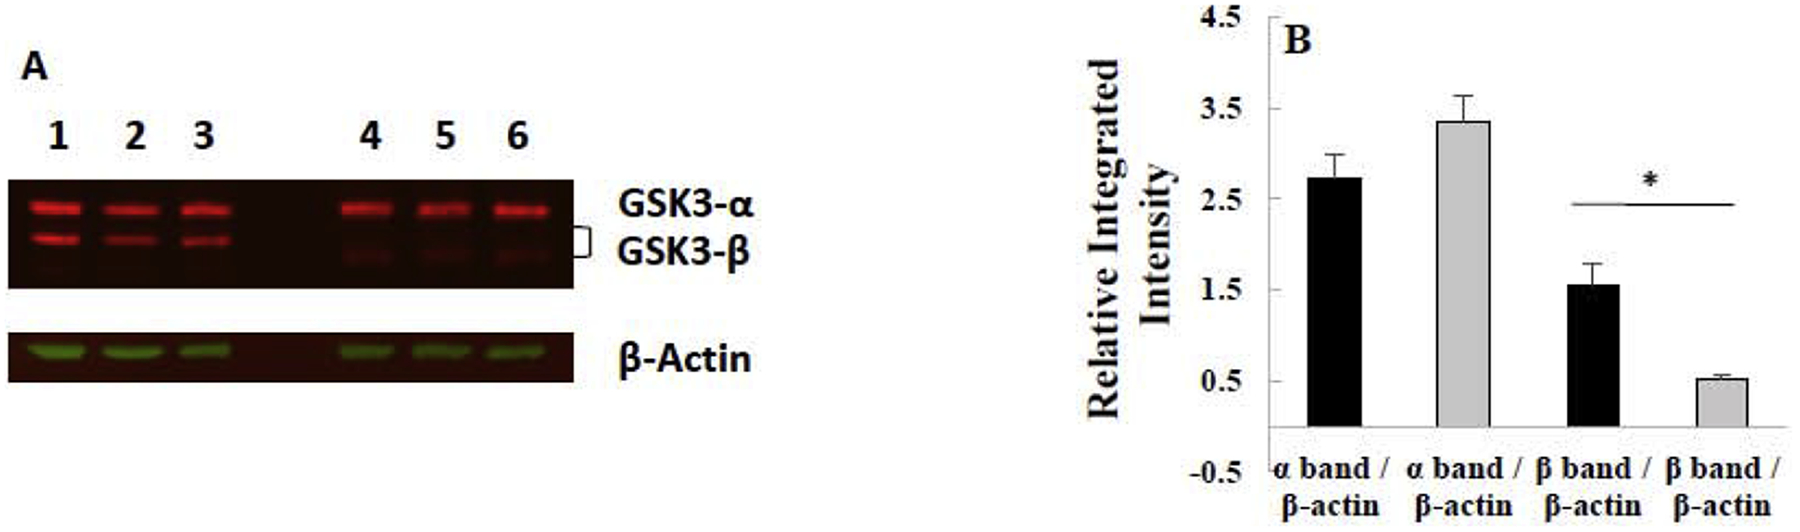
Western blot analysis of GSK-3β/α isolated from HAP1 and GSK-3β 31bp cells reveals GSK-3β, but not GSK-3α, is knocked down in the GSK-3β 31bp cell line. (A) Image of western blot. The top set of red bands in each of the columns labeled 1–6 are GSK-3α bands, and the bottom set of red bands are GSK-3β bands. Samples in columns 1–3 are from HAP1 cells, and samples in columns 4–6 are from GSK-3β 31bp cells. β-actin loading control bands for blot are shown in green. (B) Integrated intensity of bands present in the western blot. Average integrated intensity of GSK-3 α/β bands isolated from HAP1 (black bars) and GSK-3β 31bp (grey bars) cells divided by the integrated intensity of the corresponding β-actin bands. Note that the putative lower molecular weight truncated GSK-3β band present in the GSK-3β 31bp lanes was used for this analysis. Error bars represent standard deviation (n=3). * significantly different at p ≤ 0.05 by Tukey’s test.
To investigate the effect of IFN-γ on the survival of HAP1 and GSK-3β 31bp cells, each cell type was treated with fresh growth media, or growth media supplemented with 100 U/mL IFN-γ, or 1000 U/mL IFN-γ for 48 hours. Subsequently, the cells were harvested and analyzed via the BIO-RAD TC20™ Automated Cell Counter to determine the number of live cells (Figure 2). A Two-Factor ANOVA with Replication of the data revealed that IFN-γ treatment was a significant factor and that the factors do not interact (Figure 2). A post-hoc Tukey’s test revealed that there was a significant decrease in the cell count for the 100 and 1000 U/mL IFN-γ treatment groups, relative to the 0 U/mL IFN-γ control group for both the HAP1 and GSK-3β 31bp cells (Figure 2). There were significantly fewer GSK-3β 31bp cells relative to the HAP1 cells for the 1000 U/mL IFN-γ treatment groups. The number of GSK-3β 31bp cells for the 1000 U/mL IFN-γ treatment group did appear to be less than the number of GSK-3β 31bp cells for the 100 U/mL treatment group, but the Tukey’s test did not reveal a significant difference between the two groups. It is worth noting, however, that the p value was quite low (0.06) (Figure 2).
Figure 2.
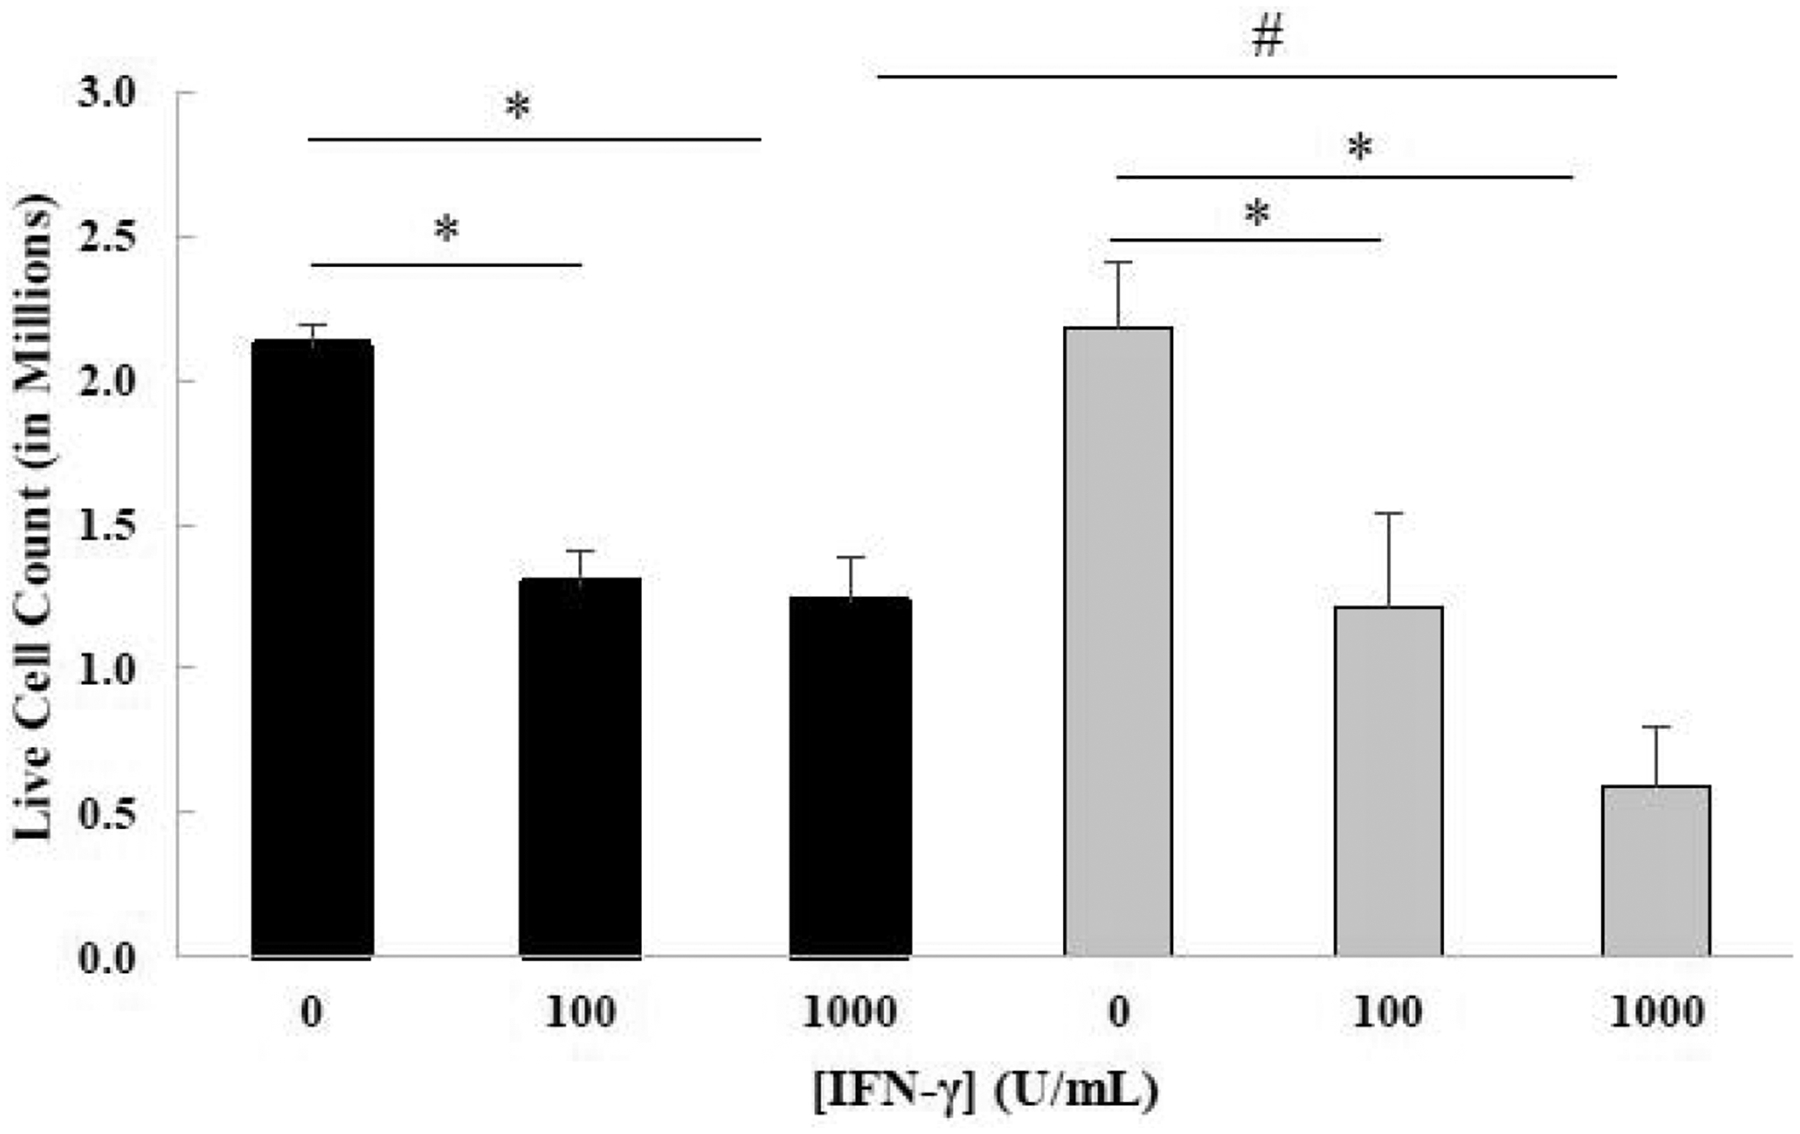
Live cell count of HAP1 (black bars) and GSK-3β 31bp (grey bars) cells treated with two different concentrations of IFN-γ for 48 hours. The live cell count of HAP1 and GSK-3β 31bp cells treated with 0, 100 or 1000 U/mL IFN-γ for 48 hours, determined in three separate experiments, were averaged to generate the data presented. Tukey’s test revealed that there was a significant difference between the 0 and 100 U/ml IFN-γ treatment groups and the 0 and 1000 U/mL IFN-γ treatment groups for both cell types (*p ≤ 0.05). Tukey’s test also revealed a significant difference between the HAP1 and the GSK-3β 31bp cells for the 1000 U/mL IFN-γ treatment groups (#p ≤ 0.05). Although the Tukey’s test did not reveal a significant difference for live cell count between GSK-3β 31bp cells treated with 100 and 1000 U/mL IFN-γ, a trend of decreasing number of live GSK-3β 31bp cells was observed as the treatment concentration increased from 100 U/mL to 1000 U/mL (p = 0.06). Error bars represent standard deviation (n=3).
3.2. Treatment with IFN-γ Significantly Reduces the Adhesiveness of GSK-3β 31bp Cells Relative to HAP1 Cells
Throughout the duration of the above experiments, it was noted that many of the GSK-3β 31bp cells treated with IFN-γ detached from the surface of the wells after 48 hours. Such detachment was not prominent for untreated GSK-3β 31bp cells or any of the HAP1 cell treatment groups. To probe this phenomenon further, we investigated the sensitivity of both cell types to removal from the substrate (i.e. tissue culture plastic) in a cell detachment assay. HAP1 and GSK-3β 31bp cells were treated for 48 hours with fresh growth media, or fresh growth media supplemented with 100 U/mL IFN-γ, or 1000 U/mL IFN-γ. After the 48-hour incubation, brightfield images were recorded of the cell monolayers. Subsequently, a 200 μL micropipette was utilized to dispense fluid over the cells thus imposing a disruptive fluid force on the adherent cells. Post-exposure to the fluid force, the imaging process was repeated. ImageJ was utilized to determine the areas occupied by cells in each well prior to, and after, exposure to the disruptive fluid force. The area occupied by the cells after exposure to the fluid force was divided by the area occupied before imposition of the fluid force to arrive at the ratios presented in Figure 3. As shown, application of the disruptive fluid force significantly decreased the ratio of GSK-3β 31bp cells remaining adherent to the substrate for either the 100 or 1000 U/mL IFN-γ treatment groups relative to the GSK-3β 31bp no treatment group (Figure 3). In addition, for both IFN-γ treatment groups the ratio of GSK-3β 31bp cells remaining adherent to the substrate was significantly less than the ratio of HAP1 cells remaining adherent to the substrate. Combined, the data strongly suggests that treatment with IFN-γ significantly decreases cell adhesiveness in the absence of GSK-3β.
Figure 3.
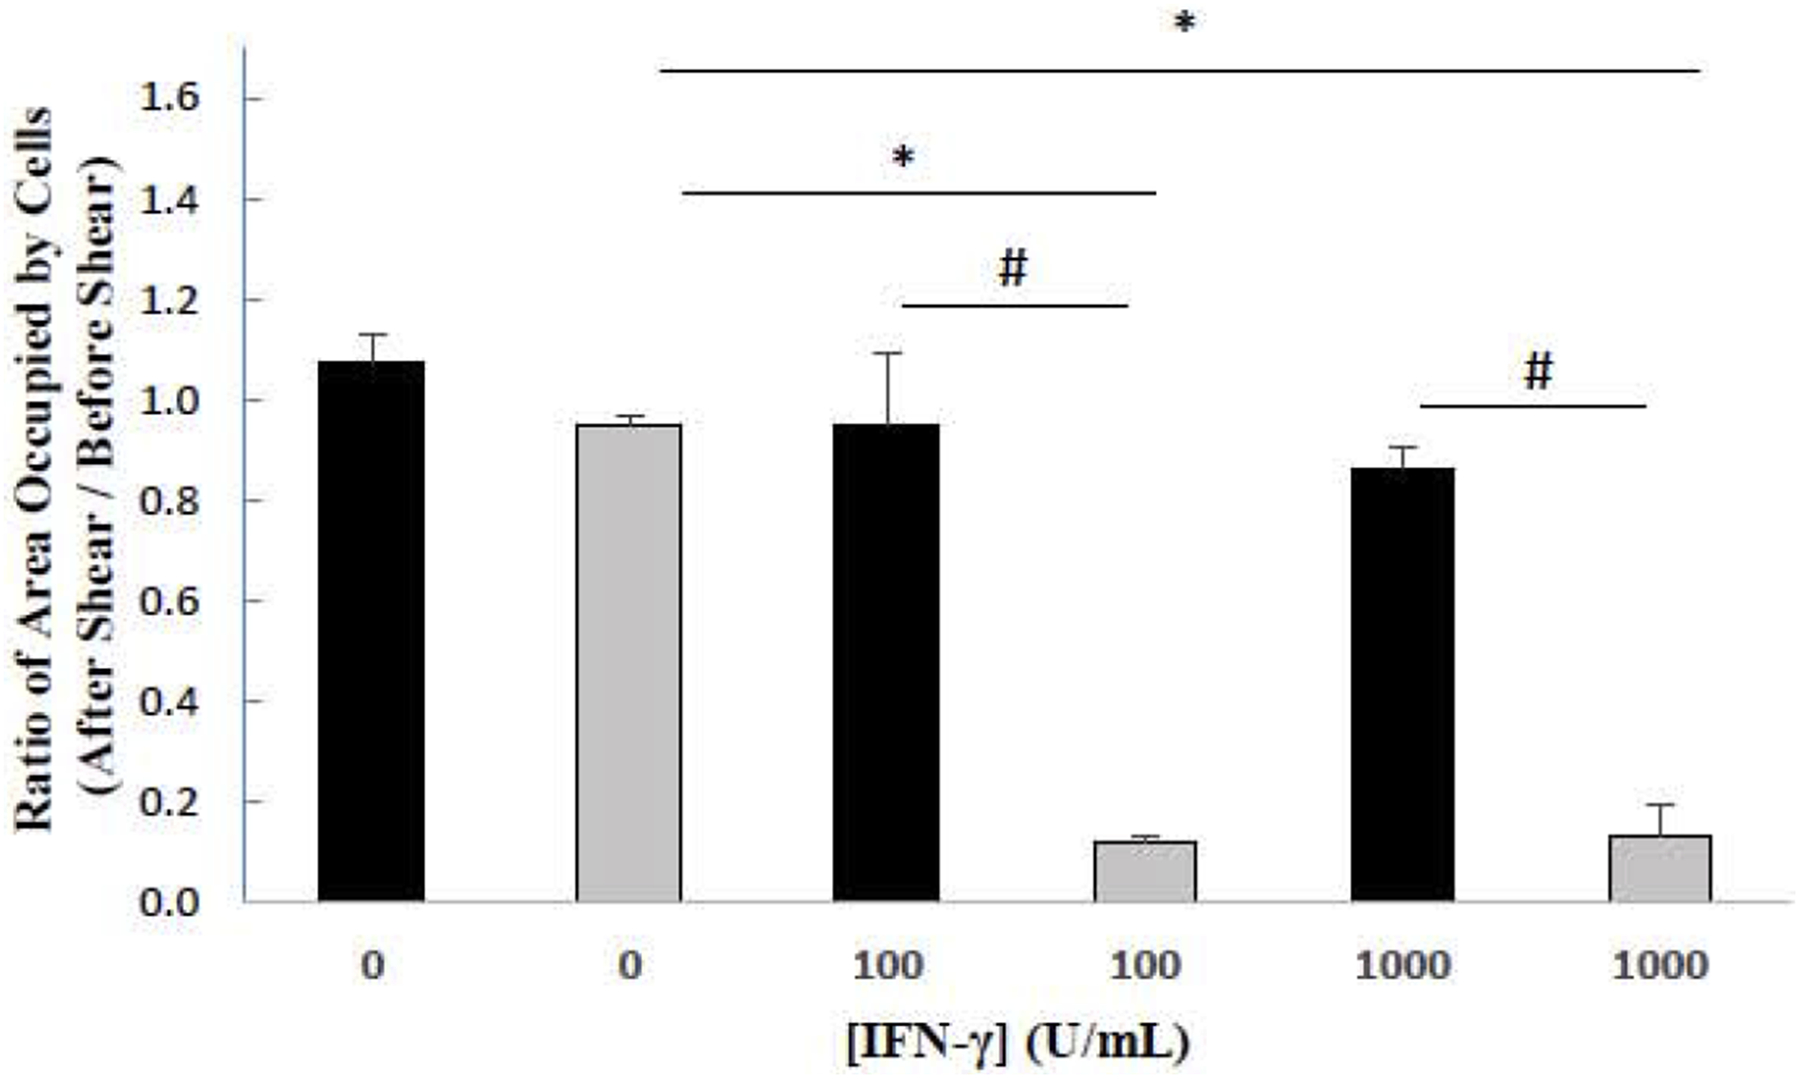
Sensitivity of cells to a disruptive fluid force. The areas occupied by HAP1 (black bars) and GSK-3β 31bp cells (grey bars) after IFN-γ treatment for 48 Hours and post-exposure to a disruptive fluid force were divided by the areas occupied pre-exposure. A Tukey’s test revealed that there was a significant difference between the 0 and 100 U/mL IFN-γ treatment groups and between the 0 and 1000 U/mL IFN-γ treatment groups for the GSK-3β 31bp cells (*p ≤ 0.05). A Tukey’s test also revealed that there was a significant difference between the GSK-3β 31bp and HAP1 cells for both the 100 and 1000 U/mL IFN-γ treatment groups (#p ≤ 0.05). Error bars represent standard deviation (n=2).
3.3. Fluorescence Microscopy Reveals Evidence that GSK-3β is Protective Against IFN-γ Induced Apoptosis
The above data (Figures 2 and 3) suggest that the IFN-γ treatment may induce cell death, in particular, apoptosis which is often associated with loss of adhesiveness [31] as revealed in Figure 3. Thus, to explore this further, apoptosis of HAP1 and GSK-3β 31bp cells upon IFN-γ stimulation was studied via fluorescent microscopy. Each cell type was treated with fresh growth media or fresh growth media supplemented with 1000 U/mL IFN-γ for 48 hours and subsequently analyzed via fluorescent microscopy (Figure 4). A Two-Factor ANOVA with Replication conducted on the percentage of apoptotic cells revealed that both cell type and IFN-γ treatment were significant factors and that interaction was significant (Figure 4). A post-hoc Tukey’s test revealed that there was a significant increase in the percentage of apoptotic cells for the 1000 U/mL IFN-γ treatment group compared to the 0 U/mL IFN-γ treatment group for both cell types. The Tukey test also revealed that there was a significantly greater percentage of apoptotic GSK-3β 31bp cells relative to the percentage of apoptotic HAP1 cells for the 1000 U/mL IFN-γ treatment groups (Figure 4).
Figure 4.
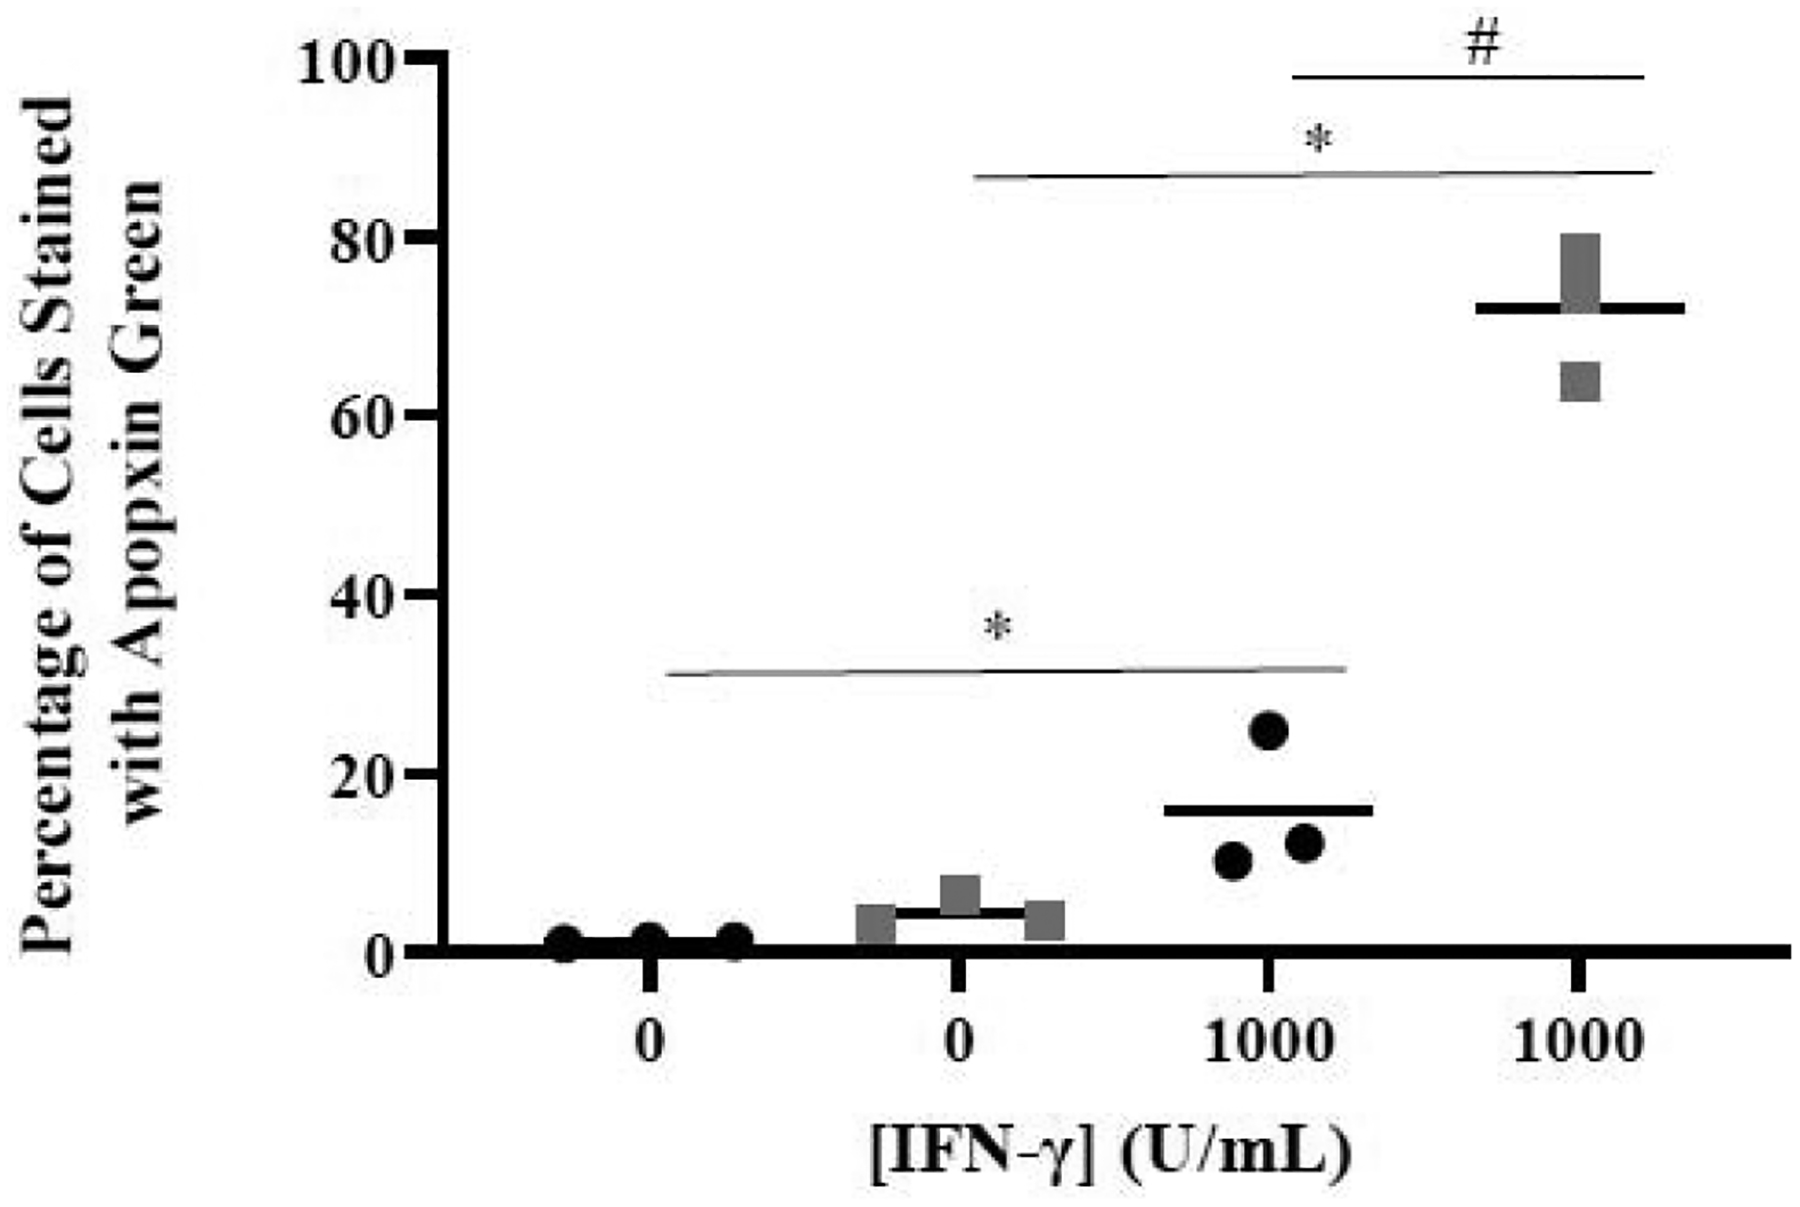
Effect of IFN-γ on apoptosis measured via image analysis. The percentage of HAP1 (black bars) and GSK-3β 31bp (grey bars) cells treated with 0 or 1000 U/mL of IFN-γ for 48 hours that stained positive for Apopxin Green was determined. A Tukey’s test revealed there was a significant difference in the percentage of apoptotic cells between the 0 U/mL and 1000 U/mL IFN-γ treatment groups for both cell types (*p ≤ 0.05). The Tukey’s test also revealed a difference between the percentage of apoptotic HAP1 and apoptotic GSK-3β 31bp cells treated with 1000 U/mL IFN-γ (#p ≤ 0.05).
3.4. Flow Cytometric Analysis Reveals Evidence that GSK-3β is Protective Against IFN-γ Induced Apoptosis
To further probe the effect of GSK-3 on IFN-γ-induced apoptosis of model CML cells, we obtained and utilized an allelic GSK-3β mutant cell line (HZGHC000007c024) and used flow cytometric analysis to evaluate apoptosis. The obtained cell line (we term GSK-3β 8bp) has an 8bp deletion in exon 1 of the GSK-β gene, which results in undetectable levels of GSK-3β via western blot analysis (Figure 5). We treated the parental HAP1 and GSK-3β 8bp cell lines with growth media or growth media supplemented with 1000 U/mL IFN-γ for 48 hours. Subsequently, the cells were stained with Alexa Fluor® 488 annexin V and PI, and then analyzed via flow cytometric analysis. As shown in Figure 6, IFN-γ treatment caused some HAP1 cells to shift to the upper and lower right quadrants suggesting that IFN-γ induced apoptosis and late apoptosis/necrosis [32] in this cell line (Figure 6). A similar, but more dramatic shift, was observed for the GSK-3β 8bp cells (Figure 6). We focused our further analysis on the IFN-γ induced shift of the cells into the lower right quadrant which represents cells in the early stage of apoptosis [32]. We conducted this experiment three times and obtained similar results in each experiment (Figure 7). As shown, 48-hour treatment with IFN-γ caused a significant increase in the percentage of cells in the early apoptosis quadrant for both the HAP1 and GSK-3β 8bp cell lines (Figure 7A). Further, the IFN-γ induced shift in the percentage of cells in the early apoptosis quadrant was significantly greater for the GSK-3β 8bp cell line compared to the HAP1 cell line (Figure 7B).
Figure 5.
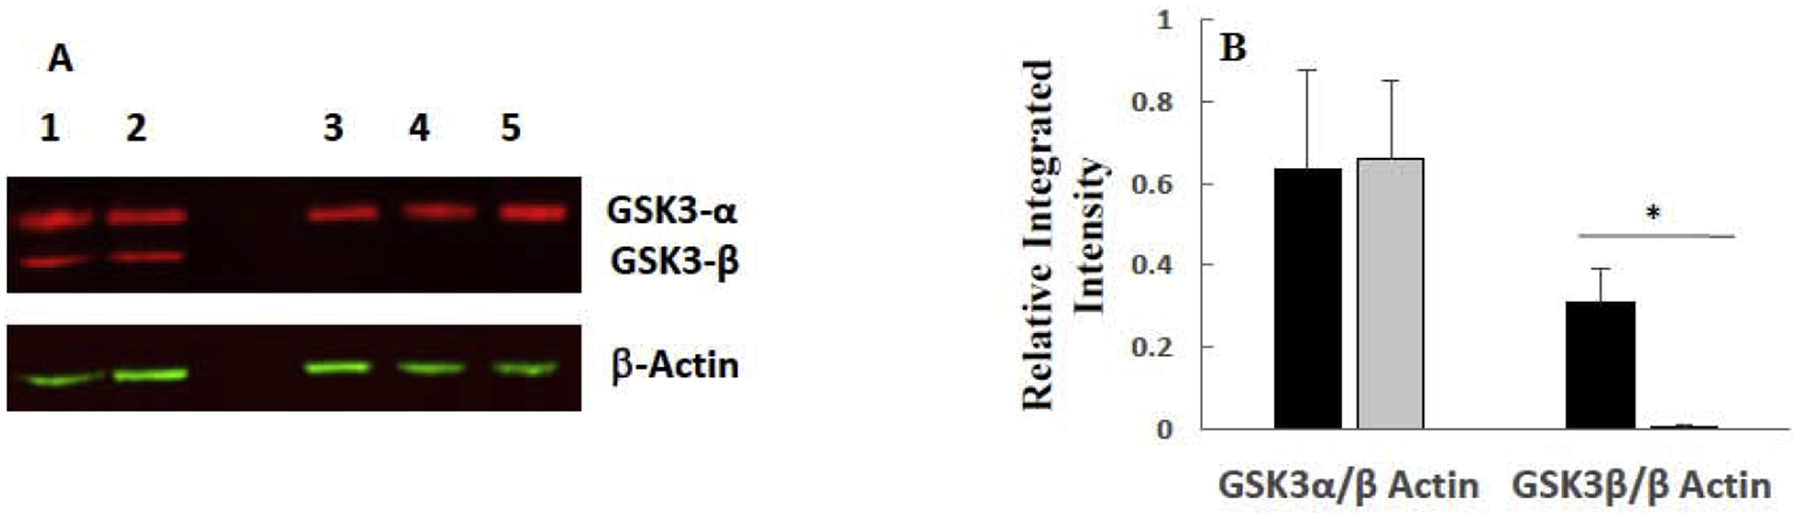
Western blot analysis of GSK-3β/α isolated from HAP1 and GSK-3β 8bp cells reveals GSK-3β, but not GSK-3α, is knocked out in the GSK-3β 8bp cell line. (A) Image of western blot. The top set of red bands in each of the columns labeled 1–5 are GSK-3α bands, and the bottom set of red bands are GSK-3β bands. Samples in columns 1–2 are from HAP1 cells, and samples in columns 3–5 are from GSK-3β 8bp cells. β-actin loading control bands for blot are shown in green. (B) Integrated intensity of bands present in the western blot. Average integrated intensity of GSK-3 α/β bands isolated from HAP1 (black bars) and GSK-3β 8bp (grey bars) cells divided by the integrated intensity of the corresponding β-actin bands. Error bars represent standard deviation (n=2–3). * significantly different at p ≤ 0.05 by Tukey’s test.
Figure 6.
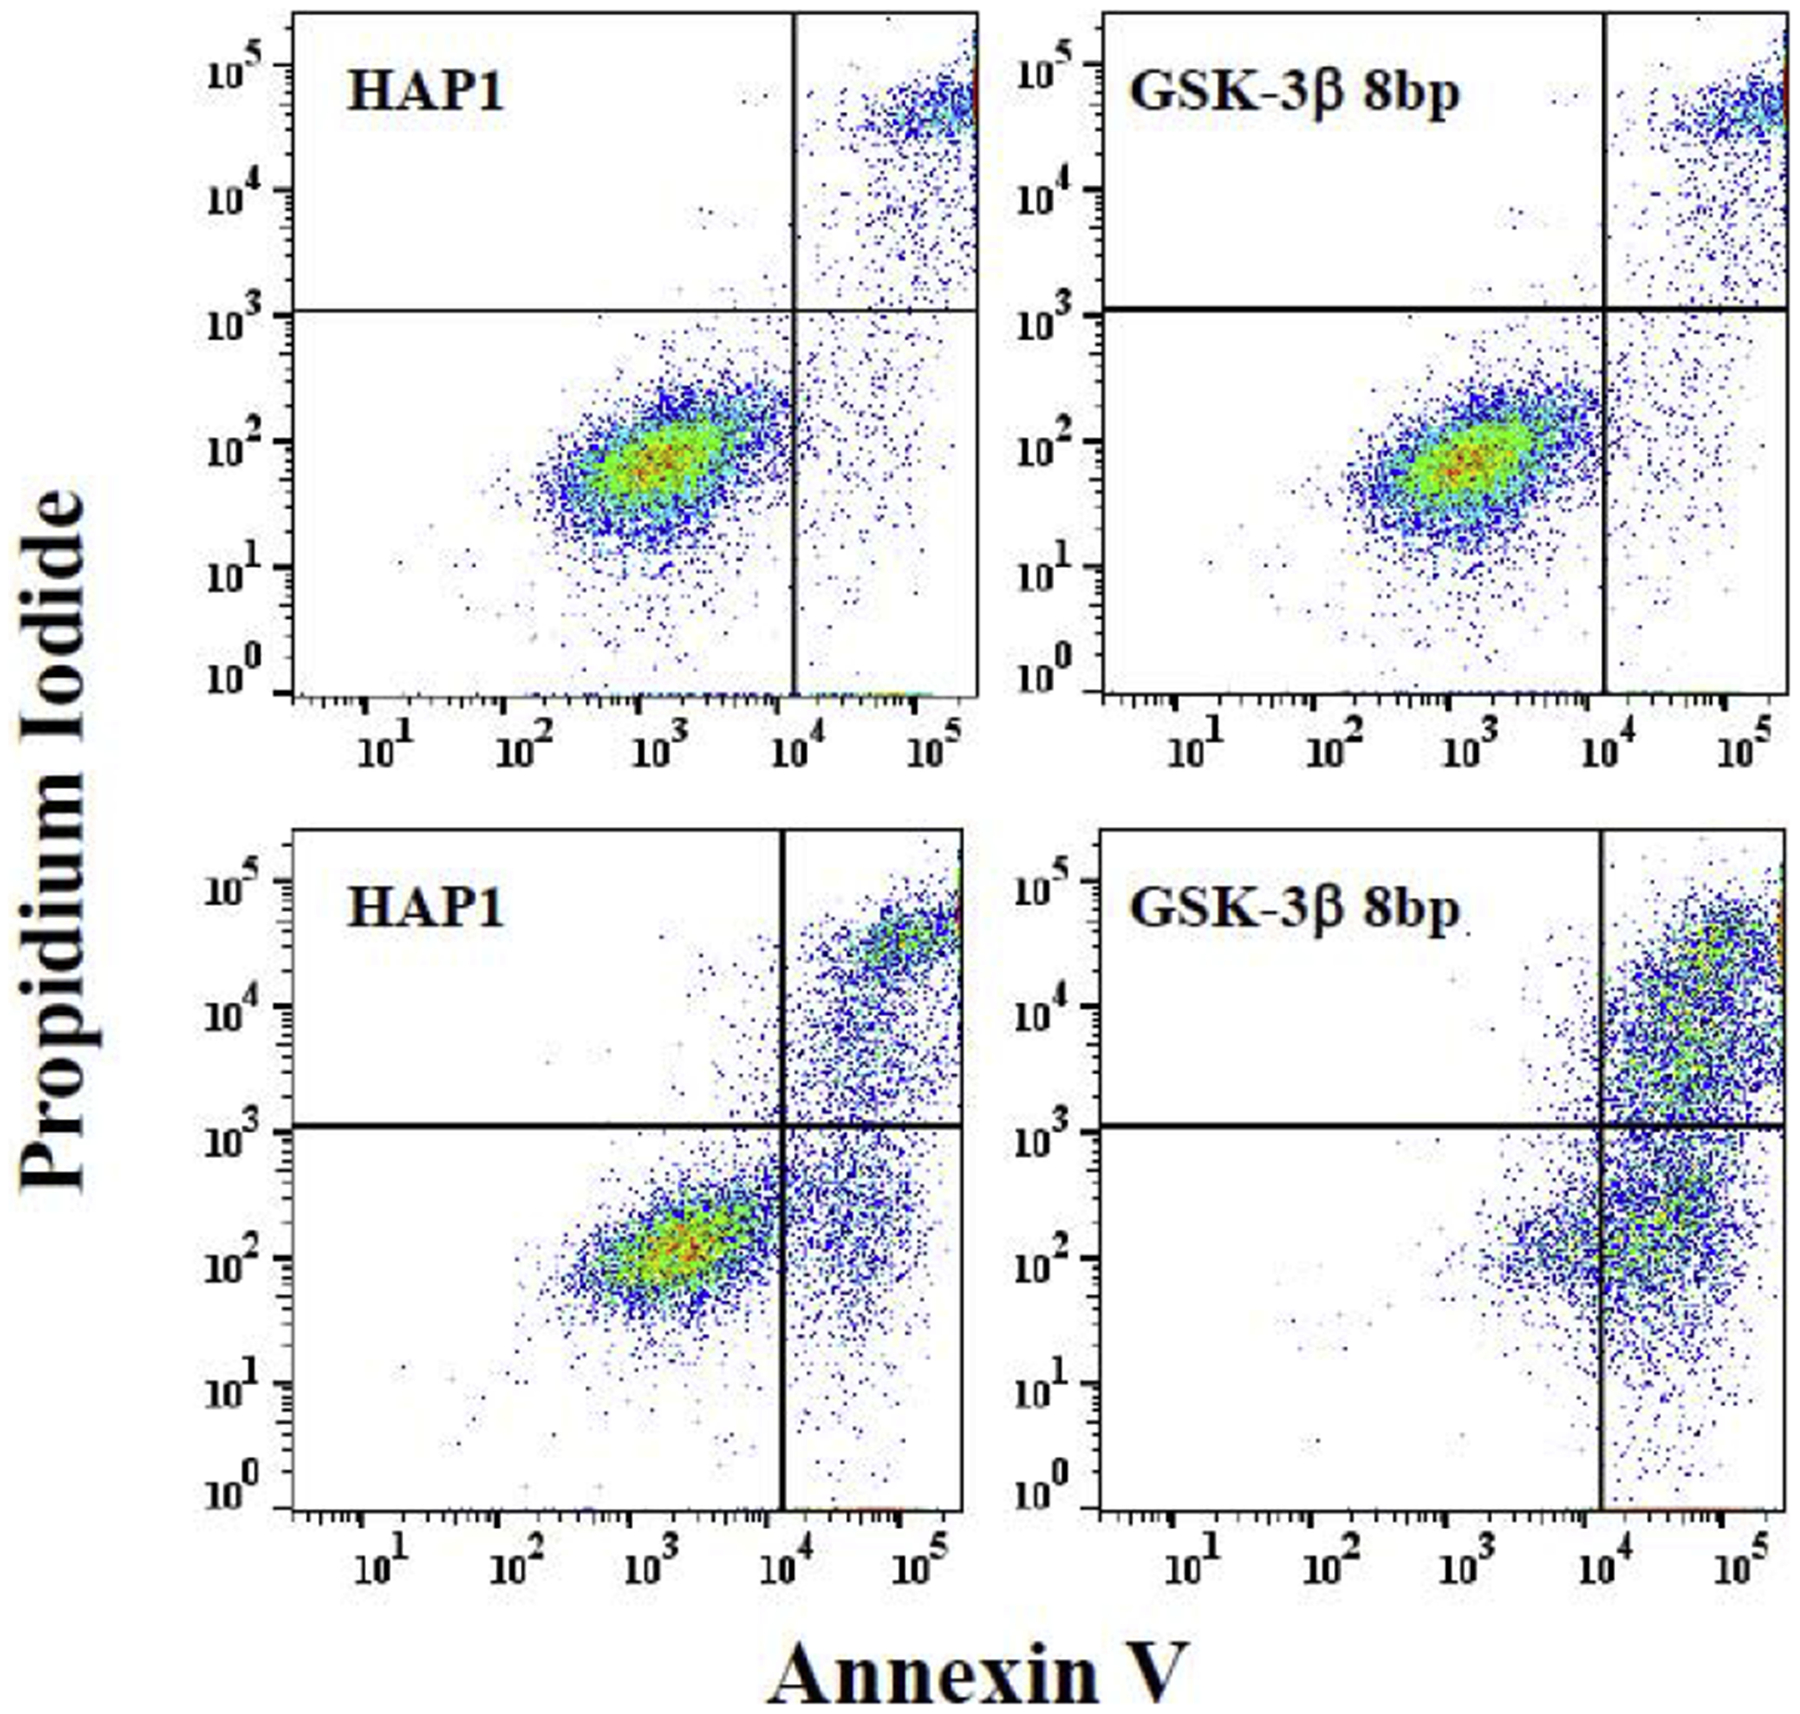
Effect of IFN-γ on apoptosis measured via flow cytometry. HAP1 and GSK-3β 8bp cells were treated with media (upper panels) or media supplemented with 1000 U/mL of IFN-γ (lower panels) for 48 hours. Subsequently the cells were stained with annexin V and PI and analyzed via two-parameter flow cytometric analysis. A set of dot-plots representative of three separate experiments are shown. (Supplementary Figure 1 provides representative figures from the other two experiments). Signals due to annexin V and PI are on the x- and y-axes, respectively. Right quadrants are considered shifted for annexin V staining and upper right quadrant considered shifted for PI staining. Upper right quadrant represents late-apoptotic/necrotic cells and lower right quadrant represents early apoptotic cells [32].
Figure 7.
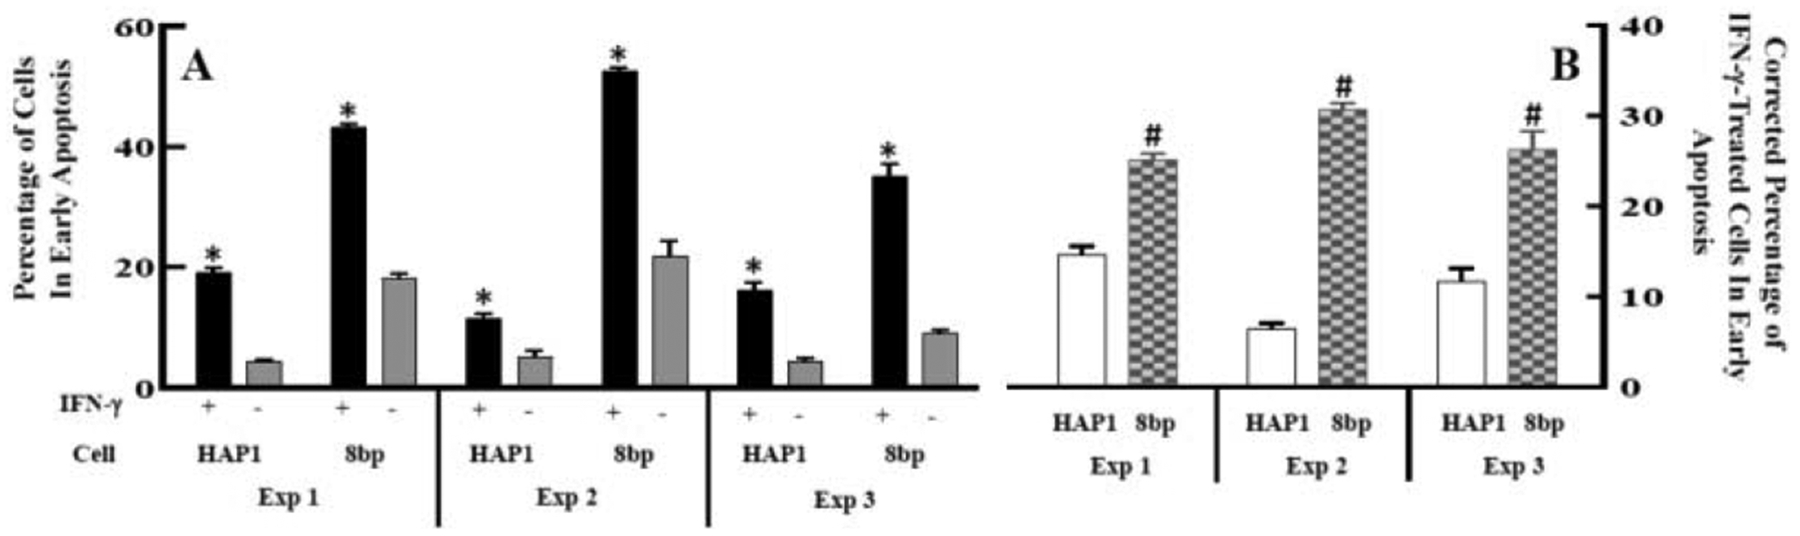
Quantification of the effect of IFN-γ on apoptosis measured via flow cytometry. (A) HAP1 and GSK-3β 8bp cells were treated with media supplemented with 1000 U/mL of IFN-γ (black bars) or media alone (grey bars) for 48 hours. Subsequently the cells were stained with annexin V and PI and analyzed via flow cytometry. The percent of cells in the early apoptosis quadrant (lower right quadrant in Figure 6) was determined. Within an experiment, a given cell/treatment combination was performed in multiple replicates (n=2–4) and averaged to give the results presented. (*p ≤ 0.05 by a Sidaks’ multiple comparison test comparing with and without IFN-γ treatment for a particular cell type within an experiment, i.e. black vs. grey bars for each cell type within an experiment; GSK-3β 8bp is referred to as 8bp in the figure.) (B) The percentage of cells in the early apoptosis quadrant was compared between the HAP1 and GSK-3β 8bp cells treated with IFN-γ. IFN-γ treatment resulted in a greater shift of the percentage of GSK-3β 8bp cells in the early apoptosis quadrant compared to the HAP1 cells. (#p ≤ 0.05 by t-test comparing HAP1 and GSK-3β 8bp in each experiment, i.e. open vs patterned bars in each experiment; GSK-3β 8bp is referred to as 8bp in the figure; Note that for a given experiment and cell type, the average percentage of cells in the early apoptosis quadrant without IFN-γ treatment was subtracted from the percentage of cells observed in this quadrant with IFN-γ treatment to arrive at the data presented in (B). This correction accounts for the fact that the percentage of cells in the early apoptosis quadrant without treatment with IFN-γ appeared to be somewhat higher for the GSK-3β 8bp cells compared to the HAP1 cells.)
4. Discussion
IFN-γ has an apparent context-specific role in CML. Held et al. [3], suggested that IFN-γ thwarts the activity of TKIs, in particular by abating induction of apoptosis. Schurch et al. [5], have reported that cytotoxic T cells secrete IFN-γ which induces proliferation of CML stem cells. In contrast, it is well known that IFN-γ, in certain settings, can have pro-apoptotic properties [8]. Additionally, it has been shown that IFN-γ can induce apoptosis in a diploid cell line derived from a CML patient [9]. In this study we utilized the CML haploid HAP1 cell line and two HAP1-derived GSK-3β knock down cell lines to probe the potential interplay between IFN-γ and GSK-3β.
We found evidence that, similar to Xia et al. [9], IFN-γ induces apoptosis in the HAP1 CML cell line (Figures 4,6,7). In two different (allelic) GSK-3β-deficient cell lines using complementary techniques, we found that loss of GSK-3β caused a significant increase in the percentage of cells expressing the antigen for the apoptosis marker apopxin [using the GSK-3β 31bp cell line and image analysis (Figure 4)] and annexin V [using the GSK-3β 8bp cell line and flow cytometry (Figures 6 and 7)] suggesting that GSK-3β protects against IFN-γ-induced apoptosis. We also observed that the number of live GSK-3β 31bp mutant cells present after incubation with 1000 U/ml IFN-γ for 48 hours was significantly lower relative to the wild type HAP1 cells (Figure 2) again suggesting that lack, or reduced levels, of GSK-3β predisposes the CML cells to IFN-γ-induced death. Finally, there was a dramatic effect of GSK-3β knock down on the sensitivity of the CML cells to shear post-treatment with IFN-γ (Figure 3). The wild type HAP1 cells remained firmly adherent to the substrate under fluid force, while over 80% of the GSK-3β 31bp cells were removed from the substrate by fluid force post-incubation with IFN-γ for 48 hours suggesting that the cells became less adherent through apoptosis and/or necrosis. Note that GSK-3β 31bp cells not treated with IFN-γ did not have shear sensitivity and behaved in a similar manner to the wild type HAP1 cells (Figure 3). Combined, all of the data suggest that IFN-γ induces modest apoptosis of haploid CML cells and this effect is augmented by loss of GSK-3β. Note that we did investigate the effect of IFN-γ on necrosis. The image analysis did indicate that IFN-γ-induced necrosis was augmented in the GSK-3β 31bp cells relative to HAP1 cells (data not shown). In contrast, the flow cytometric analysis did not reveal a significant augmentation of necrosis of the GSK-3β 8bp cells relative to the HAP1 cells (data not shown).
Given these results, the connection between IFN-γ and GSK-3β needs to be considered further. It is informative to recognize that IFN-γ has been implicated in being pro-apoptotic in the cancer cell setting. A comprehensive review of IFN-γ’s roles in cancer has been provided by Castro et al. [8] and, most relevant to this discussion, is their review of the literature related to apoptosis. The authors cite studies that report IFN-γ promoting apoptosis via mechanisms involving caspases (1,3 and 8) [33,34], Fas and Fas ligand [35] and TNF-related apoptosis-inducing ligand (TRAIL) [36,37]. Determining if each of these possible mechanisms, or others not cited, are involved with connections between GSK-3β and IFN-γ will take a fairly involved effort. That said, it is insightful to consider in greater detail GSK-3 and Fas/Fas ligand, since Xia et al. [9], reported that IFN-γ induces apoptosis in a diploid CML cell line via the Fas signaling pathway.
GSK-3’s pro- and anti-apoptotic roles have been recognized for over a decade. Indeed in 2006, Beurel and Jope [23] provided an excellent review of this topic where they ascribed the anti-apoptotic effects to be primarily involved with the extrinsic apoptotic pathway involving TNF, TRAIL and Fas. In regard to Fas, Song et al. [24], found that lithium (a known GSK-3 inhibitor), as well as other GSK-3 inhibitors potentiated Fas-induced apoptosis of Jurkat cells (a human T lymphocyte cancer line). Combining these observations suggests the following hypothesis: IFN-γ treatment of CML cells induces a low level of apoptosis through upregulation of Fas/Fas ligand (a conjecture supported by Xia et al. [9]). When GSK-3 is active, it inhibits the generation of Fas/Fas ligand by the CML cells thus diminishing this extrinsic apoptotic response (a conjecture supported by Song et al. [24]). Knock down (or knock out) of GSK-3β potentiates a cellular response to the extrinsic apoptotic pathway and thus, addition of IFN-γ increases the level of apoptosis in GSK-3β knocked down cells (Figures 4,6,7).
In conclusion, we have found that IFN-γ induces a relatively low level of apoptosis in a model CML cell line. Genetic knock down of GSK-3β greatly increases IFN-γ-induced apoptosis suggesting that GSK-3β is germane to CML and therapeutic approaches to CML.
Supplementary Material
Highlights.
Role of IFN-γ in apoptosis of Chronic Myelogenous/Myeloid Leukemia (CML) is unclear
Glycogen synthase kinase–3 (GSK-3) has been implicated in cell death and survival
IFN-γ induces modest apoptosis in a CML cell line
CML cells in which GSK-3β is knocked down exhibited enhanced IFN-γ induced apoptosis
Suggests GSK-3β protects against IFN-γ induced apoptosis of CML cells
5. Acknowledgement
This research was supported by a United States National Institutes of Health grant (NIH R15GM110602-01A1 to DJG/KDM). The authors would like to thank Dr. Christian Showalter and Nicholas Cellars (both at Ohio University) for their help with the microscopy studies.
Footnotes
Publisher's Disclaimer: This is a PDF file of an unedited manuscript that has been accepted for publication. As a service to our customers we are providing this early version of the manuscript. The manuscript will undergo copyediting, typesetting, and review of the resulting proof before it is published in its final form. Please note that during the production process errors may be discovered which could affect the content, and all legal disclaimers that apply to the journal pertain.
6. References
- [1].Leukemia - Chronic Myeloid - CML - Statistics, Cancer.Net (2012). https://www.cancer.net/cancer-types/leukemia-chronic-myeloid-cml/statistics (accessed October 25, 2019). [Google Scholar]
- [2].Sawyers CL, Chronic Myeloid Leukemia, New England Journal of Medicine 340 (1999) 1330–1340. 10.1056/NEJM199904293401706. [DOI] [PubMed] [Google Scholar]
- [3].Held SAE, Heine A, Kesper AR, Schönberg K, Beckers A, Wolf D, Brossart P, Interferon gamma modulates sensitivity of CML cells to tyrosine kinase inhibitors, Oncoimmunology 5 (2015). 10.1080/2162402X.2015.1065368. [DOI] [PMC free article] [PubMed] [Google Scholar]
- [4].Kennedy JA, Hobbs G, Tyrosine Kinase Inhibitors in the Treatment of Chronic-Phase CML: Strategies for Frontline Decision-making, Curr Hematol Malig Rep 13 (2018) 202–211. 10.1007/s11899-018-0449-7. [DOI] [PMC free article] [PubMed] [Google Scholar]
- [5].Schurch C, Riether C, Amrein MA, Ochsenbein AF, Cytotoxic T cells induce proliferation of chronic myeloid leukemia stem cells by secreting interferon-gamma., J Exp Med 210 (2013) 605–621. 10.1084/jem.20121229. [DOI] [PMC free article] [PubMed] [Google Scholar]
- [6].Schroder K, Hertzog PJ, Ravasi T, Hume DA, Interferon-γ: an overview of signals, mechanisms and functions, Journal of Leukocyte Biology 75 (2004) 163–189. 10.1189/jlb.0603252. [DOI] [PubMed] [Google Scholar]
- [7].Suk K, Chang I, Kim Y-H, Kim S, Kim JY, Kim H, Lee M-S, Interferon γ (IFNγ) and Tumor Necrosis Factor α Synergism in ME-180 Cervical Cancer Cell Apoptosis and Necrosis: IFNγ inhibits cytoprotective NF-κB through STAT1/IRF-1 pathways, J. Biol. Chem 276 (2001) 13153–13159. 10.1074/jbc.M007646200. [DOI] [PubMed] [Google Scholar]
- [8].Castro F, Cardoso AP, Gonçalves RM, Serre K, Oliveira MJ, Interferon-Gamma at the Crossroads of Tumor Immune Surveillance or Evasion, Frontiers in Immunology 9 (2018) 847 10.3389/fimmu.2018.00847. [DOI] [PMC free article] [PubMed] [Google Scholar]
- [9].Xia H-L, Li C-J, Hou X-F, Zhang H, Wu Z-H, Wang J, Interferon-gamma affects leukemia cell apoptosis through regulating Fas/FasL signaling pathway., Eur Rev Med Pharmacol Sci 21 (2017) 2244–2248. [PubMed] [Google Scholar]
- [10].Noori MS, Bhatt PM, Courreges MC, Ghazanfari D, Cuckler C, Orac CM, McMills MC, Schwartz FL, Deosarkar SP, Bergmeier SC, McCall KD, Goetz DJ, Identification of a Novel Selective and Potent Inhibitor of Glycogen Synthase Kinase-3, American Journal of Physiology-Cell Physiology 317 (2019) C1289–C1303. 10.1152/ajpcell.00061.2019. [DOI] [PMC free article] [PubMed] [Google Scholar]
- [11].Noori MS, Courreges MC, Bergmeier SC, McCall KD, Goetz DJ, Modulation of LPS-Induced Inflammatory Cytokine Production by a Novel Glycogen Synthase Kinase-3 Inhibitor, Eur J Pharmacol 883 (2020) 10.1016/j.ejphar.2020.173340. [DOI] [PMC free article] [PubMed] [Google Scholar]
- [12].Woodgett JR, Molecular cloning and expression of glycogen synthase kinase-3/factor A., EMBO J 9 (1990) 2431–2438. [DOI] [PMC free article] [PubMed] [Google Scholar]
- [13].McCubrey JA, Steelman LS, Bertrand FE, Davis NM, Sokolosky M, Abrams SL, Montalto G, D’Assoro AB, Libra M, Nicoletti F, Maestro R, Basecke J, Rakus D, Gizak A, Demidenko Z, Cocco L, Martelli AM, Cervello M, GSK-3 as potential target for therapeutic intervention in cancer, Oncotarget 5 (2014) 2881–2911. [DOI] [PMC free article] [PubMed] [Google Scholar]
- [14].Embi N, Rylatt DB, Cohen P, Glycogen Synthase Kinase-3 from Rabbit Skeletal Muscle, European Journal of Biochemistry 107 (1980) 519–527. [PubMed] [Google Scholar]
- [15].Manning G, Whyte DB, Martinez R, Hunter T, Sudarsanam S, The Protein Kinase Complement of the Human Genome, Science 298 (2002) 1912–1934. 10.1126/science.1075762. [DOI] [PubMed] [Google Scholar]
- [16].Sutherland C, What Are the bona fide GSK3 Substrates?, International Journal of Alzheimer’s Disease 2011 (2011) 1–23. 10.4061/2011/505607. [DOI] [PMC free article] [PubMed] [Google Scholar]
- [17].Linding R, Jensen LJ, Ostheimer GJ, van Vugt MATM, Jørgensen C, Miron IM, Diella F, Colwill K, Taylor L, Elder K, Metalnikov P, Nguyen V, Pasculescu A, Jin J, Park JG, Samson LD, Woodgett JR, Russell RB, Bork P, Yaffe MB, Pawson T, Systematic Discovery of In Vivo Phosphorylation Networks, Cell 129 (2007) 1415–1426. 10.1016/j.cell.2007.05.052. [DOI] [PMC free article] [PubMed] [Google Scholar]
- [18].Jope RS, Yuskaitis CJ, Beurel E, Glycogen Synthase Kinase-3 (GSK3): Inflammation, Diseases, and Therapeutics, Neurochemical Research 32 (2007) 577–595. 10.1007/s11064-006-9128-5. [DOI] [PMC free article] [PubMed] [Google Scholar]
- [19].Jacobs KM, Bhave SR, Ferraro DJ, Jaboin JJ, Hallahan DE, Thotala D, GSK-3: A Bifunctional Role in Cell Death Pathways, International Journal of Cell Biology 2012 (2012) 1–11. 10.1155/2012/930710. [DOI] [PMC free article] [PubMed] [Google Scholar]
- [20].Diehl JA, Cheng M, Roussel MF, Sherr CJ, Glycogen synthase kinase-3β regulates cyclin D1 proteolysis and subcellular localization, Genes Dev 12 (1998) 3499–3511. 10.1101/gad.12.22.3499. [DOI] [PMC free article] [PubMed] [Google Scholar]
- [21].Meares GP, Jope RS, Resolution of the Nuclear Localization Mechanism of Glycogen Synthase Kinase-3: Functional effects in apoptosis, J. Biol. Chem 282 (2007) 16989–17001. 10.1074/jbc.M700610200. [DOI] [PMC free article] [PubMed] [Google Scholar]
- [22].Götschel F, Kern C, Lang S, Sparna T, Markmann C, Schwager J, McNelly S, von Weizsäcker F, Laufer S, Hecht A, Merfort I, Inhibition of GSK3 differentially modulates NF-κB, CREB, AP-1 and β-catenin signaling in hepatocytes, but fails to promote TNF-α-induced apoptosis, Experimental Cell Research 314 (2008) 1351–1366. 10.1016/j.yexcr.2007.12.015. [DOI] [PubMed] [Google Scholar]
- [23].Beurel E, Jope RS, The paradoxical pro- and anti-apoptotic actions of GSK3 in the intrinsic and extrinsic apoptosis signaling pathways., Prog Neurobiol 79 (2006) 173–189. 10.1016/j.pneurobio.2006.07.006. [DOI] [PMC free article] [PubMed] [Google Scholar]
- [24].Song L, Zhou T, Jope RS, Lithium facilitates apoptotic signaling induced by activation of the Fas death domain-containing receptor., BMC Neurosci 5 (2004) 20 10.1186/1471-2202-5-20. [DOI] [PMC free article] [PubMed] [Google Scholar]
- [25].Tsai C-C, Kai J-I, Huang W-C, Wang C-Y, Wang Y, Chen C-L, Fang Y-T, Lin Y-S, Anderson R, Chen S-H, Tsao C-W, Lin C-F, Glycogen Synthase Kinase-3β Facilitates IFN-γ-Induced STAT1 Activation by Regulating Src Homology-2 Domain-Containing Phosphatase 2, The Journal of Immunology 183 (2009) 856–864. 10.4049/jimmunol.0804033. [DOI] [PubMed] [Google Scholar]
- [26].KBM-7, (n.d.). https://www.ebi.ac.uk/ols/ontologies/efo/terms?short_form=EFO_0005903 (accessed January 8, 2020).
- [27].Carette JE, Raaben M, Wong AC, Herbert AS, Obernosterer G, Mulherkar N, Kuehne AI, Kranzusch PJ, Griffin AM, Ruthel G, Cin PD, Dye JM, Whelan SP, Chandran K, Brummelkamp TR, Ebola virus entry requires the cholesterol transporter Niemann-Pick C1, Nature 477 (2011) 340–343. 10.1038/nature10348. [DOI] [PMC free article] [PubMed] [Google Scholar]
- [28].Marzi I, Cipolleschi MG, D’Amico M, Stivarou T, Rovida E, Vinci MC, Pandolfi S, Dello Sbarba P, Stecca B, Olivotto M, The involvement of a Nanog, Klf4 and c-Myc transcriptional circuitry in the intertwining between neoplastic progression and reprogramming, Cell Cycle 12 (2013) 353–364. 10.4161/cc.23200. [DOI] [PMC free article] [PubMed] [Google Scholar]
- [29].Horizon, Horizon product information for GSK3B knockout cell line, (2020). https://horizondiscovery.com/-/media/Files/Horizon/resources/Data%20Sheets/15/HZGHC000007c011_DataSheet.pdf (accessed April 7, 2020).
- [30].Anderson EM, Haupt A, Schiel JA, Chou E, Machado HB, Strezoska Ž, Lenger S, McClelland S, Birmingham A, Vermeulen A, van BA. Smith, Systematic analysis of CRISPR–Cas9 mismatch tolerance reveals low levels of off-target activity, Journal of Biotechnology 211 (2015) 56–65. 10.1016/j.jbiotec.2015.06.427. [DOI] [PubMed] [Google Scholar]
- [31].Wen LP, Fahrni JA, Troie S, Guan JL, Orth K, Rosen GD, Cleavage of focal adhesion kinase by caspases during apoptosis., J Biol Chem 272 (1997) 26056–26061. 10.1074/jbc.272.41.26056. [DOI] [PubMed] [Google Scholar]
- [32].Muljo SA, Ansel KM, Kanellopoulou C, Livingston DM, Rao A, Rajewsky K, Aberrant T cell differentiation in the absence of Dicer., J Exp Med 202 (2005) 261–269. 10.1084/jem.20050678. [DOI] [PMC free article] [PubMed] [Google Scholar]
- [33].Fulda S, Debatin K-M, IFNgamma sensitizes for apoptosis by upregulating caspase-8 expression through the Stat1 pathway., Oncogene 21 (2002) 2295–2308. 10.1038/sj.onc.1205255. [DOI] [PubMed] [Google Scholar]
- [34].Chin YE, Kitagawa M, Kuida K, Flavell RA, Fu XY, Activation of the STAT signaling pathway can cause expression of caspase 1 and apoptosis., Mol Cell Biol 17 (1997) 5328–5337. 10.1128/mcb.17.9.5328. [DOI] [PMC free article] [PubMed] [Google Scholar]
- [35].Xu X, Fu XY, Plate J, Chong AS, IFN-gamma induces cell growth inhibition by Fas-mediated apoptosis: requirement of STAT1 protein for up-regulation of Fas and FasL expression., Cancer Res 58 (1998) 2832–2837. [PubMed] [Google Scholar]
- [36].Takeda K, Smyth MJ, Cretney E, Hayakawa Y, Kayagaki N, Yagita H, Okumura K, Critical role for tumor necrosis factor-related apoptosis-inducing ligand in immune surveillance against tumor development., J Exp Med 195 (2002) 161–169. 10.1084/jem.20011171. [DOI] [PMC free article] [PubMed] [Google Scholar]
- [37].Liu F, Hu X, Zimmerman M, Waller JL, Wu P, Hayes-Jordan A, Lev D, Liu K, TNFalpha cooperates with IFN-gamma to repress Bcl-xL expression to sensitize metastatic colon carcinoma cells to TRAIL-mediated apoptosis., PLoS One 6 (2011) e16241 10.1371/journal.pone.0016241. [DOI] [PMC free article] [PubMed] [Google Scholar]
Associated Data
This section collects any data citations, data availability statements, or supplementary materials included in this article.