Figure 4.

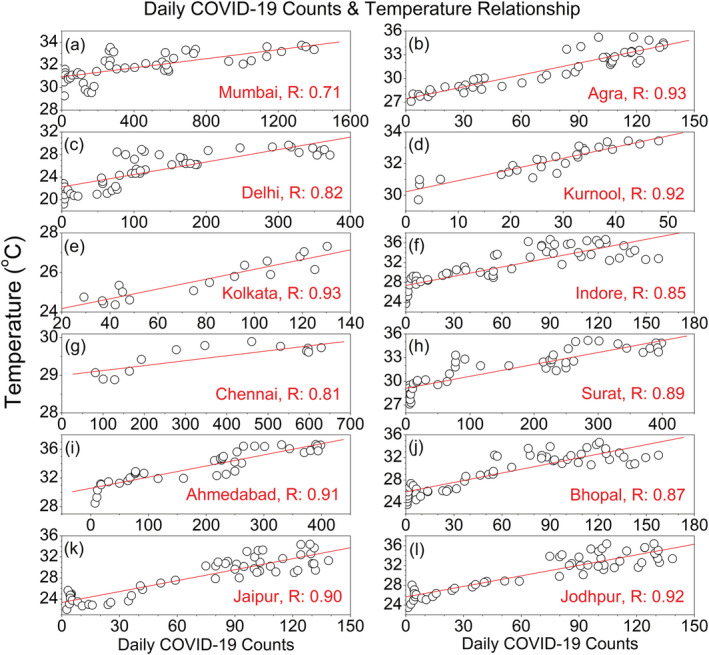
Daily COVID‐19 counts as a function of T (2 m) over 12 epicenters in India. The red lines in each subplot indicate the linear fit curve.

Daily COVID‐19 counts as a function of T (2 m) over 12 epicenters in India. The red lines in each subplot indicate the linear fit curve.