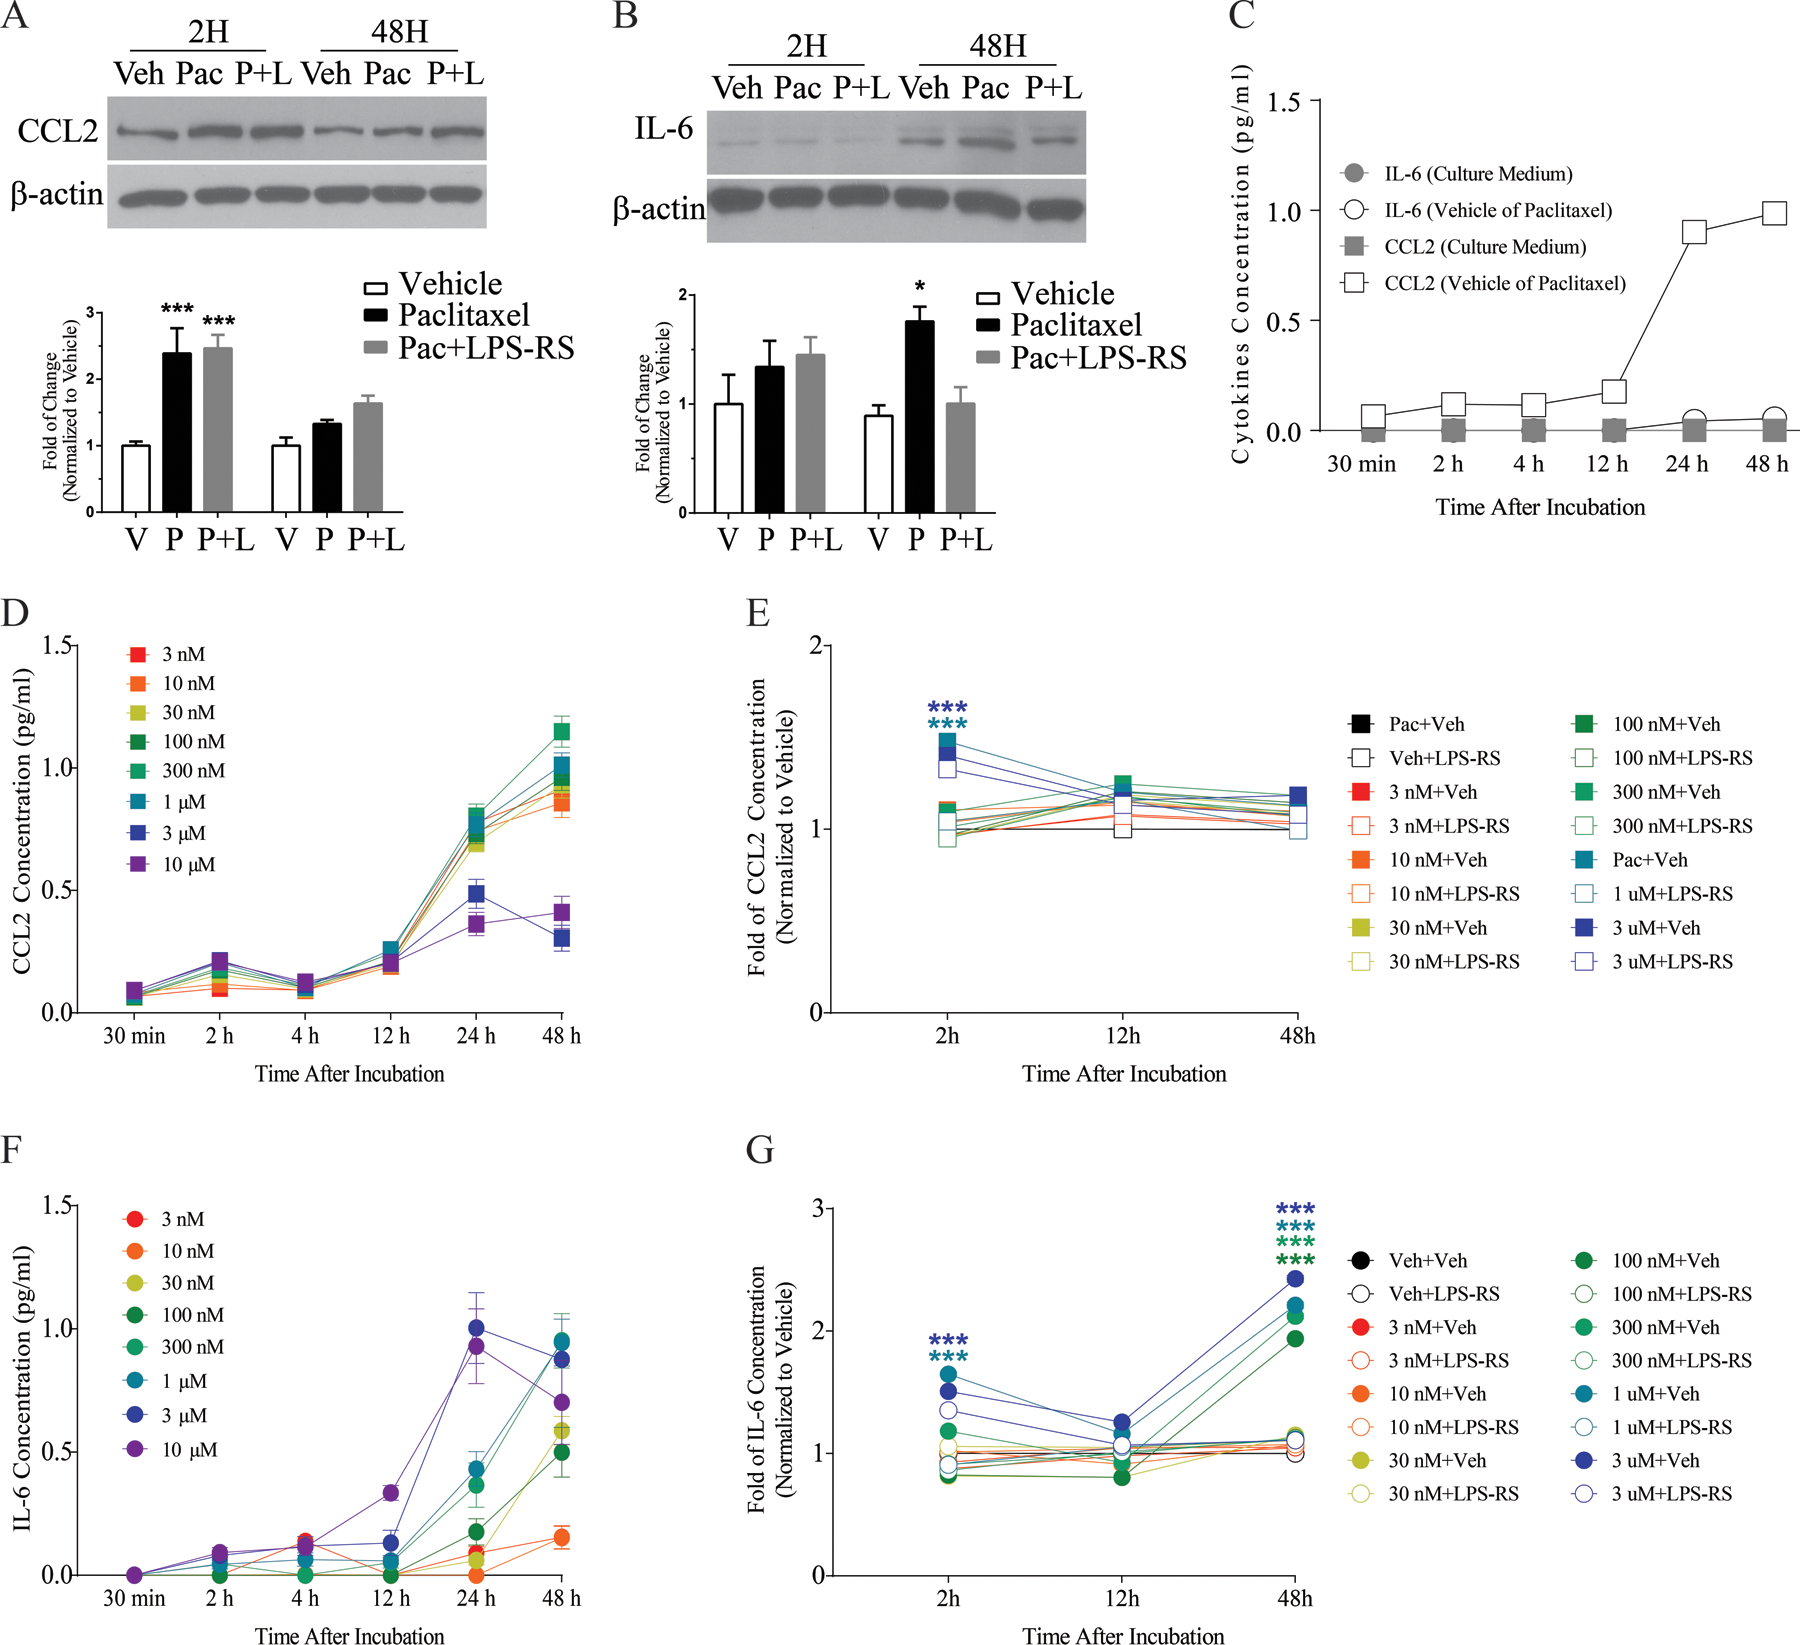
Figure 1.

The representative Western blot images and corresponding bar graph summaries illustrate changes in CCL2 (A) and IL-6 (B) expression in primary DRG culture at 2 h and 48 h after paclitaxel (300 nM) incubation. The bar graph in (A) shows that CCL2 was significantly increased in the paclitaxel-treated culture (black bar) compared with the vehicle-treated culture (white bar) at 2 h and that co-treatment of LPS-RS (2μg/ml) with paclitaxel (grey bar) did not eliminate this paclitaxel-induced upregulation (N=3/group/time point). No significant change in expression of CCL2 was observed at 48 h in paclitaxel-treated culture compared with vehicle-treated culture (A). The representative Western blot image and bar graph in (B) illustrate changes in IL-6 expression in primary DRG culture at 2 h and 48 h after paclitaxel (300nM) treatment (N=3/group/time point). The bar graph shows that the change of IL-6 was significantly increased in the paclitaxel-treated culture (black bar) compared with the vehicle-treated culture (white bar) at 48 h and that co-treatment of LPS-RS with paclitaxel (grey bar) blocked paclitaxel-induced upregulation of IL-6. No significant change in expression of IL-6 was observed in the 2 h paclitaxel-treated culture compared with vehicle-treated culture (B). The concentration of CCL2 and IL-6 from ELISA experiments in culture media treated with different paclitaxel doses at different time points is represented in the line and scatter plots (C-G, N=6/concentration/time point). C shows the concentration of CCL2 and IL-6 release from vehicle only or culture medium, where CCL2 was significantly elevated after vehicle treatment at 24 and 48 h. D shows that a significant amount of CCL2 (pg/ml) was released in DRG culture after paclitaxel treatment (1, 3 and 10 μM) compared with vehicle treatment at 2 h and there was no significant difference in the concentration of CCL2 released at the 48 h time point for any dose of paclitaxel compared with vehicle treatment. Cultures co-treated with paclitaxel and LPS-RS demonstrated a significantly lower fold change of CCL2 release compared with paclitaxel alone at the 2 h time point (E). Data from ELISA experiments is represented in F and G, and F shows a significant increase in the concentration of IL-6 released in primary DRG cultures treated with paclitaxel (30, 100, 300 nM and 1, 3, 10 μM) for 48 h compared with cultures treated with vehicle for 48 h. Cultures co-treated with paclitaxel and LPS-RS demonstrated a significantly lower fold change in IL-6 concentration compared with paclitaxel alone at 48 h (G). There was no significant change in the concentration of IL-6 released at 2 h compared with vehicle treatment (F). *p<0.05, **p<0.01, ***p<0.001.
