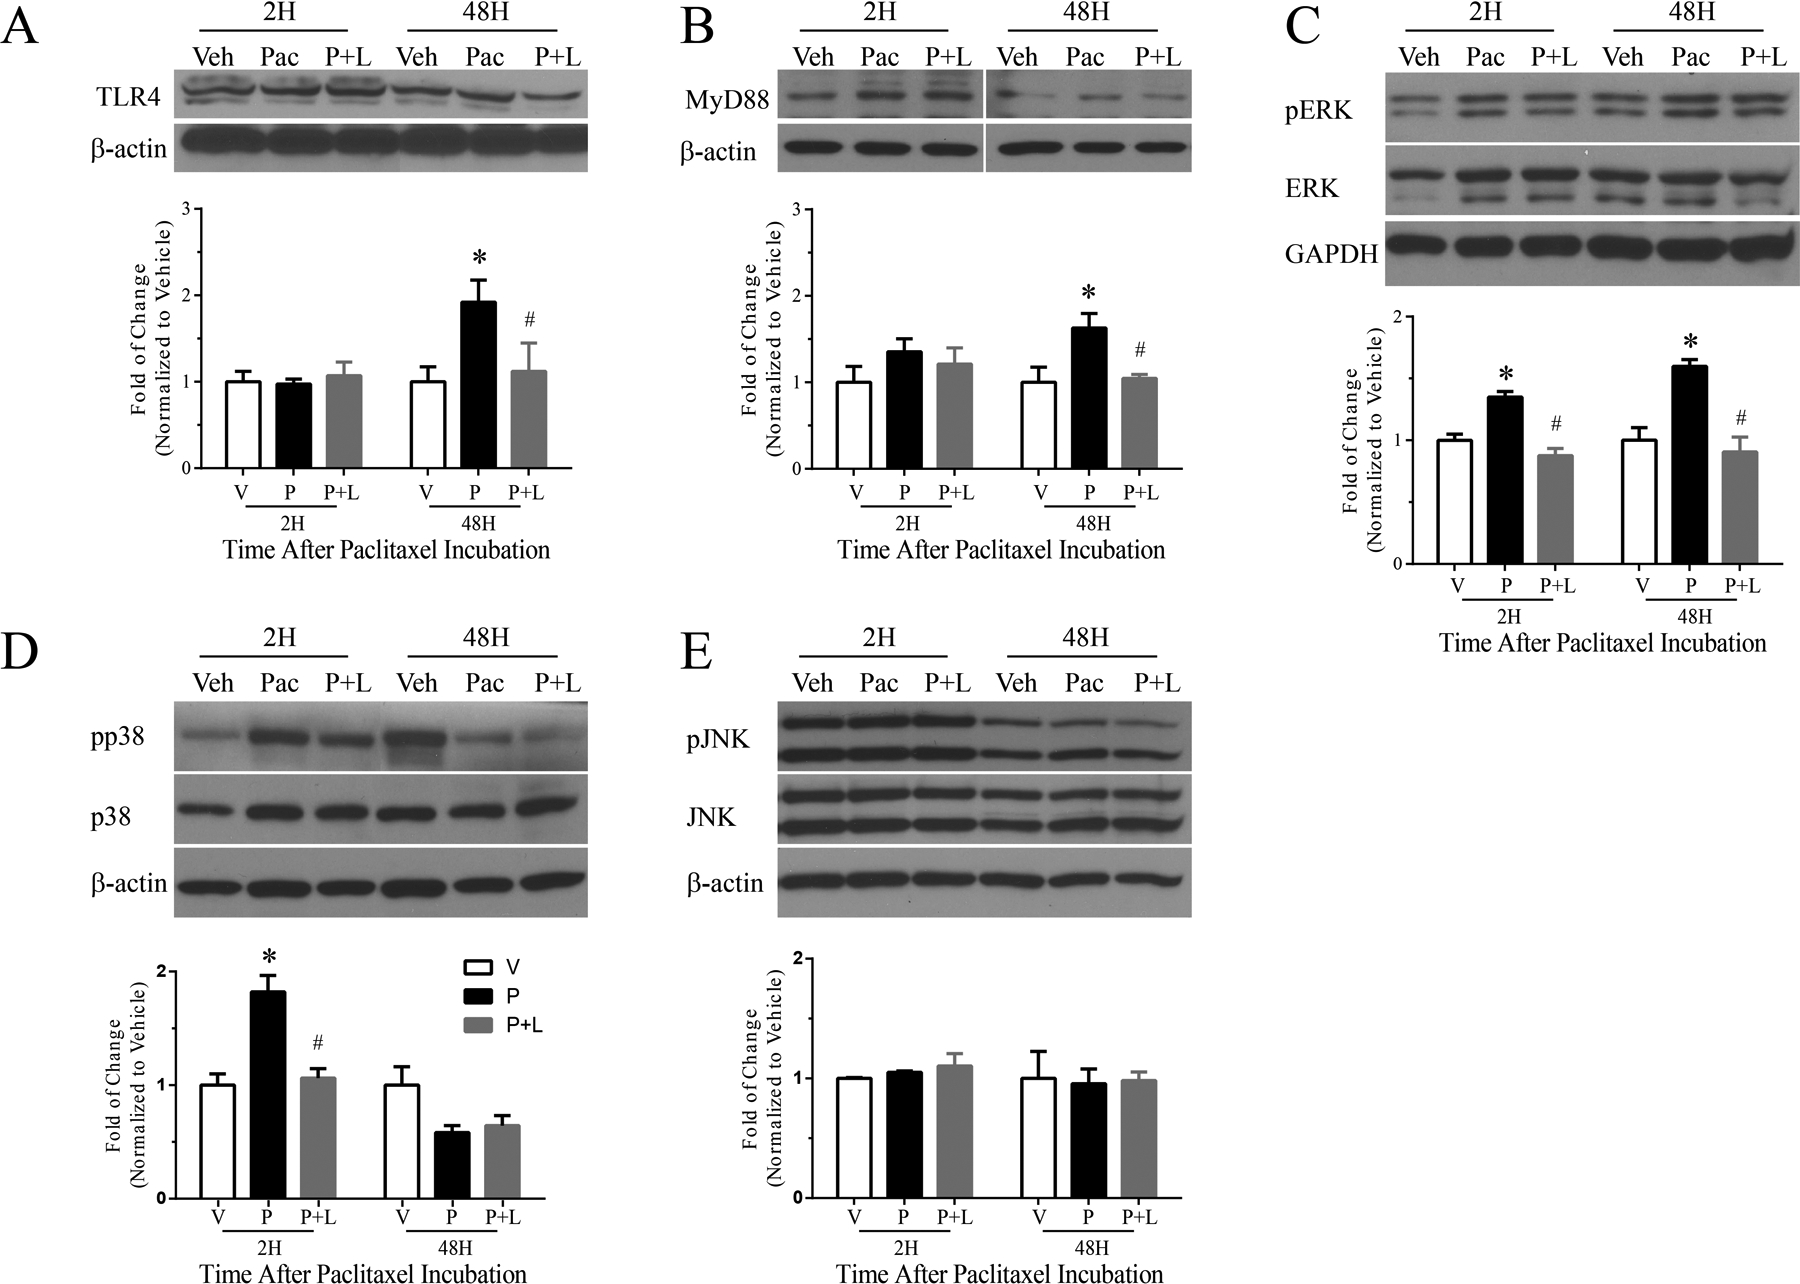
Figure 4.

The representative Western blot image and bar graph summary shown in (A) illustrate that the expression of TLR4 in primary DRG culture significantly increased 48 h after paclitaxel treatment (black bar) compared with vehicle-treated culture (white bar), there was no significant change in expression 2 h. LPS-RS co-treatment with paclitaxel (grey bars) prevented the increase in expression of TLR4 in culture incubated at 48 h. The representative Western blot image and bar graph summary shown in (B) similarly show that expression of MyD88 in primary DRG culture significantly increased 48 h after paclitaxel treatment (black bar) compared to vehicle-treated culture (white bar), but no significant increase in MyD88 expression was observed at 2 h. MyD88 expression in cultures co-treated with LPS-RS and paclitaxel (grey bar) was significantly lower than in cultures treated with paclitaxel alone (black bar) 48 h after treatment. The representative Western blot image and bar graph summary in (C) shows the expression pERK is upregulated at both 2 and 48 h after paclitaxel treatment compared to vehicle-treated cultures and the upregulations were prevented by co-treatment with LPS-RS. The expression of pp38 was significantly increased only at 2 h of paclitaxel treatment and this was prevented by co-treatment with LPS-RS (D). There was no significant change in the expression of pJNK at either 2 or 48 h after paclitaxel treatment compared to that observed in vehicle-treated cultures (E). All bar graphs show fold change normalized to vehicle. *p<0.05 versus vehicle; #p<0.05 versus paclitaxel (N=4/group/time point for all experiments).
