

Abstract
The in vitro differentiation of insulin-producing β-like cells can model aspects of human pancreatic development. Here we generate 95,308 single cell transcriptomes and reconstruct a lineage tree of the entire differentiation process from hESCs to β-like cells to study temporally regulated genes during differentiation. We identify so-called ‘switch genes’ at the branch point of endocrine/non-endocrine cell fate choice, revealing insights into the mechanisms of differentiation promoting reagents, such as NOTCH and ROCKII inhibitors, and providing improved differentiation protocols. Over 20% of all detectable genes are activated multiple times during differentiation, even though their enhancer activation is usually unimodal, indicating extensive gene reuse driven by different enhancers. We also identify a stage-specific enhancer in the TCF7L2 diabetes GWAS locus that drives a transient wave of gene expression in pancreatic progenitors. Finally, we develop a web app to visualize gene expression on the lineage tree, providing a comprehensive single cell data resource for researchers studying islet biology and diabetes.
One major hope for diabetes therapy is to generate many functional, transplantable β-cells from patient-derived pluripotent cells. In the past decade, a few in vitro protocols have been developed to differentiate human embryonic stem cells (hESCs) into pancreatic progenitor cells, and further into functional β-like cells; these cells can be transplanted into mice, mature into glucose-responsive insulin-producing cells in vivo, and prevent or reverse diabetes1–5. These studies also established that the in vitro β-cell differentiation process largely recapitulates key developmental stages in vivo based on the sequential expression of various developmental markers. Therefore, the stem cell system is also a fantastic tool for the study of human pancreatic development.
Current protocols for the directed β-cell differentiation still have some limitations. (i) The differentiation generates heterogenous cell populations; (ii) Differentiation efficiency can be highly variable between different hESC or iPSC lines6. (iii) The resulting β-like cells are still not fully equivalent to primary β-cells at molecular and physiological levels1,7,8. Protocol improvement can clearly benefit from better understanding of cell fate choices and β-cell maturation during differentiation. To overcome the cellular heterogeneity issues, single-cell RNA-seq technologies have been used to study the directed β-cell differentiation, with hESC or hiPSC lines possessing high differentiation propensity toward pancreatic lineage9,10. However, although these recent papers made a number of important discoveries, they lacked a global picture of molecular events during the cell-fate choices along the entire differentiation process, especially those in undesired non-endocrine lineages that may significantly affect the differentiation efficiency in low-efficiency hESC lines.
In order to fill this gap, here we intentionally perform the differentiation with a relatively low-efficiency hESC line (H1) under a standard 7-stage protocol5, featuring mediocre β-cell yield and significantly increased cellular heterogeneity. This provides enough cell coverage to analyze both desired and divergent lineages in cell fate determination. We generated transcriptome data from 95,308 single cells with Drop-Seq11 and computationally reconstructed the entire lineage tree to systematically reveal the differentiation programs and lineage branches. We demonstrated that this data resource is highly valuable for the study of islet biology and diabetes.
Results
A time-series single cell transcriptomic atlas during pancreatic β cell differentiation
We profiled the single cell transcriptomes during the differentiation of H1 cells with a previously published 7-stage protocol (Extended Data Fig. 1a)5. The functionality of the resulting β-like cells was confirmed with glucose-induced insulin secretion (GSIS) assay (Extended Data Fig. 1b). We collected data from 87,769 single cells across 12 time points and clustered the cells from every time point into populations (Fig. 1a, c, data QC summary in Supplementary Data 1). The cultures were rather homogeneous before S4 (pancreatic progenitors, or PP), but became much more heterogenous during later stages (Fig. 1a). Therefore, starting from S4, we performed two rounds of unsupervised clustering: the first round clustering defined endocrine and non-endocrine cell populations with endocrine marker genes NEUROD1, CPE, and CHGA (Fig. 1a, Extended Data Fig. 2a–b); the second round clustering further identified more sub-populations. We identified marker genes for all cell populations in each stage and reported them in Supplementary Fig. 1–2 (Methods, and full list in Supplementary Data 1) including surface markers (Supplementary Fig. 3).
Fig. 1: A single cell transcriptomic atlas of directed β-cell differentiation.
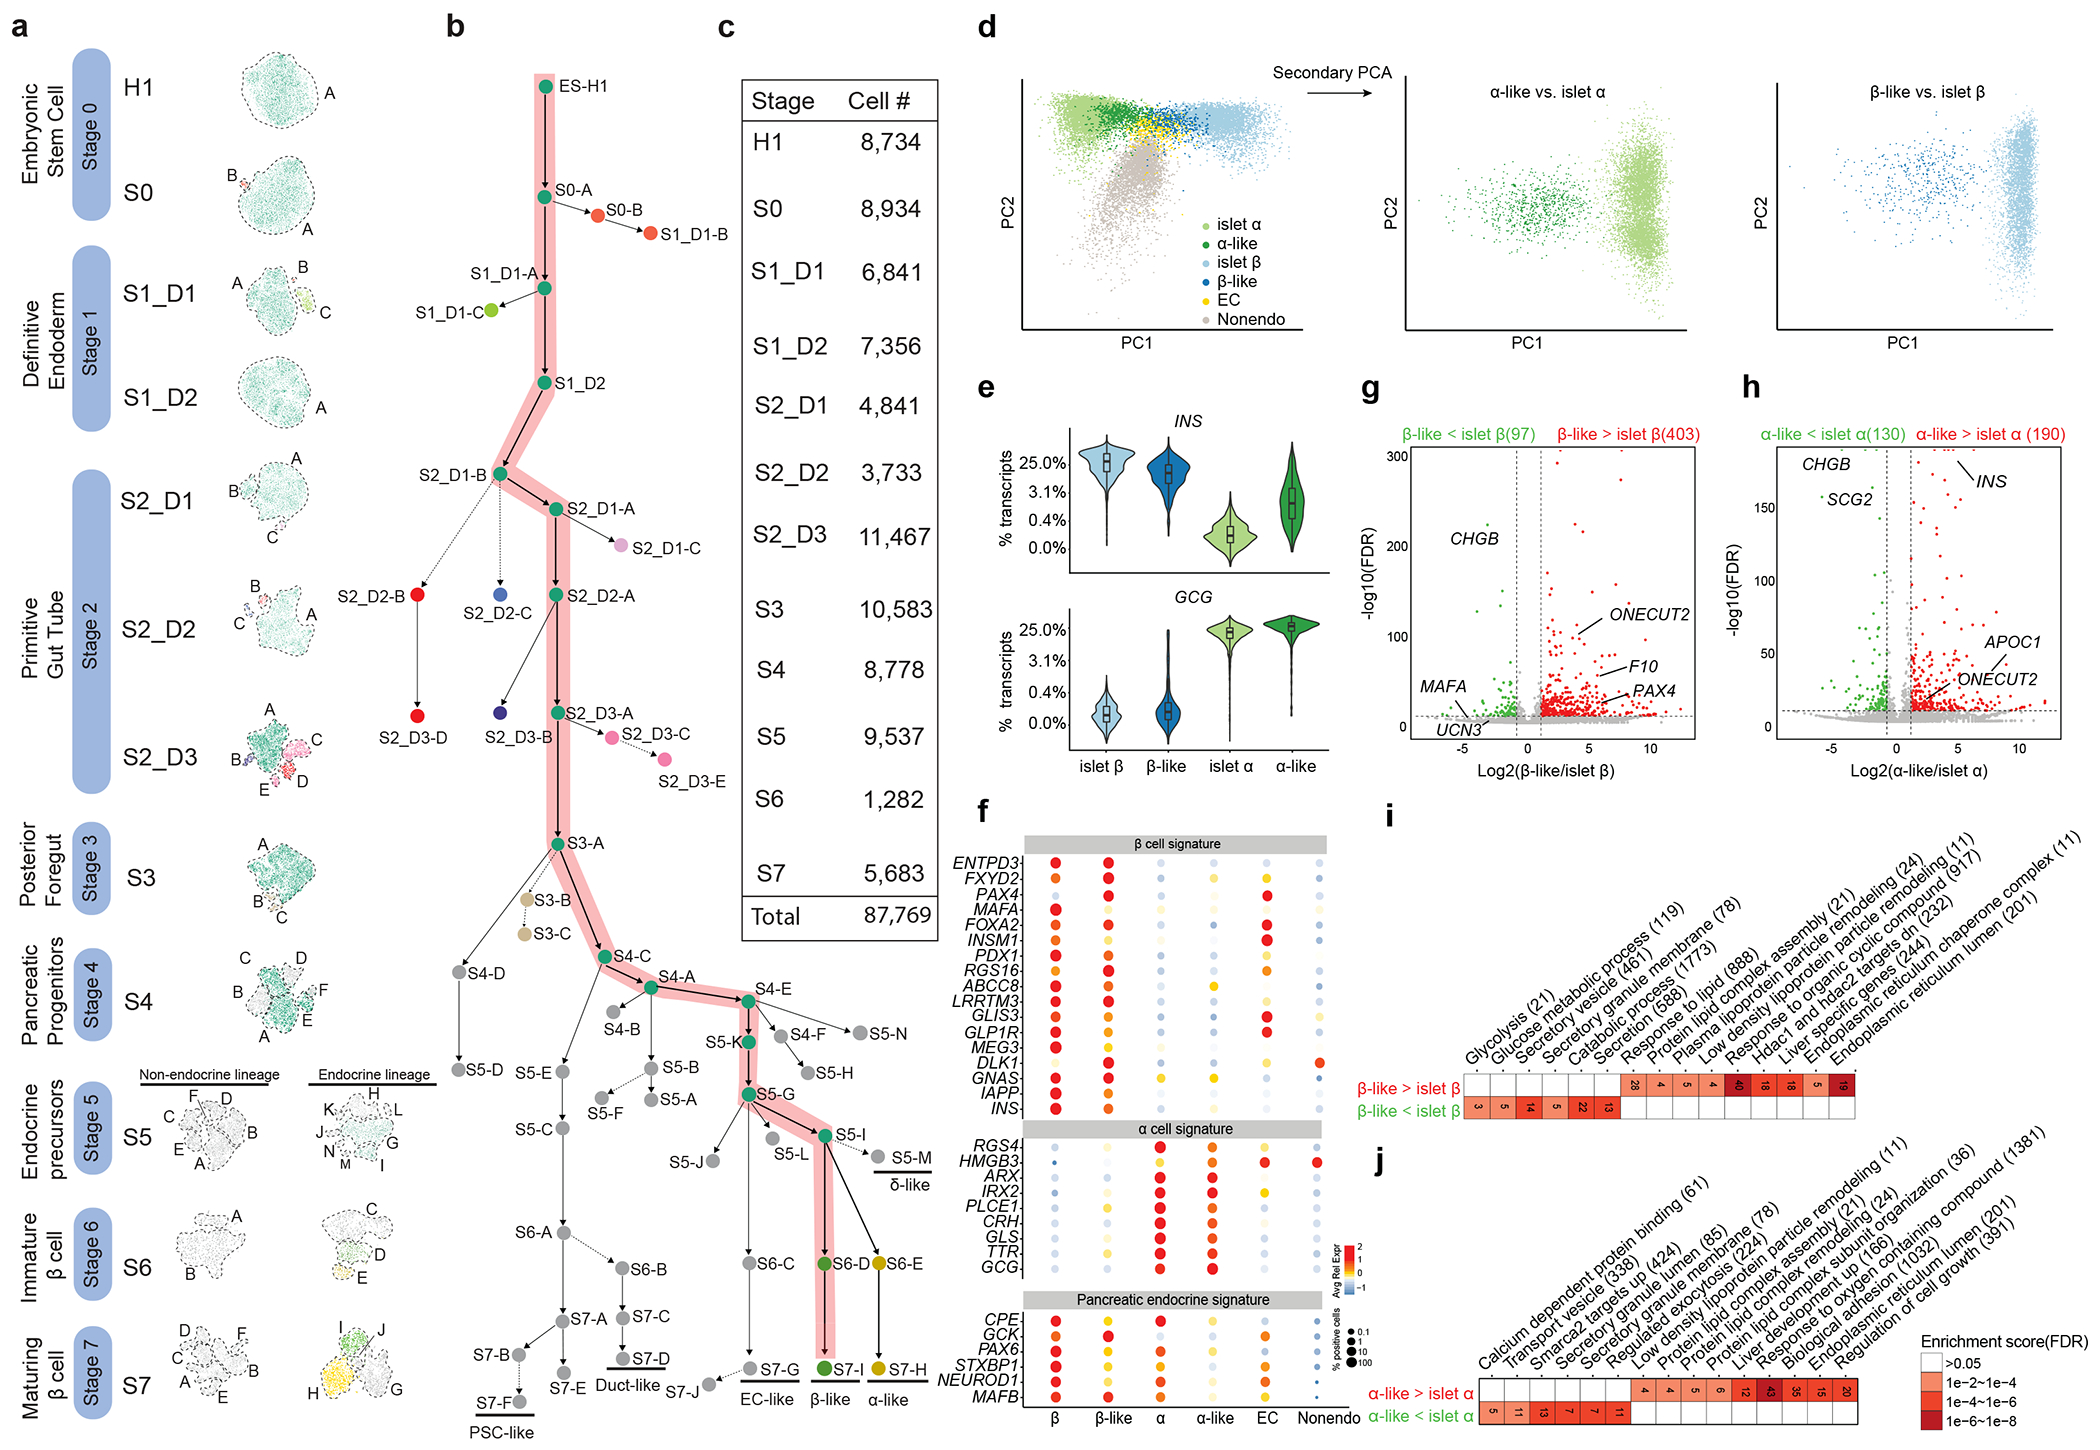
(a) Unsupervised clustering of cells from each time point in tSNE plots. The developmental stages are shown in the left bar. For instance, S1_D1 stands for stage 1 day 1. Cell clusters are marked by dashed lines and named in alphabetical order. (b) Lineage tree reconstruction. Each dot represents a cell cluster in panel A. Highlighted is the desired β-cell lineage. (c) A summary of cell numbers in each time point. (d) Two-step PCA analysis. Left panel: 1st step PCA of primary islet α and β together with all the S7 cells. Middle panel: 2nd step PCA of β-like and primary islet β cells. Right panel: 2nd step PCA of α-like and primary islet α cells. (e) Compare INS and GCG expression in the α- or β-like cells to the primary endocrine cells. (n= 3953, 421, 5700, 732 single cells for islet- β, β-like, islet- α, α-like respectively). Boxplots are shown within the violin plots, where the middle line is the median, the lower and upper hinges correspond to the first and third quartiles, the upper whisker extends from the hinge to the largest value no further than 1.5×IQR from the hinge, the lower whisker extends from the hinge to the smallest value at most 1.5×IQR of the hinge (IQR is the inter-quartile range) (f) Bubble plot of endocrine signature genes in different populations. Color intensity indicates the Z score of averaged expression levels; bubble size indicates the percentage of expressing cells. (g-h) Volcano plots comparing the expression of β-like vs. primary β-cells (g), and α-like vs. primary α-cells (h). (i-j) GSEA analyses of differentially expressed genes identified from g-h. Gene numbers of each terms are shown.
H1 hESC is not a high-yield line for directed β-cell differentiation. In the final stage (S7), ~35% (1,982) of the cells are endocrine cells, including a β-like (S7-I, 421 cells) and an α-like (S7-H, 732 cells) population (Fig. 1a, Extended Data Fig. 2d–e). Consistent with another recent single cell study10, we also observed an enterochromaffin cell (EC) population (S7-G, 829 cells) expressing endocrine markers genes CHGA, CHGB and NEUROD1 but neither INS nor GCG. This population indeed expresses EC markers TPH1, DDC, SLC18A1, ADRA2A, LMX1A, and CXCL14 (Fig. 1a, Extended Data Fig. 2f). Interestingly, we also observed another small endocrine population (S7-J) marked by CENPF, TOP2A (Fig. 1a, Extended Data Fig. 2g), suggesting that this is a proliferating endocrine cell population.
We also defined duct-like and pancreatic stellate cell (PSC)-like cells among the non-endocrine cell populations, and a δ-like cell population from S5 endocrine cells (Fig. 1b, Extended Data Fig. 1e). Notably, some believed that PSC is from mesodermal origin because lineage tracing studies in mice have confirmed that hepatic stellate cells (HSCs) are from mesenchymal cells, even though direct evidence for PSC is still lacking12. To confirm the observation of PSC-like cells, we re-analyzed an independent scRNA-seq dataset10, and also observed PSC-like cells expressing the same marker genes (COL6A3, COL1A2, ACTA2, COL3A1). Although our endoderm-endocrine differentiation system cannot properly model the mesodermal origins of PSCs, this observation may also reflect the heterogenous origins of PSCs12. Nevertheless, we illustrated a highly diversified cell atlas from the directed β-cell differentiation.
Benchmark the similarity between the differentiated and the primary islet cell populations
We firstly examined the molecular similarity between induced endocrine cells and primary human pancreatic α- or β-cells. We previously reported the transcriptome of 39,905 single human islet cells from 9 donors using the same single cell platform (Drop-Seq)13, offering an opportunity for robust comparison. We therefore pooled the S7 datasets and the published Drop-Seq data of primary human α and β cells for principle component analysis (PCA) after normalization (Fig. 1d). The first PC (PC1) clearly separated the primary α- and β-cells in this analysis, and as expected, α-like and β-like cells co-segregate with α- and β-cells, respectively. A majority of known endocrine marker genes are properly expressed in the α-like or β-like cells (Fig. 1d–f). However, the α-like and β-like cells are less separated on PC1, indicating that the expression of marker genes distinguishing α- and β-cells is not full-blown yet (Fig. 1d). To characterize other cell populations, we also performed the canonical correlation analysis (CCA) based co-embedding analysis to “anchor” the in vitro differentiated cell populations with the primary islet cells14. As expected, α-like, β-like, δ-like, duct-like, and PSC-like cells indeed co-clustered with their islet counterparts and properly expressed most of their signature genes (Extended Data Fig. 1c–e). Consistent with a previous study, EC-like cells are only present in the differentiation systems10 (Extended Data Fig. 1c–d).
A second round PCA can clearly separate induced endocrine cells from their counterparts in primary human islets (Fig. 1d). We found that both α-like and β-like cells express comparable levels of hormone genes as the primary endocrine cells (Fig. 1e). However, α-like cells express a significantly higher level of INS gene than primary α cells, consistent with previous reports of poly-hormonal cells from directed pancreatic differentiations10,15,16 and during human fetal pancreatic development17 (Fig. 1e). In contrast, β-like cells only express INS but not GCG. We identified hundreds of differentially expressed genes that distinguish the α-like or β-like cell from the primary endocrine cells (Fig. 1g–h, Supplementary Data 2). For example, PAX4 is overexpressed but MAFA is under-expressed in β-like cells (Fig. 1f, Extended Data Fig. 1e), which is reminiscent of a previous report that PAX4 may promote β-cell dedifferentiation and proliferation by repressing MAFA expression18. Gene Set Enrichment Analysis (GSEA) revealed that the α-like and β-like cells overexpress liver-specific genes and ER genes, but under-express secretory vesicle genes, consistent with a general concept that the stem cell derived endocrine cells are in a relatively immature progenitor state compared to primary cells5 (Fig. 1i–j).
Reconstruct a lineage tree for the highly branched pancreatic differentiation process
Most existing single cell trajectory inference algorithms only analyze linear or simple branching events within a short time window19. We found that existing unsupervised trajectory inference methods cannot properly recognize the entire time-series of our data. For example, Monocle320 called one branch connecting S0-S1 but incorrectly called another branch from S0 directly to S2 cells. This is because many S1-specific genes are inactive in both S0 and S2, leading to higher S0-S2 correlation than S1-S2 correlation (Extended Data Fig. 3a–c). We therefore developed a semi-supervised method to construct a lineage tree to investigate the cell fate choices following the time stamps. Briefly, after unsupervised clustering, we placed cell populations from 12 time points into 12 layers (global inference). In each iteration we only connect the cell populations from two neighboring layers (local inference) based on the distances between each other in high-dimensional PC space (Methods, Supplementary Fig. 4, 5). This strategy computationally reconstructed a lineage tree connecting all major cell populations identified from our data (Fig. 1b), which provides an intuitive map to trace the fate of each cell population over the entire differentiation process. Importantly, we found that for local inference, our method and Monocle3 defined very similar trajectories and identified the same trajectory genes (Extended Data Fig. 3d–i). This allowed us to investigate both the desired β-cell lineage (highlighted) and the divergent lineages shown as side branches in the lineage tree (Fig. 1b).
From the tree, it is clear that the divergent cell populations in early stages (S0~S3) do not contribute to the undesired cell populations in the final stage (S7) (Fig. 1b). Notably, a side branch from S4-C contributed to all the non-endocrine cell populations in S7 (Fig. 1b), including the PSC-like (S7-F) and duct-like cells (S7-D) (Fig. 1a, 1b). A trajectory in S4 (S4-C -> S4-A -> S4-E) led to the major endocrine cell populations. The branching during S5 is especially complicated since there are many subpopulations at this stage, including a δ-like SST+/HHEX+cell population (S5-M) (Fig. 1a, b, Supplementary Fig. 2). This is likely because cells were just moved from planar culture to an air-liquid interface during S5 (Extended Data Fig. 1a). However, it appears that prolonged air-liquid interface culture eventually leads to fewer populations: the endocrine cells originated from a trajectory of S5-K, S5-G and S5-I populations based on our modeling (Fig. 1b); other S5 populations may become too small to distinguish from unbiased clustering in S6 and S7 after further differentiation.
Every edge in the tree represent the transition between two cell states, we can therefore build a pseudo-time trajectory between any two cell states and project the cells onto the edge. To visualize the dynamic expression of any gene or gene cluster, we used heat color to stain the lineage tree representing their expression level during differentiation (Fig. 2a). We clustered all genes into 64 modules based on their dynamic expression patters on the tree, each module with different functions (Extended Data Fig. 4, Supplementary Table 1). For example, module #50, #52, #56 and #62 containing marker genes for β-like, α-like, PSC-like and duct-like cells, respectively (Fig. 2a, Extended Data Fig. 4). Similarly, gene modules marking early embryogenesis, such as meso/endoderm (#7), definitive endoderm (#9) and foregut (#26), show transient expression pattern on the tree; genes for the desired pancreatic endocrine lineage (#37), such as PDX1 and NKX6.1, decorated nearly the entire branch of endocrine lineages (Fig. 2a, Extended Data Fig. 4). Interestingly, cell cycle genes (TOP2A, CENPE, MKI67, AURKB, and CDK1) are not expressed in the entire endocrine lineage branch, indicating cell cycles exit during the fate choice to pancreatic endocrine (module #57 in Extended Data Fig. 4c)21. We noticed PPY expression in α-like cells (Extended Data Fig. 4b), indicating related lineages and consistent with single cell expression and ATAC-seq data in primary human islets13,22–25. Similarly, we also observed GHRL expression in δ-like cells (Extended Data Fig. 4b). However, it should be noted that our system may not fully reflect alternative lineages, since the differentiation protocol is designed to induce the β-cells.
Fig. 2: Time- and lineage-specific genes in directed β-cell differentiation.

(a) Average expression of 9 representative stage-specific gene modules are projected onto the lineage tree by color intensity (more modules in Extended Data Fig. 4). ME: meso-endoderm; DE: definitive endoderm; FG: foregut. PL: PSC-like; DL: Duct-like; EC: enterochromaffin cells; βL: β-like; αL: α-like. (b) Heatmap showing expression patterns of genes along the differentiation trajectory from ES cell to β-like cell. Top track: density plot of cell populations in this trajectory along the pseudo-time. Genes are clustered based on their time-of-expression. ES: embryonic stem cells; PP: pancreatic progenitors. (c) GSEA functional enrichment in each gene group (A1~B12) from (b). Numbers in the cells are number of genes of each gene group belonging to the corresponding GSEA term. Gene numbers of GSEA terms are in parenthesis. Color intensity indicates enrichment score (q-value one-sided binomial test, exact q value list is included in Supplementary Data 3). (d) Enrichment of T2D/glycemic risk genes in each gene group in (b). Significantly enriched gene groups (one-sided binomial test p<0.05) are colored by unadjusted p-value. The numbers of GWAS genes are indicated in each bar. Maturation genes are described in Fig. 1g. The most significant groups: B1(p=2.7*10−5), B2(p=6.1*10−5), B3(1.3*10−7), B6(1.3*10−8), B9(2.8*10−5), B11(3.9*10−6), B12(2.6*10−7), Maturing genes(1.5*10−4). (e) Expression profiles of many stage-specific TFs are correlated with the abundance of their motifs during differentiation. For each TF, top panel shows the expression levels in 7 stages computed from Drop-seq data; bottom panel shows the TF motif enrichment among the H3K27ac peaks in the 7 stages. Top row TFs have positive correlations; bottom row TFs have negative correlations (More in Extended Data Fig. 6).
Stage-specific genes play key roles in β-cell differentiation and diseases
To characterize the transcriptomic reprograming during the β-cell differentiation, we pulled data from all 16 cell populations in the β-cell lineage (highlighted in Fig. 1b and 2a), order the cells into a linear trajectory and investigate the changes of gene expression along the pseudo-time (Fig. 2b, Supplementary Data 4). Our analysis correctly revealed the sequential expression of the classic developmental markers, including meso-endoderm markers (T, GSC, EOMES, and MIXL1), definitive endoderm markers (SOX17, CXCR4, GATA6, and CER1), gut tube and posterior foregut markers (ONECUT1 and SOX9), and pancreatic progenitor markers (PDX1 and NKX6.1) (Extended Data Fig. 5c). Endocrine (NEUROG3, NEUROD1) and β-cell markers (INS, IAPP, GLP1R) are only active during or after Stage 5 (pancreatic endocrine precursor) (Extended Data Fig. 5d). We also observed a coordinated activation of many calcium and sodium channel genes during S5~S7, likely relevant to their important roles in glucose stimulated insulin secretion (GSIS) (Extended Data Fig. 5e–f). Finally, as mentioned before, cell cycle genes are drastically downregulated after choosing the endocrine lineage in Stage 4 (Extended Data Fig. 5b).
Out of all 11,876 genes detected from all stages, a majority (9,117, or 77%) showed dynamic expression pattern during the β-cell differentiation (Extended Data Fig. 5a, Supplementary Data 3). We further clustered 6,872 unimodal (only one peak of expression in the trajectory) genes into 26 groups based on the timing of activation: A1~A14 with peak expression before S4 (pancreatic progenitors), and B1~B12 peaked on or after S4 (Fig. 2b). A GSEA analysis of these gene clusters clearly confirmed the developmental events or physiological functions known to associate with their corresponding differentiation stage (Fig. 2c). For example, ESC gene clusters A2, A3 enriched the signatures of stem cell and blastocyst growth; Stage 1 (definitive endoderm) gene cluster A6 enriched the signatures of primitive streak formation; Stage 6 and 7 gene clusters B9-B12 enriched the signatures of pancreatic β-cells and regulation of secretion (Fig. 2c). Interestingly, our analysis highlighted a number of RNA-processing terms enriched in A2~A7 genes (expressed before definite endoderm), including those relevant to mRNA decay, splicing, and transportation (Fig. 2c), suggesting a specific role of RNA-processing machinery in ES cells and early development26.
We identified 769 time-dependent transcription factors (TFs) during β-cell differentiation (Supplementary Fig. 6, Extended Data Figure 6). To test the time-dependent functions of these TFs, we collected published enhancer maps (defined by H3K27ac ChIP-Seq) during the differentiation from hESC to pancreatic progenitors (hESC and S1~S4)27, as well as in sorted β-like cells in S5/6 and S7 stages28. We next used motif analysis to investigate if the stage-specific TFs may contribute to the dynamic enhancer landscapes (Methods). Among the 85 TF motifs examined , 48 (or 56%) show positive correlations (r > 0.3) between TF expression and the enrichment of their motifs in the enhancer DNA across 7 stages, including NANOG in hESC, PITX2 and SMAD2 in definitive endoderm, PAX1 in gut tube, GATA5 in foregut and RFX3, ASCL2, INSM1 in later maturing β cell stages (Fig. 2e, Extended Data Figure 6a–b). Interestingly, we also identified 24 TFs (out of 85, or 28%) showing negative correlations (r < −0.3) between TF expression and motif enrichment, among which we noticed several well-characterized transcription repressors, including REST, ZIC2, PRDM1, ZFP42, and HES1 (Fig. 2e, Extended Data Figure 6). It is therefore plausible that at least some of these negatively correlated TFs may prevent enhancer activation via recruiting co-repressors. Taken together, our results strongly supported a conclusion that time-dependent TFs create the dynamic enhancer landscapes to govern differentiation.
We next collected the 562 detectable genome-wide association study (GWAS) risk genes in GWAS catalog for type II diabetes (T2D) and glycemic traits, including fasting blood glucose/insulin and HMOA-B (Supplementary Data 3), and examined their dynamic expression during β-cell differentiation. Importantly, many of these risk genes are only transiently expressed during differentiation, with low or no expression in the β-like cells from the final stage (Extended Data Fig. 7a). We next examined the enrichment of these GWAS genes in the 26 time-dependent gene groups defined in Fig. 2b, and found enrichment signal in groups B9, B11, B12, which are expressed in maturing endocrine cells. GWAS genes are also enriched among β-cell maturation genes (with expression in primary β-cells > S7 β-like) (Fig 2d, Supplementary Data 2, 3). Interestingly, we also observed significant enrichment of GWAS genes in groups B1-3 and B6, which are transiently expressed in S3~S5 (posterior foregut to pancreatic progenitors, Fig. 2d). Since GWAS catalog is a highly heterogenous resource of risk loci including many small-size studies among different populations, we looked into the 380 fine-mapped T2D loci (99% credible intervals) reported by a recent massive meta-analysis29, which contains 2,019 detectable genes during the β-cell differentiation (Supplementary Data 3). MAGENTA analysis30 also revealed enrichment of risk genes among the transiently expressed gene groups A12, B2 and B6 (Methods, Extended Data Fig. 7b). Our results are consistent with a bulk RNA-seq analysis showing that T2D GWAS loci are enriched in genes in the posterior foregut and the final β-like stages31. Notably, some transiently expressed T2D GWAS genes, including TCF7L2, are also associated with glycemic traits (Extended Data Fig. 7); these genes probably worth extra attention since the intersection between T2D and glycemic associations are more likely to indicate a mechanism through islet dysfunction. Taken together, our results highlighted an attractive possibility that many diabetes risk loci may modulate β-cell differentiation instead of functioning in mature tissues.
Switch genes mark cell fate choice and guide the improvement of differentiation protocol
The lineage tree explicitly defines the cell populations at the “branch points” (BPs) as progenitor cells undergoing lineage determination. Two BPs are particularly important in the β-cell differentiation: BP1 (cell population S4-C) for the choice between non-endocrine and endocrine lineages (Fig. 1b, 3a), and BP2 (cell population S5-I) for the choice between α- and β-cell fates (Fig. 1b, Extended Data Fig. 8a). For BP1, the differentiation moves towards non-endocrine lineage through the S5-E, S5-C, S6-A populations, and towards endocrine lineage through the S4-A, S4-E, S5-G, S5-I populations (Fig. 1b, 3a). In the principle component space, these cell populations clearly form two bifurcating trajectories (Fig. 3a), allowing us to conveniently identify “switch genes” that are induced or repressed in one lineage but not the other.
Fig. 3: Characterization of “switch” genes associated with bifurcating cell fate choices.

(a) A schematic showing the branch point (BP) of lineage specification. BP1 on the tree indicates the choice between non-endocrine (blue) vs. endocrine (orange) cell fates. Inlet: principle component analysis of non-endocrine vs. endocrine cells from populations at BP1 and in the highlighted branches on the lineage tree. (b) Heatmap showing the temporal expression profiles of switch genes at BP1. Trajectories of BP1 to nonendocrine (Non) and BP1 to endocrine (Endo) are placed side-by-side for comparison. Right panel: the fold changes of these genes (endocrine vs. nonendocrine) in primary human islets (Drop-seq data). (c) GSEA analysis of non-endocrine- and endocrine-specific switch genes. Color intensity indicates enrichment score (One-sided binomial test adjusted q value). Gene numbers of all enriched functional terms are shown. (d) Transcription factors (TFs) among the “switch genes” between the non-endocrine and endocrine lineages. Right panel is same as the right panel in (b) (e) Overlap analysis between human and mouse endo/non-endo switch genes. Representative consistent genes are shown in the square (full gene list in Supplementary Data 3). (f-g) Visualization of non-endocrine-specific switch gene GATA6 and TGFB2 in the lineage tree, showing their activation in definite endoderm and β-like cells, respectively.
At BP1, we identified 1,150 endocrine-specific switch genes and 795 nonendocrine-specific switch genes (Fig. 3a–b). We posited that most switch genes should maintain their lineage specificity in adult islets, and verified the expression of these switch genes in endocrine (α, β, δ, γ) or non-endocrine cell types (acinar, duct, PSC) using Drop-seq data from primary human islets13 (Fig. 3b). Indeed, 79% (1,539 out of 1,945) of the switch genes showed consistent lineage specificity (Fig. 3b). As expected, Gene Ontology analysis showed that the endocrine-specific switch genes enriched terms relevant to endocrine functions such “secretion regulation”, “exocytosis”, and “calcium ion regulation”; nonendocrine-specific switch genes enriched “digestive system development” and “epithelial cells differentiation” terms (Fig. 3c), reflecting a cell fate towards pancreatic acinar and duct cells. The nonendocrine-specific switch genes also enriched several housekeep terms including “cell cycle”, “regulation of microtubule”, “RNA splicing”, and “ribosomal subunits” (Fig. 3c), suggesting that the non-endocrine cells proliferate and grow more actively than endocrine cells.
The endocrine specific switch TFs included nearly all the well-documented endocrine fate regulators, including PDX1, NEUROG3, RFX3, RFX6, NEUROD1, PAX4, MAFB, ASCL1, INSM1 (Fig. 3d). Several other switch TFs, such as PROX1, SIM1, MLXIPL, are also supported by literatures showing potential roles in endocrine differentiation. We also inferred 656 potential TF-target gene pairs (between 12 TFs and 411 genes) among the endocrine switch genes, and 301 TF-target pairs (between 18 TFs and 199 genes) among the non-endocrine switch genes using a Transcription Factor Target Gene Database (TFBSDB)32 (Supplementary Data 3, Supplementary Fig. 7). These data may shed light on the regulatory relationship between switch genes. We also performed the same analyses for BP2 and identified switch genes including TFs that might contribute to α- and β-cell fate choice (Extended Data Fig. 8). As expected, we observed known α cell markers (e.g. IRX2, ARX) and β-cell makers (e.g. PDX1 and PAX4) distinguishing the two cell fates. It will be interesting to explore the functions of other switch genes in lineage determination and endocrine cell functions.
We also sought to validate the expression pattern of the switch genes in vivo. Despite the difficulty to study human embryos, several studies have investigated the in vivo β-cell development in mouse embryos focusing on the time window (E13.5 to E18.5) after endocrine progenitors appears33–36. We therefore compared our list of human switch genes to a list of mouse switch genes reported by Scavuzzo et al., which contains 716 endocrine-specific and 882 nonendocrine-specific genes36. 414 switch genes (186 endocrine and 228 nonendocrine) are common between our list and mouse data, significantly more than expected (p<2.2*10−16, Fisher’s Exact Test) (Fig. 3e, Supplementary Data 3). The common switch genes include well-known endocrine (RFX6, PDX1, NEUROD1) and non-endocrine TFs (HES1, ONECUT1). We reason that these consistent genes are more likely to play key roles in the endocrine and non-endocrine lineage choice.
Intriguingly, we noticed a few endocrine/non-endocrine switch genes that are also activated in another stage or branch point. For example, the non-endocrine switch gene GATA6 is activated in S1 and indeed a well-known marker gene for definite endoderm (Fig. 3f). Another example is TGFB2, which marks the non-endocrine branch in BP1, but is also activated during the final stage of β-cell differentiation (S6~S7) and therefore also a β-cell-specific switch gene at BP2 (Fig. 3g). Interestingly, a recently study showed that although inhibiting TGF-β at earlier pancreatic endocrine stage (S5) helps the differentiation, permitting TGF-β signaling at the final stage is important for β-like cell maturation37, suggesting that omission of TGF-β inhibitor (ALK5i) during S7 can be beneficial to β-cell maturation. These examples suggested that the same gene or pathway may have time-dependent functions along the differentiation process (more discussion about multimodal gene expression below).
Finally, we followed up the non-endocrine switch gene HES1, which has a reported role to inhibit endocrine lineage as a downstream target of NOTCH signaling38–40. Consistently, all three human NOTCH genes were expressed at higher levels in non-endocrine lineage (Fig. 4a–b). The HES1 deletion line indeed shows significantly better endocrine differentiation efficiency in Stage 5 (Fig. 4c). From the lineage tree, we noticed that HES1 expression started in S5 after BP1 in the non-endocrine branch (Fig. 4b). However, in the standard protocol5, NOTCH inhibitor (γ-secretase inhibitor) was not added until stage 6 after the differentiation went past the endocrine precursor stage (Extended Data Fig. 1). We therefore reasoned that early NOTCH inhibition during Stage 5 might improve the differentiation efficiency. To test this hypothesis, we compared the yield of β-like cells (measured by with C-peptide and NKX6.1) between three protocols γ-S4, γ-S5, and γ-S6, which added γ-secretase inhibitor during Stage 4, Stage 5 and Stage 6 respectively (Fig. 4d). (The standard protocol is γ-S6.) As expected, the γ-S5 protocol showed best results (Fig. 4d–e), consistent with the timing of HES1 expression; γ-secretase inhibition in both S5 and S6 did not provide additional benefits. These results demonstrated that the switch genes can guide the development of improved differentiation protocol.
Fig. 4: Optimizing NOTCH inhibition based on the expression of switch gene HES1.

(a-b) Visualization of non-endocrine-specific switch gene NOTCH1, NOTCH2, NOTCH3 and HES1 in the lineage tree. (c) Compare the yield of pancreatic endocrine precursors (NKX2-2+/CHGA+) at the end of stage 5 in wild type H1 hESCs or in HES1 knockout cells. (d) Schematics of four differentiation protocols adding γ-secretase inhibitor at different time, note that γ-S6 is the standard protocol. (e) Flow cytometry to examine the yield of β-like cells (C-peptide+/NKX6-1+) at the end of stage 6 with various protocols depicted in (d). A protocol without γ-secretase inhibitor was also included as control.
ROCKII inhibition promotes endocrine lineage via suppressing non-endocrine cell fate
A chemical screen found that inhibition of Rho-associated coiled-coil kinase II (ROCKII) can promote pancreatic β-cell differentiation41. However, it remains unclear how ROCKII inhibition leads to better differentiation outcomes. We therefore modified the differentiation protocol by adding ROCKII inhibitor (Y27632) after stage 4 (Ro.In+ protocol), and performed Drop-seq again in stages 5~7. Consistent with previous reports, we observed significantly increased fraction of endocrine cell populations in all stages after ROCKII inhibition, despite the potential biases using scRNA-seq data to quantify cell type composition (Fig. 5d, Extended Data Fig. 9a).
Fig. 5: ROCKII inhibitor promotes endocrine differentiation by suppressing non-endocrine lineage.

(a) Unsupervised clustering of single cells for the time points with ROCKII inhibitor (Ro.In+) treatment. Cell populations are marked by dashed lines and named in alphabetical order. (b) Reconstruction of the lineage tree under Ro.In+ condition. Each dot represents a cell population from (a). Cell populations connected by red lines constitute the lineage to β-like cells. (c) A summary of cell numbers in each stage. (d) Pie charts comparing the fraction of various cell populations at the final stage between standard and Ro.In+ protocols. (e) Visualization of average expression of cell cycle genes under two protocols. (f-h) Volcano plots of differentially expressed genes between two protocols in non-endocrine cells in stage 5~7. Differential expression tests are performed based on negative binomial distribution (NB, more details see Methods). Multiple comparisons are not adjusted. (i) Protein interaction network of the top 65 Ro.In-repressed genes. Non-endocrine-specific switch genes are colored in red. (j) Expression profiles of the top 65 Ro.In-repressed genes under standard differentiation protocol. Heatmaps compared the expression of these genes in the non-endocrine (left) and endocrine (middle) trajectories after BP1. The right panel showed that nearly all these genes are non-endocrine specific in primary human islets. (k) Visualization of eight genes that are repressed by ROCKII inhibitor.
We reconstructed the lineage tree with the new S5~S7 Ro.In+ Drop-Seq data and compared it to the tree from the standard protocol (Ro.In−, Fig. 5a–c). The new protocol also generates α-like, β-like, and EC populations. Due to the improved yield of endocrine cells, we could also observe a small cluster of δ-like cells from the Y27632 treated S7 cells. We compared the expression of 14 marker genes on the two lineage trees and found that they are all turned on at the right time and on the expected branches (Extended Data Fig. 9c). Most dynamic genes in the β-cell differentiation trajectory maintain the same dynamic pattern in both protocols (Extended Data Fig. 9b). In the principle component space, the β-like cells from both Ro.In− and Ro.In+ protocols occupy the same area and are distinct from the primary human β-cells (Extended Data Fig. 9d). Furthermore, similar to what we showed in Fig. 1e, α-like cells from the new protocol also transcribed excessive INS gene, while β-like cells from both protocols transcribed comparable levels of GCG to primary pancreatic β-cells (Extended Data Fig. 9e). Taken together, although ROCKII inhibitor clearly improve the yield of endocrine cells, we did not find evidence of improved endocrine cell quality.
We next examined the effects of ROCKII inhibition to non-endocrine lineage. Under standard protocol, cell cycle genes are expressed in non-endocrine lineage but undetected in endocrine lineage (Fig. 5e). With ROCKII inhibition (Ro.In+), we noticed a significant down-regulation of cell cycle genes in the non-endocrine cell populations (Fig. 5e), suggesting reduced cell proliferation in non-endocrine cells. We further systematically identified the differentially expressed genes in non-endocrine cells between Ro.In− and Ro.In+ protocols. Surprisingly, in all stages (S5~S7), the top genes repressed by ROCKII inhibition (Ro.In+) are ribosome protein genes (Fig. 5f–i). Interestingly, nearly all these repressed genes are also non-endocrine-specific “switch genes” under standard protocol (Ro.In−) (Fig. 5j–k). Consistently, we also verified that these genes are only active in non-endocrine cells from primary human islets (Fig. 5j, right panel). Since the downregulation of cell cycle genes and ribosome proteins suggested reduced cell growth or proliferation, we concluded that ROCKII inhibition promotes endocrine differentiation by suppressing the non-endocrine-cell fate. Notably, ROCK2 gene is expressed at higher level in non-endocrine lineage (Extended Data Fig. 9g).
Interestingly, several recent β-cell differentiation studies already included ROCKII inhibitor in their differentiation protocols9,10,42. However, these studies added the ROCKII inhibitor (Y-27632) in Stage 3 and 4 and withdrew in Stage 5, different from our protocol. We therefore performed parallel experiments to test various ROCK II inhibition protocols (Extended Data Fig. 9f–h). At the end of S4, we did not detect significant differences of pancreatic endoderm markers (PDX+/NKX6.1+) with or without ROCKII inhibitor, probably because the percentage of PE cells in all groups are already high (~80%). At the end of S5, all conditions with ROCKII inhibitor have more pancreatic endocrine (EN) cells (CHGA+/NKX2.2+), including the condition with ROCKII inhibition during S3-4 (condition 1). At the end of S6, all conditions with ROCKII inhibitor (condition 1-5) still performed better (more C-peptide+/NKX6.1+ cells) than no treatment control (condition 6). However, the benefit from condition 1 (ROCKII inhibition in S3-4 only) is not as great as other conditions (Extended Data Fig. 9f–h). Taken together, the optimum timing for ROCKII inhibition appears to be Stage 4 and 5, which is consistent with our conclusion that ROCKII inhibition promotes the choice of endocrine lineage.
Over 2,200 genes have multiple waves of activation driven by stage-specific enhancers
From the lineage tree analyses, we noticed several gene modules that are active at more than one differentiation stages or branches (Extended Data Fig. 4), suggesting multiple functions (pleiotropy) during development. We are most interested in genes with multiple waves of activation during the β-cell differentiation process, and therefore developed an algorithm to systematically identify them (Methods). Unexpectedly, a large fraction of genes (2,245, or ~20% of all detectable) showed at least two waves of expression along the β-cell differentiation trajectory, suggesting extensive gene reuse during development (Fig. 6a, Supplementary Data 5). We termed these genes “double-wave” genes. To suggest the functional relevance of the double-wave genes, we identified 101 double-wave genes that are also endocrine-specific “switch genes”, i.e. these genes were reactivated only in the endocrine lineages during differentiation (Fig. 6c). Further GSEA analysis showed that these double-wave switch genes were enriched with lipid and sterol biosynthetic terms (Fig. 6d), possibly relevant to their roles in regulating insulin secretion43,44.
Fig. 6: Multi-wave gene activation driven by stage-specific enhancers and promoters during β-cell differentiation.

(a) Heatmap showing the Z-score of 2,245 genes with at least two waves of activation (double-wave) during the differentiation process from hESC to β-like cell. Genes are grouped based on the stage in which they have the lowest expression level. Top track: density plot of cell populations in this trajectory along the pseudo-time. (b) For each gene group in (a), the aggregated transcription Z-score (red) and average H3K27ac occupancy at promoters (blue) were plotted and compared (complete list in Supplementary Data 5) (c) Heatmaps of 101 “double-wave” genes that are also endocrine-specific “switch genes”. Left two heatmaps shows the expression of these genes in the β- or α-cell trajectories; the third heatmap shows that these genes were not reactivated in non-endocrine lineage. The bar plot on the right: most of these genes are expressed at higher level in endocrine than in non-endocrine cells according to Drop-Seq data from primary human islets. (d) GSEA analysis for the genes in (c). One-sided binomial tests are used for enrichment analysis. Multiple comparisons are adjusted using qvalue. (e-I) Eight examples of double-wave genes. For each example, left panel visualize the gene expression on the lineage tree; right panel shows the H3K27ac tracks during differentiation. Highlighted in yellow: promoters; blue: enhancers. H3K27ac peaks with arrows support the time-dependent expression of these genes.
We next asked if the double-wave expression pattern is encoded in temporal epigenetic dynamics. Again, we used the published H3K27ac ChIP-seq data to define active promoters and enhancers in these stages. Firstly, most double-wave gene promoters maintained similar levels of H3K27ac occupancy across different stages (Extended Data Fig. 10a). However, after classifying the double-wave genes into 5 groups with expression valleys at stages S1 ~ S5/6, we observed fluctuation of average promoter H3K27ac occupancy consistent with the timing of expression valleys (Fig. 6b, Supplementary Data 5), indicating that the double-wave expression pattern is indeed at transcription level governed by epigenetic events. Indeed, we observed examples of “double-wave” H3K27ac peaks at the promoters of double-wave genes (Fig. 6e–l). On the other hand, enhancers near the double-wave genes are highly dynamic temporally, and importantly, these enhancers usually showed only one wave of activation (Extended Data Fig. 10b). We observed many examples that the same double-wave gene has multiple stage-specific enhancers corresponding to the multimodal gene expression pattern (Fig. 6e–l, enhancers highlighted in blue). These observations strongly suggested that different stage-specific enhancers can activate the same gene at different developmental stages, possibly relevant to gene pleiotropy.
A stage-specific enhancer in the TCF7L2 GWAS locus drives a transient expression wave
We decide to validate one important double-wave gene TCF7L2, which is the strongest and most reproducible hits from diabetes GWAS studies29. Despite extensive researches in the past, it remains controversial how TCF7L2 contributes to disease45,46. TCF7L2 has two waves of expression in hESC and during the stage3-4 (posterior foregut to pancreatic progenitors) of β-cell differentiation (Fig. 7a). As a co-factor of β-catenin, the first wave of TCF7L2 expression in hESC agrees with the role of WNT signaling in maintaining pluripotency47. We also observed a few hESC-specific enhancers near this gene, including E1, E2 and an enhancer proximal to the TCF7L2 promoter (Fig. 7b). These enhancers disappeared in S1 and S2 when the gene is downregulated (Fig. 7a–b). The second wave of TCF7L2 expression appears in S3 when a stage-specific enhancer E4 appeared; both E3 and E4 turned down during endocrine specification (S5-S7) while TCF7L2 was down-regulated again.
Fig. 7: A stage-specific enhancer within the TCF7L2 diabetes GWAS locus drives a transient wave of gene expression.

Visualization of TCF7L2 expression on the lineage tree. (b) Top track: linkage disequilibrium at TCF7L2 locus; arrows indicate the locations of a few T2D GWAS SNPs. The enhancers are highlighted in blue and the promoters are highlighted in yellow. (c) Schematic primer design to validate the deletion of TCF7L2 E4 enhancer. We expect a 1.16kb product before deletion (WT band), and a 1.98kb product after deletion (KO band). (d) Representative gel image of validation heterozygous, homozygous and wild type clones (repeated three times). (e) The effect of E4 enhancer deletion on TCF7L2 expression. Error bars are shown as standard error of the mean (SEM). One-sided Student’s t-test was performed. n=4 biologically independent experiments. Unadjusted p values are shown. (f) Flow cytometry comparing the outcomes of differentiating wildtype (WT) and E4 deletion (TCF7L2E4−/−) cells at the end of stage 5-7.
Most interestingly, E4 is the strongest enhancer located in the same LD block with rs7903146 (Fig. 7b). The rs7903146 SNP in the TCF7L2 locus confers the strongest statistical evidence with a substantial effect on T2D risk, and associated with the impaired insulin secretion in islet29,48. A recent eQTL analysis also showed that the rs7903146 risk allele is associated with increased TCF7L2 expression in human islets49. We therefore decide to delete the E4 enhancer and validate its roles in gene regulation and β-cell differentiation (Fig. 7c–d). Indeed, we found that enhancer deletion significantly reduced the second wave TCF7L2 expression during S3 and S4 (Fig. 7e). Furthermore, the enhancer deletion promotes the differentiation toward endocrine precursors, marked by CHGA and NKX2.2 (Fig. 7f), which is in line with a recent finding that WNT inactivation promotes endocrine differentiation9. At the end of S6 and S7, although the percentages of total C-peptide+ cells in wildtype and TCF7L2E4−/− cells were similar, TCF7L2E4−/− line generated more NKX6.1+/C-peptide+ cells. These results brought up a new perspective that the TCF7L2 GWAS locus may contribute to T2D by affecting endocrine differentiation; and demonstrated the value of integrating time-series transcriptomic and epigenomic data in the study of disease etiology.
Lastly, we explored the candidate causal SNPs within the E4 enhancer. Mahajan et al. dissected the TCF7L2 locus and reported seven distinct GWAS association signals in addition to the primary rs7903146 signal; every signal is a set of credible SNPs named by its lead SNP29. The eight signals overlap each other, and their sizes are highly variable (range 1bp-985kb) (Extended Data Fig. 10c). The rs7903146 signal includes only 3 SNPs spanning ~4kb window. Notably, the rs180988137 and rs78025551 signals are largest in size spanning the entire TCF7L2 locus, and their lead SNPs are very close to, and in the same LD with rs7903146 (Fig. 7b, Extended Data Fig. 10c). We examined the credible SNP sets reported by Mahajan et al. and found 14 SNPs within the E4 enhancer region (Extended Data Fig. 10c). All the 14 SNPs belongs to either rs180988137 or rs78025551 signal. It will be interesting to test if these SNPs affect the enhancer activity.
Discussion
Current protocols for directed β-cell differentiation is not perfect. The differentiation results in a heterogeneous cell population; the yield of desired β-like cell is variable between different hESC or hiPSC lines. Here we performed a comprehensive single cell lineage analysis during the entire directed β-cell differentiation process starting from hESCs. Compared to two recent single cell studies in the β-cell differentiation system9,10, our study used a different 7-stage protocol5, included a full spectrum of differentiation stages, and importantly, intentionally used a less efficient hESC line to allow better coverage of undesired cell lineages. Consequently, we reconstructed a highly branched lineage tree to explicitly trace the fates of all major cell populations during the entire differentiation process. Notably, although we used a different hESC line with a different protocol, the endocrine lineage in our data contains the same cell population as previously reported, including α-like, β-like, and EC-like cells, suggesting that the stem cell based in vitro differentiation is a well reproducible system in modeling human pancreatic development10. Our data indicated that the bottleneck of our differentiation system was the decision between endocrine / non-endocrine lineages. It remains unclear whether other hESC or hiPSC lines share the same bottleneck. Further study is necessary to address the issue about the variation of differentiation propensity between different stem cell lines.
We defined endocrine / non-endocrine “switch genes” from the lineage tree and demonstrated that these data could reveal the mechanisms of differentiation-promoting chemicals and lead to protocol improvements. Firstly, based on the timing of HES1 expression, we determined that the best time to start NOTCH inhibition (with γ-secretase inhibitor) is the 3-day window immediately after transferring pancreatic progenitors cells into air-liquid interface (Stage 5), which is earlier than the standard protocol5. Notably, an alternative 6-stage differentiation protocol in suspension adds γ-secretase inhibitor for 7 days between the PP2 (PDX1+/NKX6-1+) and EN (NKX6-1+/C-peptide+) stages4, which should include the critical transition period between pancreatic progenitors to endocrine precursors as we defined. In another example, we found that ROCKII inhibition increases the proportion of endocrine cells by suppressing the non-endocrine lineage. We found that cell cycle genes are silenced in endocrine cells but remain expressed in non-endocrine lineage under standard protocol, especially in PSC-like cells; ROCKII inhibition significantly down-regulated the cell cycle genes in non-endocrine cells. This is reminiscent of a previous report that ROCK inhibition can induce apoptosis and decrease the spreading of hepatic stellate cells (HSC)50. We speculate that a similar mechanism might exist in PSC-like cells, too. ROCKII inhibition also led to marked downregulation of many ribosome protein genes, also suggesting a slow growth. It is also interesting that these ribosome protein genes are specifically expressed in non-endocrine cells, raising an possibility that ribosome heterogeneity may also contribute to islet differentiation51,52. Lastly, a recent study also showed that depolymerized cytoskeleton leads to endocrine induction42, which may also explain why ROCKII inhibition enhances β-cell differentiation. Despite these findings, it should be noted that further studies are still necessary to determine if the transcriptional changes are the reasons or the consequences of non-endocrine lineage suppression.
Most detectable genes are dynamically regulated during differentiation. We showed a significant enrichment of T2D GWAS signal among the genes transiently expressed during pancreatic progenitor stage, highlighting a developmental mechanism affecting the disease propensity. It should be noted though that our analyses (including MAGENTA analysis) assumed the one-dimension proximity between GWAS signal and causal genes; alternative approaches using eQTL or 3D genome data (e.g., Hi-C)53,54 shall improve the identification of distal GWAS target genes when those data are available in the pancreatic developmental system. Most strikingly, our data also revealed that a large fraction of (~20%) all detectable genes have multiple waves of activation. We also showed evidences that different stage-specific enhancers are driving the gene reactivation during development. Interestingly, we discovered that a stage-specific enhancer (E4) located in the TCF7L2 diabetes GWAS locus governs endocrine differentiation through a transient wave of TCF7L2 expression. Taken together, our comprehensive single-cell analysis provides a valuable data resource for the study of islet biology and diabetes.
Methods
Pancreatic beta cell directed-differentiation from hESCs
H1(WA01) and H9 (WA09) were cultured on Matrigel (Corning, Catalog 354277) coated plate with mTeSR1 medium (Stemcell Technology, 85870), and sub-passaged every 5-7 days. Differentiation was performed following a previous publication5. Briefly, H1 cells were dissociated with gentle cell dissociation reagent into singlets. Cells were resuspended in mTeSR1 medium with Rock II inhibitor (Y-27632, abcam #ab120129) at 10 μM concentration, and seeded in Matrigel coated plate. On the consecutive day, differentiation started with pancreatic differentiation kit (Stemcell Technology #5120) from stage 1 to stage 4 following the manufacturer’s manual.
At the beginning of stage 5, cells were dissociated and seeded on insert (Fisher Scientific #877115). From stage 5 to stage 7, cells were cultured in basal medium (MCDB131 medium (Thermofisher #10372-019) with 1.5g/L sodium bicarbonate (Millipore Sigma #S5761), 1x Glutamax (Thermofisher #35050061), 20 mM glucose (Sigma-aldrich # G8769-100mL), 2% fatty acid free BSA (Proliant # 68700)) with stage specific supplements. In stage 5 (3 days), basal medium was supplemented with 0.25 μM SANT-1(Sigma #S4572), 100 nM LDN193189 (Stemgent #040019), 0.05 μM retinoic acid (Sigma #R2625), 1:200 ITS-X (Thermofisher #41400-045), 1 μM T3 (3,3’,5-Triiodo-L-thyronine sodium salt, Sigma #T6397), 10 μM ALK5 inhibitor II (Enzo Life Sciences #ALX-270-445), 10 μM Zinc sulfate (Sigma # Z0251) and 10 ug/mL of heparin (Sigma# H3149). In stage 6 (8 days), basal medium was supplemented with100 nM LDN193189, 1:200 ITS-X, 1 μM T3, 10 μM ALK5 inhibitor II, 10 μM Zinc sulfate and 10 ug/mL of heparin, 100 nM gamma secretase inhibitor XX (EMD Millipore #565789) (for the first 7 day only). In stage 7 (7 days), basal medium was supplemented with ITS-X, 1 μM T3, 10 μM ALK5 inhibitor II, 10 μM Zinc sulfate,10 ug/mL of heparin, 1 mM N-acetyl cysteine (Sigma #A9165), 10 μM Trolox (EMD Millipore #648471), 2 μM R428 (SelleckChem #S2841). For the test with gamma secretase inhibitor, gamma secretase inhibitor was added additionally at 100 nM in stage 5. For the test with RockII inhibitor (RoIn+ protocol), RockII inhibitor was added in stage 5 to stage 7 at 10 μM.
Flow cytometry and cell sorting
The ES cells or the differentiated cells were washed once with 1 x DPBS and dissociated with Accutase (Innovative cell technologies #AT-104) to release single cells, which were stained with fixable viability dye (Thermofisher # L34969), then fixed for staining intracellular or nuclear markers with staining kit (eBioscience #00-5523-00). In the case where primary antibody is directly conjugated, the cells will be resuspended 2% BSA in 1xPBS after staining and ready for flow cytometry analysis; otherwise, cells will be subjected to staining with respective secondary antibody, then washed and resuspended for flow cytometery analysis.
Glucose stimulated insulin secretion assay
Groups of five to six clusters of stage 7 H1-derived cells were rinsed twice with Krebs buffer(129 mM NaCl, 4.8 mM KCl, 2.5 mM CaCl2, 1.2 mM MgSO4, 1mM Na2HPO4, 1.2 mM KH2PO4, 5 mM NaHCO3, 10 mM HEPES, 0.1% BSA) and then pre-incubated in Krebs buffer containing 3.3 mM glucose for 2 hours. Cells were subsequently incubated in Krebs buffer containing 3.3 mM glucose for 60 minutes, washed twice with Krebs buffer, and incubated in Krebs buffer containing 16.7 mM glucose for another 60 minutes; this 3.3. mM glucose to 16.7 mM glucose stimulation was repeated for two more rounds. Cells were then incubated in Krebs buffer containing 3.3 mM glucose for 60 minutes, washed again, and incubated with Krebs buffer containing 3.3 mM glucose and 30 mM KCl for 60 minutes. Supernatant of each stimulation was collected and stored in −70 degree for human insulin ELISA (Mercodia # 10-1113-01) measurement.
Quantitative RT-PCR
The mRNA of cells at desired stage was purified by Zymo Quick-RNA MicroPrep kit (Zymo #R1050), 1 μg of mRNA was then purified with RNase free DNase I (NEB #M0303S), and reverse transcripted into cDNA with M-MLV Reverse Transcriptase (Thermofisher #28025013). Quantitative realtime PCR was then performed with PrefeCTa SYBR Green Supermix Reaction Mixes (Quantabio #95054-500) on BioRad qPCR machine. Data were analyzed using Bio-Rad CFX Manager software and normalized to undifferentiated H1 cells using the ∆∆Ct method. The detail information of primers is included in table S1.
Deletion of TCF7L2 enhancer E1 in hESC (H1) with sgRNAs-CARGO
To delete the TCF7L2 enhancer E1 in H1 cell line, we made CARGO constructs to introduce 6 sgRNAs per cell55. The CARGO plasmids are gifts from the laboratory of Joanna Wysocka. All sgRNAs were designed on CHOPCHOP-CRISPR/Cas9 target online predictor https://chopchop.cbu.uib.no/)56. We designed 3 sgRNAs for the left-side and the right-side of the targeted enhancer E4 (Fig. 7) respectively. The sgRNA sequences are listed in Table S1. H1 cells were transfected using electroporation by Nucleofector™ 2b (1 pulse, 300 V, 4 ms, BTX). A total of 5μg plasmids (sgRNA-CARGO plasmid: cas9 expression plasmid= 1:1) were used in each electroporation for 2 million cells. Cells were then cultured for one more day to recover and then dissociated and diluted for single colony isolation. Cells then grew into visible colonies for about 10 days, and then the colonies were picked into 24-well plate. Colonies were expanded and identified by PCR. PCR validation primers are listed in Table S1.
HES1 gene knockout in hESC (H1)
We designed two sgRNAs on the first and second exons on the coding region. sgRNA sequences are listed in Table S1. Two sgRNAs are assembled in tandem on the Lenti-Crispr-v2 plasmid (#52961) for lentivirus packaging. 24 hours before transfection, 80 million 293T cells were split into 10 10cm plates where the cells reach 60% confluence the next day. Each plate was co-transfected with 1), 9µg LentiCRISPR v2 plasmid expressing single sgRNAs, 2), 9µg delta V8.91, and 3), 9µg pCMV-VSVG. For each plate, plasmids and 21µg polyethylenimine (PEI) are pre-mixed in 500uL Optium-MEM (Invitrogen) and incubated at room temperature for 10 minutes. Meanwhile, the culture medium for 293T cells were switched by 6mL fresh Optium-MEM. PEI-plasmids mixtures were then added to the cells after 10min incubation. 6 hours after transfection, Medium were changed for by 10 ml fresh complete medium. 3 days after transfection, culture medium containing viral particles was harvested, filtered through 0.45µM Millipore filters. The viral supernatant was concentrated by centrifuging for 90 minutes at 25,000 rpm in 4℃. Virus pellets were washed once with ice-cold PBS before re-suspended in PBS. hESC (H1) are transduced by concentrated viral and cultured for 24 h. 3 days after transduction, cells were selected with 1μg/ml puromycin for two days. After selection, cells are passaged, and prepared for differentiation.
Drop-Seq library preparation
We collected 600,000 cells from each time point for Drop-seqs (12 Drop-seqs at 12 time points in total) encompassing 7 developmental stages. We examined more than one time point for early stages because of the quick transcriptome change across time. (Extended Data Fig. 1) We performed Drop-Seq using the protocol as previously described11,13. Briefly, three pump-controlled syringes with cell suspension (200,000 cells/mL), barcoded beads in lysis buffer (360,000 beads/mL), and droplet generation oil were connected to a microfluidic device under microscope supervision. During droplets generation, we set the cell and bead flow speed at 4,000uL/hr, and the oil speed at 15,000uL/hr. The droplets were collected into 50mL falcon tubes (usually less than 5mL). Under this setting, most droplets had at most one beads or one cell. Following droplet breakage, we performed 1st strand cDNA synthesis on beads following SMART-PCR protocol. Finally, the resulting full-length cDNA library was prepared using Nextera DNA library kit for sequencing.
Drop-Seq reads processing
We processed raw reads following the instructions described in the original Drop-Seq analytical pipeline11. The sequenced Drop-Seq libraries yielded 50-bp paired-end reads (PE50). We then extracted base 1-20 of reads 1 for cell and molecular barcodes. Reads 2 were trimmed at 3’ end to remove ploy-A tails with at least 6 bases and trimmed at 5’ if adapter sequence appears. Clean reads were then aligned to hg18 using STAR with default settings. We only keep uniquely mapped reads on gene exons and 3’/5’ UTRs. We next filtered out PCR duplicates with same chromosome positions, cell barcodes, and UMIs. We then grouped the reads by cell barcode and generated the digital UMI-count matrix after counting transcripts for each gene across all cell barcodes.
Identification of cell populations by unsupervised clustering
Our heterogeneity analysis showed that the cellular variation increases substantially from early to late stages. We reasoned that an unsupervised clustering using cells of all time points together would be less sensitive especially in identifying cell clusters in early stages because cells of later stages would account for the majority of the variances. Therefore, we did unsupervised clustering for cells from each time point separately. For each time point, we performed a two-step unsupervised clustering, where a low-resolution clustering is firstly used to separate major populations followed by a secondary high-resolution clustering that more sensitively identifies sub-populations.
Before clustering analysis, we set a series of criteria to filter out low-quality cells. Firstly, we filtered out cells with transcripts number lower than 500, or lower than 200 genes. Second, any cells expressing more than 2500 genes were considered as potential doublets and would be also be filtered. Third, we removed cells if the mitochondria genes account for more than 5% of the transcriptome. Last, we filtered out genes that are expressed by 3 or lower than 3 cells.
We then set rules to pick “informative genes” for clustering as described in the original Drop-seq paper11. Briefly, we first ranked the top 10,000 genes based on average expression level among all cells; We then grouped them into 10 bins with 1,000 genes each. The coefficient of variation (CV) was calculated for each gene within each bin. From each bin, we picked the top 50 genes with the highest CV as informative genes. Altogether, we picked 500 informative genes for clustering analysis. We used Seurat package for clustering analysis with default parameters14. In Seurat, Principal Component Analysis (PCA) was performed with the 500 informative genes as described above. Using PC1 to PC10, cells were embedded in a K-nearest neighbor (KNN graph). Smart local moving algorithm (SLM) was applied to group cells into communities. PC1 to PC10 were used as input to visualize cell clusters in two-dimensional t-SNE space.
Human islet drop-seq processing and data analysis
We previously did single cell transcriptome analysis on human islets from 9 donors. Detailed method and procedures were described before13. Briefly, we generated transcriptome data for 39,905 single cells. All samples contain 80~90% endocrine cells, where 90% are α or β cells. Three pieces of information would be used for the current study. First, the single cell transcriptome data of α and β cells were pooled with the current data and renormalized for comparative analysis with α-like and β-like cells. Second, we previously did a differential expression analysis across 4 endocrine cell types (α, β, δ, PP), which identified hundreds of β specific and α specific genes. We revisited those genes for enrichment analysis. Third, for “switch gene” analysis in primary islet, α, β, δ, PP were grouped as “endocrine cells” to compare against non-endocrine cells that were grouped by PSC, duct and acinar cells.
Identification of molecular signatures
We used Seurat FindMarker function to find marker genes of each cell cluster within each data set (cells from the same time point as one data set). Briefly, “bimod” test, or likelihood-ratio test based on zero inflated data for single cell gene expression were performed between tested cell cluster and all the other cells. For any given cell cluster, only genes that are expressed in more than 25% cells were considered. We then took 0.25 as the cutoff for log scale fold change to define cluster specific gene markers. Cells of S5, S6 and S7 are clearly separated as dual populations (general endocrines and non-endocrines). Therefore, we did a 2-step identification, where a low-resolution analysis was firstly performed to call gene markers of general endocrine and non-endocrine populations. Secondly, high-resolution gene markers are identified to distinguish sub-populations within endocrine and non-endocrine respectively.
Surface marker genes are particularly highlighted because of the potential application of population enrichment. We integrated human cell Surfaceome from a published database by J.P.C.da Cunha et al into our signature gene analysis57. Any annotated surface gene that shows up as a cell cluster marker gene is highlighted on Supplementary Data 1 and Supplementary Fig. 3.
Benchmark the similarity between the differentiated and the primary islet cell populations
To compare a specific cell population in stage 7 with the primary counterpart in human donors, we combined co-embedding analysis, PCA analysis, signature gene visualization and differential expression analysis. First, to identify the correspondences between the in vitro differentiated populations and the potential counterparts in primary islets, we used Seurat v3 to perform the co-embedding14. Briefly, we applied the canonical correlation analysis (CCA) to anchor the shared subpopulations across datasets. As CCA maximizes the correlation between the two datasets, it enables the robust identification of the relative similarity. Furthermore, to reveal the remaining differences, single cell data of S7-I (β-like cluster), S7-H (α-like cluster), islet β cell and islet α cells were pooled and renormalized. Highly variable genes were re-picked as described, which were used for PCA analysis. Next, the expression level of well-known signature genes for each cell type from literatures were then visualized by bubble plots (Fig. 1 and Extended Data Fig. 1). In the bubble plot, for any given gene, the expression levels of all single cells in one population were averaged. Averaged expression levels were then scaled across different populations. The Z-scores of scaled average expression levels were then visualized by color intensity. Similarly, for any given gene, the percentage of cells with detectable expression were also scaled across groups and shown by dot size. Third, differential expression analysis was performed to identify genes that are amplified or repressed in induced cells. Negative binomial (NB) distribution was used in differential expression (DE) analysis, for count data with over-dispersion. Here, we assume that for any gene in each cell, the transcripts number or UMI, can be modeled using NB distribution.
| (1) |
is the expected value of UMI;
β0 is the intercept, and βC and βD is the slope for C and D;
C stands for cell populations, which is a categorical variable;
sf stands for size factor, which is use to normalized the single cell transcriptome. It mainly corrects the sequencing depth of each cell (total transcript counts of a cell). However, the size factor can be biased due to the dropout zeros, therefore needs further correction. In this study, we calculated sf using the computeSumFactor function in a Bioconductor package scran58.
We performed a pair-wise comparison between any two cell types based on the negative binomial model described above. For each gene, we performed the regression analysis using the generalized linear model function glm.nb in the R package MASS. The p-value of pair-wise cell type specificity of any gene is provided by the function as the significance of βC. The p-values of all genes are further adjusted with Bioconductor package qvalue for to obtain q-values. We also computed log2 fold change between the average transcript counts. Differentially expressed genes (q-value < 0.05) were ranked by fold change. The statistics of DE genes are included in Supplementary Data 2.
GSEA functional enrichment analysis
Gene function enrichment analysis was performed by integrating MSigDB.v.5.259. All functional term lists were read into R by package “gage”. For any given group of genes, a binomial test (binom.test) was performed iteratively through all annotated functional terms. P values for enrichment were further adjusted using the qvalue package. Enrichment terms were ranked by q value. The most representative top terms were selected and visualized using heatmaps. On heatmap, q values of enriched terms were visualized by color intensity as enrichment score.
Reconstruction of the lineage tree
To reconstruct the lineage tree for a time-course directed differentiation process, we developed an algorithm that adopts a bottom-up strategy from “sub-transition-network”, i.e. a graph between two adjacent time points. We collected Drop-seq data from 12 time points along the whole differentiation process from human ES cell to insulin producing cells (stage 7) (Extended Data Fig. 1). The overall assumption is that most cells from one time-point is supposed to either develop into the cells at the same or next adjacent time point or be terminated by apoptosis for instance. We suppose it is less possible for cells from one time-point to randomly jump into cells at a far-away time point. Therefore, we took advantage of the timeline information to constrain the possible networks into an experimental related timing frame. We first built the relationships for cells from two adjacent time-point (sub-transition-network). To be exact, there are 11 data pairs for “sub-transition-network” reconstruction, including: H1~S0; S0~S1_D1; S1_D1~S1_D2; S1_D2~S2_D1; S2_D1~S2_D2; S2_D2~S2_D3; S2_D3~S3; S3~S4; S4~S5; S5~S6; S6~S7. The entire lineage tree was then reconstructed by stacking together all “sub-transition-networks”.
To build each “sub-transition-network”, we applied a cluster-based connectivity analysis with a home-made decision-making algorithm (Supplementary Fig. 4). Some available methods suggested the robustness of reconciling clustering and trajectory in building lineage trees60. With a similar principle, we characterized a “sub-transition-network” by building a cluster-based graph. First, we isolated single cell data for a pair of given adjacent data. For each of the two time points, cells were clustered using Seurat package as described above, respectively. With the cluster identity, those cells were then pooled together and renormalized. High-dimensional transcripts space was then reduced into a 10-dimension PC space. The centroid of each cluster was calculated in 10-dimension PC space. Euclidean distance between any two clusters was calculated which would be used to determine the cluster-cluster relationship in a “sub-transition-network”.
We treated a cluster from earlier (Cluster εi) or later time-point (Cluster λi) differently, where i represents a given cluster within time point ε or λ. Presumably, Cluster λi must be developed from either the other populations at the same time-point λ or earlier time-point ε. On the contrary, a Cluster εi may terminate besides developing to others. With this principle, we started by looking for connections for Cluster λi. First, we averaged all possible Euclidean distances in the current pool as a background distances threshold T. For any given Cluster λi, we identified the closest cluster from Clusters ε and compared the distance with T. If the distance is closer, a preliminary connection is created. For those Cluster λi with no preliminary connections, an internal relationship at time-point λ was interrogated. We identified the closest cluster within time-point λ for Cluster λi. If the distance is closer than T, an internal connection would be created. After establishing the preliminary connections, we further refined the relationships by correcting secondary connections. We checked on Cluster εi that show multiple connections with Cluster λi, λj λk… We identify the closest Cluster λi for this Cluster εi as the main connection. For the rest of connected Cluster λj λk…, another internal relationship at time-point λ is interrogated. For a given λj, let the distance of main connection between εi and λj be D. The closest internal cluster λx to λj was also calculated in the same space, the distance of which is indicated as D1. If D1 is less than D, the current preliminary connection would be replaced by an internal connection. After iteratively refining all connections, we created a sub-network as graph Gsub. Using this principle, we then created Gsub for any adjacent time point. Finally, we stacked all Gsub together into one complete graph G that delineated the full lineage tree (Fig. 1)
In graph G, each node indicates a cell cluster and each edge indicates the developmental relationship between two given clusters (Fig. 1b). We then reconstructed a pseudo-time trajectory between two connected nodes. We pooled all cells from all nodes together followed by normalization and dimension reduction by PCA. On the 10-dimension PC space, the centroid of node εi and node λi were calculated respectively. Two centroids were connected by a direction vector û. Next all the single cells from node εi and node λi were projected onto û. The relative position on the û was taken as “relative pseudo-time”. We did that iteratively for all the connected nodes and calculated relative pseudo-times. Finally, by stacking all the nodes together, we calibrated the relative pseudo-time into the full graph G. After projecting all cells on all the edges of graph G, we divided the full graph G into 1475 bins. The number of bins on any edge was determined by the distance on PC space. The longer the distance, the more bins would be taken. Each bin contains at least 50 cells. Next, graph G was visualized as in Fig. 2a. The distance on y axis indicates the relative distance on PC space between two nodes, but x axis is only used to distinguish different nodes. For any given gene, the averaged expression level was normalized by the total expression in the bin. The normalized average expression level of each gene was then visualized by color heat on the G map.
Classification of gene modules on lineage tree
Among all 17978 detected genes, we first selected a training gene set for gene module clustering. For any given gene, we averaged the top 20 highest expression bins. This value was used to filter out the genes that have never been highly expressed in any branch at any time. This resulted in 11838 genes that show high expression at a certain point. We then took the top 2000 highly variable genes (out of 11838 genes) based on coefficient of variation (CV). Using these 2000 genes as the training set, we firstly calculated Pearson’s correlation between any two genes across all 1475 bins on the G map. With the distance matrix, we further performed k-meloid clustering to partition 2000 genes into 64 gene modules. We chose 64 modules because our analysis called a total of 56 cell populations across all time points (Fig. 1a), and we reasoned that the number of gene modules should be larger than the number of cell populations. We initially test 32, 64 and 128 clusters and determined that 64 appears to be a better choice based on Elbow method. With the predefined gene modules by the training set, we further mapped the rest of genes (9838 genes) using K-nearest neighborhood (KNN,k=5) algorithm. Finally, we averaged the genes in the same module for each bin and manually ordered the 64 gene modules based on the apparent expression timing, as shown in Fig. 2a and Extended Data Fig. 4. GSEA enrichment analysis was performed for each gene module.
Trajectory analysis of β specific lineage
To specifically characterize the β cell differentiation, we pooled the single cells from the clusters on the main lineage highlighted in Fig. 1b, and performed re-normalization followed by PCA dimension reduction. On the 10-dimension PC space, we reconstructed the full pseudo-time trajectory by only connecting all the nodes on the main lineage. We further divided the full main lineage into 80 bins and for any given gene, the averaged expression level was normalized by the total expression in each bin. Considering the potential nonlinear nature of the time-dependent gene expression changes, we used polynomial regression to model the gene expression dynamics across the 80bins. The p-value of the goodness of fit for each gene was calculated and adjusted using q-value package. Additionally, we further aggregated the 80 bins into 10 big bins to estimate the expression fold change across time. We measured the fold change between the highest big-bin versus lowest big-bin. We firstly filtered the genes whose highest bin average expression lower than 0.01, i.e. expression can be detected in less than 1% cells even in relatively most highly expressed bin). Then, we identified time-dependent dynamic genes that fitted the regression model well (q-value<0.01) and also showed more than two-fold expression change between lowest and highest big-bin (as shown in Fig. 2, Extended Data Fig. 5). The rest of the genes were classified as constantly or stochastically expressed genes which do not show time-dependent expression change. To further stratify the timing of the time-dependent dynamic genes, we firstly selected the top 3000 genes with the lowest q-value of model fitness for a hierarchical clustering, which resulted in group A and B. Group A includes genes that are generally up-regulated across time whereas B includes downregulated genes. Within A and B, we did a secondary hierarchical clustering respectively that eventually resulted in gene group A1~A14, and B1 ~B12. Next, we mapped back the rest of genes into each group by finding the highest correlation. Using genes in each group, we then performed GSEA functional enrichment analysis as described above. We also compared the results from our trajectory analysis to the results from using Monocle320 (Extended Data Fig. 3). We found that Monocle3 cannot properly recognize the entire time-series of our data. For example, the cell identify undergoes drastic changes from S0 (hESC) to S1 (definite endoderm, DE) and S2 (gut tube, GT). The correlation between S1_D2 and S2_D1 is low because many DE marker genes are activated in S1 (including LEFTY1, NODAL, CECR4, etc.) and quickly turned off in S2. On the other hand, since the S1-specific genes are not expressed in both S0 and S2, the correlation between S0 and S2_D1 is higher. Due to this reason, Monocle320 called one branch connecting S0 to S1 but incorrectly called another branch from S0 directly to S2_D1 cells.
T2D/Glycemic GWAS genes in the major β-cell differentiation trajectory
Among the time-dependent dynamic genes, we particularly interrogated the reported genes associated with T2D and glycemic traits. We collected 698 genes reported from GWAS catalog with the traits including “Type 2 diabetes”, “Fasting blood glucose”, “Fasting blood glucose (BMI interaction)”, “Fasting blood glucose adjusted for BMI”, “Fasting plasma glucose”, “Fasting blood insulin”, “Fasting blood insulin (BMI interaction)”, “Fasting blood insulin adjusted for BMI”, “Fasting blood proinsulin levels”, “Fasting insulin (dietary factor interaction), “HMOA-B” (Supplementary Data 3)61. These genes were used for the analysis in Fig. 2d. Using all detected 17978 genes as background, we did a binomial test for the enrichment of diabetes/obesity GWAS genes in each gene group. In Fig. 2d, gene groups with p-value>0.05 show color white, whereas gene groups with p-value<0.05 are colored by enrichment p-value.
We also performed the Meta-Analysis Gene-set Enrichment of variaNT Associations (MAGENTA) analysis30 using the fine-mapping results from a massive meta-analysis of T2D GWAS studies29 (Extended Data Fig. 7). Briefly, we assigned every gene in the genome a set of SNPs that lie within 110 kilobase (kb) upstream and 40 kb downstream of the gene’s most extreme transcript boundaries. Each gene is then assigned a score, defined as the most significant posterior probability among the SNPs within the extended gene boundaries. Top 10% genes with highest score were used for enrichment analysis among gene groups (A1-B12) defined in Fig. 2b. The significance of enrichment of each gene group was measured by nominal p-value after randomly selecting the same number of genes in the genome. FDR were then computed using qvalue package in Bioconductor. We have provided the expression data for all dynamic genes whose extreme boundaries are overlapped with the 99% credible intervals (by 200kb extension for each interval) (Supplementary Data 3).
Time-dependent transcription factor motif enrichment analysis
We first overlapped known transcription factors (as listed in Supplementary Data 3) with 9117 time-dependent dynamic genes. Next, we selected genes that show expression peak at or earlier than stage 4 for a combinatory analysis with available Stage0~Stage4 H3K27ac ChIP-seq data. Starting from those genes, we then selected the ones with available DNA binding motif matrix form Hocomocov262 for further investigation (http://hocomoco11.autosome.ru/downloads_v11). Meanwhile, we processed the published H3K27ac Chipseq data27,28 and did peak-calling by MACS263. For each investigated transcription factor motif, we scanned on H3K27ac Chipseq peaks of each stage by the motif matrix using FIMO (http://meme-suite.org/doc/fimo.html)64. A significantly enriched motif in a given peak was defined by q-value<0.01. For each transcription factor, the number of enriched motifs across the whole genome was then normalized by the number of peaks, as “motif density” shown in Fig. 2. The single cell expression level was then aggregated into each stage as a pseudo-bulk RNA expression data for S0, S1, S2, S3 and S4, corresponding to each stage in H3K27ac data. Finally, we calculated the Pearson’s correlation r between RNA expression and motif density. The transcription factors with Pearson’s r >0.3 were defined as positively correlated transcription factor; Pearson’s r <−0.3 as negatively correlated transcription factor; −0.3<Pearson’s r <0.3 as undetermined.
Identification of “switch-like” genes associated with bifurcating cell fate choices
To examine the lineage bifurcation from the branch-point, we first pooled the involved clusters together, including S4C, S4A, S4E, S5E, S5C, S5G, S5I, S6A, and performed re-normalization followed by dimension reduction using PCA. Next, we reconstructed the pseudo-time trajectory for endocrine lineage (S4C, S4A, S4E, S5G and S5I) as well as non-endocrine lineage (S4C, S5E, S5C and S6A) respectively. For endocrine(endo) and nonendocrine (non) pseudo-time trajectories, we further divided into 40 bins respectively. We compared two trajectories from bin1 to bin40. For any given gene, we measured the averaged fold change across two lineages and invoked a paired Wilcox rank-sum test. We defined a lineage switch-like gene when it meets the criteria below 1), Averaged fold change more than two; 2), paired Wilcox ran-sum test adjusted p value less than 0.01. According to this rationale, we identified both nonendocrine specific (or nonendocrine “switch-like”) genes as well as endocrine specific (or endocrine lineage “switch-like”) genes.
We examined the specificity of the endocrine versus non-endocrine in the primary islet. In our previous work, we collected 39,095 single islet cell transcriptome data and performed the unsupervised clustering with cell-type annotations13. Here, we reaggregated α, β, δ, γ cells into “endocrine cells” and acinar, duct, PSC into “non-endocrine cells”. For each detectable gene in islet, we computed the expression fold change between the “endocrine cells” and the “non-endocrine cells”. Finally, we visualized and recorded the genes whose specificities (fold change direction) in vivo are consistent with that on the in vitro branching BP1. To cross-reference the human switch genes with mouse embryo data. We compared our switch genes with the “branch dependent genes” reported by Scavuzzo et al.36 We used Fisher’s exact test to test if the genes from human and mouse data have the same endocrine or non-endocrine specificity. To predict the potential regulatory relationships between the switch transcription factors and the co-expressed switch genes, we used the Transcription Factor Target Gene Database (TFBSDB)32 to infer the target genes of the switch TFs. We computed the Pearson’s correlation of the expression pattern on the two branches from BP1 between the given TF and the putative targets. Statistics are included in Supplementary Data 3. The top co-expressed switch TF-target pairs (Pearson’s r>0.6) are visualized using igraph.
Double-wave gene analysis
To identify double-wave genes in the trajectory of β-cell differentiation, we grouped all 27,554 cells along the trajectory into 16 bins. We firstly located the bin with the lowest expression level as “expression valley” for each gene. We then identify the bin with highest expression before the “expression valley” (upstream peak), and the bin with highest expression after the “expression valley” (downstream peak). We filtered out lowly expressed genes by requiring the expression level of upstream and downstream peak to be at least 0.1 (transcript should be detected in > 10% cells). We also require the upstream or downstream peaks should be at least 2.5-fold of the expression level at “expression valley”, and the ratio between upstream and downstream peaks should be less than 5-fold. We then classified all double-wave genes into 5 groups with expression valley at S1, S2, S3, S4, S5/6. H3K27ac occupancy at promoters are the ChIP-seq rpkm within the region TSS+/−5kb. To match the double-wave expression and the epigenetic profiles, we computed the Pearson’s r between averaged expression (for each time point) and normalized H3K27ac occupancy. The statistics are included in Supplementary Data 5.
Extended Data
Extended Data Fig. 1. Schematics of experimental design and benchmark of differentiated cell maturity.

(a) On the top is the timeline of the directed β-cell differentiation process that takes 31 days encompassing 7 stages. Each stage recapitulates an in vivo developmental stage respectively. The key chemicals added at different time points are listed. Cells from each of the 12 time points are collected for Drop-seq experiments. For instance, S1_D1 stands for stage 1 day 1. (b) Glucose stimulated insulin secretion (GSIS) assay for differentiated Stage7 cells. Three rounds of glucose challenges were performed before final treatment with KCl (detail in Methods). n=3 biologically independent replicates. Error bars show +/− 1 standard error of mean (SEM). One-sided Student’s t-test was performed. *** indicates p-value<0.01. The exact p-values (multiple test unadjusted) for 1st, 2nd and 3rd glucose challenge are 1.4*10−4; 2.8*10−3 and 3.2*10−4 respectively. (c) CCA-based co-embedding analysis between the differentiated cells and the primary islet dataset. (d) Cell type specific marker genes visualized on co-embedded UMAP. Color intensity indicates relative expression level (Z score). (e) Bubble plot of endocrine and non-endocrine signature genes in different populations (Extended for Figure 1f). Color intensity indicates the Z score of averaged expression levels; bubble size indicates the percentage of expressing cells.
Extended Data Fig. 2. Unsupervised clustering of sub-populations from Stage 4 to Stage 7.

(a) Two step clustering for S4, S5, S6, S7 respectively. For each stage, a low-resolution clustering for all cells is shown on the left, where two big populations, endocrine (green) and non-endocrine (grey), are clearly separated. On the right are the secondary high-resolution sub-clusters for non-endocrine (right top of each stage) and endocrine population (right bottom of each stage) respectively. Below the tSNEs is the endocrine/non-endocrine population summary for each stage (b) Endocrine marker genes examination (NEUROD1, CPE and CHGA) on first low-resolution tSNE map for each stage. Color intensity indicates relative expression level (z score). (c) Summary of the sub-populations of stage 7. (d-g) Marker gene examinations on stage 7 endocrine tSNE plot. Color intensity indicates relative expression level (z score) with INS for beta-like population(d); GCG for alpha-like population(e); EC-like population markers(f); and proliferation markers(g).
Extended Data Fig. 3. Comparison of trajectory inference algorithms.

(a-b) Global lineage inference connecting cells from all 12 time points in the same UMAP embedding, using the method in this manuscript in (a) and using Monocle3 in (b). Note that starting from H1/S0, Monocle3 created a branch directly to Stage 2 Day1 (S2_D1), bypassing the time points in Stage 1. (c) Differentially expressed genes among H1(ES), S1_D2 and S2_D1. Color intensity indicates the expression level. TPM: transcripts per million UMI. (d-g) Our method and Monocle3 inferred the consistent local differentiation trajectories. Local trajectory inference of S4 and S5 starting from Branch point 1 (BP1), using our method is shown in(d) and using Monocle3 in (e). Local trajectory inference of α-like and β-like lineages starting from branch point 2 (BP2), using our method is shown in (f) and using Monocle3 in (g). (h) Side-by-side comparisons of switch genes at BP1 in Figure 3b between on our trajectories (Left panels) and on Monocle3 trajectories (Right panels). (i) Similar to (g), side-by-side comparison between our method and Monocle3 for BP2 switch genes reported in Extended Data Figure 8b).
Extended Data Fig. 4. Lineage specific gene modules on full developmental tree.

(a) 64 gene modules extended for figure 2a. Each gene module contains a couple of hundreds of genes that share a similar expression pattern of time & lineage specificity on the full developmental tree. Three representative genes in each module are shown. For full list see Supplementary Data 3. ME: meso-endoderm; DE: definitive endoderm; FG: foregut. PL: PSC-like; DL: Duct-like; EC: enterochromaffin cells; βL: β-like; αL: α-like. (b) Expression of islet cell type specific marker genes are illustrated on the full tree. The color intensity indicates the relative expression level. INS: beta cell marker; GCG: alpha cell marker; SST: delta cell marker; PPY: gamma cell marker and GHRL: epsilon cell marker (c) Expression of representative cell cycle genes are illustrated on the full tree. Color intensity indicates the relative expression level.
Extended Data Fig. 5. Examples of time dependent dynamic genes on β-like specific lineage.

(a) Characterization of genes along β-like specific lineage highlighted in figure 1b. Left pie-chart: Summary of genes in each category. Out of all the genes, 11876 genes with detectable expression level. 9117 genes show time dependent expression pattern. Right histogram: histogram showing the number of genes with different variance across time. Dashed line indicates 2-fold relative expression change along trajectory. (b-f) Show the examples of time dependent dynamic genes from ES cell to beta cell lineage. (b) shows the cell cycle genes. (c) shows the developmental genes (d) shows classic beta cell signature genes. (e) and (f) shows calcium channel and sodium channel genes respectively. The color intensity indicates the relative expression level (z score).
Extended Data Fig. 6. Time dependent TF motif analysis on β-like specific lineage.

(a) Summary of the motif analysis flow. 769 transcription factors show time dependent expression pattern. 195 TFs out of those have reported DNA binding motif matrix that can be used for motif enrichment analysis. 85 out of 195 shows motif enrichment at least in one of the 7 stage H3K27ac peaks genome wide. For these 85 TFs, the single cell expression level was aggregated into each stage as a pseudo-bulk RNA expression data; TF motif density among enhancers from each stage of H3K27ac can be then correlated to the TF expression. We defined positive correlation when r >0.3 (Pearson’s correlation coefficient), and defined negative correlation when r < −0.3. 48 TFs show positive correlation between expression pattern and motif density pattern. 24 TFs show negative correlation. 13 TFs with no significant correlation. (b) The details of all correlated 72 TFs. For each TF, Top panel shows the relative expression change along the pseudo-time computed from single-cell RNA data. Bottom shows the TF motif enrichment on genome-wide H3K27ac peaks across 7 stages. Stage labels are shown in the middle, shared by top and bottom panels. Green: positive correlation; Red: Negative correlation.
Extended Data Fig. 7. Time dependent dynamic GWAS genes on β-like specific lineage.

(a) Heatmap showing top time dependent dynamic T2D/glycemic GWAS genes from ES cell to beta cell lineage highlighted in figure 1b. The color intensity indicates the relative expression level. The left color bar indicates the traits associated with a certain gene. Gene loci associated with both T2D and glycemic traits are highlighted in bold with asterisk. On the right: bubble plot showing the expression level in human primary beta cells. The size of the bubble indicates the percentage of cells with detectable expression. Bubble color indicates the averaged expression level. Full list of dynamic T2D/glycemic GWAS genes in Supplementary Data 3. (b) MAGENTA enrichment for stage-specific gene groups (defined in Figure 2b) by T2D GWAS 99% credible variants. The significance of enrichment of each gene group was measured by nominal p-value after randomly selecting the same number of genes in the genome. (For more details, see Methods). Multiple tests are adjusted by qvalue.
Extended Data Fig. 8. Molecular profiling of lineage specification between α-like and β-like lineages.

(a) PCA analysis of pooled populations for the bifurcation of β-like and α-like lineages, including S5-I, S6-E, S7-H for α-like and S5-I, S6-D, S7-I for β-like, respectively. α-like in yellow, β-like in green, cells of BP2 (S5I) is in grey. (b) Heatmap showing β-like vs α-like lineage switch genes. 282 genes are specifically up-regulated in β-like lineage. 58 genes are specifically up-regulated in α-like lineage. (c) Fold change between primary β vs. primary α cells computed from human islet Drop-Seq for each gene in (b). (d) GSEA functional enrichment in β-like and α-like lineage genes respectively. Color intensity indicates enrichment score (One-sided binomial test, adjusted q value). Gene numbers of all enriched functional terms are shown. The exact q values for the presented 8 terms (top-down) are: 2.6*10−2, 1.1*10−15, 9.6*10−9, 3.8*10−9, 7*10−3, 1.9*10−5, 4.9*10−5, 4.2*10-5. (e) The β-like and α-like lineage switch transcription factors. (f) Fold change between primary β vs. primary α cells computed from human islet Drop-Seq for each lineage transcription factor in (e).
Extended Data Fig. 9. Assessing the effects of ROCKII inhibition on the endocrine differentiation and protocol optimization.

(a) The tSNE plots of S5 ~ S7 cells differentiated with or without ROCKII inhibitor (Ro.In). Green: endocrine cells; grey: non-endocrine cells. (b) Heatmap of 6872 unimodal time-dependent genes on ES to beta-like lineage on two protocols. (c) Marker genes visualized on lineage tree of both standard and Ro.In+ protocol. The expression patterns of marker genes are consistent in two protocols. NEUROG3 for endocrine precursors; CHGA, CHGB, CPE, PAX6, NEUROD1 for endocrine cells. FOXA2, PDX1, INSM1, INS for β-like cells. GCG, ARX for α-like cells. SST, HHEX for delta-like cells. (d) PCA analysis for three populations: primary β cell (Grey); β-like cell in standard protocol(S7-I); β-like cell in Ro-in+ protocol(S7R-F). (e) Hormone gene transcripts proportion. Top panel is insulin transcripts proportion across 6 populations: islet β; β-like in standard protocol; β-like in Ro-in+ protocol; islet α; α-like in standard protocol; α-like in Ro-in+ protocol. Bottom panel is glucagon proportion across those 6 cell populations. (n= 3953, 421, 1676, 5700, 732, 655 single cells for islet-β, β-like, β-like-Ro.In+, islet-α, α-like, α-like-Ro.In+ respectively). Boxplots are shown within the violin plots, where the middle line is the median, the lower and upper hinges correspond to the first and third quartiles, the upper whisker extends from the hinge to the largest value no further than 1.5 × IQR from the hinge, the lower whisker extends from the hinge to the smallest value at most 1.5 × IQR of the hinge (IQR is the inter-quartile range) (f) Schematics of six differentiation protocols with or without ROCKII inhibition at different stages. (g) Visualization of ROCK2 expression in the lineage tree. (h) Flow cytometry data showing the yield of pancreatic progenitors (NKX6.1+/PDX1+), endocrine cells (NKX2.2+ CHGA+) and β-like cells (C-peptide+/NKX6-1+) at the end of stage 4, Stage 5, and Stage 6 with different protocols in (f). The standard protocol without ROCKII inhibition (condition 6) was included as control.
Extended Data Fig. 10. H3K27ac ChIP-seq on the promoters and distal enhancers of double wave genes.

(a) Density heatmap displaying the H3K27ac on TSSs of double wave genes across 7 stages. ChIP-seq signal is plotted as reads per million per base pair in TSS ± 5kb region (b) Density heatmap displaying the H3K27ac on putative distal enhancers within 250kb from TSSs of double wave genes across 7 stages. ChIP-seq signal is plotted as reads per million per base pair in enhancer peak center ± 5kb region. (c) Eight T2D GWAS fine-mapping signals at TCF7L2 loci reported by Mahajan et al. Black vertical lines in the top tracks are 99% credible variants in each signal; red lines are the leading SNPs.
Supplementary Material
Acknowledgement
This work was supported by grants from NIH ( R01DK113185 to Y.L. and R01HG009658 to F.J.), Mt. Sinai Health Care Foundation (OSA510114 to Yan Li and OSA510113 to F.J.), a pilot award from Clinical and Translational Science Collaborative (CTSC) at Case Western Reserve University (VSN639001 to Y.L.). A.G. is supported by a NIH MSTP training grant (T32 GM007250) and a Functional Genomics Training Program grant (T32 GM135081). We also gratefully acknowledge the insightful discussions with Scavuzzo M., Liu X., Zhang S., Lu L., and Wang L.
Footnotes
Competing interests
The authors declare no competing interests.
Data Availability
Raw and processed Drop-Seq data are accessible at GEO: GSE143783.
Web app link: http://hiview.case.edu/public/BetaCellHub/differentiation.php
GWAS data were downloaded from the GWAS catalog65 (https://www.ebi.ac.uk/gwas/). The list of transcription factors (TFs) was obtained from the transcriptional factor prediction database (DBD)66 (http://www.transcriptionfactor.org/). The list of cell surface proteins was downloaded from a previous study57. All these downloaded gene lists are also included in Supplementary Data 3.
All other data that support the findings of this study are available from the corresponding author upon reasonable request.
Code Availability
Reference
- 1.D’Amour KA et al. Production of pancreatic hormone-expressing endocrine cells from human embryonic stem cells. Nature biotechnology 24, 1392–1401, doi: 10.1038/nbt1259 (2006). [DOI] [PubMed] [Google Scholar]
- 2.Kroon E et al. Pancreatic endoderm derived from human embryonic stem cells generates glucose-responsive insulin-secreting cells in vivo. Nature biotechnology 26, 443–452, doi: 10.1038/nbt1393 (2008). [DOI] [PubMed] [Google Scholar]
- 3.Kelly OG et al. Cell-surface markers for the isolation of pancreatic cell types derived from human embryonic stem cells. Nature biotechnology 29, 750–756, doi: 10.1038/nbt.1931 (2011). [DOI] [PubMed] [Google Scholar]
- 4.Pagliuca FW et al. Generation of functional human pancreatic beta cells in vitro. Cell 159, 428–439, doi: 10.1016/j.cell.2014.09.040 (2014). [DOI] [PMC free article] [PubMed] [Google Scholar]
- 5.Rezania A et al. Reversal of diabetes with insulin-producing cells derived in vitro from human pluripotent stem cells. Nature biotechnology 32, 1121–1133, doi: 10.1038/nbt.3033 (2014). [DOI] [PubMed] [Google Scholar]
- 6.Osafune K et al. Marked differences in differentiation propensity among human embryonic stem cell lines. Nature biotechnology 26, 313–315, doi: 10.1038/nbt1383 (2008). [DOI] [PubMed] [Google Scholar]
- 7.Bruin JE et al. Characterization of polyhormonal insulin-producing cells derived in vitro from human embryonic stem cells. Stem cell research 12, 194–208, doi: 10.1016/j.scr.2013.10.003 (2014). [DOI] [PubMed] [Google Scholar]
- 8.Nostro MC et al. Stage-specific signaling through TGFbeta family members and WNT regulates patterning and pancreatic specification of human pluripotent stem cells. Development 138, 861–871, doi: 10.1242/dev.055236 (2011). [DOI] [PMC free article] [PubMed] [Google Scholar]
- 9.Sharon N et al. Wnt Signaling Separates the Progenitor and Endocrine Compartments during Pancreas Development. Cell reports 27, 2281–2291 e2285, doi: 10.1016/j.celrep.2019.04.083 (2019). [DOI] [PMC free article] [PubMed] [Google Scholar]
- 10.Veres A et al. Charting cellular identity during human in vitro beta-cell differentiation. Nature 569, 368–373, doi: 10.1038/s41586-019-1168-5 (2019). [DOI] [PMC free article] [PubMed] [Google Scholar]
- 11.Macosko EZ et al. Highly Parallel Genome-wide Expression Profiling of Individual Cells Using Nanoliter Droplets. Cell 161, 1202–1214, doi: 10.1016/j.cell.2015.05.002 (2015). [DOI] [PMC free article] [PubMed] [Google Scholar]
- 12.Xue R et al. A Rising Star in Pancreatic Diseases: Pancreatic Stellate Cells. Frontiers in physiology 9, 754, doi: 10.3389/fphys.2018.00754 (2018). [DOI] [PMC free article] [PubMed] [Google Scholar]
- 13.Fang Z et al. Single-Cell Heterogeneity Analysis and CRISPR Screen Identify Key beta-Cell-Specific Disease Genes. Cell reports 26, 3132–3144 e3137, doi: 10.1016/j.celrep.2019.02.043 (2019). [DOI] [PMC free article] [PubMed] [Google Scholar]
- 14.Stuart T et al. Comprehensive Integration of Single-Cell Data. Cell 177, 1888–1902 e1821, doi: 10.1016/j.cell.2019.05.031 (2019). [DOI] [PMC free article] [PubMed] [Google Scholar]
- 15.Hrvatin S et al. Differentiated human stem cells resemble fetal, not adult, beta cells. Proceedings of the National Academy of Sciences of the United States of America 111, 3038–3043, doi: 10.1073/pnas.1400709111 (2014). [DOI] [PMC free article] [PubMed] [Google Scholar]
- 16.Rezania A et al. Maturation of human embryonic stem cell-derived pancreatic progenitors into functional islets capable of treating pre-existing diabetes in mice. Diabetes 61, 2016–2029, doi: 10.2337/db11-1711 (2012). [DOI] [PMC free article] [PubMed] [Google Scholar]
- 17.Riedel MJ et al. Immunohistochemical characterisation of cells co-producing insulin and glucagon in the developing human pancreas. Diabetologia 55, 372–381, doi: 10.1007/s00125-011-2344-9 (2012). [DOI] [PubMed] [Google Scholar]
- 18.Hu He KH et al. In vivo conditional Pax4 overexpression in mature islet beta-cells prevents stress-induced hyperglycemia in mice. Diabetes 60, 1705–1715, doi: 10.2337/db10-1102 (2011). [DOI] [PMC free article] [PubMed] [Google Scholar]
- 19.Saelens W, Cannoodt R, Todorov H & Saeys Y A comparison of single-cell trajectory inference methods. Nature biotechnology 37, 547–554, doi: 10.1038/s41587-019-0071-9 (2019). [DOI] [PubMed] [Google Scholar]
- 20.Cao J et al. The single-cell transcriptional landscape of mammalian organogenesis. Nature 566, 496–502, doi: 10.1038/s41586-019-0969-x (2019). [DOI] [PMC free article] [PubMed] [Google Scholar]
- 21.Georgia S, Soliz R, Li M, Zhang P & Bhushan A p57 and Hes1 coordinate cell cycle exit with self-renewal of pancreatic progenitors. Dev Biol 298, 22–31, doi: 10.1016/j.ydbio.2006.05.036 (2006). [DOI] [PubMed] [Google Scholar]
- 22.Baron M et al. A Single-Cell Transcriptomic Map of the Human and Mouse Pancreas Reveals Inter- and Intra-cell Population Structure. Cell Syst 3, 346–360 e344, doi: 10.1016/j.cels.2016.08.011 (2016). [DOI] [PMC free article] [PubMed] [Google Scholar]
- 23.Segerstolpe A et al. Single-Cell Transcriptome Profiling of Human Pancreatic Islets in Health and Type 2 Diabetes. Cell Metab 24, 593–607, doi: 10.1016/j.cmet.2016.08.020 (2016). [DOI] [PMC free article] [PubMed] [Google Scholar]
- 24.Lawlor N et al. Single-cell transcriptomes identify human islet cell signatures and reveal cell-type-specific expression changes in type 2 diabetes. Genome research 27, 208–222, doi: 10.1101/gr.212720.116 (2017). [DOI] [PMC free article] [PubMed] [Google Scholar]
- 25.Chiou J et al. Single cell chromatin accessibility reveals pancreatic islet cell type- and state-specific regulatory programs of diabetes risk. bioRxiv, doi:doi.org/10.1101/693671 (2019). [DOI] [PMC free article] [PubMed] [Google Scholar]
- 26.Chen Q & Hu G Post-transcriptional regulation of the pluripotent state. Curr Opin Genet Dev 46, 15–23, doi: 10.1016/j.gde.2017.06.010 (2017). [DOI] [PMC free article] [PubMed] [Google Scholar]
- 27.Wang A et al. Epigenetic priming of enhancers predicts developmental competence of hESC-derived endodermal lineage intermediates. Cell stem cell 16, 386–399, doi: 10.1016/j.stem.2015.02.013 (2015). [DOI] [PMC free article] [PubMed] [Google Scholar]
- 28.Alvarez-Dominguez JR et al. Circadian Entrainment Triggers Maturation of Human In Vitro Islets. Cell stem cell 26, 108–122 e110, doi: 10.1016/j.stem.2019.11.011 (2020). [DOI] [PubMed] [Google Scholar]
- 29.Mahajan A et al. Fine-mapping type 2 diabetes loci to single-variant resolution using high-density imputation and islet-specific epigenome maps. Nat Genet 50, 1505–1513, doi: 10.1038/s41588-018-0241-6 (2018). [DOI] [PMC free article] [PubMed] [Google Scholar]
- 30.Segre AV et al. Common inherited variation in mitochondrial genes is not enriched for associations with type 2 diabetes or related glycemic traits. PLoS genetics 6, doi: 10.1371/journal.pgen.1001058 (2010). [DOI] [PMC free article] [PubMed] [Google Scholar]
- 31.Perez-Alcantara M et al. Patterns of differential gene expression in a cellular model of human islet development, and relationship to type 2 diabetes predisposition. Diabetologia 61, 1614–1622, doi: 10.1007/s00125-018-4612-4 (2018). [DOI] [PMC free article] [PubMed] [Google Scholar]
- 32.Plaisier CL et al. Causal Mechanistic Regulatory Network for Glioblastoma Deciphered Using Systems Genetics Network Analysis. Cell Syst 3, 172–186, doi: 10.1016/j.cels.2016.06.006 (2016). [DOI] [PMC free article] [PubMed] [Google Scholar]
- 33.van Gurp L et al. A transcriptomic roadmap to alpha- and beta-cell differentiation in the embryonic pancreas. Development 146, doi: 10.1242/dev.173716 (2019). [DOI] [PubMed] [Google Scholar]
- 34.Krentz NAJ et al. Single-Cell Transcriptome Profiling of Mouse and hESC-Derived Pancreatic Progenitors. Stem cell reports 11, 1551–1564, doi: 10.1016/j.stemcr.2018.11.008 (2018). [DOI] [PMC free article] [PubMed] [Google Scholar]
- 35.Byrnes LE et al. Lineage dynamics of murine pancreatic development at single-cell resolution. Nature communications 9, 3922, doi: 10.1038/s41467-018-06176-3 (2018). [DOI] [PMC free article] [PubMed] [Google Scholar]
- 36.Scavuzzo MA et al. Endocrine lineage biases arise in temporally distinct endocrine progenitors during pancreatic morphogenesis. Nature communications 9, 3356, doi: 10.1038/s41467-018-05740-1 (2018). [DOI] [PMC free article] [PubMed] [Google Scholar]
- 37.Velazco-Cruz L et al. Acquisition of Dynamic Function in Human Stem Cell-Derived beta Cells. Stem cell reports 12, 351–365, doi: 10.1016/j.stemcr.2018.12.012 (2019). [DOI] [PMC free article] [PubMed] [Google Scholar]
- 38.Murtaugh LC, Stanger BZ, Kwan KM & Melton DA Notch signaling controls multiple steps of pancreatic differentiation. Proceedings of the National Academy of Sciences of the United States of America 100, 14920–14925, doi: 10.1073/pnas.2436557100 (2003). [DOI] [PMC free article] [PubMed] [Google Scholar]
- 39.Apelqvist A et al. Notch signalling controls pancreatic cell differentiation. Nature 400, 877–881, doi: 10.1038/23716 (1999). [DOI] [PubMed] [Google Scholar]
- 40.Jensen J et al. Control of endodermal endocrine development by Hes-1. Nat Genet 24, 36–44, doi: 10.1038/71657 (2000). [DOI] [PubMed] [Google Scholar]
- 41.Ghazizadeh Z et al. ROCKII inhibition promotes the maturation of human pancreatic beta-like cells. Nature communications 8, 298, doi: 10.1038/s41467-017-00129-y (2017). [DOI] [PMC free article] [PubMed] [Google Scholar]
- 42.Hogrebe NJ, Augsornworawat P, Maxwell KG, Velazco-Cruz L & Millman JR Targeting the cytoskeleton to direct pancreatic differentiation of human pluripotent stem cells. Nature biotechnology 38, 460–470, doi: 10.1038/s41587-020-0430-6 (2020). [DOI] [PMC free article] [PubMed] [Google Scholar]
- 43.Tsuchiya M et al. Cholesterol biosynthesis pathway intermediates and inhibitors regulate glucose-stimulated insulin secretion and secretory granule formation in pancreatic beta-cells. Endocrinology 151, 4705–4716, doi: 10.1210/en.2010-0623 (2010). [DOI] [PubMed] [Google Scholar]
- 44.Xia F et al. Inhibition of cholesterol biosynthesis impairs insulin secretion and voltage-gated calcium channel function in pancreatic beta-cells. Endocrinology 149, 5136–5145, doi: 10.1210/en.2008-0161 (2008). [DOI] [PubMed] [Google Scholar]
- 45.Bailey KA et al. Evidence of non-pancreatic beta cell-dependent roles of Tcf7l2 in the regulation of glucose metabolism in mice. Hum Mol Genet 24, 1646–1654, doi: 10.1093/hmg/ddu577 (2015). [DOI] [PMC free article] [PubMed] [Google Scholar]
- 46.Jin T Current Understanding on Role of the Wnt Signaling Pathway Effector TCF7L2 in Glucose Homeostasis. Endocrine reviews 37, 254–277, doi: 10.1210/er.2015-1146 (2016). [DOI] [PubMed] [Google Scholar]
- 47.Sokol SY Maintaining embryonic stem cell pluripotency with Wnt signaling. Development 138, 4341–4350, doi: 10.1242/dev.066209 (2011). [DOI] [PMC free article] [PubMed] [Google Scholar]
- 48.Lyssenko V et al. Mechanisms by which common variants in the TCF7L2 gene increase risk of type 2 diabetes. J Clin Invest 117, 2155–2163, doi: 10.1172/JCI30706 (2007). [DOI] [PMC free article] [PubMed] [Google Scholar]
- 49.Viñuela A et al. Influence of genetic variants on gene expression in human pancreatic islets - implications for type 2 diabetes. bioRxiv, doi:doi: 10.1101/655670 (2019). [DOI] [Google Scholar]
- 50.Ikeda H et al. Involvement of Rho/Rho kinase pathway in regulation of apoptosis in rat hepatic stellate cells. Am J Physiol Gastrointest Liver Physiol 285, G880–886, doi: 10.1152/ajpgi.00039.2003 (2003). [DOI] [PubMed] [Google Scholar]
- 51.Genuth NR & Barna M The Discovery of Ribosome Heterogeneity and Its Implications for Gene Regulation and Organismal Life. Mol Cell 71, 364–374, doi: 10.1016/j.molcel.2018.07.018 (2018). [DOI] [PMC free article] [PubMed] [Google Scholar]
- 52.Gerst JE Pimp My Ribosome: Ribosomal Protein Paralogs Specify Translational Control. Trends in genetics : TIG 34, 832–845, doi: 10.1016/j.tig.2018.08.004 (2018). [DOI] [PubMed] [Google Scholar]
- 53.Fulco CP et al. Activity-by-contact model of enhancer-promoter regulation from thousands of CRISPR perturbations. Nat Genet 51, 1664–1669, doi: 10.1038/s41588-019-0538-0 (2019). [DOI] [PMC free article] [PubMed] [Google Scholar]
- 54.Lu L et al. Robust Hi-C Maps of Enhancer-Promoter Interactions Reveal the Function of Non-coding Genome in Neural Development and Diseases. Mol Cell 79, 521–534 e515, doi: 10.1016/j.molcel.2020.06.007 (2020). [DOI] [PMC free article] [PubMed] [Google Scholar]
Methods-only References
- 55.Gu B et al. Transcription-coupled changes in nuclear mobility of mammalian cis-regulatory elements. Science 359, 1050–1055, doi: 10.1126/science.aao3136 (2018). [DOI] [PMC free article] [PubMed] [Google Scholar]
- 56.Labun K et al. CHOPCHOP v3: expanding the CRISPR web toolbox beyond genome editing. Nucleic acids research 47, W171–W174, doi: 10.1093/nar/gkz365 (2019). [DOI] [PMC free article] [PubMed] [Google Scholar]
- 57.da Cunha JP et al. Bioinformatics construction of the human cell surfaceome. Proceedings of the National Academy of Sciences of the United States of America 106, 16752–16757, doi: 10.1073/pnas.0907939106 (2009). [DOI] [PMC free article] [PubMed] [Google Scholar]
- 58.Lun AT, Bach K & Marioni JC Pooling across cells to normalize single-cell RNA sequencing data with many zero counts. Genome Biol 17, 75, doi: 10.1186/s13059-016-0947-7 (2016). [DOI] [PMC free article] [PubMed] [Google Scholar]
- 59.Subramanian A et al. Gene set enrichment analysis: a knowledge-based approach for interpreting genome-wide expression profiles. Proceedings of the National Academy of Sciences of the United States of America 102, 15545–15550, doi: 10.1073/pnas.0506580102 (2005). [DOI] [PMC free article] [PubMed] [Google Scholar]
- 60.Wolf FA et al. PAGA: graph abstraction reconciles clustering with trajectory inference through a topology preserving map of single cells. Genome Biol 20, 59, doi: 10.1186/s13059-019-1663-x (2019). [DOI] [PMC free article] [PubMed] [Google Scholar]
- 61.Buniello A et al. The NHGRI-EBI GWAS Catalog of published genome-wide association studies, targeted arrays and summary statistics 2019. Nucleic acids research 47, D1005–D1012, doi: 10.1093/nar/gky1120 (2019). [DOI] [PMC free article] [PubMed] [Google Scholar]
- 62.Kulakovskiy IV et al. HOCOMOCO: towards a complete collection of transcription factor binding models for human and mouse via large-scale ChIP-Seq analysis. Nucleic acids research 46, D252–D259, doi: 10.1093/nar/gkx1106 (2018). [DOI] [PMC free article] [PubMed] [Google Scholar]
- 63.Zhang Y et al. Model-based analysis of ChIP-Seq (MACS). Genome Biol 9, R137, doi: 10.1186/gb-2008-9-9-r137 (2008). [DOI] [PMC free article] [PubMed] [Google Scholar]
- 64.Bailey TL et al. MEME SUITE: tools for motif discovery and searching. Nucleic acids research 37, W202–208, doi: 10.1093/nar/gkp335 (2009). [DOI] [PMC free article] [PubMed] [Google Scholar]
- 65.MacArthur J et al. The new NHGRI-EBI Catalog of published genome-wide association studies (GWAS Catalog). Nucleic acids research 45, D896–D901, doi: 10.1093/nar/gkw1133 (2017). [DOI] [PMC free article] [PubMed] [Google Scholar]
- 66.Wilson D, Charoensawan V, Kummerfeld SK & Teichmann SA DBD--taxonomically broad transcription factor predictions: new content and functionality. Nucleic acids research 36, D88–92, doi: 10.1093/nar/gkm964 (2008). [DOI] [PMC free article] [PubMed] [Google Scholar]
Associated Data
This section collects any data citations, data availability statements, or supplementary materials included in this article.