

We previously reported that TLR3.rs3775290 ‘CC’ genotype was associated with HCV chronicity, while TLR9 gene played no role in this infection. Herein, we show a significant association between the outcome of the HCV‐specific cell‐mediated immune (CMI) response and TLR9.rs5743836 genotype among the total responding subjects with different HCV states (p=0.005) and among the chronic HCV patients (p=0.044). We conclude that TLR9.rs5743836 SNP; but not TLR3.rs3775290 or TLR9.rs352140 genotypes; could predict the outcome of HCV‐specific CMI responses among HCV genotype‐4‐infected Egyptians.
Keywords: CMI, cell‐mediated immunity, HCV, health‐care workers, SNP, TLR‐3, TLR‐9
Summary
Variations in the immune response could explain resistance to hepatitis C virus (HCV) infection. Toll‐like receptor gene (TLR)‐3 is an innate detector of dsRNA viruses, and the TLR‐9 gene recognizes bacterial and viral unmethylated cytosine–phosphate–guanosine (CpG) motifs. We previously reported that the TLR‐3.rs3775290 CC genotype was associated with HCV chronicity and that the TLR‐9 gene played no major role in this infection. This study identified the role of TLR‐3.rs3775290 (c.1377C/T), TLR‐9.rs5743836 (−1237T→C) and TLR‐9.rs352140 (G2848A) gene polymorphisms in predicting the outcome of HCV‐specific cell‐mediated immunity (CMI) among Egyptian health‐care workers (HCWs). We enrolled 265 HCWs in this study and divided them into four groups. Group 1: 140 seronegative‐aviraemic HCWs; group 2: 20 seronegative‐viraemic HCWs; group 3: 35 subjects with spontaneously resolved HCV infection; and group 4: 70 chronic HCV HCWs (patients). All subjects were genotyped by polymerase chain reaction–restriction fragment length polymorphism (PCR‐RFLP) analysis for the TLR‐3.rs3775290, TLR‐9.rs5743836 and TLR‐9.rs352140 single nucleotide polymorphisms (SNPs). We also quantified HCV‐specific CMI in the four groups using an interferon (IFN)‐γ enzyme‐linked immunospot (ELISPOT) assay in response to nine HCV genotype 4a, overlapping 15mer peptide pools covering the whole viral genome. No statistically significant difference was found between CMI‐responding subjects with different HCV states and TLR‐3.rs3775290 or TLR‐9.rs352140 genotypes. However, there was a significant relationship between the outcome of the HCV‐specific CMI and the TLR‐9.rs5743836 genotype among the responding subjects (P = 0·005) and the chronic HCV patients (P = 0·044). In conclusion, TLR‐9.rs5743836 SNP, but not TLR‐3.rs3775290 or TLR‐9.rs352140 genotypes, could predict the outcome of HCV‐specific CMI responses among Egyptians infected with genotype‐4.
Introduction
Variations in the immune response could explain the resistance to hepatitis C virus (HCV) infection particularly among seronegative health‐care workers (HCWs), as reviewed elsewhere [1]. The Toll‐like receptor (TLR)‐3 gene is an innate detector of the dsRNA of viruses, and the TLR‐9 gene recognizes bacterial and viral unmethylated cytosine–phosphate–guanosine (CpG) motifs. HCV virions bind to the cell surface and enter the cell through receptor‐mediated endocytosis. Different regions of the HCV are recognized by different TLRs. The core and non‐structural (NS) proteins are vital sequences recognized by pattern recognition receptors, including TLRs. They are also, important inhibitors of TLR signalling [2, 3]. HCV core and NS proteins have important pathogen‐associated molecular patterns for TLR‐2, TLR‐3, TLR‐4, TLR‐7, TLR‐8 and TLR‐9. TLR‐3 is critical for its anti‐viral immune actions in that it stimulates non‐parenchymal liver cells to regulate HCV replication through the synthesis of interferon (IFN)‐β [4, 5]. In chronic HCV infections, TLR‐3 mRNA is significantly increased in monocytes [6]. An IFN‐responsive element has been identified in the TLR‐3 gene promoter region and it therefore, appears likely that the expression of TLR‐3 is responsive to IFN treatment for HCV infection [7]. Myeloid dendritic cells (mDCs) have a normally operative TLR‐3 and are capable of producing interleukin (IL)‐12, IL‐6, and IL‐10, IFN‐γ and tumour necrosis factor (TNF)‐α with TLR‐3 stimulation, regardless of the presence of HCV infection [8].
HCV viral proteins activate TLR signalling, which plays a significant role in immune‐mediated viral clearance. However, HCV can, at the same time, evade immune clearance using various mechanisms to target and ruin TLR signal transduction. First, HCV interferes with signalling via the Toll/IL‐1 receptor (TIR) domain containing adapter‐inducing IFN‐β/TANK‐binding kinase (TRIF)/TBK)1‐IFN regulatory factor 3 (IRF3) pathway. The HCV NS3 protein induces degradation of TRIF, and the NS3/4A protein prevents IRF3 and NF‐κB activation by down‐grading the amount of TRIF in serum and producing cleavage products with dominant negative action [4, 9]. NS3/4A also interacts directly with TBK1 to reduce the interaction between TBK1 and IRF3, and so inhibits IRF3 activation [10]. HCV also interferes with the TLR–myeloid differentiation primary response 88 (MyD88) pathway through NS5A interaction with MyD88; this prevents IL‐1 receptor‐associated kinase 1 (IRAK1) recruitment and cytokine production in response to ligands for TLR‐2, TLR‐4, TLR‐7 and TLR‐9 [11].
HCV has been shown to regulate the expression of TLR‐9 through the transcription factor ETS‐like‐1 (Elk‐1), which is an essential signal integration point between the T cell receptor and CD28 in T helper type 1 (Th1) cell activation [12]. HCV also impedes the production of IFN‐α and IFN‐β by TLR‐9 and decreases human leucocyte antigen DR expression by plasmacytoid dendritic cells (pDCs), which is linked to the diminished activation of naive T cells [13]. TLR‐9 signalling in mDCs is unchanged [8, 13]. Consequently, compartmentalization of the outcomes on TLR function is a crucial strategy by which HCV can escape immune surveillance and result in chronic inflammatory hepatic injury and fibrosis.
We previously demonstrated that the TLR‐3.rs3775290 ‘CC’ genotype was associated with HCV chronicity, and that the TLR‐9 gene played no major role in this infection [14]. This study identified the role of TLR‐3.rs3775290 (c.1377C/T), TLR‐9.rs5743836 (−1237T→C) and TLR‐9.rs352140 (G2848A) single nucleotide polymorphisms (SNPs) in predicting the outcome of HCV‐specific cell‐mediated immunity (CMI) among Egyptian HCWs. We show that the TLR‐9.rs5743836 SNP, but not the TLR‐3.rs3775290 or TLR‐9.rs352140 genotypes, could predict the outcome of HCV‐specific CMI responses among Egyptians infected with genotype‐4.
Subjects and methods
Study subjects
Two hundred and sixty‐five HCWs were selected for the evaluation of IFN‐γ‐producing T cells by an enzyme‐linked immunospot (ELISPOT) assay in response to nine HCV genotype 4a overlapping 15mer peptide pools covering the whole viral genome. The National Liver Institute Institutional Review Board approved the study protocol. All participants signed an informed consent form prior to enrolment. The demographic characteristics and laboratory findings of the study participants are shown in Table 1; there are no significant differences in all tested parameters between responding and non‐responding subjects. The description and classification of the four groups enrolled into this study have been previously reported [14].
Table 1.
Demographic and laboratory findings of the study participants
| Parameter | Total (265) | Responders n = 59 (%) | Non‐responders n = 206 (%) | P‐value |
|---|---|---|---|---|
| Female, n (%) | 127 (47·9) | 29 (49·2) | 98 (47·6) | 0·977 |
| Male, n (%) | 138 (52·1) | 30 (50·8) | 108 (52·4) | |
| Age (years ± s.d.) | 35 ± 11 | 36 ± 10·15 | 35 ± 11·26 | 0·778 |
| Rural residence, n (%) | 133 (50·2) | 28 (47·5) | 106 (51·5) | 0·861 |
| Occupational category | ||||
| Physician/medical student | 13 (4·9) | 1 (1·7) | 12 (5·8) | |
| Nursing staff/student | 97 (36·6) | 26 (44·1) | 71 (34·5) | 0·396 |
| Laboratory technician | 2 (0·8) | 0 | 2 (1) | |
| Housekeeping | 58 (21·9) | 11 (18·6) | 47 (22·8) | |
| Others | 95 (35·8) | 21 (35·6) | 74 (35·9) | |
| Duration of current job (years ± s.d.) | 10·54 ± 7·47 | 9·21 ± 6·69 | 10·93 ± 7·65 | 0·995 |
| Mean ALT level ± s.e.m. (IU/l)* | 36·4 ± 1·43 | 37 ± 3·37 | 36·3 ± 1·59 | 0·956 |
| Mean AST level ± s.e.m. (IU/l) | 49·1 ± 1·8 | 47·8 ± 3·9 | 49·4 ± 2·1 | 0·716 |
ALT = alanine aminotransferase; AST = aspartate aminotransferase; s.d. = standard deviation; s.e.m. = standard error of the mean.
Laboratory testing
HCV molecular diagnosis and quantification of HCV‐RNA
HCV diagnosis was determined by using the Murex third‐generation anti‐HCV ELISA assay (version 4.0; Diasorin, Stillwater, MN, USA), which utilizes antigens from the core, NS3, NS4 and NS5 regions of the virus. All study subjects were tested by the quantitative real‐time polymerase chain reaction (qPCR) assay for the detection of current HCV infection and quantification of the HCV viral load; the QIAamp® viral RNA purification kit (Qiagen, Germantown, MD, USA) was used. The amplification step was conducted using the AgPath‐ID one‐step assay as instructed by the manufacturer (Applied Biosystems Life Technologies Corporation, Carlsbad, CA, USA).
HCV genotyping and genotyping for TLR‐3.rs3775290 (c.1377C/T), TLR‐9.rs5743836 (−1237T→C) and TLR‐9.rs352140 (G2848A) SNPs
Polymerase chain reaction–restriction fragment length polymorphism (PCR‐RFLP) was used for HCV genotyping after reverse transcription, as described previously [15].
PCR‐RFLP was also used for the identification of the TLR‐3.rs3775290 (c.1377 C/T) and TLR‐9.rs352140 (G2848A) gene SNPs. The PCR reaction was conducted in a total reaction volume of 25 μl with 20 pmol of each of the forward and reverse primers, as described previously [16]. The same applies for TLR‐9.rs5743836 (−1237TTBC) genotyping [17].
Evaluation of IFN‐γ‐producing cells using ELISPOT assay
An ELISPOT assay was used to quantify IFN‐γ synthesis by peripheral blood mononuclear cells (PBMCs) separated from the study subjects in response to nine HCV genotype 4a isolate ED43 peptide antigen pools consisting of 15 (15mer) that were overlapping by 10 amino acids. These were 600 peptides combined in nine pools corresponding to all of the HCV proteins. These synthetic peptides were especially manufactured by Mimotopes (Mulgrave, Victoria, Australia). Approximately 15 ml of blood was collected in ethylenediamine tetraacetic acid (EDTA) vacutainer tubes (Becton Dickinson and Company, Franklin Lakes, NJ, USA). PBMCs were separated from whole blood using Ficoll‐Hypaque density gradient centrifugation. Cellular viability was determined by the trypan blue exclusion method. Briefly, 2 × 10⁵ PBMCs (200 μl/well) were incubated in triplicate cultures in the ELISPOT plates (Whatman Unifilter; Sigma Aldrich, St Louis, MO, USA) coated with anti‐human IFN‐γ antibody for approximately 16 h with or without recombinant HCV antigens and 3 μg/ml of each single peptide in complete RMPI‐1640 medium. A medium containing dimethylsulphoxide (DMSO) alone or 0·1 μg/ml of Staphylococcus enterotoxin B (or other polyclonal stimuli) represented the negative and positive controls, respectively. The assay was developed at the end of the incubation period until the spots appeared. The wells were then rinsed with tapwater to stop the reaction. The number of spots per well was calculated using an automated ELISPOT reader (Cellular Technology Ltd, Cleveland, OH, USA), as reported previously [18]. The mean number of spot‐forming cells (SFCs) in the control wells were subtracted from the mean number of peptide‐stimulated wells to correct for background cytokine production and was expressed as SFCs per million PBMCs. A positive antigen‐specific HCV response was considered to have occurred if the number of SFCs in the presence of antigen was at least three times the number of SFCs in the control medium and more than 55 SFCs per million PBMCs were present, as previously reported [19]. All procedures performed in studies involving human participants were in accordance with the ethical standards of the institutional and/or national research committee and with the 1964 Helsinki Declaration and its later amendments. Informed consent was obtained from all enrolled study participants.
Statistical analysis
Allele and genotype frequencies of each SNP were calculated by direct counting. Genotype and allele frequencies were compared between groups using the χ2 test and Fisher’s exact test when appropriate. For allelic associations, P‐values with Yates’ correction and an odds ratio (OR) with 95% confidence intervals (CI) were calculated using the Statcalc program (EpiInfo version 6.0.4; Center for Disease Control, Atlanta, GA, USA). Pairwise LD (D', r 2) was estimated by Haploview software version 4.2. For categorical data, χ2 tests were performed, and Student’s t‐test (or Mann–Whitney U‐test where appropriate) was performed to compare the continuous data. Differences in the mean with a P‐value of less than 0·05 were deemed significant. Standard errors of the means (and/or deviations) were also calculated.
Results
Relationship between the TLR‐3.rs3775290 (c.1377C/T) genotype and the HCV‐specific IFN‐γ ELISPOT response
All subjects enrolled into the study were tested for IFN‐γ production by examining PBMCs with an ELISPOT assay. The purpose was to evaluate the CMI response against nine HCV genotype 4a isolate ED43 peptide antigen pools composed of 15 (15mer) peptides that were overlapping by 10 amino acids. Of the samples, 140 (53%), 20 (80%), 35 (40%) and 70 (41.4%) had CMI data that were valid for the four study groups (seronegative‐aviraemic subjects, seronegative‐viraemic subjects, spontaneously resolved subjects and chronic HCV groups, respectively).
There was no association between the frequency of CMI responders and the presence of TLR‐3.rs3775290 genotypes among the 263 HCWs with valid CMI responses and TLR‐3.rs3775290 genotyping tests (P = 0·222). However, there was a significantly (P = 0·004) higher proportion of CC genotype (73·3%) in the responding subjects than in the non‐responding seronegative‐aviraemic individuals (65·1%). In addition, there was a differential distribution of the three TLR‐3.rs3775290 genotypes among the total study participants with and without HCV‐specific CMI (Table 2).
Table 2.
Relationship between TLR‐3.rs3775290 (c.1377C/T) and HCV‐specific cell‐mediated immune (CMI) response among the National Liver Institute HCWs in terms of CMI responders’ frequencies
| Group | TLR‐3.rs3775290 genotype | Total | P‐value | |||
|---|---|---|---|---|---|---|
| CC allele | CT allele | TT allele | ||||
| Seronegative‐aviraemic | Responder, n (%) | 22 (73·3) | 4 (13·3) | 4 (13·3) | 30 (21·6) | 0·004 |
| Non‐responder, n (%) | 71 (65·1) | 36 (33) | 2 (1·8) | 109 (78·4) | ||
| Seronegative‐viraemic | Responder, n (%) | 3 (75) | 1 (25) | 0 (0) | 4 (20) | 0·694 |
| Non‐responder, n (%) | 9 (56·3) | 5 (31·3) | 2 (12·5) | 16 (80) | ||
| Resolved | Responder, n (%) | 2 (28·6) | 5 (71·4) | 0 (0) | 7 (20·6) | 0·425 |
| Non‐responder, n (%) | 14 (51·9) | 12 (44·4) | 1 (3·7) | 27 (79·4) | ||
| Chronic | Responder, n (%) | 10 (55·5) | 6 (33·3) | 2 (11·1) | 18 (25·7) | 0·57 |
| Non‐responder, n (%) | 36 (69·2) | 12 (23·1) | 4 (7·7) | 52 (74·3) | ||
| Total | Responder, n (%) | 37 (62·7) | 16 (27·1) | 6 (10·2) | 59 (22·3) | 0·222 |
| Non‐responder, n (%) | 130 (63·7) | 65 (31·9) | 9 (4·4) | 204 (77·7) | ||
TLR = Toll‐like receptor; HCV = hepatitis C virus; CMI = cell‐mediated immune; HCW = health‐care workers.
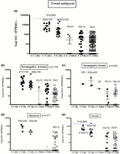
The average totals [± standard error of the mean (s.e.m.)] of IFN‐γ responses measured in SFC per million PBMCs among the total, seronegative‐aviraemic, seronegative‐viraemic, spontaneously resolved and chronic subjects with different TLR‐3.rs3775290 genotypes are shown in Fig. 1. There were no significant differences in the responding subjects among the total subjects and among the four different groups (P > 0·05).
Fig. 1.
Relation between Toll‐like receptor (TLR)‐3.rs3775290 (c.1377C/T) genotype and total hepatitis C virus (HCV)‐specific cell‐mediated immune (CMI) response among total subjects (a), seronegative‐aviraemic subjects (b), seronegative‐viraemic subjects (c), spontaneously resolved subjects (d) and chronic HCV patients (e). Data are shown as scatter‐plots. For each subject, the total cumulative number of HCV‐specific interferon (IFN)‐γ spot‐forming cells (SFCs) per 106 peripheral blood mononuclear cells (PBMCs) is shown for responding and non‐responding health‐care workers (HCWs). Error bars represent the standard error of the mean (s.e.m.). The numbers shown represent the average and s.e.m.
Relationship between the TLR‐9.rs5743836 (−1237T→C) genotype and the HCV‐specific IFN‐γ ELISPOT response
There was no association between the frequency of the HCV‐specific CMI responding subjects and the TLR‐9.rs5743836 genotypes among the 265 HCWs with valid CMI responses and TLR‐9.rs5743836 genotyping tests (Table 3, P = 0.12). However, there was a statistically significant (P = 0·019) lower proportion of TT genotype in responding spontaneously resolved individuals compared with non‐responding spontaneously resolved subjects (57·1 versus 96·4%, respectively, Table 3).
Table 3.
Relationship between TLR‐9.rs5743836 (−1237T→C) and HCV‐specific CMI response among the National Liver Institute HCWs in terms of CMI responders’ frequencies
| Group | TLR‐9.rs5743836 genotype | Total | P‐value | |||
|---|---|---|---|---|---|---|
| CC allele | CT allele | TT allele | ||||
| Seronegative‐aviraemic | Responder, n (%) | 0 (0) | 10 (33·3) | 20 (66·7) | 30 (21·4) | 0·353 |
| Non‐responder, n (%) | 3 (2·7) | 25 (22·7) | 82 (74·5) | 110 (78·5) | ||
| Seronegative‐viraemic | Responder, n (%) | 0 (0) | 1 (25) | 3 (75) | 4 (20) | 0·87 |
| Non‐responder, n (%) | 1 (6·3) | 4 (25) | 11 (68·8) | 16 (80) | ||
| Resolved | Responder, n (%) | 0 (0) | 3 (42·9) | 4 (57·1) | 7 (20) | 0·019 |
| Non‐responder, n (%) | 0 (0) | 1 (3·6) | 27 (96·4) | 28 (80) | ||
| Chronic | Responder, n (%) | 0 (0) | 4 (22·2) | 14 (77·8) | 18 (25·7) | 0·74 |
| Non‐responder, n (%) | 0 (0) | 10 (19·2) | 42 (80·8) | 52 (74·3) | ||
| Total | Responder, n (%) | 0 (0) | 18 (30·5) | 41 (69·5) | 59 (22·3) | 0·12 |
| Non‐responder, n (%) | 4 (1·9) | 40 (19·4) | 162 (78·6) | 206 (77·7) | ||
TLR = Toll‐like receptor; HCV = hepatitis C virus; CMI = cell‐mediated immune; HCW = health‐care workers.
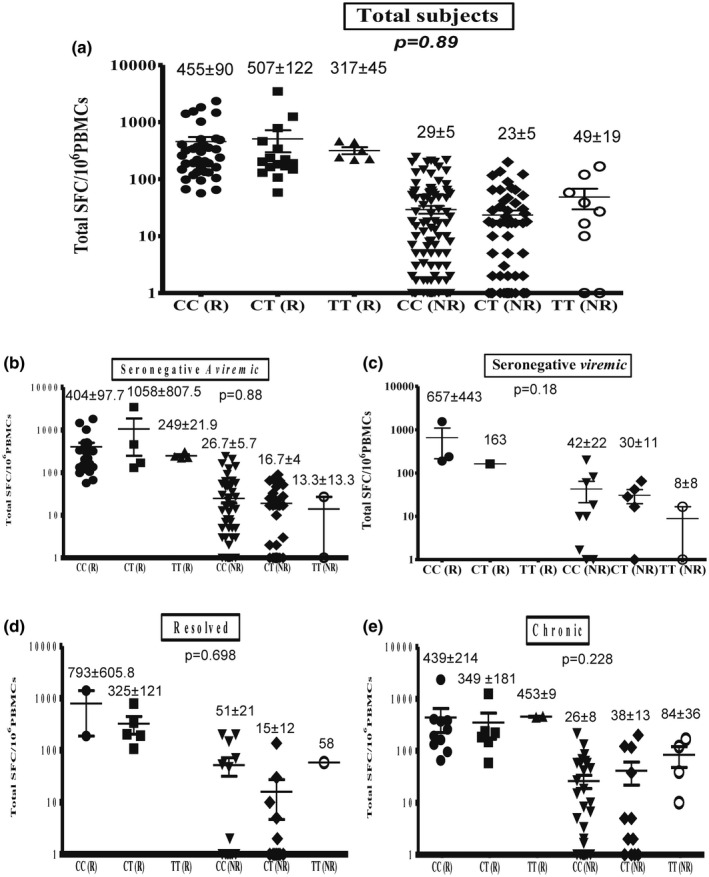
The average totals (± s.e.m.) of IFN‐γ responses measured in SFCs per million PBMCs among the total, seronegative‐aviraemic, seronegative‐viraemic, spontaneously resolved and chronic subjects with different TLR‐9.rs5743836 genotypes are shown in Fig. 2. There was a significant difference in the total subjects who responded and had different TLR‐9.rs5743836 genotypes (P = 0·005; Fig. 2a). Differences were not statistically significant among seronegative‐aviraemic (P = 0·159), seronegative‐viraemic (P = 0·654) and spontaneously resolved (P = 0·077) subjects (Fig. 2b–d). Differences were statistically significant among chronic subjects who responded (P = 0·044; Fig. 2e).
Fig. 2.
Relationship between Toll‐like receptor (TLR)‐9.rs5743836 (−1237T→C) genotype and total hepatitis C virus (HCV)‐specific cell‐mediated immune (CMI) response among the total subjects (a), seronegative‐aviraemic subjects (b), seronegative‐viraemic subjects (c), spontaneously resolved subjects (d) and chronic HCV patients (e). Data are shown as scatter‐plots. For each subject, the total cumulative number of HCV‐specific interferon (IFN)‐γ spot‐forming cells (SFCs) per 106 peripheral blood mononuclear cells (PBMCs) is shown for responding and non‐responding HCWs. Error bars represent the standard error of the mean (s.e.m.). The numbers shown represent the average and s.e.m.
Relationship between the TLR‐9.rs352140 (G2848A) genotype and the HCV‐specific IFN‐γ ELISPOT response
As shown in Table 4, there was no association between the frequency of the HCV‐specific CMI responding subjects and the TLR‐9.rs352140 (G2848A) genotypes among the 258 HCWs with valid CMI responses and TLR‐9.rs352140 genotyping tests (P = 0·356). Also, there was no significant difference (P = 0·299) in the proportion of GG genotypes in the responding and non‐responding seronegative‐aviraemic subjects (46·4 versus 31·4%, respectively, Table 4).
Table 4.
Relationship between TLR‐9.rs352140 (G2848A) and HCV‐CMI response among the National Liver Institute HCWs in terms of CMI responders’ frequencies
| Group | TLR9.rs352140 genotype | Total | P‐value | |||
|---|---|---|---|---|---|---|
| GG | GA | AA | ||||
| Seronegative‐ aviraemic | Responder, n (%) | 13 (46·4) | 10 (35·7) | 5 (17·9) | 28 (21·1) | 0·299 |
| Non‐responder, n (%) | 33 (31·4) | 43 (41) | 29 (27·6) | 105 (78·9) | ||
| Seronegative‐viraemic | Responder, n (%) | 2 (50) | 2 (50) | 0 (0) | 4 (20) | 0·32 |
| Non‐responder, n (%) | 3 (18·8) | 9 (56·3) | 4 (25) | 16 (80) | ||
| Resolved | Responder, n (%) | 3 (42·9) | 4 (57·1) | 0 (0) | 7 (20) | 0·299 |
| Non‐responder, n (%) | 11 (39·3) | 10 (35·7) | 7 (25) | 28 (80) | ||
| Chronic | Responder, n (%) | 6 (33·3) | 7 (38·9) | 5 (27·8) | 18 (25·7) | 0·627 |
| Non‐responder, n (%) | 19 (36·5) | 24 (46·2) | 9 (17·3) | 52 (74·3) | ||
| Total | Responder, n (%) | 24 (42·1) | 23 (40·4) | 10 (17·5) | 57 (22·1) | 0·356 |
| Non‐responder, n (%) | 66 (32·8) | 86 (42·8) | 49 (24·4) | 201(77·9) | ||
TLR = Toll‐like receptor; HCV = hepatitis C virus; CMI = cell‐mediated immune; HCW = health‐care workers.
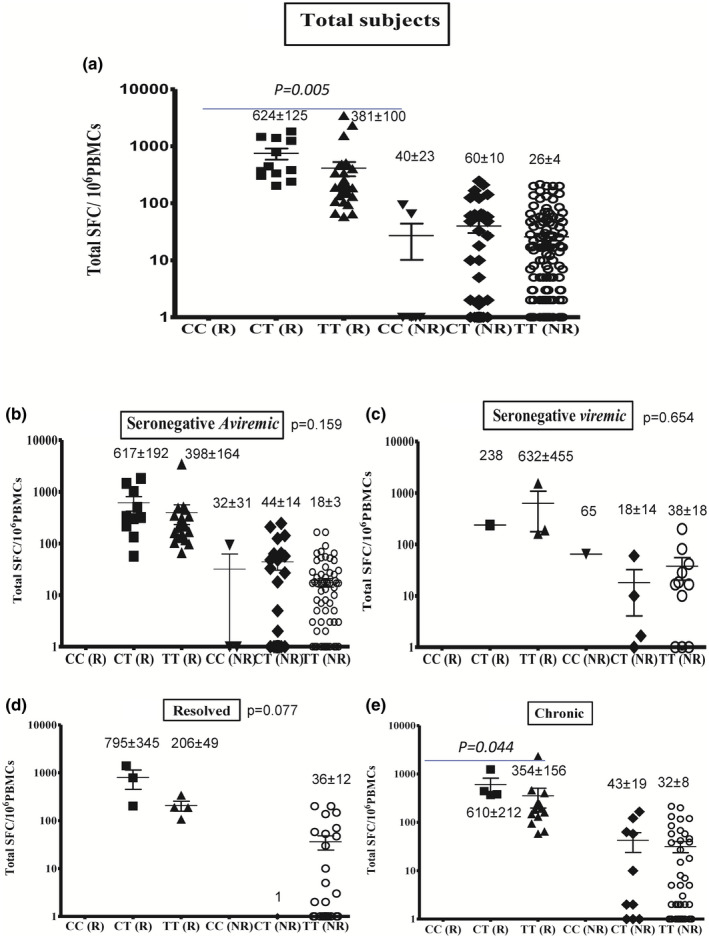
The average totals (± s.e.m.) of IFN‐γ responses measured in SFCs per million PBMCs among the total, seronegative‐aviraemic, seronegative‐viraemic, spontaneously resolved and chronic subjects with different TLR‐9.rs352140 genotypes are shown in Fig. 3. There were no significant differences in the responding subjects among the total subjects and among the four different groups (P > 0·05).
Fig. 3.
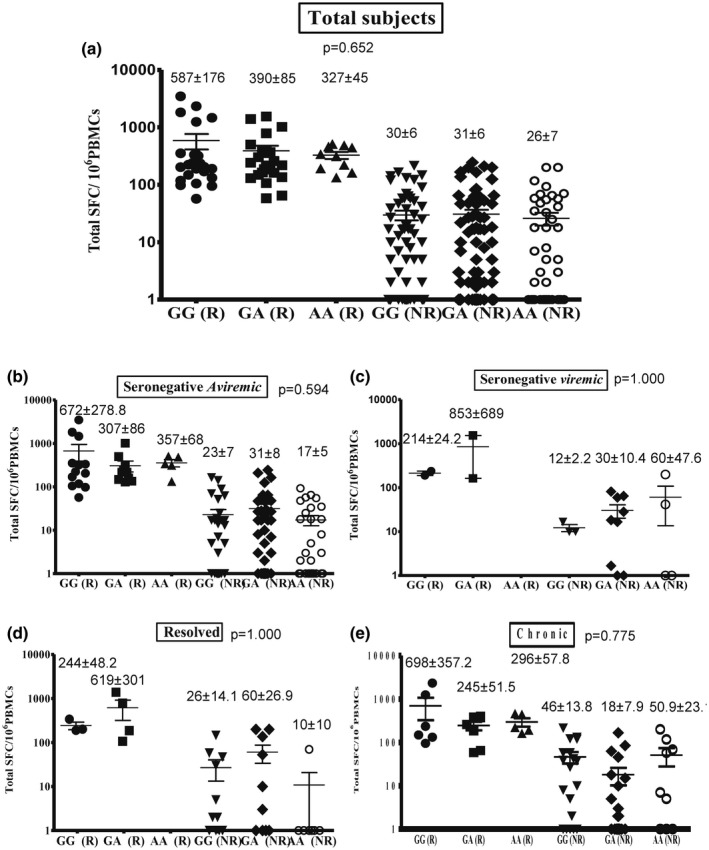
Relationship between Toll‐like receptor (TLR)‐9.rs352140 (G2848A) genotype and total hepatitis C virus (HCV)‐specific cell‐mediated immune (CMI) response among the total subjects (a), seronegative‐aviraemic subjects (b), seronegative‐viraemic subjects (c), spontaneously resolved subjects (d) and chronic HCV patients (e). Data are shown as scatter‐plots. For each subject, the total cumulative number of HCV‐specific interferon (IFN)‐γ spot‐forming cells (SFCs) per 106 peripheral blood mononuclear cells (PBMCs) is shown for responding and non‐responding HCWs. Error bars represent the standard error of the mean (s.e.m.). The numbers shown represent the average and s.e.m.
Discussion
In this study, there was no statistically significant difference in the Egyptian HCWs with diverse HCV states who responded in the CMI assay and different TLR‐3.rs3775290 (c.1377C/T) genotypes. There was no association between the results of the HCV‐specific CMI response and the TLR‐3.rs3775290 (c.1377C/T) genotype among the 263 tested subjects. This agrees with another report [20]. The function of TLR‐3 was investigated in four different viral models of infection in TLR‐3−/− mice, including lymphocytic choriomeningitis virus, vesicular stomatitis virus, murine cytomegalovirus and reovirus. The researchers found that TLR‐3 was not always required for effective anti‐viral responses to be generated; the absence of TLR‐3 did not alter either the viral pathogenesis or the generation of adaptive anti‐viral responses to these viruses by the host. Remarkably, intracellular transduction of poly I:C signals began the TLR‐3‐independent activation of an IFN response, therefore restricting the role of TLR‐3 in the IFN pathway [21]. Other reports [22, 23] indicated that HCV may use the TLR‐3 pathway to escape immune scrutiny through the HCV NS3/4A protease‐mediated cleavage of the TLR‐3 adaptor protein TRIF. Also, HCV NS3/4A impeded retinoic acid‐inducible gene I (RIG‐I), which is a key factor in TRIF‐independent signalling [21]. In addition, it was suggested that several polymorphisms that alter TLR‐3 amino acids initiate subsequent protein changes and that gene expression may be down‐regulated and the TLR‐3 activities required for proper signalling may be reduced. [24]. Lower TLR‐3 activity resulted in an inability to identify the invading microorganisms and consequently insufficient immune responses. This increased the risk of infections and infectious diseases [25].
Our results provide strong indirect evidence that TLR‐9 could play a greater role than previously expected in HCV infection. We identified an association between the TLR‐9.rs5743836 polymorphism within the TLR‐9 gene and the natural history of HCV infection. In this study, there was a strong association between the results of the HCV‐specific CMI response and the TLR‐9.rs5743836 (−1237T→C) genotype among the 265 HCWs with valid CMI responses in total responders (P = 0·005). Also, there was a statistically significant difference in the frequency of responding individuals in chronic HCV infected HCWs with distinct TLR‐9.rs5743836 genotypes (P = 0·044).
We show that the TLR‐9–1237T allele was significantly associated with an HCV‐specific CMI response. In this regard, the TT genotype is transcribed more effectively than the CC genotype, as has been reported by others [26] who showed that the wild‐type construct stimulates higher transcriptional activity compared with the CC allele. The data showed that individuals with the ‘favourable’ TT allele had an HCV‐specific CMI response but those with the ‘unfavourable’ CC allele did not. Also, several reports found that the mutant T allele imparted the immunity against various pathogens. Although its influence is statistically inconsiderable, the mutant allele is linked to a depressed microbial load in Africans [27, 28, 29]. In addition, the mutant T allele affects immunity that prevents against establishment of infections, so it is logical that the TLR‐9 gene would influence the genetic ability to cope with infections [30]. Functional analyses of the impact of TLR‐9 polymorphisms on basal promoter activity revealed that the rs5743836 SNP causes greater gene expression than the wild‐type promoter. Other investigators [31] have demonstrated that the variant C allele at rs5743836 established a potential nuclear factor kappa B (NF‐κB)‐binding site that increased the gene’s transcriptional activity. The presence of this extra putative NF‐κB‐binding site promoted the transcription of TLR‐9 more effectively than the wild‐type TLR‐9.rs5743836 T sequence in response to different stimuli. This is in agreement with another report [32], where TLR‐9 promoter SNPs were associated with the natural course of HCV infection; they exhibited greater transcriptional activities and this suggests that the DNA sensor TLR‐9 has a role in the natural immunity against HCV. Our data are similar to those of other studies [1, 33], reporting that the rs5743836 TT variant has greater promoter activity than the CC genotype. One study suggested that this activity could lead to increased proinflammatory cytokine production during malaria infection and to successful malaria control and elimination [33].
There was no association between the HCV‐specific immune response and the TLR‐9.rs352140 (G2848A) genotype among the 258 Egyptian HCWs with valid CMI responses and TLR‐9.rs352140 genotyping. To date, no studies have demonstrated any association between TLR‐9.rs352140 (G2848A) and HCV infection. The region around 2848 is the major coding region of the TLR‐9 protein [34, 35]. A TLR‐9 2848 GA genotype polymorphism has been reported at the transcriptional level to reduce TLR‐9 expression [35, 36]. Down‐regulated TLR‐9 could reduce the functions of the innate immune response against HCV infection. Our results are in agreement with another study, showing that the TLR‐9 gene may play a role in cervical carcinogenesis but has a minor (or no) role in tumour progression; individuals with the ‘favourable’ GG allele were reported to be more cancer frequency than those with the ‘unfavourable’ AA allele [37]. In addition, a recent meta‐analysis showed that there was no relationship between TLR‐9.rs352140 (G2848A) and cervical cancer vulnerability [38].Our findings suggest that the TLR‐9.rs352140 (G2848A) genotype does not affect the natural course of HCV infection.
In conclusion, this study shows that the TLR‐9.rs5743836 SNP, but not the TLR‐3.rs3775290 or TLR‐9.rs352140 genotypes, could predict the outcome of HCV‐specific CMI responses among Egyptians infected with genotype‐4.
Disclosures
None declared.
Author contributions
Conceptualization and design of experiments: S. F. A., S. H., A. O., Z. Z., E. R. and I. W.; Data collection, experimentation, analysis and investigation: S. H., S. F. A., M. A., Z. Z., I. G., M. S. and W. A.; funding acquisition and resources: S. F. A., E. R. and I. W.; writing original draft: S. H. and S. F. A.; writing review and editing: S. F. A., A. O., M. S., M. H., W. A., M. A., E. R. and I. W. All authors approved the final version of the manuscript.
Acknowledgement
This study was supported by the Egyptian Science and Technology Development Fund (STDF) Contract no. 1664 to S. F. A.
Data sharing and data accessibility
All data pertinent to this article are included herein.
References
- 1. Abdelwahab SF. Cellular immune response to hepatitis‐C‐virus in subjects without viremia or seroconversion: is it important? Infect Agents Cancer 2016; 11:23. [DOI] [PMC free article] [PubMed] [Google Scholar]
- 2. Ghany MG, Strader DB, Thomas DL, Seeff LB, American Association for the Study of Liver Disease. Diagnosis, management, and treatment of hepatitis C: an update. Hepatology 2009; 49:1335–74. [DOI] [PMC free article] [PubMed] [Google Scholar]
- 3. Rosen HR. Clinical practice. Chronic hepatitis C infection. N Engl J Med 2011; 364:2429–38. [DOI] [PubMed] [Google Scholar]
- 4. Li K, Chen Z, Kato N, Gale M Jr, Lemon SM. Distinct poly(I‐C) and virus‐activated signaling pathways leading to interferon‐beta production in hepatocytes. J Biol Chem 2005; 280:16739–47. [DOI] [PubMed] [Google Scholar]
- 5. Broering R, Wu J, Meng Z et al Toll‐like receptor‐stimulated non‐parenchymal liver cells can regulate hepatitis C virus replication. J Hepatol 2008; 48:914–22. [DOI] [PubMed] [Google Scholar]
- 6. Dolganiuc A, Garcia C, Kodys K, Szabo G. Distinct Toll‐like receptor expression in monocytes and T cells in chronic HCV infection. World J Gastroenterol 2006; 12:1198–204. [DOI] [PMC free article] [PubMed] [Google Scholar]
- 7. Geiss GK, Carter VS, He Y et al Gene expression profiling of the cellular transcriptional network regulated by alpha/beta interferon and its partial attenuation by the hepatitis C virus nonstructural 5A protein. J Virol 2003; 77:6367–75. [DOI] [PMC free article] [PubMed] [Google Scholar]
- 8. Shiina M, Rehermann B. Cell culture‐produced hepatitis C virus impairs plasmacytoid dendritic cell function. Hepatology 2008; 47:385–95. [DOI] [PubMed] [Google Scholar]
- 9. Foy E, Li K, Wang C et al Regulation of interferon regulatory factor‐3 by the hepatitis C virus serine protease. Science 2003; 300:1145–8. [DOI] [PubMed] [Google Scholar]
- 10. Otsuka M, Kato N, Moriyama M et al Interaction between the HCV NS3 protein and the host TBK1 protein leads to inhibition of cellular antiviral responses. Hepatology 2005; 41:1004–12. [DOI] [PubMed] [Google Scholar]
- 11. Abe T, Kaname Y, Hamamoto I et al Hepatitis C virus nonstructural protein 5A modulates the toll‐like receptor‐MyD88‐dependent signaling pathway in macrophage cell lines. J Virol 2007; 81:8953–66. [DOI] [PMC free article] [PubMed] [Google Scholar]
- 12. Fukuda K, Tsuchihara K, Hijikata M, Nishiguchi S, Kuroki T, Shimotohno K. Hepatitis C virus core protein enhances the activation of the transcription factor, Elk1, in response to mitogenic stimuli. Hepatology 2001; 33:159–65. [DOI] [PubMed] [Google Scholar]
- 13. Yonkers NL, Rodriguez B, Milkovich KA et al TLR ligand‐dependent activation of naive CD4 T cells by plasmacytoid dendritic cells is impaired in hepatitis C virus infection. J Immunol 2007; 178:4436–44. [DOI] [PubMed] [Google Scholar]
- 14. Hamdy S, Osman AM, Zakaria ZA et al Association of Toll‐like receptor 3 and Toll‐like receptor 9 single‐nucleotide polymorphisms with hepatitis C virus persistence among Egyptians. Arch Virol 2018; 163:2433–42. [DOI] [PubMed] [Google Scholar]
- 15. Davidson F, Simmonds P. Determination of HCV genotypes by RFLP. Methods Mol Med 1999; 19:175–81. [DOI] [PubMed] [Google Scholar]
- 16. Pandey S, Mittal B, Srivastava M et al Evaluation of Toll‐like receptors 3 (c.1377C/T) and 9 (G2848A) gene polymorphisms in cervical cancer susceptibility. Mol Biol Rep 2011; 38:4715–21. [DOI] [PubMed] [Google Scholar]
- 17. Demirci FY, Manzi S, Ramsey‐Goldman R et al Association study of Toll‐like receptor 5 (TLR5) and Toll‐like receptor 9 (TLR9) polymorphisms in systemic lupus erythematosus. J Rheumatol. 2007; 34:1708–11. [PubMed] [Google Scholar]
- 18. Abdelwahab SF, Zakaria Z, Sobhy M et al Hepatitis C virus‐multispecific T‐cell responses without viremia or seroconversion among Egyptian health care workers at high risk of infection. Clin Vaccine Immunol 2012; 19:780–6. [DOI] [PMC free article] [PubMed] [Google Scholar]
- 19. Farid A, Al‐Sherbiny M, Osman A et al Schistosoma infection inhibits cellular immune responses to core HCV peptides. Parasite Immunol 2005; 27:189–96. [DOI] [PMC free article] [PubMed] [Google Scholar]
- 20. Edelmann KH, Richardson‐Burns S, Alexopoulou L, Tyler KL, Flavell RA, Oldstone MB. Does Toll‐like receptor 3 play a biological role in virus infections? Virology 2004; 322:231–8. [DOI] [PubMed] [Google Scholar]
- 21. Takeuchi O, Hemmi H, Akira S. Interferon response induced by Toll‐like receptor signaling. J Endotoxin Res 2004; 10:252–6. [DOI] [PubMed] [Google Scholar]
- 22. Li K, Foy E, Ferreon JC et al Immune evasion by hepatitis C virus NS3/4A protease‐mediated cleavage of the Toll‐like receptor 3 adaptor protein TRIF. Proc Natl Acad Sci USA 2005; 102:2992–7. [DOI] [PMC free article] [PubMed] [Google Scholar]
- 23. Chang S, Kodys K, Szabo G. Impaired expression and function of toll‐like receptor 7 in hepatitis C virus infection in human hepatoma cells. Hepatology 2010; 51:35–42. [DOI] [PubMed] [Google Scholar]
- 24. Ranjith‐Kumar CT, Miller W, Sun J et al Effects of single nucleotide polymorphisms on Toll‐like receptor 3 activity and expression in cultured cells. J Biol Chem 2007; 282:17696–705. [DOI] [PubMed] [Google Scholar]
- 25. Geng PL, Song LX, An H, Huang JY, Li S, Zeng XT. Toll‐Like receptor 3 is associated with the risk of HCV Infection and HBV‐related diseases. Medicine 2016; 95:e2302. [DOI] [PMC free article] [PubMed] [Google Scholar]
- 26. Novak N, Yu CF, Bussmann C et al Putative association of a TLR9 promoter polymorphism with atopic eczema. Allergy 2007; 62:766–72. [DOI] [PubMed] [Google Scholar]
- 27. Christensen SR, Kashgarian M, Alexopoulou L, Flavell RA, Akira S, Shlomchik MJ. Toll‐like receptor 9 controls anti‐DNA autoantibody production in murine lupus. J Exp Med 2005; 202:321–31. [DOI] [PMC free article] [PubMed] [Google Scholar]
- 28. Yusuf JH, Kaliyaperumal D, Jayaraman M, Ramanathan G, Devaraju P. Genetic selection pressure in TLR9 gene may enforce risk for SLE in Indian Tamils. Lupus 2017; 26:307–10. [DOI] [PubMed] [Google Scholar]
- 29. Medhi S, Deka M, Deka P et al Promoter region polymorphism & expression profile of toll like receptor‐3 (TLR‐3) gene in chronic hepatitis C virus (HCV) patients from India. Ind J Med Res 2011; 134:200–7. [PMC free article] [PubMed] [Google Scholar]
- 30. Wei XS, Wei CD, Tong YQ, Zhu CL, Zhang PA. Single nucleotide polymorphisms of toll‐like receptor 7 and toll‐like receptor 9 in hepatitis C virus infection patients from central China. Yonsei Med J 2014; 55:428–34. [DOI] [PMC free article] [PubMed] [Google Scholar]
- 31. Ng MT, Van't Hof R, Crockett JC et al Increase in NF‐kappaB binding affinity of the variant C allele of the toll‐like receptor 9–1237T/C polymorphism is associated with Helicobacter pylori‐induced gastric disease. Infect Immun 2010; 78:1345–52. [DOI] [PMC free article] [PubMed] [Google Scholar]
- 32. Fischer J, Weber AN, Bohm S et al Sex‐specific effects of TLR9 promoter variants on spontaneous clearance of HCV infection. Gut 2016; 66: gutjnl‐2015‐310239. [DOI] [PubMed] [Google Scholar]
- 33. Aslam N, Batool F, Iqbal MS et al Analysis of toll‐like receptors‐9 (TLR9) gene polymorphism (rs5743836) in Pakistani patients with HCV. Pak J Pharm Sci 2018; 31:2709–14. [PubMed] [Google Scholar]
- 34. Lange NE, Zhou X, Lasky‐Su J et al Comprehensive genetic assessment of a functional TLR9 promoter polymorphism: no replicable association with asthma or asthma‐related phenotypes. BMC Med Genet 2011; 12:26. [DOI] [PMC free article] [PubMed] [Google Scholar]
- 35. Kikuchi K, Lian ZX, Kimura Y et al Genetic polymorphisms of toll‐like receptor 9 influence the immune response to CpG and contribute to hyper‐IgM in primary biliary cirrhosis. J Autoimmun 2005; 24:347–52. [DOI] [PubMed] [Google Scholar]
- 36. Chuang TH, Ulevitch RJ. Cloning and characterization of a sub‐family of human toll‐like receptors: hTLR7, hTLR8 and hTLR9. Eur Cytokine Netw 2000; 11:372–8. [PubMed] [Google Scholar]
- 37. Lai ZZ, Ni Z, Pan XL, Song L. Toll‐like receptor 9 (TLR9) gene polymorphisms associated with increased susceptibility of human papillomavirus‐16 infection in patients with cervical cancer. J Int Med Res 2013; 41:1027–36. [DOI] [PubMed] [Google Scholar]
- 38. Tian S, Zhang L, Yang T et al The associations between Toll‐like receptor 9 gene polymorphisms and cervical cancer susceptibility. Mediat Inflamm 2018; 2018:9127146. [DOI] [PMC free article] [PubMed] [Google Scholar]
Associated Data
This section collects any data citations, data availability statements, or supplementary materials included in this article.
Data Availability Statement
All data pertinent to this article are included herein.