Abstract
The application of lipid-based drug delivery technologies for bioavailability enhancement of drugs has led to many successful products in the market for clinical use. Recent studies on amine-containing heterolipid-based synthetic vectors for delivery of siRNA have witnessed the United States Food and Drug Administration (USFDA) approval of the first siRNA drug in the year 2018. The studies on various synthetic lipids investigated for delivery of such nucleic acid therapeutics have revealed that the surface pKa of the constructed nanoparticles plays an important role. The nanoparticles showing pKa values within the range of 6–7 have performed very well. The development of high-performing lipid vectors with structural diversity and falling within the desired surface pKa is by no means trivial and requires tedious trial and error efforts; therefore, a practical solution is called for. Herein, an attempt to is made provide a solution by predicting the statistically significant pKa through a predictive quantitative structure–activity relationship (QSAR) model. The QSAR model has been constructed using a series of 56 amine-containing heterolipids having measured pKa values as a data set and employing a partial least-squares regression coupled with stepwise (SW-PLSR) forward algorithm technique. The model was tested using statistical parameters such as r2, q2, and pred_r2, and the model equation explains 97.2% (r2 = 0.972) of the total variance in the training set and it has an internal (q2) and an external (pred_r2) predictive ability of ∼83 and ∼63%, respectively. The model was validated by synthesizing a series of designed heterolipids and comparing measured surface pKa values of their nanoparticle assembly using a 2-(p-toluidino)-6-napthalenesulfonic acid (TNS) assay. Predicted and measured surface pKa values of the synthesized heterolipids were in good agreement with a correlation coefficient of 93.3%, demonstrating the effectiveness of this QSAR model. Therefore, we foresee that our developed model would be useful as a tool to cut short tedious trial and error processes in designing new amine-containing heterolipid vectors for delivery of nucleic acid therapeutics, especially siRNA.
1. Introduction
Drug delivery systems aim at improving biopharmaceutics features, such as stability, bioavailability, and targeting, and facilitate controlled delivery to maximize drug potency while minimizing side effects and toxicity. Among drug delivery systems, lipid-based drug delivery systems (LBDDS) are extensively studied for bioavailability enhancement and the technologies developed are utilized in a number of the United States Food and Drug Administration (USFDA) approved drugs.1 Inspired by the success of LBDDS, similar efforts have been dedicated toward the development of lipid-based vectors particularly for siRNA delivery and gene therapy.2 Among lipid-based vectors, cationic lipid-based vectors have proven to be the most successful candidates and have been widely implemented in clinical use. However, the cationic lipids being permanently charged entities suffer from toxicity.3 Recent investigations on ionizable amine-containing heterolipids as drug carriers have successfully delivered siRNA in vivo. The surface pKa, exhibited by the heterolipids in the nanoparticle assembly environment, in the range of 6.0–7.0 was found to be an important feature to convey their efficacy.4−9 For example, Patisiran (Alnylam Pharmaceuticals) as the first siRNA drug approved by the USFDA has used an ionizable heterolipid-based delivery system.10,11 Mechanistically, the ionizable and hydrophobic moieties in the heterolipids encapsulate the naked anionic siRNA through electrostatic interactions and impart overall lipophilicity to facilitate passage through the cell membranes. Heterolipids containing unsaturated fatty acid chains were found to perform better as a transporter across the membrane. This finding is explained by hypothesizing that the unsaturation in the hydrophobic tail of the heterolipids introduces “kink” in their structure resulting in the tail adopting a cone shape geometry to promote the formation of an inverted non-bilayer hexagonal HII phase. The hexagonal HII phase induces intercellular fusion leading to destabilization of the biological membrane and facilitation of the transport.12 In addition, there are electrostatic interactions between carrier lipids and naturally occurring anionic membrane phospholipids. These interactions play a significant role in the successful transport of siRNA—lipid complex system. After entering into the cytoplasm of the target cells, the complex overcomes the acidic endocytic pathway through the proton sponge effect, leading to endosomal escape.13 Despite the success of the ionizable heterolipid systems to deliver siRNA, clinical applications are hindered due to their undesired immunostimulatory effects and poor pharmacokinetics.2,14,15 Hence, efforts are ongoing to find better candidates by synthesizing and screening new ionizable heterolipids.
The surface pKa is the pKa of the functional heterolipid in its nanoparticle assembly, which is different from the conventional solution-phase pKa, and it defines the ionization behavior of the functional heterolipid in the nanoparticle assembly. The surface pKa along with other structural features of the heterolipid vectors plays a crucial role in the entire process, including the encapsulation, transport, and endosomal escape of siRNA. The surface pKa of heterolipids in its relevant nanoparticle environment is determined by adopting a fluorescence-based (2-(p-toluidino)-6-napthalenesulfonic acid (TNS)) assay method.16 Currently, the TNS method is very effective in determining the pKa of lipid nanoparticles (LNPs) but suffers major drawbacks like the formulation of nanoparticulate assembly and is tedious to applying the screening of a large number of samples. To reduce the number of synthesized and tested compound knowing a priori the surface pKa of the amine-containing heterolipids, a structure-property-based theoretical model could be of great utility. This would not only help in introducing structural diversity in heterolipids and at the same time retaining the desired surface pKa but also in curtailing the number of heterolipids to be synthesized.
Our group has been involved in designing and developing new amine-containing heterolipid-based carriers for delivery of therapeutic molecules.17−22 In the present work, by employing a data set from the literature, a quantitative structure–activity relationship (QSAR) model has been developed using a partial least-squares regression (PLSR) technique for prediction of surface pKa.4 The developed model has been further validated by synthesizing selected newly designed heterolipids and comparing their predicted versus experimentally determined pKa values. The outcome of the work offers a new perspective on the design and development of new amine-containing heterolipids with desired surface pKa for drug delivery applications.
2. Experimental Section
2.1. Materials
Oleic acid (technical grade, 90%), 2-(dimethylamino)ethanol, 3-(dimethylamino)-1-propanol, cholesterol, 6-(p-toluidino)-2-naphthalenesulfonic acid sodium salt (TNS), cholesterol distearoylphosphatidylcholine (DSPC), and MPEG-2000-DSPE sodium salt were purchased from Sigma-Aldrich. Acryloyl chloride was obtained from Alfa Aesar. 3-Amino-1-propanol, ethanolamine, 4-(dimethylamino)pyridine (DMAP), and 1-hydroxybenzotriazole (HOBt) were obtained from Spectrochem (India). Triethylamine (TEA) and thionyl chloride were obtained from SD Fine Pvt. Ltd. (India). 1-(3-Dimethylaminopropyl)-3-ethyl carbodiimide hydrochloride (EDAC) was purchased from Sisco Research Laboratories Pvt. Ltd (India). Dichloromethane (DCM), tetrahydrofuran (THF), and other solvents used were of analytical grade. Precoated silica-gel 60F254 plates used for thin-layer chromatography (TLC) to monitor reactions were obtained from Merck. Water used in the entire study was obtained from the Milli-Q water purification system of Millipore Corporation (Bedford).
2.2. Development of the QSAR Model
The molecular modeling studies were performed on an Acer computer having Intel core i3-2310M Processor and Windows 7 operating system using VLife MDS (molecular design suite) 4.3 molecular modeling software supplied by VLife Sciences Technologies Pvt. Ltd., Pune, India.
A data set of 56 nitrogen-containing heterolipids reported by Jayaraman et al. with surface pKa determined by the TNS method was used for model development.4 The cleaned and three-dimensional (3D) optimized structures of all heterolipids were constructed in ChemSketch version 12.0 (Table S1). The 2D-QSAR study requires the calculation of molecular descriptors. Accordingly, a large number of two-dimensional (2D) physiochemical descriptors were calculated by QSAR Plus module within VLife Molecular Design Suite. For the development of the model from a total of 56 molecules, 50 molecules were selected and the remaining six molecules, 2, 5, 43, 50, 51, and 52, were eliminated as statistical outliers because of the non-optimum Z score.23 The 50 molecules were divided manually into two sets, a training set of 38 molecules and a test set of 12 molecules. The QSAR model was developed using the partial least-squares regression (PLSR) technique by the forward variable selection process with pKa activity fields as dependent variables and the calculated 116 physicochemical descriptors having a cross-correlation limit of 0.5 as independent variables.24,25 The developed QSAR model was evaluated using the statistical measures: r2—squared correlation coefficient, q2—cross-validated r2 (by leaving one out), which is the relative measure of the quality of fit, pred_r2—r2 for the external test set, r2_se—standard error of the squared correlation coefficient, q2_se—standard error of cross-validation, pred_r2se—standard error of external test set prediction, Fischer’s value F—a test that represents the F ratio between the variance of the calculated and observed activities, N—number of observations (molecules) in the training set, Z score—the score calculated by q2 in the randomization test, best_r and_q2—the highest q2 value in the randomization test, and alpha_r and_q2—the statistical significance parameters obtained by the randomization test.
The calculated value of the F-test when compared with the tabulated value of the F-test shows the level of statistical significance (99.99%) of the QSAR model. The low standard errors of pred_r2se, q2_se, and r2_se show the absolute quality of fitness of the model. The generated QSAR model was validated for the predictive ability inside the model using cross-validation (LOO) for q2. External validation, which is a more robust alternative method for validation, was performed by dividing the data into a training set and a test set and calculating pred_r2. The high pred_r2 and low pred_r2_se would imply the high predictive ability of the model. For selecting the optimal model, r2, q2, and pred_r2 values were used as deciding factors.
2.3. Design of Heterolipids for the Validation of the QSAR Model
Several molecules based on chemistry developed in our lab, and literature data were designed and few selected were synthesized for validation and evaluating the predictive ability of the QSAR model.22,26 Two series of heterolipid molecules were designed consisting of: series I bicephalous with a single tail and series II monocephalous with two tails. The four designed molecules from series I, designated as HL-22, HL-23, HL-32, and HL-33, and the four from series II, designated as HLysA-3, HLysA-2, HLysE-3, and HLysE-2, having a widespread range of predicted pKa of 4.64–6.80 were selected for synthesis (Figure 1). From a chemical structure standpoint, all of the molecules are homologous with a varying number of methylene groups in the head moiety and carry oleic acid chain(s) having a cis-double bond. Other distinguishing structural features of the molecules are that series I has ester linkers and three basic tertiary amino moieties, one at the branching point and two at the periphery in the head groups, whereas series II with amide linkers has only one basic tertiary amino moiety at the periphery in the head groups.
Figure 1.
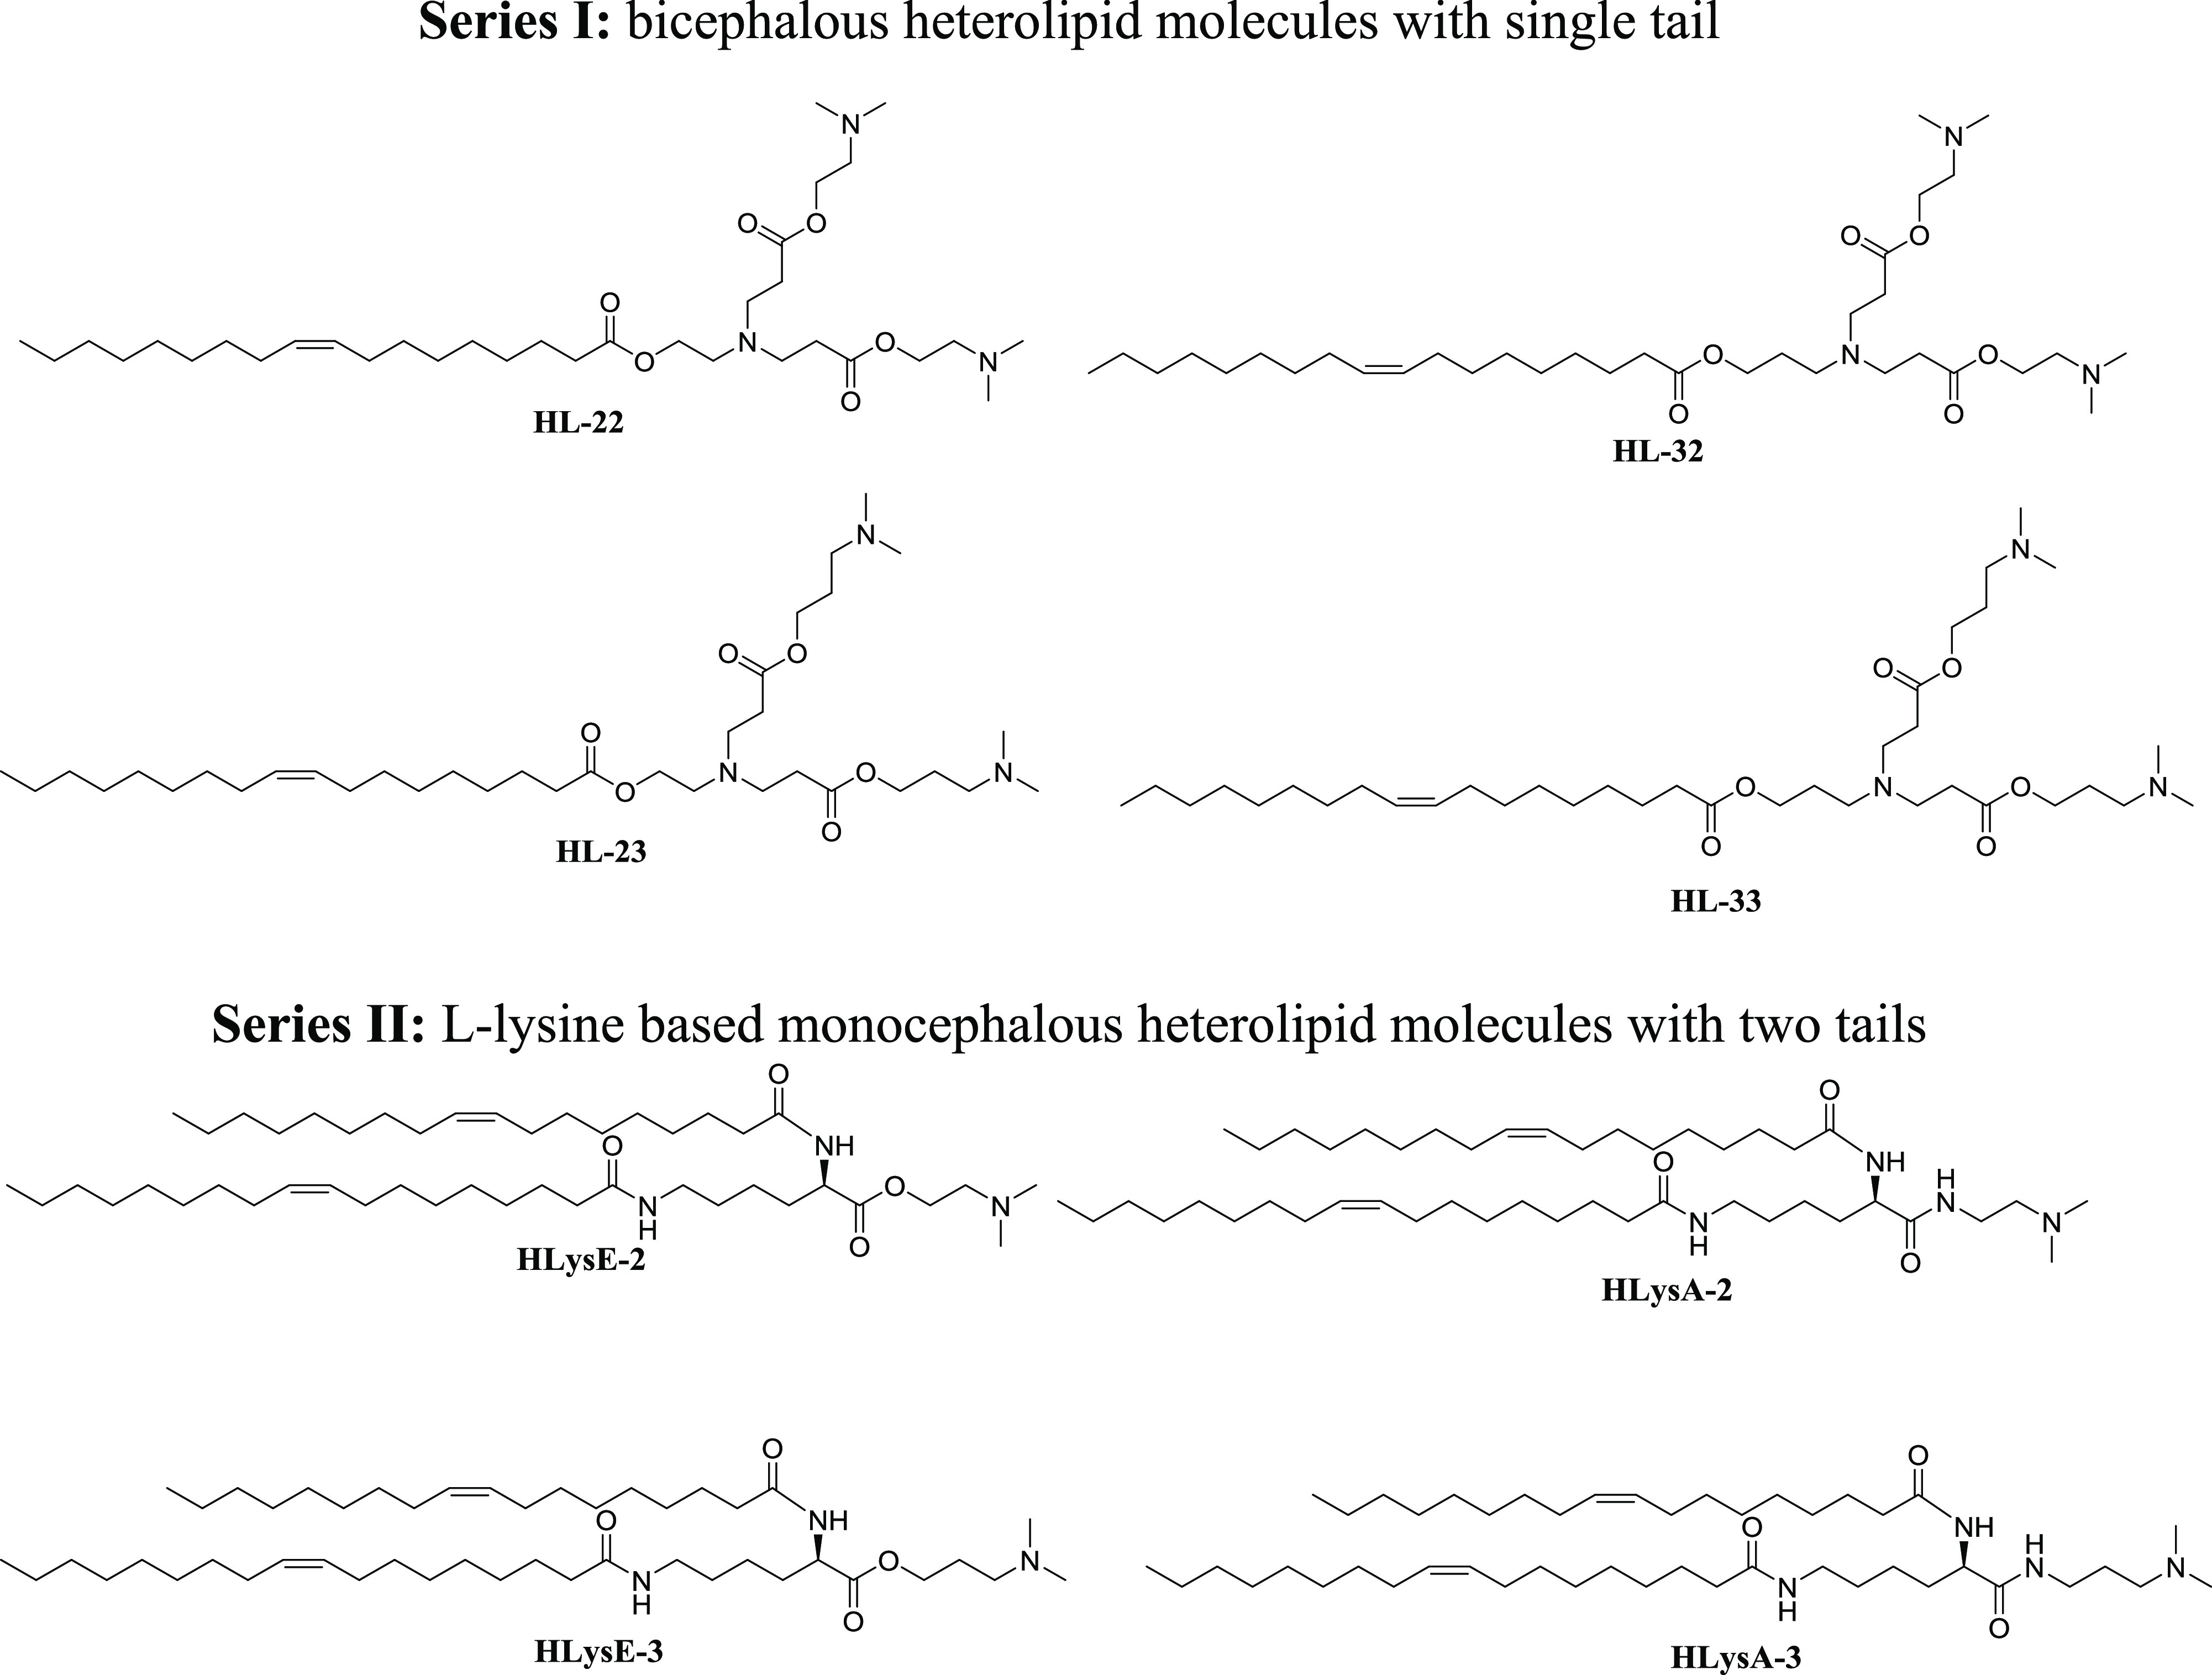
Designed heterolipid molecules selected for synthesis.
2.4. Synthesis of Heterolipids
2.4.1. General Schemes for the Synthesis of Series I Bicephalous Single-Tailed Heterolipids
2.4.1.1. Step-I: Synthesis of Aminoalkyl Acrylates (Scheme 1, Step I)
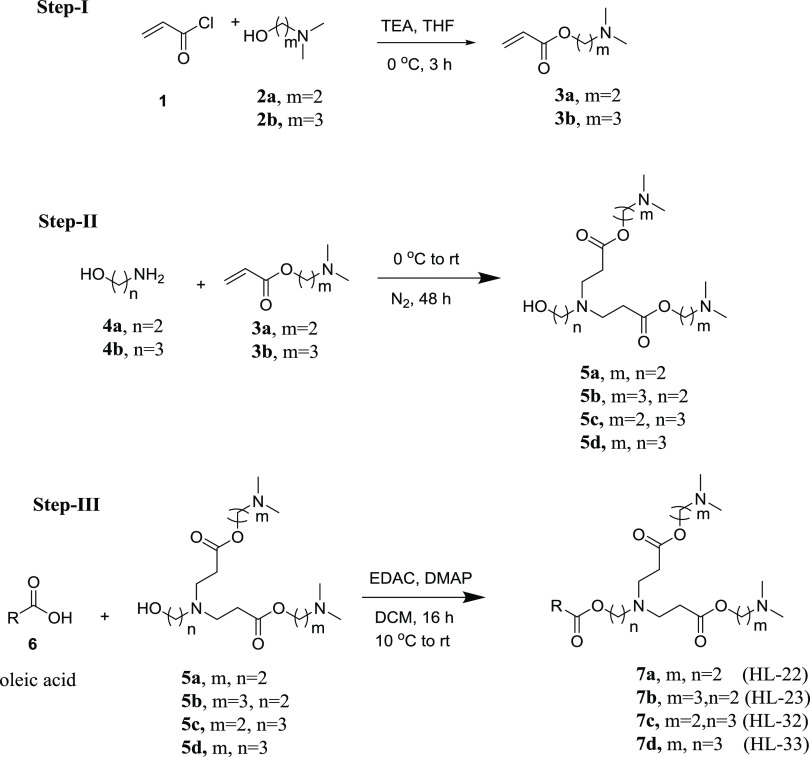
Scheme 1. General Scheme for the Synthesis of Series I Bicephalous Single-Tailed Heterolipids.
To a stirred solution of N,N-(dimethylamino) alcohol (2a/2b) (1.0 equiv) in 100 mL of tetrahydrofuran (THF) with triethylamine (TEA) (3.0 equiv) cooled to 0 °C was added acryloyl chloride (1) (1.2 equiv) dropwise under nitrogen and stirred for 3 h maintaining the reaction temperature at 0 °C. After completion of the reaction (monitored by TLC), the reaction mixture was filtered and the filtrate was concentrated to obtain the crude product as residue. The residue was purified by column chromatography using neutral alumina and dichloromethane (DCM) as stationary and mobile phases, respectively, to obtain pure aminoalkyl acrylate (3a/3b) as a light yellowish liquid (Scheme 1).
2.4.1.2. Step-II: Synthesis of Heterodendrons 5a–5d (HD-22, HD-32, HD-23, and HD-33) (Scheme 1, Step II)
A Michael addition reaction between amino alcohol (4a/4b) (1.0 equiv) and aminoalkyl acrylate 3a/3b (4.0 equiv) was carried out as follows: 4a/4b was added dropwise to aminoalkyl acrylate (3a/3b) at 0 °C under constant stirring and allowed to stand till the temperature of the reaction mass increased to room temperature (RT) and was again stirred continuously for 48 h. The reaction mass was subjected to rota evaporation in vacuo to remove volatiles and to obtain pure heterodendrons 5a–5d (HD-22/HD-32/HD-23/HD-33) as a light yellowish liquid residue.
2.4.1.3. Step III: Synthesis of Heterolipids 7a–7d (HL-22, HL-32, HL-23, and HL-33) (Scheme 1, Step III)
A solution of oleic acid (6) (1.0 equiv) in DCM along with EDAC (1.0 equiv) and a catalytical amount of DMAP was stirred at 10 °C for 30 min. To this cold solution was added heterodendron (5a/5b/5c/5d) (1.0 equiv) and the solution was again stirred for a further 30 min. The cooling bath was removed and the reaction mass was stirred for 16 h. After the completion of the reaction (by TLC), the solvent was removed from the reaction mixture under vacuo, and the residue obtained was purified by column chromatography (SiO2 #60-120) using DCM/methanol (MeOH), 10:2, as the eluent to afford 7a–7d (HL-22/HL-23/HL-32/HL-33) as a light yellowish sticky mass.
2.4.2. General Schemes for the Synthesis of Series II Lysine-Based Monocephalous Two-Tailed Heterolipids
2.4.2.1. Step I: Synthesis of N,N′-Dioleoyl-l-lysine 10 (Scheme 2, Step I)
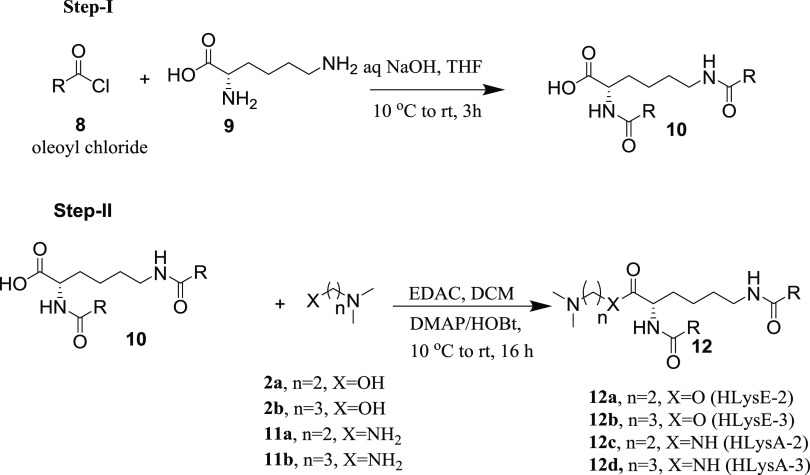
Scheme 2. General Scheme for the Synthesis of Series II l-lysine-Based Monocephalous Two-Tailed Heterolipids.
l-Lysine (9) (1.0 equiv) was added to 100 mL of a 10 mM aq NaOH solution (pH 8) followed by 100 mL of THF. Oleoyl chloride (8) (2.0 equiv) was added dropwise to the mixture at 10 °C, and the pH was adjusted to around 8 by adding aliquots of dilute NaOH/HCl. After completion of addition, the temperature of the reaction mass was allowed to rise to room temperature under stirring for 3 h. After completion of the reaction, the reaction mass was neutralized by the addition of dilute HCl. The organic layer was separated, washed with water, dried over anhydrous sodium sulfate, concentrated in vacuo, and the residue obtained was column chromatographed (SiO2 #60-120) using DCM/MeOH, 10:1, as the eluent to provide N,N′-dioleoyl-l-lysine (10) (Scheme 2).
2.4.2.2. Step II: Synthesis of Monocephalous Two-Tailed Heterolipids (HLysE-2, HLysE-3, HLysA-2, and HLysA-3) (Scheme 2, Step II)
2.4.2.2.1. Synthesis of 12a/12b (HLysE-2/ HLysE-3)
N,N′-Dioleoyl-l-lysine (10) (1.0 equiv) was dissolved in 50 mL of DCM along with EDAC (1.0 equiv) and a catalytical amount (0.1 equiv) of DMAP at 10 °C and stirred for 30 min. To the stirred mass, N,N-dimethylamino alcohol (2a/2b) (1.0 equiv) was added maintaining the temperature at 10 °C and continued stirring for 30 min. The temperature of the reaction mass was slowly allowed to rise to room temperature and stirring was continued for 16 h. The reaction mass was concentrated under reduced pressure, and the residue obtained was purified by column chromatography (SiO2 #60-120) using DCM/MeOH, 10:1, as the eluent to afford 12a/12b (HLysE-2, HLysE-3) as a slightly yellowish waxy solid.
2.4.2.2.2. Synthesis of 12c/12d (HLysA-2/ HLysA-3)
N,N′-Dioleoyl-l-lysine (10) (1.0 equiv) was dissolved in 50 mL of DCM in presence of EDAC (1.0 equiv) and HOBt (1 equiv) at 10 °C followed by N,N-dimethyldiamine 11a/11b. The reaction mixture was stirred for 30 min at 10 °C, and then the temperature was allowed to rise slowly to room temperature and stirring was continued for 16 h. The reaction mass was concentrated under reduced pressure, and the residue obtained was purified by column chromatography (SiO2 #60-120) using DCM/MeOH, 10:1, as the eluent to afford 12c/12d as a white solid (HLysA-2/HLysA-3).
2.5. Determination of the Surface pKa of the Heterolipids in Lipid Nanoparticle (LNP) Assembly by the Anionic Fluorescent Probe TNS
To determine the surface pKa of the heterolipids, a literature procedure was followed.4 LNPs consisting of heterolipids were prepared by the dry film method. Heterolipids/DSPC/cholesterol/poly(ethylene glycol) (PEG)-lipids (40/10/40/10 mol %) were dissolved in equal volumes of the chloroform/methanol mixture, and the solvents were removed using a rotary evaporator to obtain a dry film. The dry film was hydrated in phosphate buffer to achieve a final concentration of ∼6 mM of total lipids. A TNS stock solution of 100 μM was prepared in distilled water. The LNPs were diluted by 2 mL of buffer solutions with pH in the range of 2.5–11 containing 10 mM N-(2-hydroxyethyl)piperazine-N′-ethanesulfonic acid (HEPES), 10 mM mesityl(2,4,6-trimethylphenyl) (MES), 10 mM ammonium acetate, and 130 mM NaCl, and an aliquot of the TNS solution was added to give a final concentration of 1 μM. The solutions were vortexed and allowed to equilibrate at room temperature for 30 min. The surface charge of the LNP was monitored at room temperature by determining the TNS fluorescence at each pH using excitation and emission wavelengths of 321 and 445 nm, respectively. A sigmoidal best fit analysis was applied to the fluorescence data and the pKa was measured as the pH giving rise to the half-maximal fluorescence intensity.
3. Results and Discussion
3.1. Development of QSAR Model
Selection of molecules in the training set and the test set is a key and important feature of any QSAR model. We chose all those molecules whose activities lie within the range of maximum and minimum pKa values of 8.12 and 4.17, respectively. Unicolumn statistics for the training and test sets was generated to check the correctness of the selection criteria (Table 1). The maximum and minimum pKa values in the training and test sets were compared in a way that the maximum value of pKa of the test set should be less than or equal to the maximum value of pKa of the training set. Similarly, the minimum value of pKa of the test set should be higher than or equal to the minimum value of pKa of the training set.27 It was found that the test set was interpolative and derived within the range of maximum and minimum pKa values of 8.12 and 4.17, respectively, of the training set, and average values and standard deviations values of pKa of the training and test sets provided insights into the relative difference in the mean and point density distributions of the two sets. The mean pKa value of 7.05 of the test set was higher than the mean pKa value of 6.61 of the training set, indicating the presence of relatively more active molecules as compared to the inactive molecules. Similarly, a relatively higher standard deviation value of 0.83 of the training set indicates that the training set has widely distributed activity between its molecules as compared to the test set.
Table 1. Unicolumn Statistics for the Training and Test Sets.
| pKa |
|||||
|---|---|---|---|---|---|
| average | maximum | minimum | standard deviation | sum | |
| training | 6.6124 | 8.1200 | 4.1700 | 0.8315 | 251.2700 |
| test | 7.0567 | 8.1100 | 6.2100 | 0.5511 | 84.6800 |
3.1.1. QSAR Equation
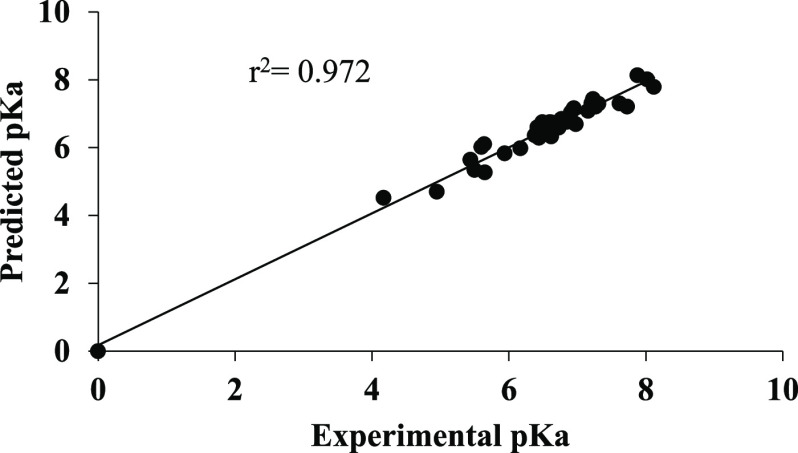
Various QSAR models were developed using the partial least-squares (PLS) technique and a particular equation was selected by optimizing the statistical results generated along with the variation of the descriptors in these models. The statistical significance of the selected QSAR model was further supported by the “fitness plot” obtained. The fitness plot is experimental versus predicted activity of the training set of the molecules, which provides an idea about how well the model was trained and how well it predicts the activity of the external test set (Figure 2).
Figure 2.
Graph of predicted versus experimental pKa values for the training set.
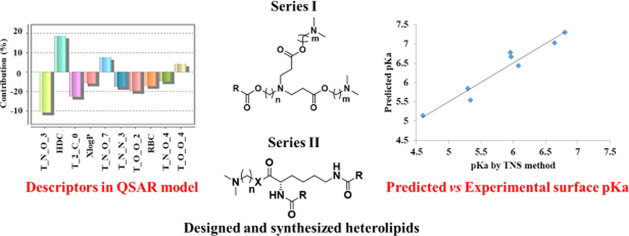
The frequency of the appearance of particular descriptors in a population of equations indicates the extent of contributions of the descriptors. The contribution chart for the significant model is presented in Figure 3, which gives the percentage contribution of each of the descriptors in the model.
Figure 3.
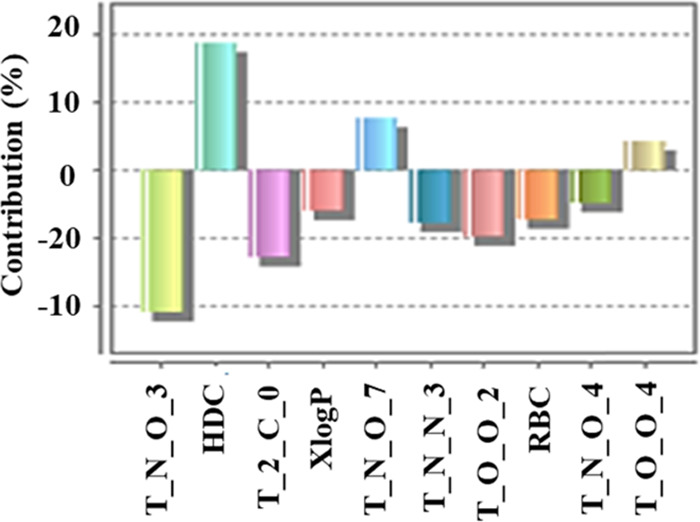
Percentage contributions of the descriptors in the model (descriptors explanation is given in the Supporting Information (SI)).
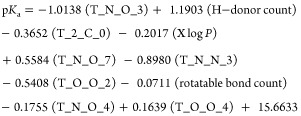
The best regression equation (QSAR model) obtained is represented as 1
 |
1 |
3.1.2. Statistical Evaluation of the QSAR Model
The statistical results of the PLSR model are shown in Table 2. The equation explains 97.2%, r2 = 0.972 of the total variance in the training set as well as it has internal q2 and external pred_r2 predictive ability of ∼83 and ∼63%, respectively. The values of internal q2 and external pred_r2 predictions are greater than the minimum recommended values, hence they are significant.28 The value of F-test = 103.15 shows the statistical significance of 99.99% of the model, which means the probability of failure of the model is 1 in 10 000. In addition, the randomization test shows a confidence of ∼99.9%, signifying that the generated model is not random.
Table 2. Statistical Results of the QSAR Equation 1.
| sr. no. | statistical parameters | QSAR results |
|---|---|---|
| 1 | n | 38 |
| 2 | degree of freedom | 33 |
| 3 | r2 | 0.972 |
| 4 | q2 | 0.83 |
| 5 | F_test | 103.158 |
| 6 | r2_se | 0.2396 |
| 7 | q2_se | 0.363 |
| 8 | pred_r2 | 0.6328 |
| 9 | pred_r2se | 0.4366 |
| 10 | Z score_q2 | 2.88 |
| 11 | best_r and_q2 | 0.08616 |
| 12 | alpha_r and_q2 | 0.0100 |
The descriptors selected in the present study for QSAR modeling are defined and summarized in Tables S2 and S3. The correlation matrix between the physicochemical descriptors and alignment of independent descriptors influencing the pKa activity is presented in Table S4.
3.1.3. Analysis of the QSAR Model
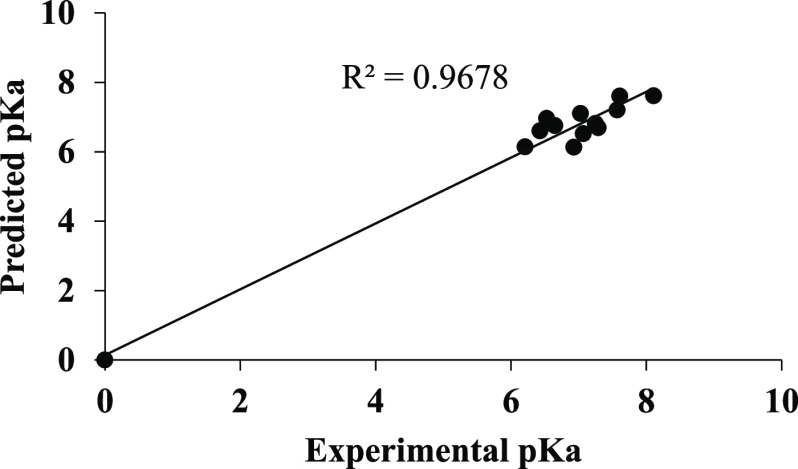
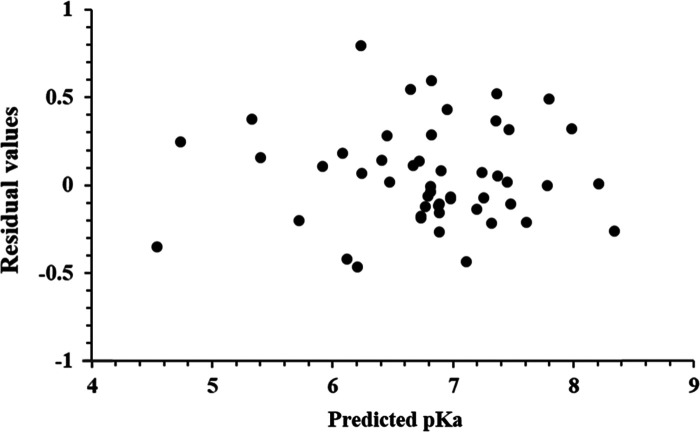
Using the QSAR model, pKa values for the training set were predicted (Table S5). A plot of experimental versus predicted pKa shows a higher r2 value of 0.972 indicating the accuracy of the results (Figure 2). No significant difference was observed in the predicted and experimental pKa values, and the F-test value of 103.158 shows the good statistical significance of the model. Similarly, the QSAR model was used to predict pKa values for the test set (Table S5). A plot of experimental versus predicted pKa showed an r2 value of 0.967, which indicates the high predictive accuracy of the results (Figure 4). The predicted and experimental pKa values of the test set were comparable to each other, demonstrating the validity of the QSAR model. A plot of residual pKa versus predicted pKa values for training as well as test molecules (Figure 5) shows that the prediction error in the model is minimal in the range from −0.46 to +0.79, signifying high accuracy of the model.
Figure 4.
Graph of predicted versus experimental pKa for the test set.
Figure 5.
Graph of residual values versus predicted pKa.
We tried to develop a model with a minimum number of descriptors to be precise, as in the case of small drug molecules, to improve prediction ability, but we observed that reducing the number of descriptors affected parameters like r2 and q2 as well as there was poor prediction ability. The present study is with respect to lipid macromolecules having the possibility of multiple interactions and the pKa having determined in the liposomal system where multiple interactions are envisaged, therefore a large number of terms would be desirable. A larger number of terms would account for multiple interactions and improve the predictivity of the model. Moreover, a large number of terms would be helpful in incorporating structural diversities in the molecule. The QSAR study revealed that all of the 10 contributed descriptors in the model have an impact on determining the pKa of heterolipids and studying them would be essential for designing new heterolipids with desired pKa. Descriptors like T_N_O_3, T_N_O_4, and T_N_O_7 reveal that the positional distance between the two heteroatoms oxygen and nitrogen plays an important role in pKa. T_N_O_3 and T_N_O_4 are negatively contributing descriptors, whereas T_N_O_7 is a positively contributing descriptor. Among the selected descriptors, T_N_O_3 is the most negatively contributing (effect found in molecules 3, 11, 12, 45, 46, and 53). The negative effect of the T_N_O_3 descriptor on pKa can be easily observed by comparing molecules with and without the T_N_O_3 descriptor. For example, molecules 42 and 53 are not homologous but have some similarity in their structures; molecule 42 (pKa-7.23) with no T_N_O_3 effect due to the absence of T_N_O_3 has higher pKa than molecule 53 (pKa-6.38) with T_N_O_3 and its effect. Similar effects can be observed in molecules 1 and 3, both are homologous, and molecule 1 (pKa-6.68) with no T_N_O_3 effect has higher pKa than molecule 3 (pKa-5.94) with the T_N_O_3 effect. These findings signify the importance of the distance of two heteroatoms in the chemical structure. Similarly, T_N_O_4 also negatively contributes to pKa (effect found in molecules 6, 9, 15, and 16), whereas T_N_O_7 shows a positive relation (effect found in molecules 17, 18, 33, and 34). While comparing the homologous series of molecules 14–18, the pKa increases gradually from 4.17 to 7.16 as the positional distance between oxygen and nitrogen increases by changing the length of the spacer (from 1 to 5 number of methylene groups in the spacer). The absence of TNO3 and its negative effect on pKa in these molecules are the reasons for the observed gradual increase in pKa. These observations suggest that heterolipids having a bond distance between oxygen and nitrogen atoms beyond 4 forms stable conjugate acids, resulting in higher pKa.
The hydrogen donor count has a strong positive effect on pKa and is the strongest positively contributing descriptor. The QSAR study shows that molecules 32, 41, and 48 in the presence of primary and secondary amines in their chemical structure have both predicted as well as experimental pKa values higher. This could be attributed to their ability to readily share hydrogen bonds to stabilize the conjugate acid. Another important outcome of the study was that pKa is affected by alkyl substitution on heterolipids. As the number of methylene groups in the alkyl substituents increases, it is expected to increase the basicity and pKa of molecules due to the (+) inductive effect of methylene groups. Contrary to this expectation, decrease in pKa was observed with an increase in the number of methylene groups in the case of molecules 37, 38, and 41 and 16, 30, 31, and 47, having 2 and 3° amino groups, respectively. Therefore, it can be concluded that the acidity of heterolipids can be tuned by judiciously selecting alkyl substitutions on amine groups.
As expected, the lack of stereochemically differentiating descriptors in our model leads to the predicted pKa values of enantiomers 1 and 4 as well as the diastereomeric pairs 6, 7, and 8 and 9, 20, and 21 to be the same, while the experimental pKa of the enantiomers were found to be the same but the diastereomeric pairs 8 (pKa-7.29) and 9 (pKa-6.98) had a specifically profound impact. Other descriptors like T_2_C_0, XlogP, T_N_N_3, T_O_O_2, and rotatable bond count show a negative impact, whereas T_O_O_4 shows a positive impact on pKa. Though these descriptors play an important role and contribute to pKa, their contribution is not as significant as that of T_N_O_3 and hydrogen donor count.
3.2. Experimental Validation of the QSAR Model
To effectively design heterolipids with the desired pKa, it is valuable to understand the impact of the descriptors, the positioning of heteroatoms, the hydrogen bonding, and the number of alkyl groups in the chemical structure of the heterolipid on the pKa. To validate the present model, numerous heterolipid molecules were constructed computationally, and using the model, their pKa values were predicted. Among them, eight molecules were selected for synthesis based on criteria such as head group, number of tails, and ease of synthesis and implemented for the validation of our model. Therefore, it can be concluded that the developed QSAR model would be helpful in designing new heterolipids with desired surface pKa for intracellular delivery of therapeutic molecules such as siRNA.
3.2.1. Synthesis of Heterolipids
Designed heterolipids (Figure 1) were synthesized as per Schemes 1 and 2. Detailed experimental procedure, purification, and characterization data are provided in the Supporting Information. All of the eight heterolipids including four from each series were synthesized in the yield range of 88–96%, indicating the efficiency of the synthetic scheme. Chemical structures were confirmed by Fourier transform infrared (FTIR), 1H NMR, 13C NMR, and high-resolution mass spectral (HRMS) data. All of the associated information related to synthesis and characterization is presented in the Supporting Information.
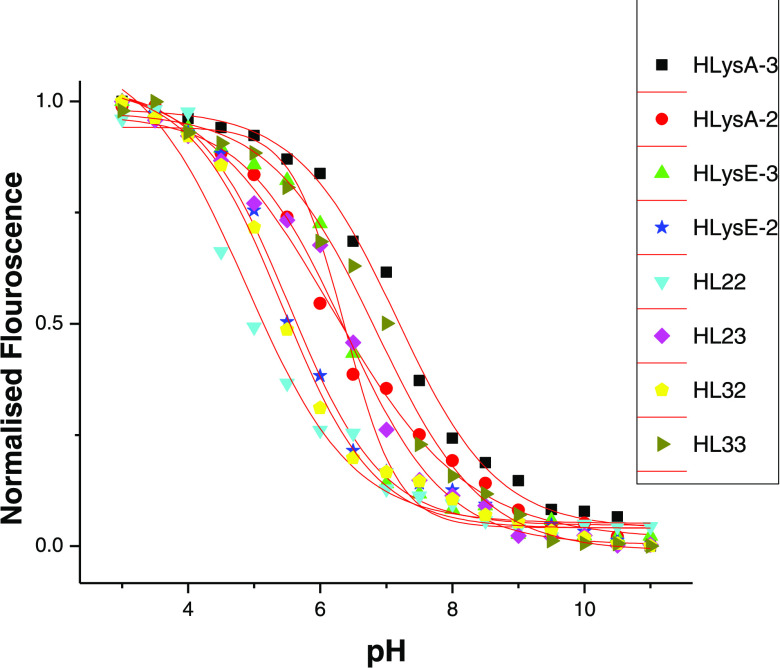
3.2.2. TNS Assay for Determination of Surface pKa
Most of the developed LNPs had particle sizes around 100 nm (Figure S28) and they were stable at room temperature for a longer time. The plot of the normalized fluorescence of TNS versus pH allowed us to determine the surface pKa of synthesized heterolipids in their LNP system (Figure 6). The results of pKa measurements of all of the heterolipids along with pKa values predicted by the QSAR model were compiled (Table 3). There is a strong correlation between pKa values determined experimentally and by the QSAR model with a correlation coefficient of 93.3% (Figure S29). This fact indicates that the QSAR model has a very strong predictive ability with limitations of not being 100% correct and could be considered as a strong and robust alternative to trial and error methods in selecting heterolipids for delivery of nucleic acid therapeutics such as siRNA. Specifically, the model could be employed to design amino lipids for intracellular delivery of molecules to target hepatocytes for hepatic diseases and cancer tissues. Our future plan of work is to investigate and utilize these heterolipids in intracellular siRNA/drug delivery to conclusively establish the approach.
Figure 6.
Representative plot for all of the heterolipids showing normalized TNS fluorescence intensity as a function of pH in the presence of liposomes that consist of heterolipids/DSPC/cholesterol/PEG-lipid (40/10/40/10 mol %, respectively). The apparent pKa value of the amino lipid is the pH at which TNS fluorescence is half of its maximum and it was obtained after fitting the data with a sigmoid function.
Table 3. Comparative Table of Predicted pKa by the QSAR Model and Experimental pKa by the TNS Method.
| heterolipid | predicted pKa | experimentala pKa(±SD) |
|---|---|---|
| HL-22 | 4.60 | 5.14 ± 0.02 |
| HL-23 | 5.96 | 6.78 ± 0.17 |
| HL-32 | 5.34 | 5.54 ± 0.04 |
| HL-33 | 6.64 | 7.03 ± 0.04 |
| HLysE-2 | 5.30 | 5.84 ± 0.11 |
| HLysE-3 | 5.97 | 6.67 ± 0.08 |
| HLysA-2 | 6.08 | 6.44 ± 0.05 |
| HLysA-3 | 6.80 | 7.30 ± 0.03 |
n = 3, ±SD = standard deviation.
4. Conclusions
In conclusion, the developed QSAR model shows a good statistical algorithm with a strong correlation of 93.3% between predicted and experimentally determined pKa values, demonstrating its precision and effectiveness. Furthermore, the developed QSAR model would become a useful tool for designing specific heterolipids with tailored structures, properties, and pKa for intracellular delivery of siRNA. The developed QSAR model would be helpful to hold up this innovation by means of providing quick screening of a large number of heterolipid libraries to fasten the process of developing innovative siRNA delivery vehicles.
Acknowledgments
D.M.D. is thankful to both the Department of Science and Technology, Govt. of India and Indo-French Centre for the Promotion of Advanced Research (IFCPAR/CEFIPRA) for providing financial assistance under INSPIRE and Raman–Charpak fellowship programs, respectively. The authors gratefully acknowledge VLife Sciences Technologies Pvt. Ltd., Pune, India for providing molecular modeling software VLife MDS (molecular design suite) 4.3.
Supporting Information Available
The Supporting Information is available free of charge at https://pubs.acs.org/doi/10.1021/acsomega.0c04931.
Materials and methods which includes the calculation of molecular descriptors; generation of training and test sets; forward stepwise as the variable selection method; partial least-squares (PLS) regression method; model validation and evaluation of the quantitative model; structures of heterolipids with corresponding experimental pKa values; selected descriptors for 2D-QSAR modeling of the pKa activity of heterolipids; selected physicochemical and alignment independent descriptors used in the 2D-QSAR model with values; correlation matrix between the physicochemical descriptors and the alignment independent descriptor influencing pKa; comparative data of experimental and predicted pKa of heterolipids; detailed synthesis protocol of heterolipids with characterization data; particle size of LNPs; and correlation between predicted and experimental pKa (PDF)
The authors declare no competing financial interest.
Supplementary Material
References
- Savla R.; Browne J.; Plassat V.; Wasan K. M.; Wasan E. K. Review and analysis of FDA approved drugs using lipid-based formulations. Drug Dev. Ind. Pharm. 2017, 43, 1743–1758. 10.1080/03639045.2017.1342654. [DOI] [PubMed] [Google Scholar]
- Rietwyk S.; Peer D. Next-generation lipids in RNA interference therapeutics. ACS Nano. 2017, 11, 7572–7586. 10.1021/acsnano.7b04734. [DOI] [PubMed] [Google Scholar]
- Kulkarni J. A.; Cullis P. R.; Meel R. Lipid nanoparticles enabling gene therapies: from concepts to clinical utility. Nucleic Acid Ther. 2018, 28, 146–157. 10.1089/nat.2018.0721. [DOI] [PubMed] [Google Scholar]
- Jayaraman M.; Ansell S. M.; Mui B. L.; Tam Y. K.; Chen J.; Du X.; Butler D.; Eltepu L.; Matsuda S.; Narayanannair J. K.; Rajeev K. G.; Hafez I. M.; Akinc A.; Maier M. A.; Tracy M. A.; Cullis P. R.; Madden T. D.; Manoharan M.; Hope M. J. Maximizing the potency of siRNA lipid nanoparticles for hepatic gene silencing in vivo. Angew. Chem., Int. Ed. 2012, 51, 8529–8533. 10.1002/anie.201203263. [DOI] [PMC free article] [PubMed] [Google Scholar]
- Alabi C. A.; Love K. T.; Sahay G.; Yin H.; Luly K. M.; Langer R.; Anderson D. G. Multiparametric approach for the evaluation of lipid nanoparticles for siRNA delivery. Proc. Natl. Acad. Sci. U.S.A. 2013, 110, 12881–1272786. 10.1073/pnas.1306529110. [DOI] [PMC free article] [PubMed] [Google Scholar]
- Kanasty R.; Dorkin J. R.; Vegas A.; Anderson D. Delivery materials for siRNA therapeutics. Nat. Mater. 2013, 12, 967–977. 10.1038/nmat3765. [DOI] [PubMed] [Google Scholar]
- Whitehead K. A.; Dorkin J. R.; Chang P. H.; Vegas A. J.; et al. Degradable lipid nanoparticles with predictable in vivo siRNA delivery activity. Nat. Commun. 2014, 5, 4277 10.1038/ncomms5277. [DOI] [PMC free article] [PubMed] [Google Scholar]
- Ledford H. Gene-silencing technology gets first drug approval after 20-year wait. Nature 2018, 560, 291–292. 10.1038/d41586-018-05867-7. [DOI] [PubMed] [Google Scholar]
- Cullis P. R.; Hope M. J. Lipid nanoparticle systems for enabling gene therapies. Mol. Ther. 2017, 25, 1467–1475. 10.1016/j.ymthe.2017.03.013. [DOI] [PMC free article] [PubMed] [Google Scholar]
- Buck J.; Grossen P.; Cullis P. R.; Huwyler J.; Witzigmann D. Lipid-based DNA therapeutics: hallmarks of non-viral gene delivery. ACS Nano. 2019, 13, 3754–3782. 10.1021/acsnano.8b07858. [DOI] [PubMed] [Google Scholar]
- Setten R. L.; Rossi J. J.; Han S. The current state and future directions of RNAi-based therapeutics. Nat. Rev. Drug Discovery 2019, 18, 421–446. 10.1038/s41573-019-0017-4. [DOI] [PubMed] [Google Scholar]
- Semple S. C.; Akinc A.; Chen J.; Sandhu A. P.; Mui B. L.; Cho C. K.; Sah D. W. Y.; Stebbing D.; Crosley E. J.; Yaworski E.; Hafez I. M.; Dorkin J. R.; Qin J.; Lam K.; Rajeev K. G.; Wong K. F.; Jeffs L. B.; Nechev L.; Eisenhardt M. L.; Jayaraman M.; Kazem M.; Maier M. A.; Srinivasulu M.; Weinstein M. J.; Chen Q.; Alvarez R.; Barros S. A.; De S.; Klimuk S. K.; Borland T.; Kosovrasti V.; Cantley W. L.; Tam Y. K.; Manoharan M.; Ciufolini M. A.; Tracy M. A.; Fougerolles A.; MacLachlan I.; Cullis P. R.; Madden T. D.; Hope M. Rational design of cationic lipids for siRNA delivery. Nat. Biotechnol. 2010, 28, 172–176. 10.1038/nbt.1602. [DOI] [PubMed] [Google Scholar]
- Degors I. M. S.; Wang D. C.; Rehman Z. U.; Zuhorn I. S. Carriers break barriers in drug delivery: endocytosis and endosomal escape of gene delivery vectors. Acc. Chem. Res. 2019, 52, 1750–1760. 10.1021/acs.accounts.9b00177. [DOI] [PMC free article] [PubMed] [Google Scholar]
- Xue H. Y.; Liu S.; Wong H. L. Nanotoxicity: a key obstacle to clinical translation of siRNA-based nanomedicine. Nanomedicine 2014, 9, 295–312. 10.2217/nnm.13.204. [DOI] [PMC free article] [PubMed] [Google Scholar]
- Kanasty R. L.; Whitehead K. A.; Vegas A. J.; Anderson D. G. Action and reaction: the biological response to siRNA and its delivery vehicles. Mol. Ther. 2012, 20, 513–524. 10.1038/mt.2011.294. [DOI] [PMC free article] [PubMed] [Google Scholar]
- Zhang J.; Fan H.; Levorse D. A.; Crocker L. S. Ionization behavior of amino lipids for siRNA delivery: determination of ionization constants, SAR, and the impact of lipid pKa on cationic lipid–biomembrane interactions. Langmuir 2011, 27, 1907–1914. 10.1021/la104590k. [DOI] [PubMed] [Google Scholar]
- Chaudhari K. S.; Akamanchi K. G. Fatty acid esters of G0-(propyl ether imine) dendron as bicephalous heterolipids for permeation enhancement in transdermal Drug delivery. ACS Biomater. Sci. Eng. 2018, 4, 4008–4020. 10.1021/acsbiomaterials.8b00953. [DOI] [PubMed] [Google Scholar]
- Chaudhari K. S.; Akamanchi K. G. Novel bicephalous heterolipid based self-microemulsifying drug delivery system for solubility and bioavailability enhancement of efavirenz. Int. J. Pharm. 2019, 560, 205–218. 10.1016/j.ijpharm.2019.01.065. [DOI] [PubMed] [Google Scholar]
- Dhumal D. M.; Akamanchi K. G. Self-microemulsifying drug delivery system for camptothecin using new bicephalous heterolipid with tertiary-amine as branching element. Int. J. Pharm. 2018, 541, 48–55. 10.1016/j.ijpharm.2018.02.030. [DOI] [PubMed] [Google Scholar]
- Dhumal D. M.; Kothari P. R.; Kalhapure R. S.; Akamanchi K. G. Self-microemulsifying drug delivery system of curcumin with enhanced solubility and bioavailability using a new semi-synthetic bicephalous heterolipid: in vitro and in vivo evaluation. RSC Adv. 2015, 5, 90295–90306. 10.1039/C5RA18112G. [DOI] [Google Scholar]
- Kalhapure R. S.; Akamanchi K. G. A novel biocompatible bicephalous dianionic surfactant from oleic acid for solid lipid nanoparticles. Colloids Surf., B 2013, 105, 215–222. 10.1016/j.colsurfb.2013.01.011. [DOI] [PubMed] [Google Scholar]
- Kalhapure R. S.; Akamanchi K. G. Oleic acid based heterolipid synthesis, characterization and application in self-microemulsifying drug delivery system. Int. J. Pharm. 2012, 425, 9–18. 10.1016/j.ijpharm.2012.01.004. [DOI] [PubMed] [Google Scholar]
- Lakhlili W.; Yasri A.; Ibrahimi A. Structure–activity relationships study of mTOR kinase inhibition using QSAR and structure-based drug design approaches. OncoTargets Ther. 2016, 9, 7345–7353. 10.2147/OTT.S108526. [DOI] [PMC free article] [PubMed] [Google Scholar]
- Hasegawa K.; Funatsu K. Partial least squares modeling and genetic algorithm optimization in quantitative structure-activity relationships. SAR QSAR Environ. Res. 2000, 11, 189–209. 10.1080/10629360008033231. [DOI] [PubMed] [Google Scholar]
- David T. S. QSAR and QSPR model interpretation using partial least squares (PLS) a Analysis. Curr. Comput.-Aided Drug Des. 2012, 8, 107–127. 10.2174/157340912800492357. [DOI] [PubMed] [Google Scholar]
- Walsh C. L.; Nguyen J.; Tiffany M. R.; Szoka F. C. Synthesis, characterization, and evaluation of ionizable lysine-based lipids for siRNA delivery. Bioconjugate Chem. 2013, 24, 36–43. 10.1021/bc300346h. [DOI] [PMC free article] [PubMed] [Google Scholar]
- Bhadoriya K. S.; Kumawat N. K.; Bhavthankar S. V.; Avchar M. H.; Dhumal D. M.; Patil S. D.; Jain S. V. Exploring 2D and 3D QSARs of benzimidazole derivatives as transient receptor potential melastatin 8 (TRPM8) antagonists using MLR and kNN-MFA methodology. J. Saudi Chem. Soc. 2016, 20, S256–S270. 10.1016/j.jscs.2012.11.001. [DOI] [Google Scholar]
- https://www.vlifesciences.com/support/Whitepaper/Edusar.pdf (accesed November 2020).
Associated Data
This section collects any data citations, data availability statements, or supplementary materials included in this article.


