Abstract
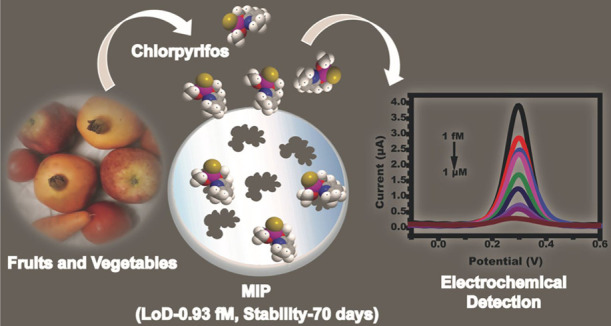
The persistent use of pesticides in the agriculture field remains a serious issue related to public health. In the present work, molecularly imprinted polymer thin films were developed using electropolymerization of pyrrole (py) onto gold microelectrodes followed by electrodeposition for the selective detection of chlorpyrifos (CPF). The molecularly imprinted polymer (MIP) was synthesized by the electrochemical deposition method, which allowed in-line transfer of MIP on gold microelectrodes without using any additional adhering agents. Various parameters such as pH, monomer ratio, scan rate, and deposition cycle were optimized for sensor fabrication. The sensor was characterized at every stage of fabrication using various spectroscopic, microscopic, and electrochemical techniques. The sensor requires only 2 μL of the analyte and its linear detection range was found to be 1 μM to 1 fM. The developed sensor’s limit of detection (LOD) and limit of quantification (LOQ) were found to be 0.93 and 2.82 fM, respectively, with a sensitivity of 3.98 (μA/(μM)/ mm2. The sensor’s shelf life was tested for 70 days. The applicability of the sensor in detecting CPF in fruit and vegetable samples was also assessed out with recovery % between 91 and 97% (RSD < 5%). The developed sensor possesses a huge commercial potential for on-field monitoring of pesticides.
Introduction
Food and environmental contamination due to pesticides is increasing enormously for the past few decades.1 Among the class of pesticides, organophosphate-based pesticides are more deleterious due to the irreversible inhibition of the acetylcholinesterase enzyme, which regulates acetylthiocholine, a neuro-transmitting agent.2,3 The adverse effects include respiratory disorder, muscular dystrophy, neurological ailments, and sometimes death.4−6 The above-stated consequences of the use of organophosphates (OPs) have motivated the scientific community to develop various analytical techniques for its quantitative or qualitative detection. The conventional analytical techniques available for the detection of OPs are high-performance liquid chromatography (HPLC), liquid chromatography (LC), mass spectroscopy (MS), gas chromatography-mass spectroscopy (GC-MS), enzyme-linked immunosorbent assay (ELISA), and other enzymatic immunoassays.7,8 The aforementioned techniques require a sophisticated analytical laboratory, cumbersome chemical processes, large sample volumes, and skilled manpower and also are costly.8−10
From the past few decades, molecularly imprinting technology (MIT) is an emerging versatile technique for the formation of affinity binding sites onto the polymer matrix.11,12 MIPs provide recognition sites for binding various analytes of interest depending upon their size, shape, and functionality.11,13 MIPs have garnered huge interest in the field of biosensors owing to ultrahigh sensitivity, selectivity, extremely low limits of detection, and longer shelf life.14,15 MIPs provide a straightforward “lock and key” detection mechanism, which has attracted the attention of the scientific community in general, which is reflected by the increased number of literature studies on molecularly imprinted technology, indicating its rapid advancement in the current trends and areas.16−21 Typical MIP synthesis employs semicovalent, noncovalent, electrostatic, and Van der Waals interactions between analytes and functional monomers, which are considered favorable due to ease of template removal and consequent rebinding. Also, there are many known polymerization techniques for the synthesis of MIPs such as emulsion polymerization,22 precipitation polymerization,23 solid-phase synthesis,24 and electropolymerization.25 Among these techniques, the electropolymerization method yields a rigid, uniform, and controlled polymer film with good adherence onto the electrode surface of any shape and size.26 The major advantage of the electropolymerization method is that it allows direct transfer of transduction elements onto the conductive surface without the need for further adhering agents.27
The various conventional applications of MIPs are solvent-phase extraction, membrane catalysis, molecular sensing probe for various analyte detection, drug delivery, protein crystallization, and cell adhesion.28 Recently, the focus on MIPs in the field of sensors has increased dramatically owing to their high affinity, stability, selectivity, and low fabrication cost.15,29 The traditional biosensor requires bioreceptors such as enzymes, antibodies, aptamers, DNA, and live cells, which are costly, less stable, and require a tedious immobilization strategy.30−33 MIPs have the ability to overcome the limitations of bioreceptors by acting as a synthetic bioreceptor, providing a highly selective, sensitive, stable, and low-cost sensing platform. An efficient transduction technique plays a very important role in sensor development. Among the known transduction techniques, electrochemical transducers offer potential advantages toward the point of care applications.29,34
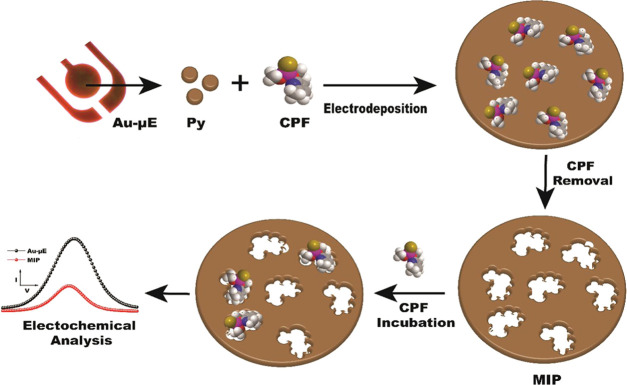
In the present work, the conductive polymer PPy was utilized as a polymeric matrix and chlorpyrifos as a template molecule. The MIP is synthesized by the in situ electropolymerization method and the analyte CPF is detected electrochemically using differential pulse voltammetry (DPV) and electrochemical impedance spectroscopy (EIS) techniques. Various characterization techniques such as Fourier transform infrared spectroscopy (FTIR), field emission scanning electron microscopy (FE-SEM), and atomic force microscopy (AFM) are employed to characterize the developed PPy-based MIP sensor. The sensor was tested for its stability and specificity with other OPs (parathion, malathion, and monocrotophos). The sensor was successfully applied to test the fruit and vegetable samples. The developed electrochemical-based MIP senor has a wide scope for commercialization with added advantages such as low cost, field deployability, and ease of use (Figure 1).
Figure 1.
Schematic of stepwise fabrication of the electrodeposited MIP onto Au-μE for the electrochemical detection of CPF.
Results and Discussion
Preparation of NIP and MIP
The electrodeposition of NIP (the inset of Figure 2) and MIP was performed using cyclic voltammetry (CV), as shown in Figure 2. Electrodeposition was evidenced by the appearance of anodic peak current at 1.24 V due to the oxidation of PPy onto Au-μE in the presence of CPF molecules. As the number of cycles increased, the anodic peak current decreased with a positive shift, which again confirms the formation of the PPy layer onto Au-μE.36 The observed decrease in the anodic current is due to interfacial hindering by PPy layers, which hampered the electron transfer kinetics.37 There was no major difference in the anodic peak current values for NIP and MIP, as the CPF molecules are not electroactive in nature.
Figure 2.
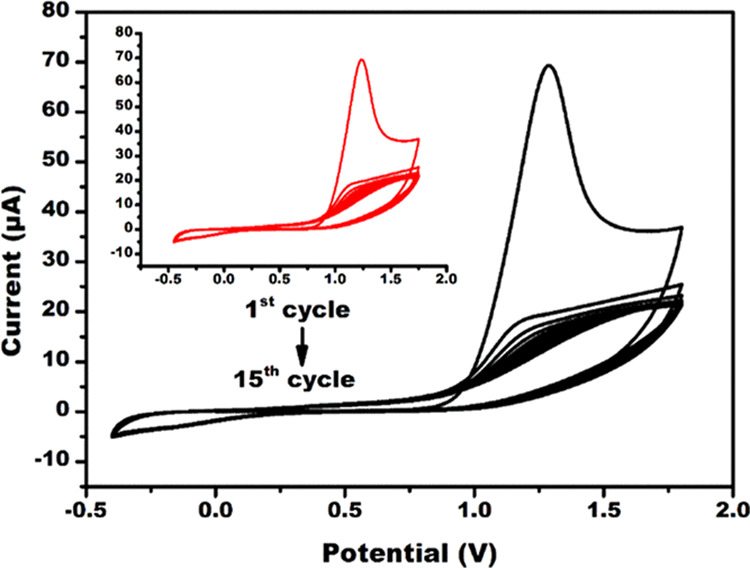
Electrodeposition of MIP onto Au-μE in the presence of CPF molecules and of NIP onto Au-μE in the absence of CPF molecules (in the inset) using CV in the potential window of −0.4 to +1.8 V up to 15 cycles at a fixed scan rate of 50 mV/s.
Optimization Studies
For the successful fabrication of the MIP sensor, various optimization parameters such as deposition cycles, monomer-to-template ratio, and template removal or extraction time were studied. All of the optimization studies were carried out in PBS (0.1 M, pH 7), containing 5 mM redox probe at 100 mV/s. The deposition cycles were optimized by electrodepositing PPy at various cycles ranging from 5 to 25 with an interval of 5 cycles, as shown in Figure S1a. The electropolymerization of the py monomer was observed at 1.3 V during successive CV cycles. A maximum current response (9.05 μA) was achieved at the 15th cycle, after which a decrease in the current response was observed with each successive voltammetric cycle. This is due to an increase in the PPy layer thickness, which hindered the electron transfer rate between the electrode and the redox probe.36 Therefore, 15 cycles were chosen as the optimum deposition cycles for the successful fabrication of NIP and MIP.
As the monomer-to-template ratio plays a key role for successful complex formation and binding efficiency for better selectivity, the monomer-to-template ratio was optimized,38 as shown in the DPV studies (Figure S1b). The template molecule binding to the monomers through a noncovalent or electrostatic approach requires precomplex formation for a better fabrication process, so the precomplex of py and CPF was allowed to be stirred for 30 min. The electrodeposition was performed with varying monomer-to-template ratios such as 1:1, 1:2, 1:3, 1:4, and 1:5. The highest DPV peak current was achieved for the ratio 1:3. Further, the increase in the CPF ratio resulted in a decrease in the peak current due to steric hindrance. As the 1:3 ratio exhibited a higher current response, it was selected as an optimal monomer-to-template ratio.37
The most challenging and crucial step involved in the synthesis of MIP was the extraction of template molecules from the polymer matrix.39 CPF was extracted from the PPy matrix with 50% v/v ethanol for different extraction times (2, 4, 6, 8, 10, and 12 min) and studied by DPV, as shown in Figure S1c. The extraction of CPF created cavities and a positively charged PPy surface was exposed. This positively charged electrode surface attracts the negatively charged redox probe, which promotes the transfer of electrons between the electrode and the electrolyte.40 When the extraction time increased, the more positively charged surface was exposed, which resulted in an increase in the current response. It was observed that the current attained saturation after 8 min, which confirms the extraction of CPF molecules from the PPy matrix. Therefore, 8 min was chosen as the optimum extraction time for the removal of CPF molecules for the successful fabrication of MIP having the affinity binding sites for CPF rebinding.
Characterization of NIP and MIP
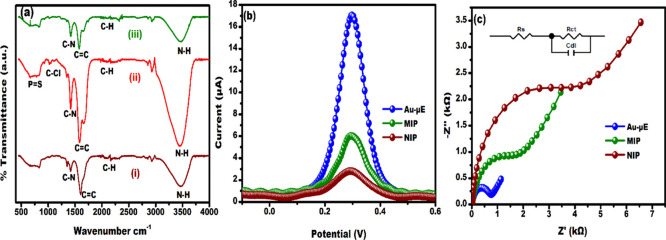
FTIR spectra were analyzed to confirm the successful fabrication of MIP at each stage, as shown in Figure 3a. For NIP (i), the vibrational bands at 1602 and 1412 cm–1 correspond to C=C stretching and C–N plane bending in PPy.37 The weak band at 2098 cm–1 represents C–H stretching.41 Vibrational bands at 1343 and 3469 cm–1 can be attributed to C–H in-plane and N–H stretching vibrations.42,43 The FTIR spectra of MIP before CPF extraction (ii) showed some new peaks at 1086 cm–1 corresponding to C–Cl bonds and a wide stretch from 670 to 847 cm–1 corresponds to the P=S group present in CPF.44 After the extraction of CPF from the PPy matrix, the C–Cl and P=S vibrational bands disappeared, thereby confirming the extraction of CPF almost completely from the PPy matrix. The FTIR spectra of MIP after CPF extraction (iii) and NIP showed similar vibrational bands due to the availability of only the PPy matrix, confirming the fabrication of MIP with CPF affinity sites for rebinding.
Figure 3.
(a) FTIR analysis (i-NIP, ii-MIP before CPF extraction, and iii-MIP after CPF extraction), electrochemical characterization at each stage of fabrication of the sensor by (b) DPV and (c) EIS (in the EIS plot, the dots and lines are experimental and fitted models, respectively).
The electrochemical characterization of Au-μE, NIP, and MIP was examined by DPV and EIS, as shown in Figure 3b,c. As can be observed in Figure 3b, the maximum peak current (∼17 μA) was obtained for Au-μE at +0.3 V. The result can be correlated with the good electrical conductivity of Au-μE in the presence of the probe solution, which facilitated better electron transfer between the electrode and the redox probe.35 When the electrodeposition of NIP onto Au-μE was performed, the current response decreased to 2.8 μA because of the less conductive polymer hindering layer formation and the electron transfer process. The CPF-extracted MIP electrode showed an increased current response of 6 μA compared to NIP because the cavities formed in the matrix of PPy promoted good electron transfer kinetics in the presence of the probe solution. The DPV analysis was also well associated with EIS studies in which the charge transfer resistance (Rct) was measured at each modification of the electrode. The Nyquist plot indicated a semicircular feature at higher frequencies and the presence of a linear line was corresponding to the diffusion process. In Figure 3b, Au-μE showed the lowest Rct of 0.8 kΩ compared to NIP (Rct – 4.3 kΩ). The Rct value of MIP is 2.6 kΩ, which is lower compared to that of NIP, signifying the enhanced electron transfer process at the MIP sites where the cavities formed after the removal of CPF molecules.14 The above feature was also correlated well with the FTIR spectra, which showed the absence of C–Cl and P=S vibrational bands of CPF molecules.
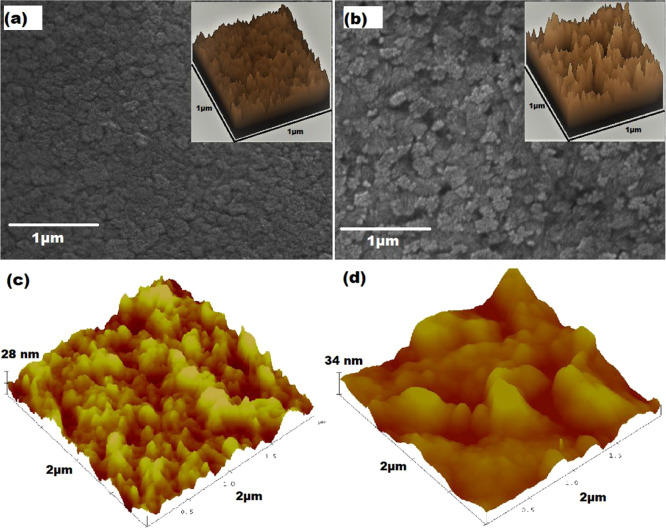
Figure 4a,b showed the surface morphological characteristics of NIP and MIP probed by SEM. The SEM image of MIP indicates an extremely rough surface as compared to that of NIP. Such rough surface signatures of MIP correspond to the formation of cavities due to analyte extraction.45 It is worth mentioning that the PPy matrix remains intact even after the extraction process. The aforementioned situation is further elucidated in the surface plots of NIP and MIP (insets of Figure 4a,b) derived from SEM micrographs using ImageJ software. The formation of a valley-like feature in MIP is attributed to the generation of CPF specific cavities after its removal from the PPy matrix, while no such valleys or trenches are observed in the surface plot of NIP, indicating pristine PPy surface.
Figure 4.
(a) SEM micrograph of NIP (surface plot in the inset), (b) SEM micrograph of MIP (surface plot in the inset), (c) three-dimensional (3D) AFM images of NIP, and (d) 3D AFM images of MIP.
Further, the surface morphology of NIP and MIP onto Au-μE was also investigated by AFM to calculate the root-mean-square (rms) surface roughness of the samples. Figure 4c,d shows the three-dimensional (3D) AFM images of NIP and MIP after the removal of CPF template molecules. NIP and MIP showed a significant change in the morphologies, as indicated by Figure 4c,d. This is also confirmed by the calculated rms surface roughness values.14 The rms values were obtained using NanoScope software, which is related to the height of the structures at each data point. It was noticed that the topography of NIP is almost flat with a surface roughness of about ∼4.2 nm, whereas MIP showed a rough surface with an rms value of ∼15.7 nm; it may be due to the removal of CPF molecules from the PPy matrix.
Scan Rate Study
The working electrode was subjected to various scan rates in the presence of PBS (0.1 M, pH 7), containing 5 mM redox probe to investigate that the electrochemical kinetics is purely a diffusion-controlled process. Figure S2a shows CV at various scan rates ranging from 10 to 100 mV/s. It can be observed that the interfacial current enhances as the scan rate is increased from 10 to 100 mV/s. Further, no major anodic or cathodic peak shift was observed with variation of the scan rate, indicating the stability of the molecularly imprinted sensor.46 The ratio of anodic and cathodic peak currents was close to unity, which indicates reversible and Nernstian redox kinetics of the redox probe.46Figure S2b shows a linear dependence of anodic and cathodic peak currents with the square root of the scan rate (ν1/2), which confirms the interface kinetics process to be dominated by mass transfer or diffusion phenomena (Randels–Sevick behavior), known to occur in porous electrode surfaces.
Electrochemical Detection of CPF
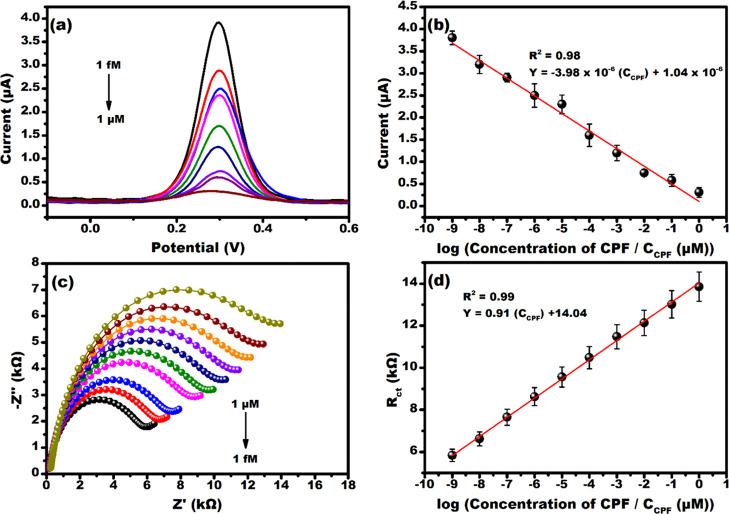
The electroanalytical sensing performance of the developed sensor was initially probed using DPV, as shown in Figure 5a. The voltammogram represents the typical signature of the redox process, which can be observed to decrease the peak current value from 3.9 to 0.27 μA as CPF concentrations increased from 1 fM to 1 μM. This is a consequence of CPF rebinding at the cavities in the PPy matrix, which primarily occurs via hydrogen bonding between the N group of pyridine (in CPF) and the N–H group of PPy.47 Increasing CPF levels leads to rapid filling up of cavities, as a result of the rebinding event, and eventually restricts the diffusion of redox probe ions near the electrode leading to poor redox kinetics of the probe, which implies less current (as shown in Figure 5a). Meanwhile, the accessibility of redox probe ions toward the electrode surface increases drastically at lower CPF concentrations, due to less number of cavities being filled up during the rebinding event (allowing rapid diffusion of the redox probe), which leads to higher current response. This fact is consistent with the results reported by Uygun et. al.47 The sensor was calibrated at +0.3 V and exhibited an indirect proportionality between the peak current and the CPF concentration, as shown in Figure 5b, with following linear regression equations y = −3.98 × 10⁻⁶ (CCPF) + 1.04 × 10⁻⁶ and R2 = 0.98. The LOD, LOQ, and sensitivity of the developed sensor were calculated to be 0.93 fM, 2.82 fM, and 3.98 μA/(μM)/mm2, respectively.
Figure 5.
Electrochemical detection of CPF at various concentrations (1 fM to 1 μM) by (a) DPV and (c) EIS. The calibration curve with the line equation plotted for (b) DPV and (d) EIS.
The interface kinetics during CPF rebinding was also assessed using EIS within a frequency sweep of 10 Hz to 1 MHz at a sinusoidal bias of 100 mV. The Nyquist spectra in Figure 5c revealed typical semicircular features corresponding to double-layer charging and the faradic process of interfacial charge transfer.48 In Figure 5c, the capacitive impedance Z″ can be observed to increase upon increasing the CPF concentration from 1 fM to 1 μM, which implies a decrease in double-layer capacitance (Cdl).49 This situation is ascribed to poor diffusion of redox probe ions near the electrode surface, specifically at the double-layer region, upon CPF rebinding and restricting the efficient accumulation of charge at the interface. Consequently, the direct electron transfer due to the redox process of the probe is impeded (due to the nonconducting nature of CPF), leading to a higher charge transfer resistance Rct of about 13.9 kΩ at 1 μM CPF (increased semicircle diameter in Figure 5c). However, decreasing the CPF concentration to 1 fM reduces Rct (5.8 kΩ) and consequently increases Cdl due to less CPF specific cavities being filled up and eventually allowing enhanced charging of the double layer with diffused redox probe ions.
As a result, the electrons generated due to the redox process get transferred efficiently (decreased by 2 times as compared to at 1 μM) across the interface because of extremely less hindrance provided by CPF molecules, eventually complimenting the voltammogram shown in Figure 5a. Figure 5d displayed the calibration plot obtained from the Nyquist spectra, which showed a linear increase in Rct with the increase in CPF concentration evidencing the binding of CPF at the affinity sites available on MIP, as explained earlier.
Selectivity, Stability, and Real Sample Analysis
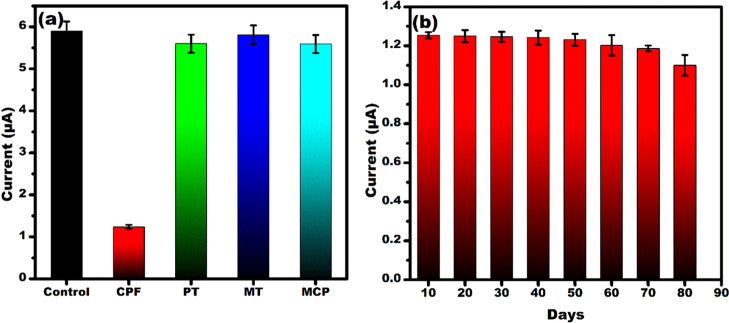
The selectivity and stability of the developed senor were tested, as shown in Figure 6. For selectivity studies, 1 nM solutions of CPF, parathion (PT), malathion (MT), and monocrotophos (MCP) were selected. The current response of other OPs was almost the same in comparison with the control sample (i.e., in the absence of the analyte (Figure 6a)), whereas for CPF, the current response was decreased due to the specific binding at the affinity sites. The change in the current response in the presence of CPF evidences the selective binding efficiency of the developed sensor, as explained in the previous section.
Figure 6.
Bar graph showing (a) selectivity studies by testing the developed sensor with various OPs (CPF, PT, MT, and MCP) at 1 nM concentration and (b) sensor’s stability analysis by testing at 5 day interval up to 80 days at 1 nM CPF concentration.
Figure 6b shows the stability study of the developed sensor. Several identical multiple electrodes were prepared and tested at 1 nM concentration of CPF at every 10 day interval. Until 70 days, there was no significant change in the current response, but after 70 days, an 11.8% decrease in the current response was observed. Hence, the developed MIP sensor was stable for up to 70 days. The developed sensor showed good selectivity, stability, and low LoD with better sensitivity compared to the other reported sensors for CPF detection, as listed in Table 1.
Table 1. Comparison of the Present Work with Previously Reported Literaturea.
| S. No. | sensing platform | detection technique | LOD (M) | linear range (M) | reference |
|---|---|---|---|---|---|
| 1 | (a) PATP/GCE | electrochemical | (a) 3.3 × 10⁻⁷ | (a) 5 × 10⁻⁷ to 1 × 10⁻⁷ | (25) |
| (b) PATP/Au NPs/GCE | CV | (b) 2.5 × 10⁻⁵ | (b) 5 × 10⁻⁵ to 1 × 10⁻⁴ | ||
| 2 | PPy/PGE | electrochemical | 1.28 × 10⁻⁸ | 5.7 × 10⁻⁸ to 8.56 × 10⁻⁷ | (47) |
| EIS | |||||
| 3 | Ab/protein A/Au NPs/PDDA/Au IDAM | electrochemical | 1.43 × 10⁻⁹ | 1.43 × 10⁻⁹ to 1.43 × 10⁻⁶ | (50) |
| EIS | |||||
| 4 | BSA/antigen/CO3O4/PANi/ITO | electrochemical | 2.85 × 10⁻⁸ | 0 to 2.85 × 10⁻⁵ | (51) |
| CV | |||||
| 5 | aptamer/AMP/CuO NFs-SWCNTs/Nafion/GCE | electrochemical | 2 × 10⁻¹⁰ | 2.85 × 10⁻¹⁰ to 4.28 × 10⁻⁷ | (52) |
| DPV | |||||
| 6 | BSA/aptamer/GO@Fe3O4/CB-CS/GCE | electrochemical | 9.41 × 10⁻¹¹ | 2.85 × 10⁻¹⁰ to 2.85 × 10⁻⁴ | (53) |
| CV | |||||
| 7 | IrOx NPs/PPy | electrochromism | 1 × 10–13 | 1 × 10–13 to 1 × 10⁻³ | (54) |
| 8 | dopamine | SPR | 7.60 × 10⁻¹⁰ | 1 × 10⁻⁹ to 1 × 10⁻⁵ | (55) |
| 9 | PPy/Au-μE | electrochemical (a) DPV | 0.93 × 10⁻¹⁵ | 1 × 10⁻⁶ to 1 × 10–15 | present work |
PATP:polyaminithiophenol, Au NPs: gold nanoparticles, GCE: glassy carbon electrode, PPy: polypyrrole, PGE: pencil graphite electrode, Ab: antibody, PDDA: poly(dially dimethyl ammonium chloride), Au IDAM: gold-interdigitized array microelectrode, BSA: bovine serum albumin, PANi: polyaniline, ITO: indium tin oxide, AMP: amino-modified capture probe, CuO NFs: copper oxide nanoflowers, SWCNTs: single-walled carbon nanotubes, GO: graphene oxide, CB: carbon black, CS: chitosan, IrOx NPs: iridium oxide nanoparticles.
The vegetable and fruit juice samples (cucumber and pomegranate) were spiked with a known amount of CPF and tested by the developed sensor. The % recovery was calculated, as shown in Table 1. It was observed that the % recovery was between 91 and 97% with RSD below 5%, which indicates the applicability of the developed sensor in real sample testing.
Conclusions
A facile electrochemically synthesized MIP sensor using PPy as the matrix for the selective and sensitive detection of CPF was fabricated onto Au-μE. The linear detection range was found to be 1 fM to 1 μM and the present sensor showed good selectivity and stability for up to 70 days and a low LOD of about 0.93 fM with a sensitivity of 3.98 μA/(μM)/mm2. This highly selective sensor requires only 2 μL of the sample with a shelf life of over 2 months and has the potential to be integrated with portable electronics in the future. The sensor showed good % recovery with real samples, which will add advantage and possibility of using this sensor for on-field testing. The overall analytical sensing performance of the present sensor and low-cost development showed a huge capability of commercialization for real-time monitoring of OPs in the food chain.
Experimental Section
Materials
Chlorpyrifos (CPF) and pyrrole (py) were bought from Sigma-Aldrich. Sodium chloride (NaCl), monobasic (NaH2PO4·2H2O), dibasic (Na2HPO4), potassium ferri hexacyanide K3[Fe(CN)6], potassium ferro hexacyanide K4[Fe(CN)6], sodium acetate, and acetic acid were purchased from Fisher Scientific. Ethanol was purchased from Merck. Throughout the experiments, Milli-Q deionized (DI) water (18.2 MΩ resistance) and analytical grade chemicals were utilized. Thin-film gold microelectrodes (μE) and a microfluidic cell platform (sample consumption of about 2–10 μL) were purchased from Micrux Technologies Ltd. Spain. The overall dimension of the μE was 10 × 6 × 0.75 mm3 and the radius of the working electrode is 0.5 mm. All electrochemical experiments were performed in phosphate-buffered saline (PBS) (0.1 M, pH 7) containing 5 mM redox probe (ferri–ferro couple (K3[Fe(CN)6]–K4[Fe(CN)6])). Au-μEs were cleaned by sonication for 5 min in acetone and 5 min in DI water prior to use.
Instruments
The surface morphology of the as-fabricated electrode was probed using a FE-SEM Tescan MIRA II Oxford INCA PantaFETx3. The surface roughness studies probed by AFM were carried out using a Multimode IIIa scanning probe microscope from Bruker in tapping mode with RTESP tips with a radius of curvature of ∼10 nm. FTIR spectra were obtained using a Frontier PerkinElmer. Electrochemical analysis was carried out using a potentiostat/galvanostat (Multiautolab (MA204), Autolab, The Netherlands). The electrochemical deposition was carried out in a mini electrochemical cell using a three-electrode setup: platinum counter electrode, Ag/AgCl (3 M KCl) reference electrode, and Au-μE working electrode.
Fabrication of Electrodeposited NIP and MIP onto Au-μE
The schematic of the stepwise fabrication of MIP onto Au-μEs is shown in Figure 1. For electrodeposition of NIP and MIP, 5 mM acetate buffer (AB) was used as the electrolyte. The MIP was fabricated in two steps: first, a solution containing 1 mM py and 3 mM template molecules (CPF) was prepared in 5 mM AB, and electrodeposition was performed in the potential window of −0.4 to +1.8 V up to 15 cycles at a fixed scan rate of 50 mV/s; second, CPF was removed or extracted from the PPy matrix by immersing the electrode for 8 min in a 50% v/v solution of ethanol and DI water. The nonimprinted polymer (NIP) was also synthesized by the aforementioned method without introducing the CPF molecules. Finally, both the NIP and MIP were washed with AB and dried at room temperature.
Preparation of Real Samples
Ten grams of cucumber and pomegranate were cut into pieces and crushed using a mortar and pestle. Ten milliliters of PBS was added to the crushed samples and centrifuged at 3000 rpm for 15 min.35 The supernatant was spiked with a known amount of CPF, and control samples were prepared without spiking CPF. These were used further for the real sample analysis by the developed sensor (Table 2).
Table 2. Real Sample Analysis by Spiking Known Concentration of CPF in Cucumber and Pomegranate Juice.
| sample | added (μM) | found (μM) | % recovery (% RSD, n = 3) |
|---|---|---|---|
| cucumber | 1 | 0.91 | 91 (5) |
| cucumber | 0.1 | 0.097 | 97 (1.6) |
| pomegranate | 1 | 0.93 | 93 (2.2) |
| pomegranate | 0.1 | 0.0953 | 95 (3.4) |
Acknowledgments
S.N., A.M., and L.M.B. are grateful for financial support from ICAR through NASF funded project NASF/Nano-5020/2016-17. The authors acknowledge IUAC user grant BTR 66502 for providing SEM and AFM characterization facilities.
Supporting Information Available
The Supporting Information is available free of charge at https://pubs.acs.org/doi/10.1021/acsomega.0c04436.
DPV response for optimization studies and the effect of the scan rate (PDF)
Author Present Address
△ A.M.: Department of Physics, School of Engineering, University of Petroleum and Energy Studies, Dehradun, Uttarakhand - 248007
Author Present Address
▲ S.W.: Department of Chemistry, School of Engineering, University of Petroleum and Energy Studies, Dehradun, Uttarakhand - 248007
Author Contributions
The manuscript was written through contributions of all authors. All authors have given approval to the final version of the manuscript.
S.K. acknowledges Recycling Lithium Ion Batteries for a Sustainable Technological and Economic Development (ReListed) DSTUKIERI-2018-19-008, Royal Society IES\R2\170272 and Royal Academy of Engineering for the funding support.
The authors declare no competing financial interest.
Supplementary Material
References
- Kumar S.; Kaushik G.; Villarreal-Chiu J. F. Scenario of Organophosphate Pollution and Toxicity in India: A Review. Environ. Sci. Pollut. Res. 2016, 23, 9480–9491. 10.1007/s11356-016-6294-0. [DOI] [PubMed] [Google Scholar]
- Van Dyk J. S.; Pletschke B. Review on the Use of Enzymes for the Detection of Organochlorine, Organophosphate and Carbamate Pesticides in the Environment. Chemosphere 2011, 82, 291–307. 10.1016/j.chemosphere.2010.10.033. [DOI] [PubMed] [Google Scholar]
- Melo J. S. Overview on Biosensors for Detection of Organophosphate Pesticides. Curr. Trends Biomed. Eng. Biosci. 2017, 5, 555663 10.19080/CTBEB.2017.05.555663. [DOI] [Google Scholar]
- Costa L. G. Organophosphorus Compounds at 80: Some Old and New Issues. Toxicol. Sci. 2018, 162, 24–35. 10.1093/toxsci/kfx266. [DOI] [PMC free article] [PubMed] [Google Scholar]
- Giyanwani P. R.; Zubair U.; Salam O.; Zubair Z. Respiratory Failure Following Organophosphate Poisoning: A Literature Review. Cureus 2017, 9, 3–9. 10.7759/cureus.1651. [DOI] [PMC free article] [PubMed] [Google Scholar]
- Hung D. Z.; Yang H. J.; Li Y. F.; Lin C. L.; Chang S. Y.; Sung F. C.; Tai S. C. W. The Long-Term Effects of Organophosphates Poisoning as a Risk Factor of CVDs: A Nationwide Population-Based Cohort Study. PLoS One 2015, 10, e0137632 10.1371/journal.pone.0137632. [DOI] [PMC free article] [PubMed] [Google Scholar]
- García-Reyes J. F.; Hernando M. D.; Ferrer C.; Molina-Díaz A.; Fernández-Alba A. R. Large Scale Pesticide Multiresidue Methods in Food Combining Liquid Chromatography - Time-of-Flight Mass Spectrometry and Tandem Mass Spectrometry. Anal. Chem. 2007, 79, 7308–7323. 10.1021/ac070855v. [DOI] [PubMed] [Google Scholar]
- Grimalt S.; Dehouck P. Review of Analytical Methods for the Determination of Pesticide Residues in Grapes. J. Chromatogr. A 2016, 1433, 1–23. 10.1016/j.chroma.2015.12.076. [DOI] [PubMed] [Google Scholar]
- Di Ottavio F.; Della Pelle F.; Montesano C.; Scarpone R.; Escarpa A.; Compagnone D.; Sergi M. Determination of Pesticides in Wheat Flour Using Microextraction on Packed Sorbent Coupled to Ultra-High Performance Liquid Chromatography and Tandem Mass Spectrometry. Food Anal. Methods 2017, 10, 1699–1708. 10.1007/s12161-016-0720-2. [DOI] [Google Scholar]
- Li X.; Cui H.; Zeng Z. A Simple Colorimetric and Fluorescent Sensor to Detect Organophosphate Pesticides Based on Adenosine Triphosphate-Modified Gold Nanoparticles. Sensors 2018, 18, 4302 10.3390/s18124302. [DOI] [PMC free article] [PubMed] [Google Scholar]
- Crapnell R. D.; Hudson A.; Foster C. W.; Eersels K.; Grinsven B.; Cleij T. J.; Banks C. E.; Peeters M. Recent Advances in Electrosynthesized Molecularly Imprinted Polymer Sensing Platforms for Bioanalyte Detection. Sensors 2019, 1204 10.3390/s19051204. [DOI] [PMC free article] [PubMed] [Google Scholar]
- Chen L.; Wang X.; Lu W.; Wu X.; Li J. Molecular Imprinting: Perspectives and Applications. Chem. Soc. Rev. 2016, 45, 2137–2211. 10.1039/C6CS00061D. [DOI] [PubMed] [Google Scholar]
- Vaneckova T.; Bezdekova J.; Tvrdonova M.; Vlcnovska M.; Novotna V.; Neuman J.; Stossova A.; Kanicky V.; Adam V.; Vaculovicova M.; et al. CdS Quantum Dots-Based Immunoassay Combined with Particle Imprinted Polymer Technology and Laser Ablation ICP-MS as a Versatile Tool for Protein Detection. Sci. Rep. 2019, 9, 11840 10.1038/s41598-019-48290-2. [DOI] [PMC free article] [PubMed] [Google Scholar]
- Feier B.; Blidar A.; Pusta A.; Carciuc P.; Cristea C. Electrochemical Sensor Based on Molecularly Imprinted Polymer for the Detection of Cefalexin. Biosensors 2019, 9, 31 10.3390/bios9010031. [DOI] [PMC free article] [PubMed] [Google Scholar]
- Selvolini G.; Marrazza G. MIP-Based Sensors: Promising New Tools for Cancer Biomarker Determination. Sensors 2017, 17, 718 10.3390/s17040718. [DOI] [PMC free article] [PubMed] [Google Scholar]
- Boulanouar S.; Mezzache S.; Combès A.; Pichon V. Molecularly Imprinted Polymers for the Determination of Organophosphorus Pesticides in Complex Samples. Talanta 2018, 465–478. 10.1016/j.talanta.2017.08.067. [DOI] [PubMed] [Google Scholar]
- Sroysee W.; Chunta S.; Amatatongchai M.; Lieberzeit P. A. Molecularly Imprinted Polymers to Detect Profenofos and Carbofuran Selectively with QCM Sensors. Phys. Med. 2019, 7, 100016 10.1016/j.phmed.2019.100016. [DOI] [Google Scholar]
- Guzzella L.; Casatta N.; Dahchour A.; Baggiani C.; Pozzoni F. Molecularly Imprinted Polymers for the Detection of Benomyl Residues in Water and Soil Samples. J. Environ. Sci. Health, Part B 2019, 54, 702–708. 10.1080/03601234.2018.1473970. [DOI] [PubMed] [Google Scholar]
- Zhang H.; Wang P.; Zhou Q.; Wang Y. A Novel Method for the Detection of Chlorpyrifos by Combining Quantum Dot-Labeled Molecularly Imprinted Polymer with Flow Cytometry. Anal. Lett. 2018, 51, 921–934. 10.1080/00032719.2017.1364744. [DOI] [Google Scholar]
- Feng S.; Hu Y.; Ma L.; Lu X. Development of Molecularly Imprinted Polymers-Surface-Enhanced Raman Spectroscopy/Colorimetric Dual Sensor for Determination of Chlorpyrifos in Apple Juice. Sens. Actuators, B 2017, 241, 750–757. 10.1016/j.snb.2016.10.131. [DOI] [Google Scholar]
- Kadirsoy S.; Atar N.; Yola M. L. Molecularly Imprinted QCM Sensor Based on Delaminated MXene for Chlorpyrifos Detection and QCM Sensor Validation. New J. Chem. 2020, 44, 6524–6532. 10.1039/D0NJ00951B. [DOI] [Google Scholar]
- Pérez-Moral N.; Mayes A. G. Comparative Study of Imprinted Polymer Particles Prepared by Different Polymerisation Methods. Anal. Chim. Acta 2004, 504, 15–21. 10.1016/S0003-2670(03)00533-6. [DOI] [Google Scholar]
- Bakhtiar S.; Bhawani S. A.; Shafqat S. R. Synthesis and Characterization of Molecular Imprinting Polymer for the Removal of 2-Phenylphenol from Spiked Blood Serum and River Water. Chem. Biol. Technol. Agric. 2019, 6, 15 10.1186/s40538-019-0152-5. [DOI] [Google Scholar]
- Rangel P. X. M.; Laclef S.; Xu J.; Panagiotopoulou M.; Kovensky J.; Tse Sum Bui B.; Haupt K. Solid-Phase Synthesis of Molecularly Imprinted Polymer Nanolabels: Affinity Tools for Cellular Bioimaging of Glycans. Sci. Rep. 2019, 9, 3923 10.1038/s41598-019-40348-5. [DOI] [PMC free article] [PubMed] [Google Scholar]
- Xie C.; Li H.; Li S.; Wu J.; Zhang Z. Surface Molecular Self-Assembly for Organophosphate Pesticide Imprinting in Electropolymerized Poly(p-Aminothiophenol) Membranes on a Gold Nanoparticle Modified Glassy Carbon Electrode. Anal. Chem. 2010, 82, 241–249. 10.1021/ac901860t. [DOI] [PubMed] [Google Scholar]
- Liu Y.; Wei M.; Hu Y.; Zhu L.; Du J. An Electrochemical Sensor Based on a Molecularly Imprinted Polymer for Determination of Anticancer Drug Mitoxantrone. Sens. Actuators, B 2018, 255, 544–551. 10.1016/j.snb.2017.08.023. [DOI] [Google Scholar]
- Nagabooshanam S.; John A. T.; Wadhwa S.; Mathur A.; Krishnamurthy S.; Bharadwaj L. M. Electro-Deposited Nano-Webbed Structures Based on Polyaniline/Multi Walled Carbon Nanotubes for Enzymatic Detection of Organophosphates. Food Chem. 2020, 323, 126784 10.1016/j.foodchem.2020.126784. [DOI] [PubMed] [Google Scholar]
- Schirhagl R. Bioapplications for Molecularly Imprinted Polymers. Anal. Chem. 2014, 86, 250–261. 10.1021/ac401251j. [DOI] [PubMed] [Google Scholar]
- Ahmad A. L.; Fahanis N.; Lah C.; Low S. C. Molecular Imprinted Polymer for Atrazine Detection Sensor: Preliminary Study. Chem. Eng. Trans. 2015, 45, 1483–1488. 10.3303/CET1545248. [DOI] [Google Scholar]
- Weerathunge P.; Ramanathan R.; Shukla R.; Sharma T. K.; Bansal V. Aptamer-Controlled Reversible Inhibition of Gold Nanozyme Activity for Pesticide Sensing. Anal. Chem. 2014, 86, 11937–11941. 10.1021/ac5028726. [DOI] [PubMed] [Google Scholar]
- Li R.; Feng Y.; Pan G.; Liu L. Advances in Molecularly Imprinting Technology for Bioanalytical Applications. Sensors 2019, 19, 177 10.3390/s19010177. [DOI] [PMC free article] [PubMed] [Google Scholar]
- Zhu C.; Yang G.; Li H.; Du D.; Lin Y. Electrochemical Sensors and Biosensors Based on Nanomaterials and Nanostructures. Anal. Chem. 2015, 87, 230–249. 10.1021/ac5039863. [DOI] [PMC free article] [PubMed] [Google Scholar]
- Kozitsina A. N.; Svalova T. S.; Malysheva N. N.; Okhokhonin A. V.; Vidrevich M. B.; Brainina K. Z. Sensors Based on Bio and Biomimetic Receptors in Medical Diagnostic, Environment, and Food Analysis. Biosensors 2018, 8, 35 10.3390/bios8020035. [DOI] [PMC free article] [PubMed] [Google Scholar]
- Saini S. S.; Kaur A. Molecularly Imprinted Polymers for the Detection of Food Toxins: A Minireview. Adv. Nanopart. 2013, 02, 60–65. 10.4236/anp.2013.21011. [DOI] [Google Scholar]
- Nagabooshanam S.; Roy S.; Mathur A.; Mukherjee I.; Krishnamurthy S.; Bharadwaj L. M. Electrochemical Micro Analytical Device Interfaced with Portable Potentiostat for Rapid Detection of Chlorpyrifos Using Acetylcholinesterase Conjugated Metal Organic Framework Using Internet of Things. Sci. Rep. 2019, 9, 19862 10.1038/s41598-019-56510-y. [DOI] [PMC free article] [PubMed] [Google Scholar]
- Özcan L.; Şahin Y. Determination of Paracetamol Based on Electropolymerized-Molecularly Imprinted Polypyrrole Modified Pencil Graphite Electrode. Sens. Actuators, B 2007, 127, 362–369. 10.1016/j.snb.2007.04.034. [DOI] [Google Scholar]
- Ermiş N.; Tinkiliç N. Preparation of Molecularly Imprinted Polypyrrole Modified Gold Electrode for Determination of Tyrosine in Biological Samples. Int. J. Electrochem. Sci. 2018, 13, 2286–2298. 10.20964/2018.03.29. [DOI] [Google Scholar]
- Fremielle Lim K.; Holdsworth C. I. Effect of Formulation on the Binding Efficiency and Selectivity of Precipitation Molecularly Imprinted Polymers. Molecules 2018, 23, 2996 10.3390/molecules23112996. [DOI] [PMC free article] [PubMed] [Google Scholar]
- Lorenzo R. A.; Carro A. M.; Alvarez-Lorenzo C.; Concheiro A. To Remove or Not to Remove? The Challenge of Extracting the Template to Make the Cavities Available in Molecularly Imprinted Polymers (MIPs). Int. J. Mol. Sci. 2011, 12, 4327–4347. 10.3390/ijms12074327. [DOI] [PMC free article] [PubMed] [Google Scholar]
- Shi H.; Zhao G.; Liu M.; Zhu Z. A Novel Photoelectrochemical Sensor Based on Molecularly Imprinted Polymer Modified TiO2 Nanotubes and Its Highly Selective Detection of 2,4-Dichlorophenoxyacetic Acid. Electrochem. Commun. 2011, 13, 1404–1407. 10.1016/j.elecom.2011.08.022. [DOI] [Google Scholar]
- Yussuf A.; Al-Saleh M.; Al-Enezi S.; Abraham G. Synthesis and Characterization of Conductive Polypyrrole: The Influence of the Oxidants and Monomer on the Electrical, Thermal, and Morphological Properties. Int. J. Polym. Sci. 2018, 4191747 10.1155/2018/4191747. [DOI] [Google Scholar]
- Arora K.; Chaubey A.; Singhal R.; Singh R. P.; Pandey M. K.; Samanta S. B.; Malhotra B. D.; Chand S. Application of Electrochemically Prepared Polypyrrole-Polyvinyl Sulphonate Films to DNA Biosensor. Biosens. Bioelectron. 2006, 21, 1777–1783. 10.1016/j.bios.2005.09.002. [DOI] [PubMed] [Google Scholar]
- Tang X.; Raskin J. P.; Lahem D.; Krumpmann A.; Decroly A.; Debliquy M. A Formaldehyde Sensor Based on Molecularly-Imprinted Polymer on a TiO2 Nanotube Array. Sensors 2017, 17, 675 10.3390/s17040675. [DOI] [PMC free article] [PubMed] [Google Scholar]
- Armenta S.; Quint G.; Garrigues S.; de la Guardia M. A Validated and Fast Procedure for FTIR Determination of Cypermethrin and Chlorpyrifos. Talanta 2005, 67, 634–639. 10.1016/j.talanta.2005.03.008. [DOI] [PubMed] [Google Scholar]
- Saumya V.; Prathish K. P.; Rao T. P. In Situ Copper Oxide Modified Molecularly Imprinted Polypyrrole Film Based Voltammetric Sensor for Selective Recognition of Tyrosine. Talanta 2011, 85, 1056–1062. 10.1016/j.talanta.2011.05.025. [DOI] [PubMed] [Google Scholar]
- Alhans R.; Singh A.; Singhal C.; Narang J.; Wadhwa S.; Mathur A. Comparative Analysis of Single-Walled and Multi-Walled Carbon Nanotubes for Electrochemical Sensing of Glucose on Gold Printed Circuit Boards. Mater. Sci. Eng., C 2018, 90, 273–279. 10.1016/j.msec.2018.04.072. [DOI] [PubMed] [Google Scholar]
- Uygun Z. O.; Dilgin Y. A Novel Impedimetric Sensor Based on Molecularly Imprinted Polypyrrole Modified Pencil Graphite Electrode for Trace Level Determination of Chlorpyrifos. Sens. Actuators, B 2013, 188, 78–84. 10.1016/j.snb.2013.06.075. [DOI] [Google Scholar]
- Katz E.; Willner I. Probing Biomolecular Interactions at Conductive and Semiconductive Surfaces by Impedance Spectroscopy: Routes to Impedimetric Immunosensors, DNA-Sensors, and Enzyme Biosensors. Electroanalysis 2003, 15, 913–947. 10.1002/elan.200390114. [DOI] [Google Scholar]
- Roy S.; John A.; Nagabooshanam S.; Mishra A.; Wadhwa S.; Mathur A.; Narang J.; Singh J.; Dilawar N.; Davis J. Self-Aligned TiO2 - Photo Reduced Graphene Oxide Hybrid Surface for Smart Bandage Application. Appl. Surf. Sci. 2019, 488, 261–268. 10.1016/j.apsusc.2019.05.261. [DOI] [Google Scholar]
- Jia H.; Guo Y.; Sun X.; Wang X. An Electrochemical Immunosensor Based on Microfluidic Chip for Detection of Chlorpyrifos. Int. J. Electrochem. Sci. 2015, 10, 8750–8758. [Google Scholar]
- Wang W. H.; Han Z. J.; Liang P. J.; Guo D. Q.; Xiang Y. J.; Tian M. X.; Song Z. L.; Zhao H. R. Co3O4/PAn Magnetic Nanoparticle-Modified Electrochemical Immunosensor for Chlorpyrifos. Dig. J. Nanomater. Biostructures 2017, 12, 1–9. [Google Scholar]
- Xu G.; Huo D.; Hou C.; Zhao Y.; Bao J.; Yang M.; Fa H. A Regenerative and Selective Electrochemical Aptasensor Based on Copper Oxide Nanoflowers-Single Walled Carbon Nanotubes Nanocomposite for Chlorpyrifos Detection. Talanta 2018, 178, 1046–1052. 10.1016/j.talanta.2017.08.086. [DOI] [PubMed] [Google Scholar]
- Jiao Y.; Hou W.; Fu J.; Guo Y.; Sun X.; Wang X.; Zhao J. A Nanostructured Electrochemical Aptasensor for Highly Sensitive Detection of Chlorpyrifos. Sens. Actuators, B 2017, 243, 1164–1170. 10.1016/j.snb.2016.12.106. [DOI] [Google Scholar]
- Capoferri D.; Álvarez-Diduk R.; Del Carlo M.; Compagnone D.; Merkoçi A. Electrochromic Molecular Imprinting Sensor for Visual and Smartphone-Based Detections. Anal. Chem. 2018, 90, 5850–5856. 10.1021/acs.analchem.8b00389. [DOI] [PubMed] [Google Scholar]
- Yao G. H.; Liang R. P.; Huang C. F.; Wang Y.; Qiu J. D. Surface Plasmon Resonance Sensor Based on Magnetic Molecularly Imprinted Polymers Amplification for Pesticide Recognition. Anal. Chem. 2013, 85, 11944–11951. 10.1021/ac402848x. [DOI] [PubMed] [Google Scholar]
Associated Data
This section collects any data citations, data availability statements, or supplementary materials included in this article.


