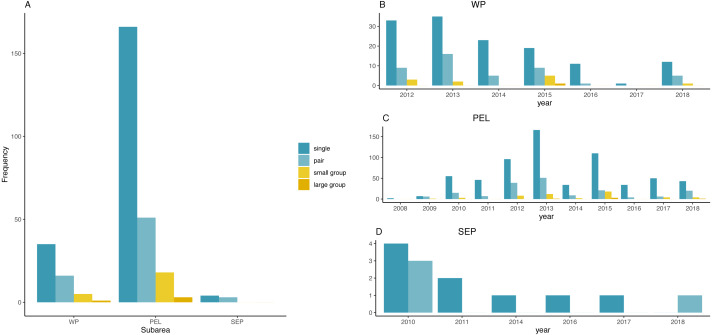
Figure 3. Frequency distribution of fin whale group sizes among sub-areas and per year.
(A) Frequency distribution of fin whales group sizes among sub-areas. (B) Frequency distribution of group sizes among years in the WP sub-area. (C) Frequency distribution of group sizes among years in the PEL sub-area. (D) Frequency distribution of group sizes among years in the SEP sub-area.

