

Abstract
Enzyme linked immunosorbent assays (ELISA) for the detection of soluble epoxide hydrolase (sEH), a key enzyme in the metabolism of fatty acids and a biomarker, may increasingly represent an important diagnostic tool. However, there is a lack of ELISA for mouse sEH quantification, thus resulting in a bottleneck in understanding the pathogenesis of many diseases related to sEH based on mouse models. In this work, nanobodies recognizing mouse sEH were obtained through re-biopanning against mouse sEH in the previous phage display library of human sEH. Later, we developed four ELISAs involving a combination of anti-mouse sEH polyclonal antibody (pAb) and nanobody. It was found that the double antibodies worked as dual filters and had a huge impact on both the sensitivity and selectivity of sandwich immunoassays. The switch of anti-human sEH pAb to anti-mouse sEH pAb led to over 100-fold increase in sensitivity and dramatic decrease of LOD to pg/mL range in format B (pAb/biotin-VHH/SA-PolyHRP). Moreover, we found the four sandwich ELISAs might demonstrate excellent selectivity to mouse sEH even though antibodies alone showing significant cross-reactivity to the matrix were used, indicating the enhanced selectivity of double antibodies as dual filters. Eventually, the ELISA (format B) was successfully used to measure the mouse sEH level in cancer cells with ultralow abundance for the first time. The ELISAs proposed here represents a sensitive tool for tracking the sEH in various biological processes and also provides deep insights for developing sandwich immunoassay against various targets in terms of both sensitivity and selectivity.
Keywords: mouse sEH, nanobody, sandwich ELISA, selectivity, double antibodies, dual filter effect
Graphical Abstract

INTRODUCTION
Soluble epoxide hydrolase (sEH) is a 125 kDa dimer composed of two identical 62.5 kDa monomers and broadly distributed in multiple mammal tissues. It can metabolize many epoxy fatty acids (EpFAs) with potent anti-inflammatory properties, e.g., epoxyeicosatrienoic acids (EETs) and epoxydocosapentaenoic acids (EDPs), into their corresponding diols.1 The inhibition of sEH can enhance the beneficial anti-inflammatory effects of EETs, and sEH therefore has become a potential pharmacological target for treating hypertension, vascular inflammation, cancer, pain and multiple cardiovascular related diseases involving inflammation.1–4 A recent study by Ren et al.5 reveals that sEH plays a key role in inflammation associated with the pathogenesis of Parkinson’s disease (PD), further suggesting its feasibility of sEH as a biomarker for PD just as for other diseases.6 Thus, detection of sEH may represent an important diagnostic tool for health. The pathogenesis of many diseases related to sEH have been and continue to be studied based on mouse models. Currently, the most used methods for sEH detection include the activity based radioactive (detectability of~50 ng/mL) or fluorometric (detectability of ~10 ng/mL) assays and the antibody based Western blotting (WB, detectability of ~1 ng).7,8 However, the radioactive assay has drawbacks due to radiations of health and safety for personnel, high cost, and commercial unavailability of substrate. The fluorometric assay has high background from substrate hydrolysis and is not applicable to tissue extracts.8 WB is semiquantitative, time-consuming, and only moderately in sensitive. It also has the limitations of high technical demand and large inter-operator variability.9 Thus, excellent detection methods for mouse sEH, other than activity based assays and WB, are needed.
Enzyme linked immunosorbent assay (ELISA) has been widely employed to detect numerous analytes due to its overwhelming advantages in sensitivity, speed, simplicity, cost, throughput and safety.10–15 It is also promising for the analysis of mouse sEH. The essential key for a good ELISA is the availability of good antibodies, which majorly determine the sensitivity and specificity of the assay. A nanobody (also termed VHH), is a single domain antibody recombinantly derived from heavy-chain-only antibodies in camelids or cartilaginous fish.16,17 It is increasingly attractive and has been used in various immunoassays due to its small size (~15 kDa), monoclonal nature, thermostability, genetic manipulability, and capacity for continuous manufacture.18–23 In our previous work, we developed nanobody based immunoassays for the detection of human sEH.18,24 However, these immunoassays were highly selective for human sEH and did not effectively recognize the sEH from other species. The development of ELISAs against mouse sEH was therefore pursued given the central role of murine models in in vivo experiments.
The initial purpose of this study was to obtain nanobodies recognizing the mouse sEH through re-biopanning the existing phage display library of human sEH against the new analyte and then develop immunoassays based on these nanobodies. However, the switch of capture antibody resulting in unexpected dramatic increase of sensitivity and the sandwich ELISAs demonstrating no recognition to potential interferences which the antibodies alone showed significant cross-reactivity to, highlighted the dual filter effect of double antibodies. Although the sandwich immunoassay was first developed decades ago in 197325 and its advantage in sensitivity over competitive immunoassay is well recognized, its theoretical enhanced selectivity was rarely confirmed with exact experimental data. Using the mouse sEH as the model analyte, we developed four formats of sandwich ELISAs involving double antibodies in combination of pAb/pAb (format A), pAb/nanobody (format B and C), and nanobody/nanobody (format D), as illustrated in Figure 1. The dual filter effect of the double antibodies were highlighted in terms of sensitivity and selectivity of these four ELISAs. The validation completed on the matrix effect and analysis of mouse cancer cells further indicated the success of the immunoassays.
Figure 1.

Schematic comparison of four different sandwich ELISA formats for mouse sEH detection. (a) format A (pAb/biotin-pAb/SA-PolyHRP); (b) format B (pAb/biotin-VHH/SA-PolyHRP); (c) format C (pAb/HRP-VHH); (d) format D (SA/biotin-VHH/HRP-VHH). Switch of detection antibody from biotin-pAb (format A) to biotin-VHH generates format B; switch of detection antibody plus tracer (format A and B) to HRP-VHH results in format C; switch of capture pAb (format C) to streptavidin bridge plus biotin-VHH leads to format D.
EXPERIMENTAL SECTION
Materials
Recombinant mouse sEH, protein A column affinity purified rabbit anti-mouse sEH and anti-human sEH pAbs were produced by our laboratory as described elsewhere.24,26,27 Sodium periodate, horseradish peroxidase (HRP), streptavidin, bovine serum albumin (BSA), and Sulfo-NHS-LC-biotin were bought from Sigma-Aldrich. High-binding microplates (Nunc Maxisorp, Cat. No. 442404) were purchased from Thermo Fisher Scientific Inc. Streptavidin-PolyHRP40 conjugate (SA-PolyHRP) was purchased from Fitzgerald Industries International (Concord, MA).
Re-biopanning of Phage Anti-mouse sEH VHH Clones
The existing phage display library of human sEH was re-biopanned against the mouse sEH following our previous work24 but using the sEH from mouse instead of human. Briefly, mouse sEH was first biotinylated and then bound to streptavidin-coated magnetic beads (Pierce). The resultant beads prewashed (10 μL, 16 μM) and the phage VHH library (100 μL, 1013 PFU/mL) were added to the same microwell pre-blocked with 0.01 M phosphate buffer (pH 7.4) containing 2% BSA (PBB). After incubation, the beads were washed five times with PBB (300 μL). Then the bound phages were eluted through addition of glycine-HCl buffer (pH 2.2). The eluted phages were reamplifed and used again on the next round of panning. After four rounds of panning in the same manner but with gradually decreased concentrations of mouse sEH (16, 16, 8, and 4 μM), positive clones were identified through the phage ELISA and then sequenced. Nine anti-mouse sEH VHH phage clones (3A2, 3C1, 3C5, 3C9, 4C3, 4C7, 4C10, 4C11, and 4C14) with different amino acid sequences were obtained as illustrated in Figure S1. The corresponding nanobodies were later expressed in E. coli and purified against their 6xHis-tag.
Biotinylation of Antibodies and Preparation of HRP-nanobody Conjugate (HRP-4C3)
Antibodies were biotinylated through amine coupling according to our previous work.18 Briefly, fresh Sulfo-NHS-LC-Biotin (10 mg/mL in PBS of pH 7.4) was rapidly added to anti-mouse sEH pAb and nanobodies at a molar ratio of 20:1 and 10:1, respectively. After 1 h reaction at room temperature (RT) with gentle shaking, free biotin was removed through extensive dialysis (MWCO 3K) at 4 °C. The resultant biotinylated antibodies were stored in aliquots at −20 °C until use.
HRP labeled nanobody was prepared through periodate oxidation but in a mild condition (pH 5.4, 10 mM NaIO4, 30 min, ice bath) with high working concentration of HRP according to ref28. Briefly, 10 μL 260 mM stocking NaIO4 was premixed with 130 μL 0.2 M acetate buffer (pH 5.4). Seventy microliter of the resultant mixture was added to 60 μL 20 mg/mL HRP in MilliQ water, followed by the immediate color change of HRP from brownish to green due to NaIO4 oxidation. The oxidation was allowed to proceed for 30 min on an ice bath in the dark with shaking (100 rpm) and then quenched through a Zeba spin desalting column (7K MWCO). Nanobody was then added to the periodate-oxidized HRP at a molar ratio of 1:1 with the pH adjusted to alkaline range using sodium carbonate buffer (pH 9.5). After 2 h coupling in the dark at RT with shaking (600 rpm), the unstable Schiff base formed was further reduced to secondary amine with sodium cyanoborohydride (Caution: cyanoborohydride is very toxic and should be used in a fume hood). The unreacted aldehyde sites were then blocked with glycine. The resultant conjugate mixture was further separated on FPLC with NGC chromatography system plus Enrich SEC 650 (10/300 mm) column from Bio-Rad. The fractions before the HRP fraction peak were collected, concentrated, and stored in 50% glycerol/PBS at −20 °C until use. The HRP labeled nanobody conjugate (HRP-VHH) obtained in this way is free of unbound HRP and unbound nanobody. It may produce high signal-to-noise ratio as a detection antibody.
Test of Nanobody Performance Using Different pAb as Capture Antibody in Format B
Anti-human sEH pAb or anti-mouse sEH pAb was coated at 2.5 μg/mL in 0.05 M pH 9.6 carbonate-bicarbonate buffer (CB) overnight at 4 °C on high-binding Nunc ™ microplate (100 μL/well). After washing, 250 μL 3% (w/v) skim milk/PBS was used to block each well for 1 h.. After another washing, serial concentrations of mouse sEH calibrators in the standard diluent (PBS containing 0.1 mg/mL BSA) were then added to the plate (100 μL/well), followed by immediate addition of biotinylated nanobodies (biotin-VHHs, 1 μg/mL, 100 μL/well) in PBS. The immunoreaction was allowed to last for 1 h. After washing, the tracer SA-PolyHRP was added (25 ng/mL, 100 μL/well) and incubated for 30 min. After the final washing, color development using TMB substrate (100 μL/well, recipe from ref28) was allowed to proceed for 15 min. The optical density (OD) was measured at 450 nm within 10 min after terminating the color development with 1 M sulfuric acid (100 μL/well). Unless otherwise stated, all incubations were conducted at room temperature with shaking (600 rpm) on a microplate shaker and each washing step included three washings with PBS containing 0.05% Tween-20 (PBST, 300 μL/well) using a plate washer.
Construction of Calibration Curves for Mouse sEH detection in Four ELISA Formats
As shown in Figure 1, four formats of sandwich ELISAs involving double antibodies in combination of pAb/pAb, pAb/nanobody, and nanobody/nanobody were performed. The three formats (A, C, and D) were run similarly to format B as aforementioned but with one or two steps different in each. For format A, biotinylated anti-mouse sEH pAb (biotin-pAb, 0.25 μg/mL) was used as the detection antibody. For format C and D, HRP labeled nanobody (HRP-4C3, 0.72 mg/mL) at 1:4000 dilution was used as the detection antibody with no need of secondary tracer. However, the format D adopted nanobody (3C1) instead of pAb as the capture antibody. This nanobody was first biotinylated and then immobilized on the polystyrene surface via a streptavidin bridge for good capture performance according to our previous finding18. The selection of the nanobody pair is detailed in Figure S4. The same reagents involved in these four formats were used from the same batch.
pAb Based Western Blot and Selectivity Test for Sandwich ELISAs
The selectivity of anti-mouse sEH pAb was characterized using the Western Blot against the liver tissues from sEH KO and WT mice. Brifely, proteins in the homogenates were separated through SDS-PAGE and transferred to a nitrocellulose membrane via a Trans-Blot Turbo Transfer System (Bio-Rad). The membrane was blocked with TBS containing 5% skim milk and 0.1% Tween-20 for 1 h at RT. After washing, anti-mouse sEH antiserum (1:5000) was added and incubated overnight at 4 °C. Then, the membrane was washed and later incubated with HRP-anti-rabbit IgG from Cell Signaling Technology at a 1:10,000 dilution in TBS containing 5% skim milk and 0.1% Tween-20 for 1 h at RT. After washing, the membrane was incubated with the Clarity™ Western ECL Substrate (Bio-Rad) and visualized using the a ChemiDoc Gel Image System from Bio-Rad. In addition, the selectivity of the four sandwich ELISAs were verified against eight tissues from sEH KO and WT mice, including scapular brown adipose tissue (BAT), epididymal white adipose tissue (WAT_Ep), inguinal white adipose tissue (WAT_Ig), liver, kidney, brain, heart, and the mesenchymal fat pad (MFP). All KO and WT tissues are taken from one KO mouse and one WT mouse, respectively; both mice are age matched and housed under the same conditions for the duration of the experiment. Briefly, these tissues were flash frozen post necropsy and stored at −80°C until the assay. For the assay, the tissues were weighed and homogenized in PBS buffer containing protease inhibitor and protein was quantified by BCA assay. The samples were then diluted 100-, 1000-, 10,000-, and 100,000-fold on the deep-well plate and added to the ELISA plates with multi-channel pipette. The other steps were the same as that in the four ELISAs above described.
Matrix Effects
Nanobody based ELISAs (format C and D) representing the pAb/nanobody and double nanobodies were chosen for the evaluation of the matrix effect. Hepatic cytosol samples from KO mice were tested based on a simple dilution protocol. Briefly, the hepatic cytosol samples were diluted with standard diluent to 1:100, 1:1000 and 1:10000. Afterwards, a series of mouse sEH were spiked into the assay buffer of standard diluent and the diluted matrixes. The resultant calibrators on different matrix were run in the ELISA of format C and D.
Analysis of Cancer Cells in vitro with Ultralow Expression of sEH
Eight different cancer cells were cultivated in vitro (~105 cells/mL), including Lewis lung cancer, T241 fibrosarcoma, B16F10 melanoma, 4T1 breast adenocarcinoma, E0771 breast adenocarcinoma, MC38 colon adenocarcinoma, CT26 colon adenocarcinoma, and ID8 ovarian adenocarcinoma. Eight samples of each kind from first batch (sample # 1–8) and four samples of E0771/ CT26 from second batch (sample # 9–12) were simultaneously analyzed using format C and B with higher sensitivity. Dilutions generating signals in the linear section of the calibration curves were employed to calculate the mouse sEH level in the samples.
RESULTS AND DISCUSSION
Performance Difference of Capture pAbs against Mouse sEH
Nine different nanobodies (3A2, 3C1, 3C5, 3C9, 4C3, 4C7, 4C10, 4C11, and 4C14) recognizing mouse sEH were obtained and their amino acid sequences are listed in Figure S1. The preliminary test was conducted in ELISA (format B) using those biotinylated nanobodies (1 μg/mL) as detection antibodies, rabbit anti-human sEH pAb (2.5 μg/mL) as capture antibody, and a potent PolyHRP based tracer (SA-PolyHRP, 25 ng/mL) as the tracer. As shown in Figure 2a, the nine nanobodies based ELISA demonstrated a sufficient OD in the range from 0 to 250 ng/mL of mouse sEH. This is however one order weaker than previous developed PolyHRP ELISA for human sEH.18 This gave us an early impression that the affinities of nine nanobodies against mouse sEH were likely poorer than that of the previous nanobodies against human sEH, considering the phage display library used was the one constructed using llama blood with human sEH immunized. To our surprise, the switch of capture Ab from anti-human sEH to anti-mouse sEH pAb (2.5 μg/mL) led to approximately 100-fold stronger signal responses (see Figure 2b and Table S1). This dramatic enhancement of sensitivity can be attributed to the increased affinity and avidity of polyclonal Ab obtained through immunization with mouse sEH instead of human sEH. This pAb possesed more antibody clones produced recognizing various epitopes of mouse sEH and the higher affinity to mouse sEH than human sEH by chance in that immunization. The surprising supersensitivity of ELISA in Figure 2b removed our initial illusion of the nine nanobodies against mouse sEH and further confirmed the importance of efficient capture antibody. However, the anti-mouse sEH pAb still has the issues of limited supply and potential high cross-reactivity to interferences. Considering the excellent capture capability of the anti-mouse sEH pAb, monoclonal nature and continuous supply of the nanobody, and difference of the tracer, hereby we developed four different ELISAs as illustrated in Figure 1 to compare and provide a comprehensive guideline for mouse sEH sandwich ELISA.
Figure 2.

Signal responses of nine re-biopanned nanobodies and A1 as detection antibody (1 μg/mL) after biotinylation and SA-PolyHRP (25 ng/mL) as the tracer for mouse sEH detection in format B using different affinity-purified pAb (2.5 μg/mL) as capture antibody: (a) rabbit anti-human sEH pAb and (b) anti-mouse sEH pAb. The inclusion of A1 will be discussed with Figure 4.
Comparison of Calibration Curves of Four Sandwich ELISA Formats
Comparison between pAb and nanobody is a compelling topic. However, it is hard to compare these two classes of antibodies, since the immune responses can vary significantly even in genetically identical immunized animals. Besides this, the chosen clones might show large difference in affinity depending on the employed screening techniques and the random effects in panning of nanobodies. Thus, it is difficult to draw conclusions for an overall comparison of these two classes of antibodies based on limited quantities of antibodies used. However, the comparison of sandwich ELISAs involving pAb and nanobody may still provide a reference for understanding these two classes of antibodies in immunoassay development. We tested four formats of sandwich ELISA for mouse sEH detection as illustrated in Figure 1. Each format has its feature and may vary in performance. Format A and B belongs to the indirect sandwich ELISA, which involves a step of adding a tracer after the detection antibody; while format C and D belongs to the direct sandwich ELISA with no need of an extra tracer due to the enzyme labeled detection antibody used. The latter saves one step in terms of reagent cost, labor, and time. Regarding comparison of different assays, both LOD and sensitivity are informative parameters, but we believe sensitivity (slope) is a much more robust index than the LOD as deeply discussed in our previous work.18,28 For format A-C, the optimal working concentration of capture pAb was found to be 2.5 μg/mL (data not shown) and used throughout this work. Format A employed biotinylated pAb as the detection antibody and SA-PolyHRP as the tracer. Its calibration curve demonstrated a sensitivity of 0.6145 OD•mL/ng and a limit of detection (LOD) of 23 pg/mL as shown in Figure 3a. Herein, sensitivity refers to slope and LOD is the calculated concentration corresponding to signal response of the blank plus three times of its standard deviation. The replacement of biotinylated pAb with biotinylated nanobody (biotin-4C3) leads to format B. Its calibration curve shown in Figure 3b gave a sensitivity of 3.7 OD•mL/ng and a LOD of 11.8 pg/mL. This sensitivity is 6-fold of that of format A. The enhancement can be attributed to the high working concentration (1 μg/mL) and thereby high molar quantities of the biotin-4C3. This is allowed by the low non-specific background likely resulting from the feature of VHH in excellent solubility and lack of Fc region, whereas the Fc-containing IgG normally only allows working concentration of sub μg/mL as detection antibody due to relatively severe non-specific adsorption. The switch of detection antibody plus tracer (format A and B) to HRP labeled nanobody leads to format C. HRP labeled nanobody (HRP-4C3) prepared in this work possessed an average of 3.1 nanobodies per HRP, as calculated from its adsorption at 280 nm and 403 nm. As shown in Figure 3c, format C generated a sensitivity of 0.4492 OD•mL/ng and a LOD of 50.5 pg/mL when the working concentration of HPR-4C3 was used in 1:4000. This sensitivity is still very high in immunoassay though it is almost one order of magnitude lower than that of format B. Moreover, the format C saved the secondary tracer step and the reagent cost, labor, and time involved. However, the formats(A-C) employed the pAb as capture antibody and thus might suffer from the limited supply of pAb. The switch of capture pAb (format C) to streptavidin bridge plus biotin-VHH leads to format D. This streptavidin bridged double nanobody ELISA is chosen according to our recent work18, which demonstrated this format was much more sensitive than the double nanobody ELISA with capture nanobody passively adsorbed. As shown in Figure 3d, the format D demonstrated a sensitivity of 0.0586 OD•mL/ng and a LOD of 212 pg/mL for mouse sEH detection. This sensitivity is merely 13% of format C using the same detection antibody. It again indicated the ultrahigh affinity or avidity of the anti-mouse sEH pAb used, for the previous capture anti-human sEH pAb described in ref28 in similar comparison for human sEH detection gave a 3.1-fold performance of streptavidin bridged capture nanobody. From the comparison, we can understand the capability of the capture antibody can make huge difference in the sensitivity of the sandwich immunoassay. The capture antibody worked as a filter and could retain the analyte to some extent for further formation of sandwich immunocomplex depending on its affinity. Also, the detection antibody and the tracer can influence the overall sensitivity of the immunoassay. The four formats in this work provided a portfolio of immunoassay with different sensitivity and antibody types.
Figure 3.
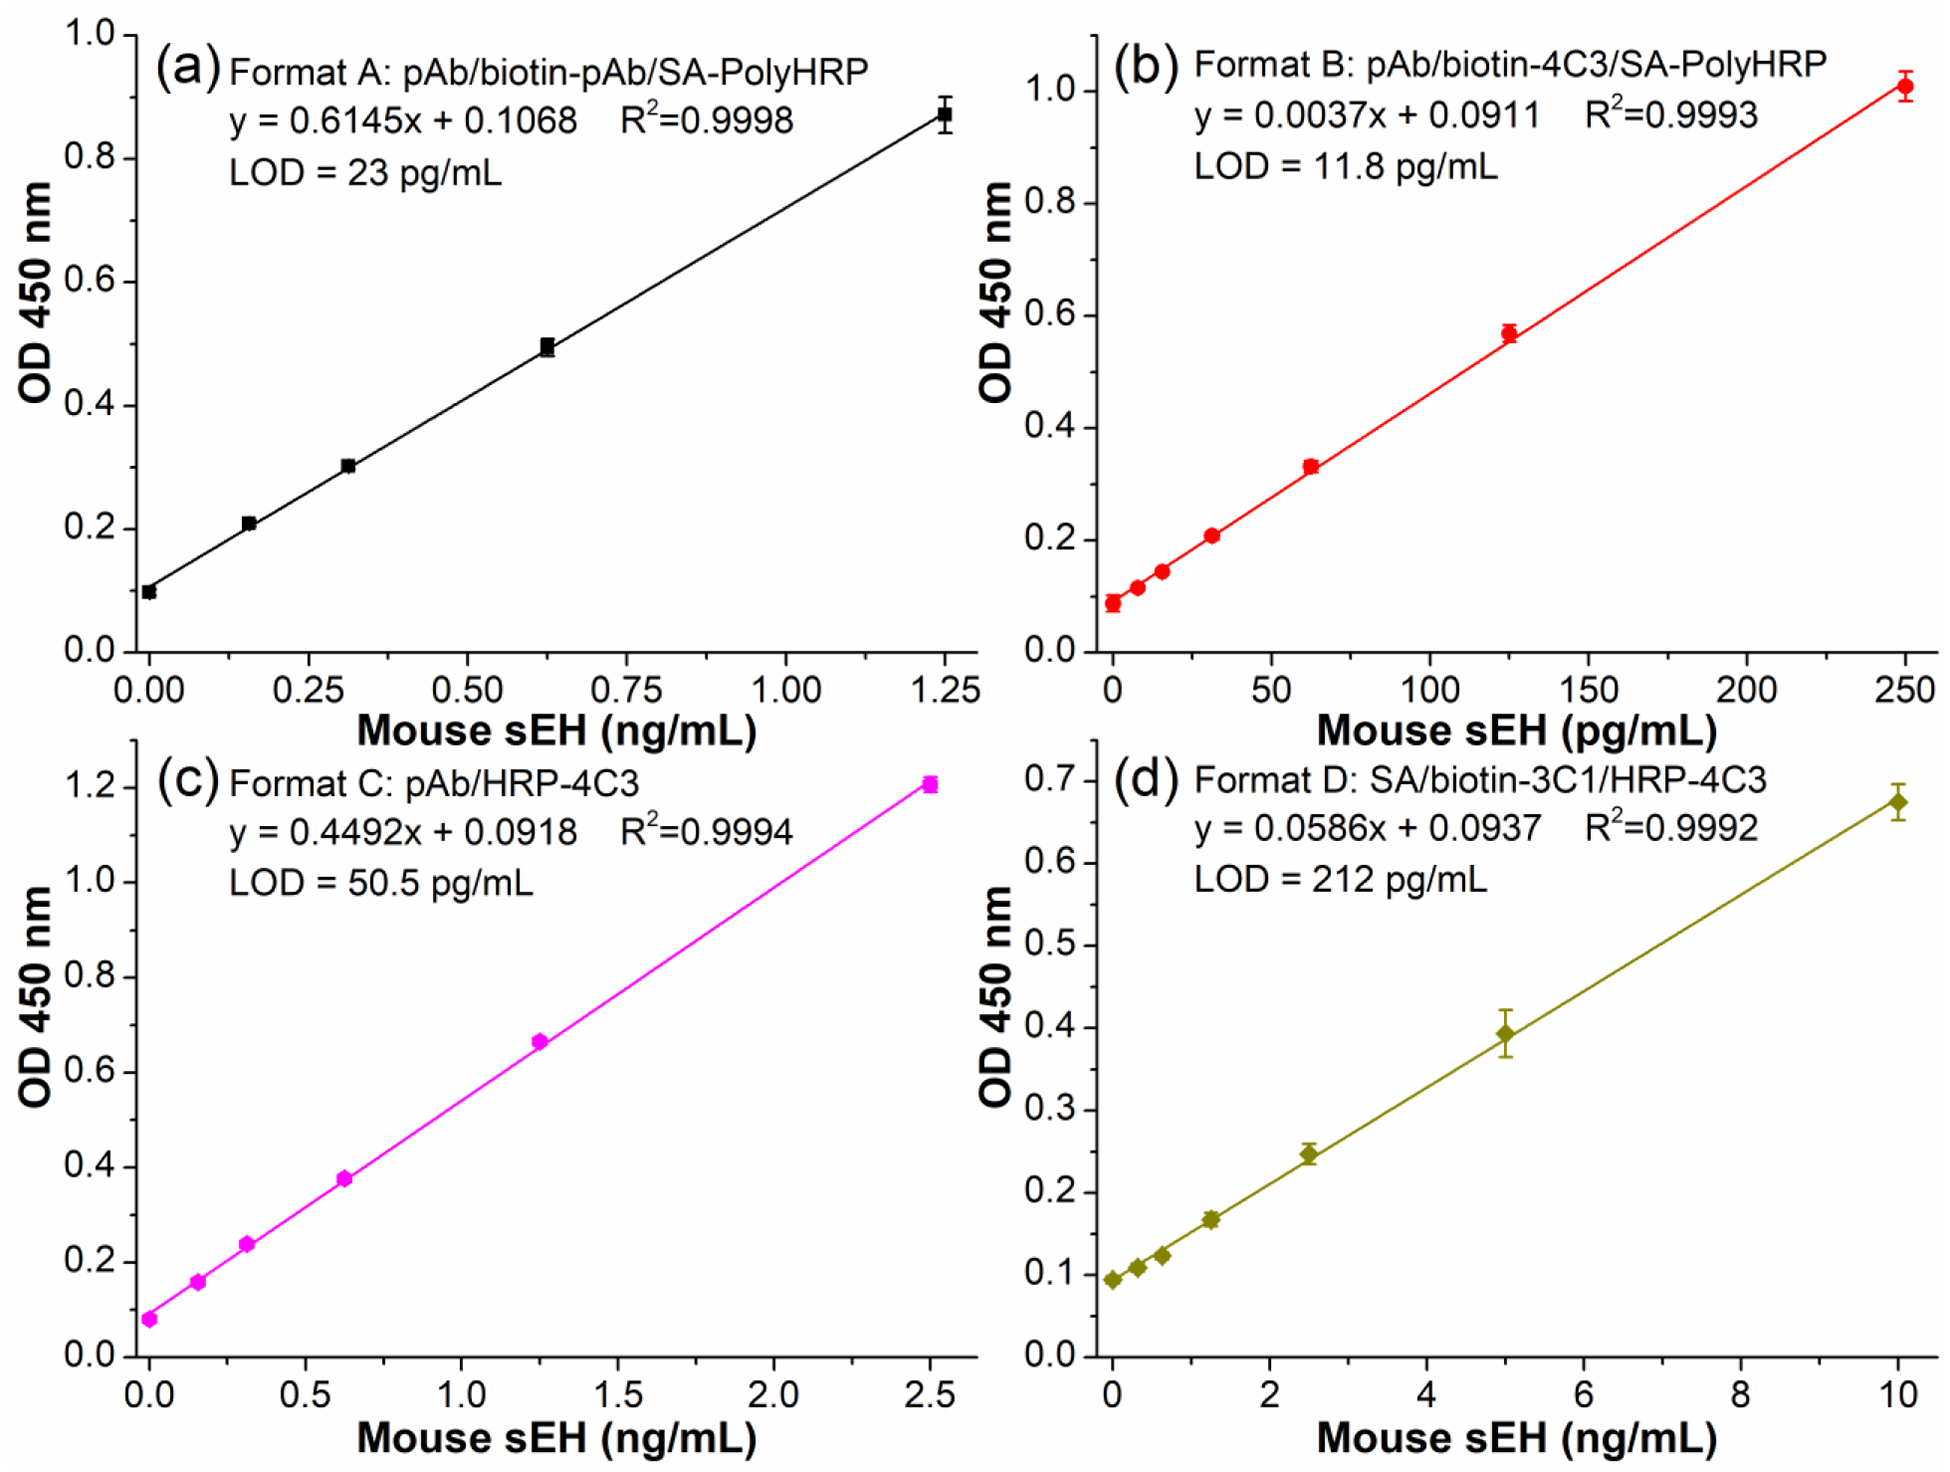
Calibration curves of four sandwich ELISA formats for mouse sEH detection. (a) format A, coating anti-mouse sEH pAb (2.5 μg/mL, 18 h), 3% SM blocking (1 h), biotin-pAb (0.25 μg/mL, 1 h), and SA-PolyHRP (25 ng/mL, 0.5 h); (b) format B, coating anti-mouse sEH pAb (2.5 μg/mL, 18 h), 3% SM blocking (1 h), biotin-4C3 (1 μg/mL, 1 h), and SA-PolyHRP (25 ng/mL, 0.5 h); (c) format C, coating anti-mouse sEH pAb (2.5 μg/mL, 18 h), 3% SM blocking (1 h), HRP-4C3 (1:4000, 1 h); (d) format D, coating streptavidin (2.5 μg/mL, 18 h), 2% BSA blocking (1 h), biotin-3C1 (1.25 μg/mL, 1 h), HRP-4C3 (1:4000, 1 h). TMB color development is 15 min for each format before stopping with 1 M H2SO4. Error bars indicate standard deviations (n = 3).
Antibody Recognition versus Immunoassay Selectivity
A good immunoassay should be able to distinguish the analyte from interferences, thus avoiding false positive results. Generally, recognition capability or selectivity of sandwich immunoassay is evaluated by the selectivity coefficient, a measure of its sensitivity for an interfering agent relative to that for the analyte. However, it is important to differentiate recognition capability of an antibody from that of an immunoassay. The recognition capability of an antibody can be measured with its specificity and selectivity, respectively defined by the number and the uniqueness of the epitope the antibody binds.29 When specificity is low, the antibody will recognize several different epitopes. The highest specificity is achieved when the antibody binds to only one epitope. Thus, monoclonal antibodies and nanobodies are inherently specific, and polyclonal antibodies are inherently less specific.29 However, there is no absolute correlation between specificity and selectivity. When antibody selectivity is low, the epitope is shared with other interferences. Selectivity increases when the epitope is unique for the analyte, while other interferences present will not be detected. As illustrated in Figure 4a, the anti-mouse sEH polyclonal antiserum showed cross-reactivity to several non-target protein bands in the denatured SDS-PAGE based Western blot for liver tissues of both sEH KO and WT mice. This indicates the existence of a shared epitope between sEH and other proteins in the matrix and thus the poor selectivity of this polyclonal antibody. The selectivity of the nine nanobodies were not determined by the Western Blot since the nanobodies did not recognize denatured antigen.
Figure 4.

Antibody recognition VS immunoassay selectivity. (a) The selectivity of anti-mouse sEH pAb against hepatic cytosol samples of sEH knockout (KO) and wild-type (WT) mice through Western Blot. (b) The selectivity of double pAb based ELISA (format A) against eight kinds of tissues from sEH KO and WT mice.
In literature, the measurement of immunoassay selectivity was always done by comparing the analyte with a group of analogs, some of which are even not included in the matrix of the real samples. An inherent limitation in this strategy is that the quality of selectivity may vary with the numbers of available potential interferences. Moreover, many unknown components in the real matrix cannot be evaluated. Thus, for evaluation of analyte of a protein, it is best to test the analyte-knockout matrix. In this work, eight tissues from a sEH KO mouse were collected and tested in sandwich ELISAs; also the corresponding tissues from WT mice were tested simultaneously as the positive controls. Interestingly, as shown in Figure 4b, the double pAb based ELISA (format A) did not generate signal responses to the KO tissues, while it demonstrated strong signal responses to the WT tissues. This indicates that format A recognizes nothing but sEH in these mouse tissues and thus the excellent selectivity of the assay. The only explanation for the high selectivity of this ELISA based on the poor selectivity of the pAb is that there was just one shared epitope between sEH and other interfering proteins in the matrix. When the interfering proteins were captured by the first antibody, they could not be bound to the second antibody for the formation of sandwich immunocomplex. This increased selectivity highlights dual filter effect of the double antibodies in sandwich ELISA. On the other hand, the single antibody based immunological techniques have higher odds of producing false-positive results, especially when no extra control is involved, e.g., immunohistochemistry (IHC). Hudson et al once reported that HIV regulatory protein Tat was not detected by sandwich ELISA but could be detected immunohistochemically in protein extracts from the brains of the same groups of patients.30 This unexplained difference in recognition of analyte can be well explained now by the aforementioned better selectivity resulting from the double antibodies in sandwich ELISA. Besides format A, the ELISAs in format B, C, and D similarly demonstrated robust signal responses in WT tissues and no signal responses in KO tissues (see Figure S2). Thus, we can conclude that all four formats of sandwich ELISA demonstrated good selectivity for mouse sEH in real samples. In addition, from Table 1, we can see the relative sEH abundance among the eight WT tissues were similar in each format. However, higher values in WT tissues were obtained generally for the ELISA format with higher sensitivity. This is because the higher sensitivity allows more working dilutions of the samples and thus the lower matrix effects.
Table 1.
Selectivity tests of four ELISA formats (A, B, C, and D) against tissues from WT mice.
| WT tissuesa | sEH activityb | mouse sEH (ng/mL) in neat samples | working dilutions used in ELISAs | ||||||
|---|---|---|---|---|---|---|---|---|---|
| A | B | C | D | A | B | C | D | ||
| BAT | 54.9 | 828 | 993 | 743 | 384 | 1k | 10k | 1k | 100 |
| WAT_Ep | 4.4 | 189 | 194 | 130 | n.d. | 1k | 1k | 100 | 100 |
| WAT_Ig | 6.6 | 130 | 167 | 120 | n.d. | 100 | 1k | 100 | 100 |
| liver | 976.8 | 29801 | 37866 | 31691 | 24990 | 100k | 1000k | 100k | 10k |
| kidney | 186.7 | 4905 | 6759 | 5438 | 3181 | 10k | 100k | 10k | 1k |
| brain | 13.8 | 301 | 369 | 294 | n.d. | 1k | 10k | 1k | 100 |
| heart | 85.4 | 1199 | 1842 | 1399 | 1009 | 1k | 10k | 1k | 100 |
| MFP | 28.9 | 208 | 282 | 217 | 67 | 1k | 1k | 100 | 100 |
tissues: scapular brown adipose tissue (BAT), epididymal white adipose tissue (WAT_Ep), inguinal white adipose tissue (WAT_Ig), mesenchymal fat pad (MFP).
activity (nmol·min−1·mL−1) was measured with radioactive assay using [3H]-trans-1,3-diphenylpropene oxide (t-DPPO) as substrate. No appreciable activity was found in eight corresponding KO tissues with background values of 0.05 nmol·min−1·mL−1.
n.d. = not determined (below LOD); 1k = 1000.
To further determine selectivity of the nine nanobodies, both sEH KO and WT mice tissues at varying dilutions were coated on the high-binding microplate and detected with the nanobodies. The anti-mouse sEH pAb was also used as detection antibody for comparison. The results were shown in Figure S3. As expected, the anti-mouse sEH pAb showed strong recognition to both the KO and WT tissues, further confirming its cross-reactivity to undenatured matrix. However, the nine nanobodies unexpectedly also showed strong signal responses to both the KO and WT tissues. The strongest possible explanation for the cross-reactivity of the monospecific nanobody to the KO matrix is that all these nine nanobodies recognized the same epitope shared by sEH and the interfering proteins in the matrix. To further validate this hypothesis, epitope mapping of the nanobodies was performed based on the completion assay (see Figure S4a). As shown in Figure S4b, the nine nanobodies showed inhibition to each other, indicating these nanobodies recognize the same epitope. Despite recognition of the same epitope, these nanobodies with different sequences of amino acids may have different physicochemical properties. For example, we observed the inactivation of the clone 3A1 but the good functionality of 4C3 after conjugation to the same periodate-oxidized HRP (data not shown). In addition, the feasibility of the double nanobody ELISA (format D, 3C1/4C3) can be attributed to the dimer structure of mouse sEH, which possessed two identical epitopes. In addition, the clone 4C3 and the previous nine anti-human sEH nanobodies in ref18 were put together for epitope mapping. The results indicated that the 4C3 recognized the same epitope as the group (clone A1, B4, and B7) did. The recognition to mouse sEH of A1 in previous work was not known because it resulted from the use of anti-human sEH antiserum as capture antibody in selectivity tests. The simultaneous comparison with the eight re-biopanned nanobodies shown in Figure 2 confirmed the recognition capability of A1 to mouse sEH. Also, the use of selectivity of sandwich ELISA instead of antibody selectivity for characterization of an antibody contributed to this impression. In the light of those findings, it is important to discriminate the antibody recognition from the immunoassay selectivity and also perform epitope mapping in developing nanobody based sandwich ELISA.
Matrix Effects
The detection of unknown samples is based on the premise that the analytes in matrix may behave the same as the calibrators in the standard diluent. However, the matrix of real samples is actually different from the standard diluent. It may interfere with the binding between antibody and antigen, thus generating signal response of analytes different from that of the calibrators.31 An efficient way to decrease the matrix effect is to dilute the biological sample with the standard diluent for matrix matching. The more diluted, the closer the matrix of the samples matches that of the calibrators. As the matrix mainly interferes with the binding of antibody and antigen in immunoassay, the format C and D were chosen to evaluate the matrix effect on the sEH binding to pAb/nanobody and double nanobodies. Calibrators of mouse sEH in standard diluent and varying dilutions of liver cytosol samples from sEH KO mice at 1:100, 1:1000, and 1:10000 were prepared. Calibration curves of format C and D against the above calibrators in standard diluent and diluted samples were constructed and are illustrated in Figure 5. For simplicity, the overall recovery rate was calculated as the ratio of the slope of the calibration curve in diluted samples relative to that in standard diluent when the backgrounds were comparable. As shown in Figure 5a, the calculated overall recovery of format C was 105%, 102%, and 105% for the calibrators prepared at 1:100, 1:1000, and 1:10000 dilution of the sample matrix, respectively. The corresponding overall recovery of format D (see Figure 5b) was 82%, 87%, and 89%, respectively. It seems the format D was more susceptible to the matrix effect than the format C. This was likely due to the potential interference resulting from the endogenous biotin in tissues,32 which might displace some bound biotinylated capture nanobody from the coated streptavidin. Anyway, these data support the acceptance of nanobody based ELISAs (format C and D) for mouse sEH analysis in biological samples.
Figure 5.

Comparison of signal responses of nanobody based ELISA in assay buffer and hepatic cytosol samples from KO mice at varying dilutions. (a) format C, (b) format D. Error bars indicate standard deviations (n = 3).
Quantitation of Mouse sEH in Cancer Cells
Understanding the role of sEH in cancer development and therapy is goal for the biologists in the field.33 However, the sEH expression in vitro cell culture is very low if present and thus hard to track in cell models using the classical Western Blot or the regular immunoassay. In this work, the nanobody based format B and C with ultrahigh or high sensitivity were employed to measure the sEH level in eight murine cancer cell lines. For better sensitivity, the incubation time for antigen and detection antibody in formats C and B were extended from 1 h to 2 h and 90 min, respectively; the working concentration of HRP-4C3 in format C was increased from 1:4000 to 1:2000. As demonstrated in Figure S5 and Table S2, format C demonstrated a sensitivity of 0.8226 OD•mL/ng and a LOD of 9.3 pg/mL. This enhanced ELISA only detected the sEH (0.340 and 0.335 ng/mL) without dilution of cell extract derived from the E0771 breast adenocarcinoma (sample # 9–10). Meanwhile, format B gave a sensitivity of 5 OD•mL/ng and a LOD of 4.0 pg/mL. It could detect sEH expression at 3.5-fold dilution of the 4T1 breast adenocarcinoma (sample #4), E0771 breast adenocarcinoma (sample #5), and CT26 colon adenocarcinoma (sample #7). Their calculated sEH level in neat samples was 52.9, 422.1, and 33.0 pg/mL, respectively. Also, format B could confidently detect E0771 breast adenocarcinoma (sample # 9–10) at 10-fold dilution and CT26 colon adenocarcinoma (sample # 11–12) at no dilution. The ultrahigh sensitivity of format B allows higher dilution and thus much smaller volume of samples than format C. This ultrasensitive format B could trace the sEH in samples that other formats were not able to detect. Its high sensitivity is pivotal for potential new discoveries in the field. In addition, good correlation between sEH level and sEH activity were observed in our previous work.18 However, again unexpectedly, the E0771 breast adenocarcinoma with the highest level of sEH (422.1 pg/mL) did not demonstrate highest enzyme activity and the CT26 colon adenocarcinoma with highest sEH activity just showed relatively moderate sEH expression (33.0 pg/mL) in the first batch. This agreed with our pre-test data before (data not shown). This discrepancy was reconfirmed repeatedly in the second batch of E0771 breast adenocarcinoma and CT26 colon adenocarcinoma cultured in duplicate. As shown in Table 2 (sample # 9–12) and Figure S5, the working dilutions gave strong signals appearing in the central section of the calibration curve. The calculated sEH level was 430.8 and 401.4 pg/mL in two E0771 breast adenocarcinoma samples, and 48.7 and 46.6 pg/mL in two CT26 colon adenocarcinoma. Obviously, there is a dramatic difference in the sEH specific activity between E0771 breast adenocarcinoma and CT26 colon adenocarcinoma, as well as the other six kinds of cancer cells. It is unclear what the pathological significance is behind the difference. Yet, the ultrasensitive ELISA developed in this work provided a tool and clue for biologists in the field of cancer biology to investigate the unknown biological processes underlying this difference of sEH.
Table 2.
Summary of sEH expression in eight strains of mouse cancer cells obtained with ELISA (format B) and activity level with radioactive assay (n = 3 if not otherwise specified).
| sample No. | cell name | ELISA (format B) | radioactive assay | |||||
|---|---|---|---|---|---|---|---|---|
| sEH in diluted sample (pg/mL) | CV | +/−a | working dilution | sEH in neat sample (pg/mL) | activity | CV | ||
| 1 | Lewis lung cancer | 2.1 | 5% | - | 3.5 | 7.5 | 3.8 | 8% |
| 2 | T241 fibrosarcoma | 1.2 | 13% | - | 3.5 | 4.1 | 2.3 | 15% |
| 3 | B16F10 melanoma | 3.0 | 5% | - | 3.5 | 10.6 | 0.8 | 7% |
| 4 | 4T1 breast adenocarcinoma | 15.1 | 1% | + | 3.5 | 52.9 | 2.9 | 9% |
| 5 | E0771 breast adenocarcinoma | 120.6 | 2% | + | 3.5 | 422.1 | 12.0 | 5% |
| 6 | MC38 colon adenocarcinima | 3.3 | 8% | - | 3.5 | 11.7 | 1.0 | 15% |
| 7 | CT26 colon adenocarcinoma | 9.4 | 2% | + | 3.5 | 33.0 | 26.8 | 4% |
| 8 | ID8 ovarian adenocarcinoma | 2.4 | 2% | - | 3.5 | 8.5 | 3.1 | 8% |
| 9 | E0771 breast adenocarcinoma | 43.1 | 3% | + | 10 | 430.8 | 10.3 | 5% |
| 10 | E0771 breast adenocarcinoma | 40.1 | 1% | + | 10 | 401.4 | 8.1 | 4% |
| 11 | CT26 colon adenocarcinoma | 48.7 | 5% | + | 1 | 48.7 | 26.5 | 3% |
| 12 | CT26 colon adenocarcinoma | 46.6 | 0% | + | 1 | 46.6 | 35.0 | 3% |
diluted samples with calculated value below LOD (4 pg/mL) of the ELISA were recognized as negative.
activity (pmol•min−1•mL−1) was measured using t-DPPO as substrate.
CONCLUSION
We developed four sandwich ELISA formats involving a combination of polyclonal antibody and nanobody for mouse sEH detection. It was found that the double antibodies worked as double filters and had a huge impact on both the sensitivity and selectivity of sandwich immunoassay. The switch of anti-human sEH pAb to anti-mouse sEH pAb led to over 100-fold increase in sensitivity and dramatic decrease of LOD to pg/mL range in format B. Also, the double antibodies in all four formats generated better selectivity for mouse sEH recognition than the single antibody of pAb or nanobody alone. The four sandwich ELISAs favorably recognized the tissues of WT mice but not that of the sEH KO mice, whereas the pAb or nanobody alone showed significant cross-reactivity to the KO tissues. Finally, the ultrasensitive ELISA (format B) was used to successfully assess the level of sEH expression in eight strains of mouse cancer cells for the first time. Thus, the sandwich ELISAs developed in our work provided sensitive tools to trace the mouse sEH and a deep insight into underlining the dual filter effect of double antibodies in developing sandwich immunoassays.
Supplementary Material
ACKNOWLEDGMENT
The financial support from National Institute of Health (Superfund P42ES04699 and RIVER Award R35 ES030443-01) was acknowledged. D.L. was also grateful to the partial support from National Natural Science Foundation of China (81402722) and The International Postdoctoral Exchange Fellowship (06/2014-06/2015) by The Office of China Postdoctoral Council. We also thank Dr. Dipak Panigrahy at Harvard Medical School for kindly providing the cancer cell lines and Mr. Jogen Atone at UC Davis for performing the experiment on Western Blot.
Footnotes
The authors declare no competing financial interest.
The Supporting Information is available free of charge at http://pubs.acs.org.
Nanobody sequences; selectivity of format B, C, and D; selectivity of nanobodies and pAb; epitope mapping of nanobodies; photos and calibration curves for murine cancer cell analysis; sEH expression measured with format C;
REFERENCES
- (1).Morisseau C; Hammock BD Impact of Soluble Epoxide Hydrolase and Epoxyeicosanoids on Human Health. Annu. Rev. Pharmacol. Toxicol 2013, 53, 37–58. [DOI] [PMC free article] [PubMed] [Google Scholar]
- (2).Yao L; Cao B; Cheng Q; Cai W; Ye C; Liang J; Liu W; Tan L; Yan M; Li B; He J; Hwang SH; Zhang X; Wang C; Ai D; Hammock BD; Zhu Y Inhibition of Soluble Epoxide Hydrolase Ameliorates Hyperhomocysteinemia-Induced Hepatic Steatosis by Enhancing β-oxidation of Fatty Acid in Mice. Am. J. Physiol. Gastrointest. Liver Physiol 2019, 316, G527–G538. [DOI] [PMC free article] [PubMed] [Google Scholar]
- (3).Imig JD; Hammock BD Soluble epoxide hydrolase as a therapeutic target for cardiovascular diseases. Nat. Rev. Drug Discovery 2009, 8, 794–805. [DOI] [PMC free article] [PubMed] [Google Scholar]
- (4).Morisseau C; Hammock BD Epoxide hydrolases: mechanisms, inhibitor designs, and biological roles. Annu. Rev. Pharmacol. Toxicol 2005, 45, 311–333. [DOI] [PubMed] [Google Scholar]
- (5).Ren Q; Ma M; Yang J; Nonaka R; Yamaguchi A; Ishikawa K.-i.; Kobayashi K; Murayama S; Hwang SH; Saiki S Soluble epoxide hydrolase plays a key role in the pathogenesis of Parkinson’s disease. PNAS 2018, 115, E5815–E5823. [DOI] [PMC free article] [PubMed] [Google Scholar]
- (6).Borlongan CV Fatty acid chemical mediator provides insights into the pathology and treatment of Parkinson’s disease. PNAS 2018, 115, 6322–6324. [DOI] [PMC free article] [PubMed] [Google Scholar]
- (7).Morisseau C; Wecksler AT; Deng C; Dong H; Yang J; Lee KSS; Kodani SD; Hammock BD Effect of soluble epoxide hydrolase polymorphism on substrate and inhibitor selectivity and dimer formation. J. Lipid Res 2014, 55, 1131–1138. [DOI] [PMC free article] [PubMed] [Google Scholar]
- (8).Morisseau C; Hammock BD In Techniques for analysis of chemical biotransformation Current Protocols in Toxicology, Bus JS; Costa LG; Hodgson E; Lawrence DA; Reed DJ, Eds.; John Wiley & Sons, Inc.: New Jersey, 2007, pp 4.23.21–24.23.18. [Google Scholar]
- (9).Ghosh R; Gilda JE; Gomes AV The necessity of and strategies for improving confidence in the accuracy of western blots. Expert Rev. Proteomics 2014, 11, 549–560. [DOI] [PMC free article] [PubMed] [Google Scholar]
- (10).Huang L; Chen J; Yu Z; Tang D Self-Powered Temperature Sensor with Seebeck Effect Transduction for Photothermal–Thermoelectric Coupled Immunoassay. Anal. Chem 2020, 92, 2809–2814. [DOI] [PubMed] [Google Scholar]
- (11).Xue L; Yang Y; Wu S; Huang Y; Li J; Xiang Y; Li G In Situ Reduction of Porous Copper Metal–Organic Frameworks for Three-Dimensional Catalytic Click Immunoassay. Anal. Chem 2020, 92, 2972–2978. [DOI] [PubMed] [Google Scholar]
- (12).Zhan Y; Zeng Y; Li L; Guo L; Luo F; Qiu B; Huang Y; Lin Z Cu2+-Modified Boron Nitride Nanosheets-Supported Subnanometer Gold Nanoparticles: An Oxidase-Mimicking Nanoenzyme with Unexpected Oxidation Properties. Anal. Chem 2020, 92, 1236–1244. [DOI] [PubMed] [Google Scholar]
- (13).Chen Y; Xianyu Y; Dong M; Zhang J; Zheng W; Qian Z; Jiang X Cascade Reaction-Mediated Assembly of Magnetic/Silver Nanoparticles for Amplified Magnetic Biosensing. Anal. Chem 2018, 90, 6906–6912. [DOI] [PubMed] [Google Scholar]
- (14).Wang K; Vasylieva N; Wan D; Eads DA; Yang J; Tretten T; Barnych B; Li J; Li QX; Gee SJ; Hammock BD; Xu T Quantitative Detection of Fipronil and Fipronil-Sulfone in Sera of Black-Tailed Prairie Dogs and Rats after Oral Exposure to Fipronil by Camel Single-Domain Antibody-Based Immunoassays. Anal. Chem 2019, 91, 1532–1540. [DOI] [PMC free article] [PubMed] [Google Scholar]
- (15).Zhang Y-Q; Xu Z-L; Wang F; Cai J; Dong J-X; Zhang J-R; Si R; Wang C-L; Wang Y; Shen Y-D; Sun Y; Wang H Isolation of Bactrian Camel Single Domain Antibody for Parathion and Development of One-Step dc-FEIA Method Using VHH-Alkaline Phosphatase Fusion Protein. Anal. Chem 2018, 90, 12886–12892. [DOI] [PubMed] [Google Scholar]
- (16).Kim H-J; McCoy MR; Majkova Z; Dechant JE; Gee SJ; Tabares-da Rosa S; González-Sapienza GG; Hammock BD Isolation of Alpaca Anti-Hapten Heavy Chain Single Domain Antibodies for Development of Sensitive Immunoassay. Anal. Chem 2012, 84, 1165–1171. [DOI] [PMC free article] [PubMed] [Google Scholar]
- (17).Anderson GP; Liu JL; Hale ML; Bernstein RD; Moore M; Swain MD; Goldman ER Development of Antiricin Single Domain Antibodies Toward Detection and Therapeutic Reagents. Anal. Chem 2008, 80, 9604–9611. [DOI] [PubMed] [Google Scholar]
- (18).Li D; Cui Y; Morisseau C; Gee SJ; Bever CS; Liu X; Wu J; Hammock BD; Ying Y Nanobody based immunoassay for human soluble epoxide hydrolase detection using polymeric horseradish peroxidase (PolyHRP) for signal enhancement: the rediscovery of PolyHRP? Anal. Chem 2017, 89, 6248–6256. [DOI] [PMC free article] [PubMed] [Google Scholar]
- (19).Bruce VJ; McNaughton BR Evaluation of Nanobody Conjugates and Protein Fusions as Bioanalytical Reagents. Anal. Chem 2017, 89, 3819–3823. [DOI] [PMC free article] [PubMed] [Google Scholar]
- (20).Zhou Q; Li G; Chen K; Yang H; Yang M; Zhang Y; Wan Y; Shen Y; Zhang Y Simultaneous Unlocking Optoelectronic and Interfacial Properties of C60 for Ultrasensitive Immunosensing by Coupling to Metal–Organic Framework. Anal. Chem 2020, 92, 983–990. [DOI] [PubMed] [Google Scholar]
- (21).Fan K; Jiang B; Guan Z; He J; Yang D; Xie N; Nie G; Xie C; Yan X Fenobody: A Ferritin-Displayed Nanobody with High Apparent Affinity and Half-Life Extension. Anal. Chem 2018, 90, 5671–5677. [DOI] [PubMed] [Google Scholar]
- (22).Morales-Yánez F; Trashin S; Hermy M; Sariego I; Polman K; Muyldermans S; De Wael K Fast One-Step Ultrasensitive Detection of Toxocara canis Antigens by a Nanobody-Based Electrochemical Magnetosensor. Anal. Chem 2019, 91, 11582–11588. [DOI] [PubMed] [Google Scholar]
- (23).Pírez-Schirmer M; Brena BM; González-Sapienza G Oriented Functionalization of Magnetic Beads with in Vivo Biotinylated Nanobodies for Rapid MALDI-TOF MS Ultrasensitive Quantitation of Microcystins in Biological Samples. Anal. Chem 2019, 91, 9925–9931. [DOI] [PubMed] [Google Scholar]
- (24).Cui Y; Li D; Morisseau C; Dong J-X; Yang J; Wan D; Rossotti M; Gee S; González-Sapienza G; Hammock B Heavy chain single-domain antibodies to detect native human soluble epoxide hydrolase. Anal. Bioanal. Chem 2015, 407, 1–9. [DOI] [PMC free article] [PubMed] [Google Scholar]
- (25).Belanger L; Sylvestre C; Dufour D Enzyme-linked immunoassay for alpha-fetoprotein by competitive and sandwich procedures. Clin. Chim. Acta 1973, 48, 15–18. [DOI] [PubMed] [Google Scholar]
- (26).Yamada T; Morisseau C; Maxwell JE; Argiriadi MA; Christianson DW; Hammock BD Biochemical Evidence for the Involvement of Tyrosine in Epoxide Activation during the Catalytic Cycle of Epoxide Hydrolase. J. Biol. Chem 2000, 275, 23082–23088. [DOI] [PubMed] [Google Scholar]
- (27).Pinot F; Grant DF; Beetham JK; Parker AG; Borhan B; Landt S; Jones AD; Hammock BD Molecular and Biochemical Evidence for the Involvement of the Asp-333–His-523 Pair in the Catalytic Mechanism of Soluble Epoxide Hydrolase. J. Biol. Chem 1995, 270, 7968–7974. [DOI] [PubMed] [Google Scholar]
- (28).Li D; Morisseau C; McReynolds CB; Duflot T; Bellien J; Nagra RM; Taha AY; Hammock BD Development of Improved Double Nanobody Sandwich ELISAs for Human Soluble Epoxide Hydrolase Detection in PBMCs of Diabetic and Pre-frontal Cortex of Multiple Sclerosis Patients. Anal. Chem 2020, 92, 7334–7342. [DOI] [PMC free article] [PubMed] [Google Scholar]
- (29).Aeonian Biotech. https://aeonianbiotech.com/what-is-the-difference-between-antibodys-specificity-and-its-selectivity/ (accessed Mar 31, 2020).
- (30).Hudson L; Liu J; Nath A; Jones M; Raghavan R; Narayan O; Male D; Everall I Detection of the human immunodeficiency virus regulatory protein tat in CNS tissues. J. NeuroVirol 2000, 6, 145–155. [DOI] [PubMed] [Google Scholar]
- (31).Tate J; Ward G Interferences in immunoassay. Clin. Biochem. Rev 2004, 25, 105–120. [PMC free article] [PubMed] [Google Scholar]
- (32).Trambas C; Lu Z; Yen T; Sikaris K Characterization of the scope and magnitude of biotin interference in susceptible Roche Elecsys competitive and sandwich immunoassays. Ann. Clin. Biochem 2018, 55, 205–215. [DOI] [PubMed] [Google Scholar]
- (33).Zhang J; Sanidad KZ; Zhang G Cytochrome P450 monooxygenase/soluble epoxide hydrolase-mediated eicosanoid pathway in colorectal cancer and obesity-associated colorectal cancer. Oncoscience 2019, 6, 371–375. [DOI] [PMC free article] [PubMed] [Google Scholar]
Associated Data
This section collects any data citations, data availability statements, or supplementary materials included in this article.