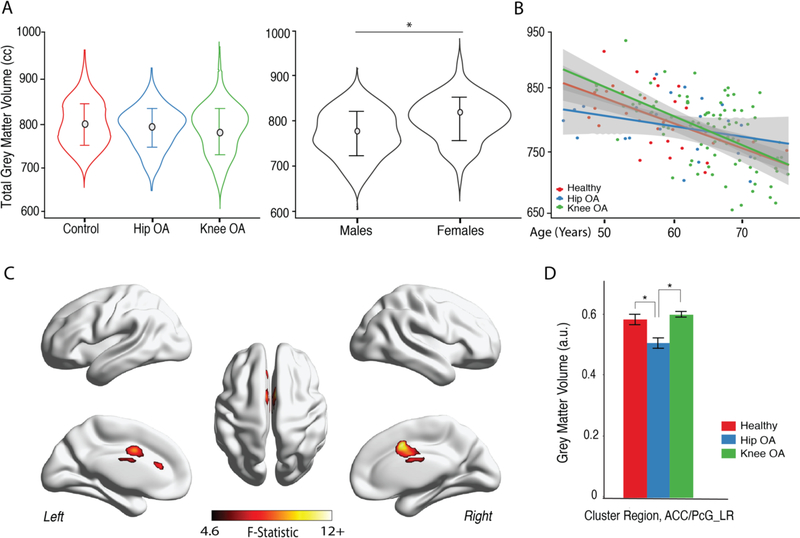
Figure 1. Whole brain cortical grey matter changes reflect lower volumes in anterior cingulate, paracingulate gyri in HOA.
A. Average total neocortical grey matter (TGM) matter volume was not different between healthy controls, HOA and KOA patients (age, gender and intracranial volume were used as confound variables (F (2,145) =0.07, p=0.79)). TGM differed by gender across groups, when controlling for total IC volume and age (F (1,145) = 15.7, p<0.001), with females showing higher volumes. C. Scatterplot represents total neocortical GM in relation to age for each subject, color-coded by group; slopes were computed for each group, showing decrease of TGM with age, for all groups (p<0.05; R2: controls=0.52; KOA=0.37; HOA=0.17). C. Grey matter morphological changes assessed by voxel-based morphometry (VBM). The three groups were contrasted together, using a 1-way between subjects’-ANCOVA, with age, gender and total ICV as covariates of no interest. Shown is the F-test statistical map, clustering determined using uncorrected p-value binarized at value of 0.001 and cluster size>66 voxels. Only cingulate/paracigulate gyri showed regional GM volume difference between the groups. D. Post hoc results for GM volume comparisons in the identified region – anterior cingulate/paracingulate gyri (ACC/PcG_LR). Bars represent the mean grey matter volume and error bars represent the standard error. Tukey HSD test showed regional GM volume was lower in HOA from KOA and healthy subjects at p<0.001.KOA and controls did not show a statistically significant difference (p=0.34). *p<0.001.

