Abstract
The actin cytoskeleton plays multiple critical roles in cells, from cell migration to organelle dynamics. The small and transient actin structures regulating organelle dynamics are difficult to detect with fluorescence microscopy, and the limited resolution of fluorescence microscopy makes it difficult to determine whether actin filaments are directly associated with specific membranes. To address these limitations, we developed an approach using fluorescent protein-tagged actin nanobodies targeted to organelle membranes to enable live cell imaging of sub-organellar actin dynamics with unprecedented spatiotemporal resolution.
Introduction
The critical role of the actin cytoskeleton in organelle dynamics is largely accepted, but poorly understood. The precise spatiotemporal dynamics of actin at organelle membranes remain particularly unclear due to the combined limitations of currently available actin probes and imaging approaches. For fluorescence microscopy approaches, imaging smaller actin structures in the cell suffers from an enormous background signal issue - the high signal from the dense meshwork of actin filaments throughout the cell overwhelms the signal from the relatively small, transient actin structures associated with organelle dynamics. Furthermore, the limitations in resolution make it difficult to conclude whether any actin filaments are directly associated with the organelle. Here we employ fluorescent protein-tagged actin nanobodies, aka “actin chromobodies” (AC)1,2, fused to organelle membrane targeting sequences to facilitate live cell imaging of sub-organellar actin dynamics with high spatiotemporal resolution. Using these probes, we imaged the spatiotemporal dynamics of mitochondria- and endoplasmic reticulum (ER)-associated actin accumulation at mitochondrial fission sites.
Results
We hypothesized that AC probes with organelle membrane targeting sequences could be used to visualize actin filaments closely associated with the target organelle membrane. Given the high mobility of membrane-anchored proteins in a lipid bilayer, an F-actin binding probe containing only a membrane-anchoring sequence and a fluorescent protein tag should quickly accumulate at sites of F-actin enrichment near the membrane by virtue of its actin-binding activity (Fig. 1A). To test this hypothesis, we generated constructs containing the yeast Fis1 mitochondrial outer membrane or Cytb5ER endoplasmic reticulum (ER) minimal C-terminus tail membrane targeting sequences fused to the cytoplasm-facing actin nanobody and tagGFP (“AC-mito” and “AC-ER”)3. Live cell Airyscan confocal imaging of cells expressing AC-mito or AC-ER counterstained with MitoTracker dye revealed specific regions of AC-mito accumulation on the surfaces of mitochondria, and similarly for AC-ER on the ER (Fig. 1B and Supp. Videos 1–4). To rule out the possibility the membrane targeting sequences we used were causing the probe to accumulate in specific regions independent of actin-binding activity, we co-transfected AC-mito or AC-ER with control probes: mCherry-tagged mitochondrial (Fis1) and ER (Cytb5ER) membrane targeting sequences (mCherry-mito and mCherry-ER). As expected, the mCherry-mito and mCherry-ER signals were evenly distributed along their respective organelle membranes, with no obvious accumulation in any specific regions. In contrast, the co-expressed AC-mito and AC-ER constructs displayed significant accumulation in specific regions on their respective organelles (Fig. 1B), as quantified by the coefficient of variance (see Methods for more details). Cells expressing AC-ER counterstained with MitoTracker revealed high AC-ER accumulation at ER-mitochondria contacts compared to the mCherry-ER control probe (Fig. 1B, Extended Data Fig. 1, and Supp. Videos 3–4). Overall, AC probe labeling appears to provide both more specificity and sensitivity than phalloidin staining for identifying organelle-associated actin (Extended Data Fig. 2). Importantly, there was no detected increase in actin on organelles in cells expressing the AC probes (Extended Data Fig. 2C). Similarly, we found no change in endogenous Fis1 localization to mitochondria in AC-mito expressing cells (Extended Data Fig. 3). Using a different membrane targeting sequence (Cytb5mito3) and/or a different F-actin probe (LifeAct4) yielded similar results (Extended Data Fig. 4).
Figure 1: Mitochondria and ER targeted actin chromobodies reveal sub-organellar F-actin associated domains.
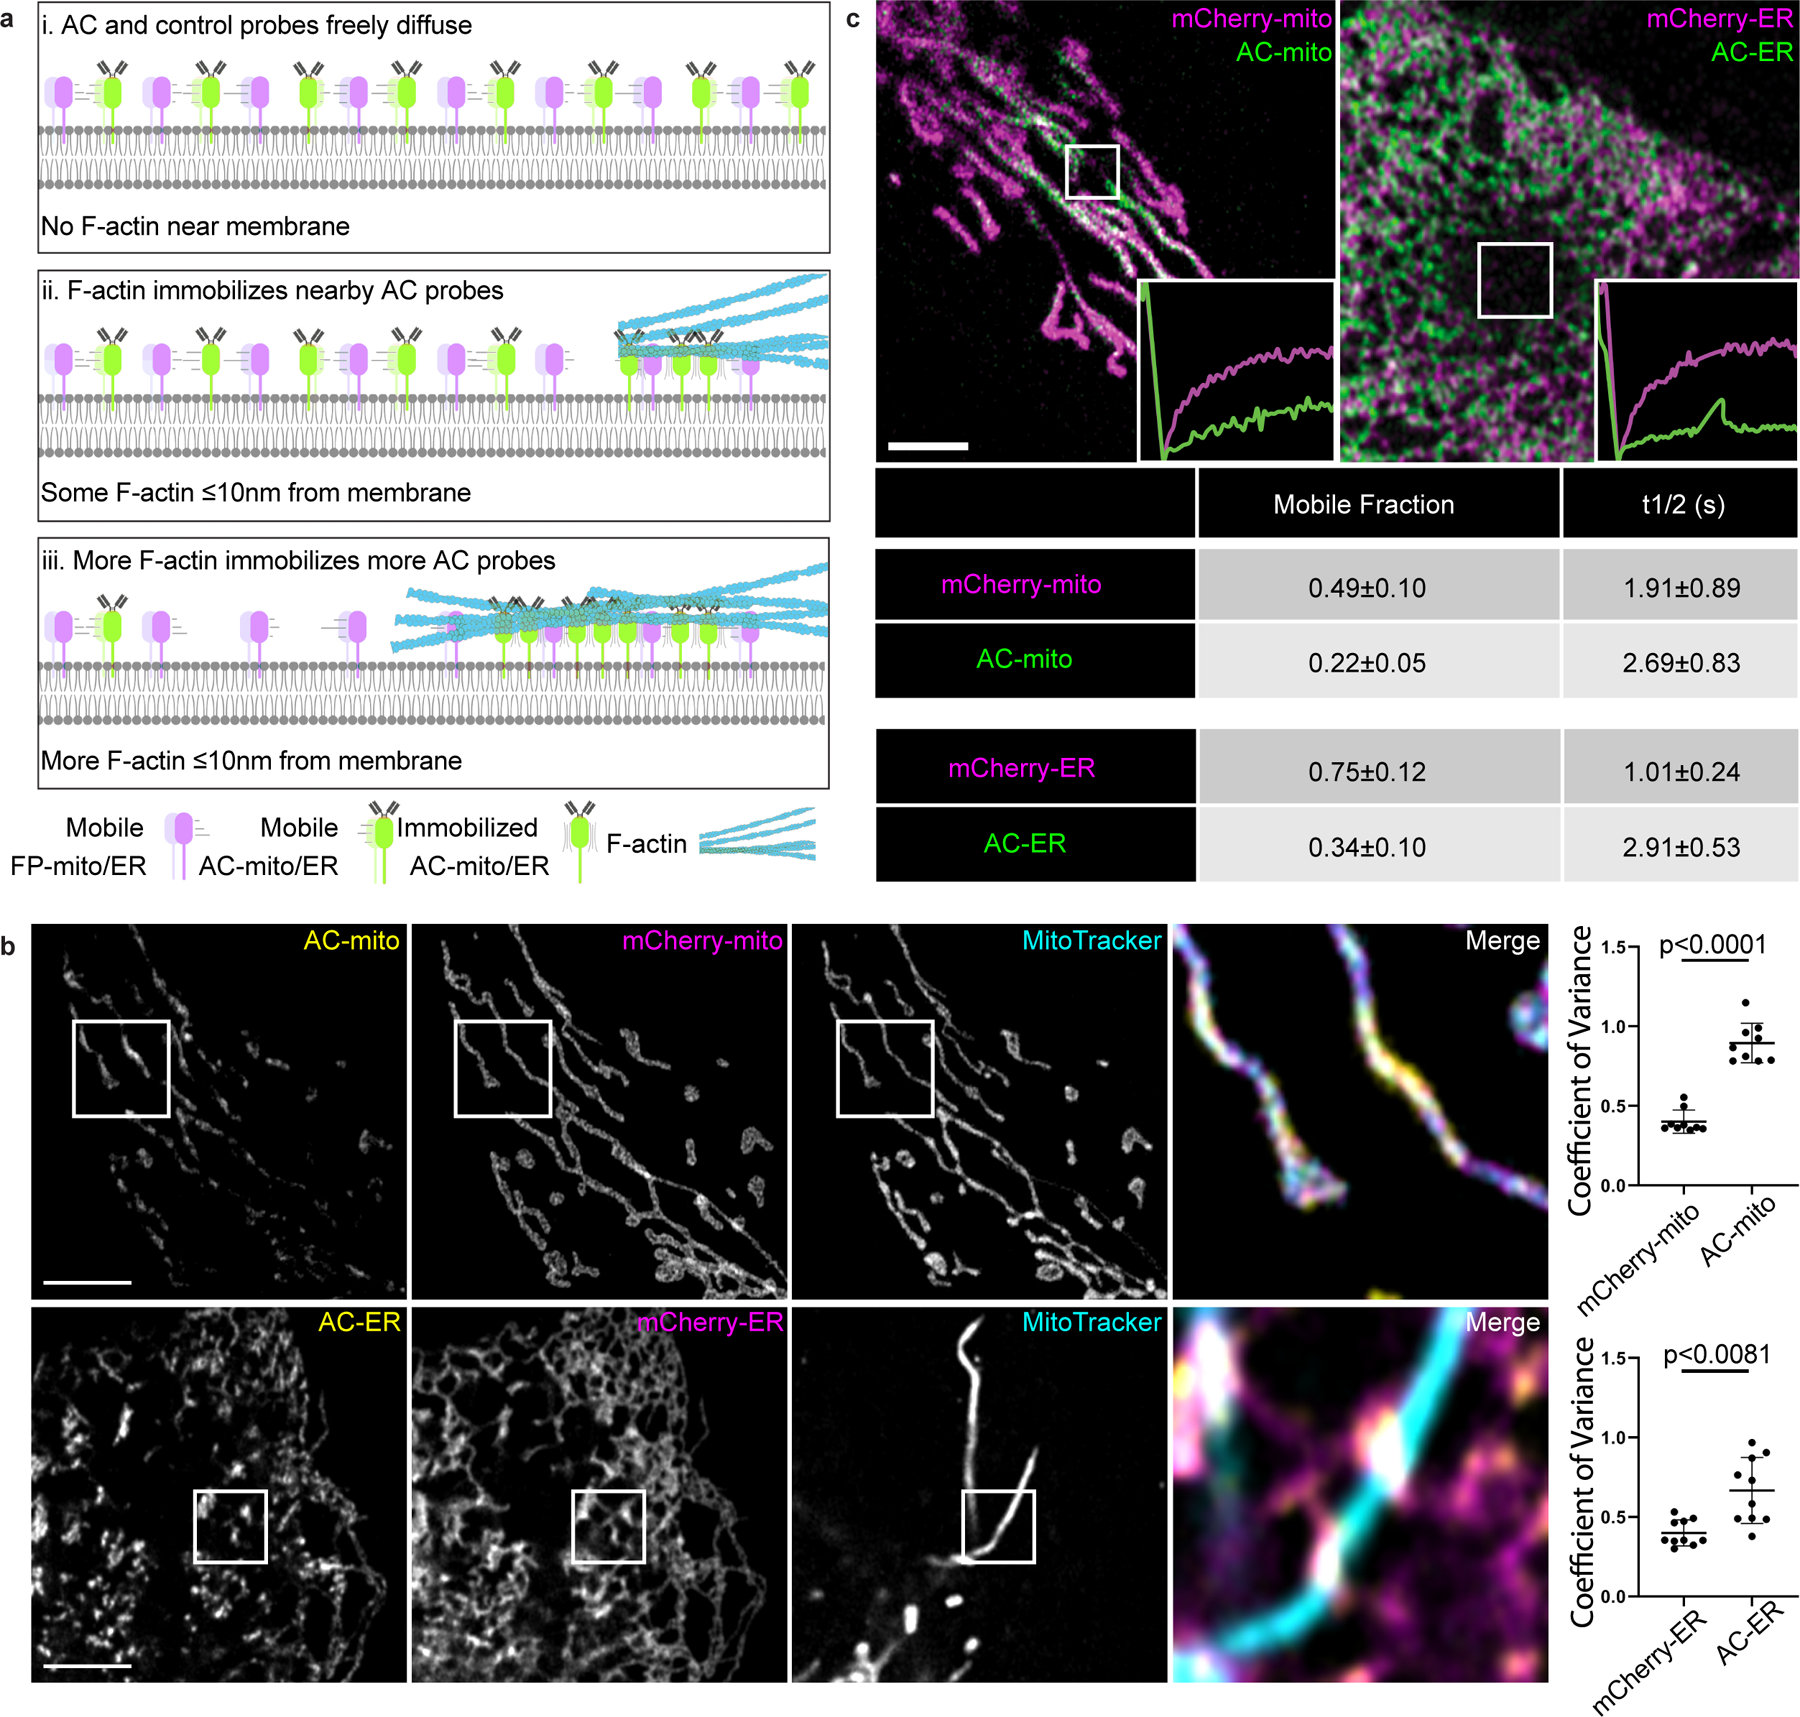
A) Cartoon model of changes in organelle membrane targeted actin chromobody (AC) probe localization in response to the presence of F-actin. When there is no F-actin near the membrane, AC probes freely diffuse throughout the membrane. When F-actin comes close enough to the membrane to bind the AC probes (approximately 10nm from the membrane), the AC probes (but not the control probes) are immobilized at the sites of F-actin accumulation. As actin filaments grow/accumulate, more of the AC probe becomes immobilized. B) Co-expression of mCherry-tagged control probes in U2OS cells demonstrates AC probe sub-organellar accumulation depends on actin nanobody activity. Sub-organellar accumulation was observable in all cells imaged (AC-mito: n = 68 cells, AC-ER: n = 55 cells). Scale bars: 5 µm. Sub-organellar accumulation was quantified as the coefficient of variance within the mitochondrial (n = 9 cells) or ER (n = 10 cells) area as described in the Methods section. P-values were determined using a two-tailed paired ratio t-test. These results were reproducible across 9 independent experiments. C) FRAP of cells co-expressing AC and control probes shows that both probes are highly mobile, but the AC probes have lower mobility and a lower mobile fraction relative to control probes (AC: n = 10 cells, mCherry control: n = 14 cells). The table displays the average mobile fraction and t1/2 ± the standard deviation. These results were reproducible across 4 independent experiments.
Fluorescence recovery after photobleaching (FRAP) experiments showed that both the AC and mCherry control probes are highly mobile on the membrane, but only the AC probes exhibit lower mobility at sites of AC specific accumulation (Fig. 1C, Extended Data Fig. 5, Supp. Videos 5, 6). However, the AC probe mobility was similar to the control probes in diffuse regions lacking AC accumulation (Extended Data Fig. 5), consistent with the model in which AC accumulation is indicative of immobilization by F-actin binding activity (Fig. 1A)5,6. To further test whether sub-organellar AC accumulation is dependent on F-actin, we treated AC expressing cells with the F-actin depolymerizing drug Latrunculin B (LatB). LatB treatment significantly altered not only the distribution but also increased the mobility of the AC probes (Extended Data Fig. 6). Taken together, these results strongly support the conclusion that AC probe accumulation and mobility is dependent on F-actin, yet the AC binding dynamics are still relatively fast compared to actin filament turnover rates7–9.
Given their high mobility, we hypothesized AC probes should reveal dynamic changes in F-actin (dis)assembly on their respective organelles. In HeLa cells, F-actin “waves” cycle around the cell, decorating subpopulations of mitochondria prior to their fission and subsequent fusion10. As expected, we found coaccumulation of F-actin and the AC probes (but not the control probes) on specific regions of the organelles (Fig. 2). Timelapse imaging of cells labeled with LifeAct, the AC probes, and a mitochondrial matrix marker revealed fluctuations in actin accumulation on mitochondrial subpopulations as actin waves cycled throughout the cell (Fig. 2B, Extended Data Fig. 7, Supp. Videos 7–9). Fluorescence intensity changes in AC probe levels matched those of LifeAct, and mitochondrial fission occurred after actin accumulation, as previously reported (Fig. 2D, Supp. Video 10). The wave cycling rates matched those of cells not expressing AC probes, and neighboring cells expressing varying levels of the AC probe also had matching rates. Increased AC accumulation around fragmented mitochondria induced by ionomycin treatment was also evident. There was no difference in the rate of ionomycin-induced mitochondrial fragmentation in cells expressing AC probes compared to neighboring untransfected cells (Extended Data. Fig 8, Supp. Videos 11, 12). Overall, these results show the AC probes reliably label dynamic actin (dis)assembly without altering the kinetics or mitochondrial behavior in normal or stressed conditions.
Figure 2: AC-mito and AC-ER dynamically label mito- and ER-associated actin.
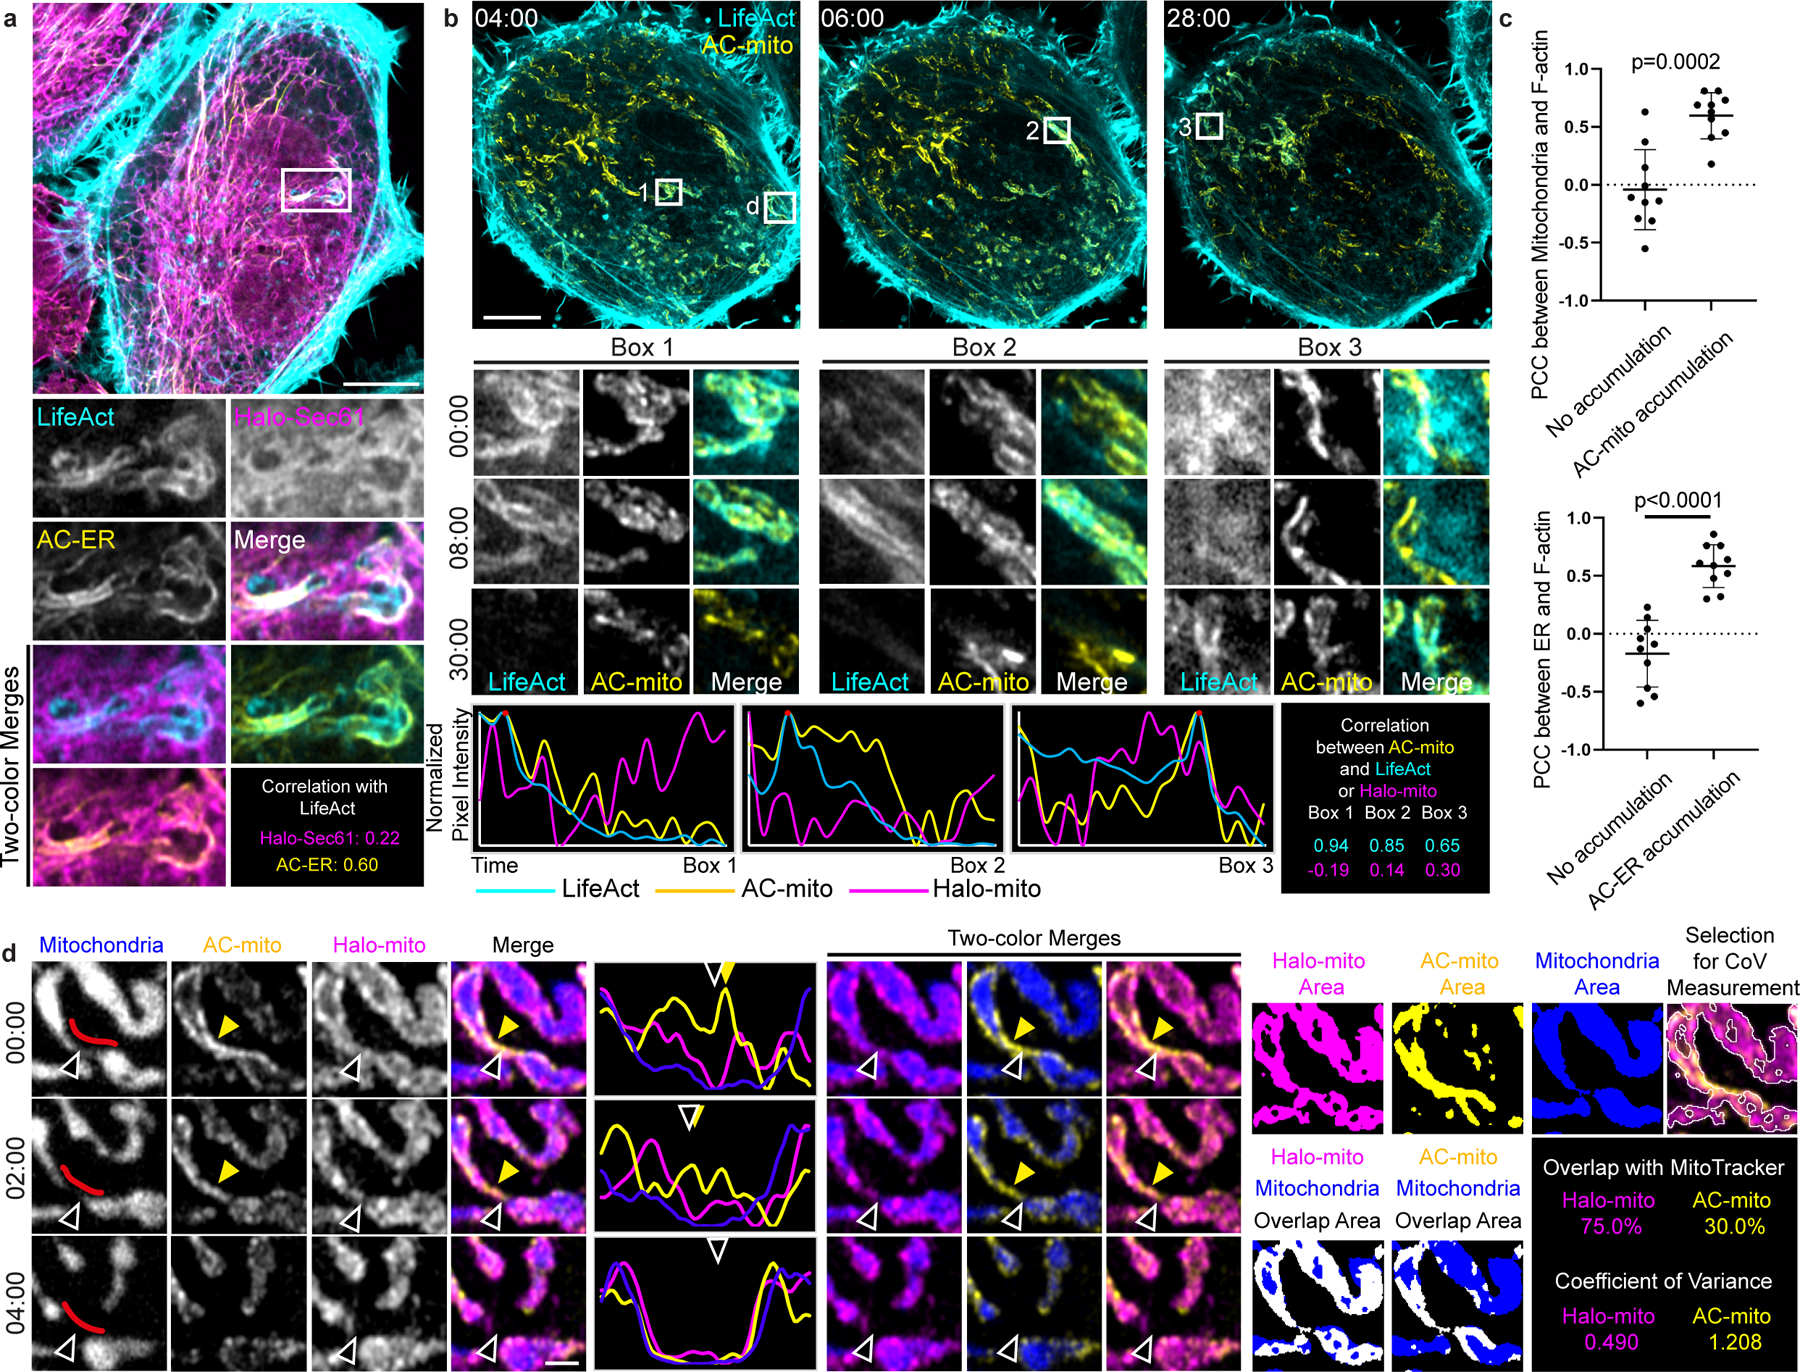
A) AC-ER co-accumulates with actin. HeLa cell co-expressing LifeAct, AC-ER, and Halo-ER control probe is pictured with an area of actin and AC-ER co-accumulation shown in the high magnification images. Pearson’s correlation coefficient is displayed for LifeAct:Halo-ER and LifeAct:AC-ER in the boxed region. Scale bar: 5 µm. These results were reproducible across 12 independent experiments. B) AC-mito co-accumulates with actin. An actin wave cycling around the cell was imaged in HeLa cells co-expressing LifeAct, AC-mito, Halo-mito control, BFP-mito. Only LifeAct and AC-mito are shown for simplicity. Boxes 1–3 mark regions of LifeAct accumulation at different timepoints. Box “d” marks the area shown at higher magnification in panel D. Scale bar: 5 µm. Graphs show the change in LifeAct, AC-mito, and Halo-mito control pixel intensity in the boxed regions over time. The correlation between AC-mito:LifeAct and AC-mito:Halo-mito pixel intensity over time was calculated for each boxed region and results are displayed in the lower right. These results were reproducible across 4 independent experiments. C) Areas of AC probe accumulation mark sites of increased actin co-localization with mitochondria or the ER. Cells were either co-transfected with AC-mito and LifeAct and stained with MitoTracker (top graph) or co-transfected with AC-ER, LifeAct, and the mCherry-ER control probe (bottom graph). Pearson’s correlation coefficient was calculated between mitochondria:LifeAct (top graph) or ER:LifeAct (bottom graph) in regions showing AC probe accumulation. N = 10 cells per condition. P-values determined by two-tailed Welch’s t-test. D) AC-mito accumulates at sites of mitochondrial fission. A higher magnification of Box “d” from panel B shows mitochondria (BFP-mito), the Halo-mito control probe, and AC-mito signal during a mitochondrial fission event. The mitochondrial region used to generate the line scan is marked by red lines in the first column. Hollow arrows mark the mitochondrial fission site. Yellow arrows mark regions of AC-mito accumulation. Example images of the areas used to determine the degree of mitochondria overlap and coefficient of variance for Halo/AC-mito and the resulting values are shown on the right. Scale bar: 1 µm. These results were reproducible across 9 independent experiments.
Previous studies demonstrated a role for actin in driving mitochondrial fission at ER-mitochondria contact sites, likely with actin playing a role in force generation and Drp1 recruitment and activation11–18. To determine the kinetics of mitochondria- and ER-associated actin accumulation at mitochondrial fission sites, we performed live imaging of cells expressing AC-mito and AC-ER counterstained with MitoTracker. Mitochondrial fission sites displayed accumulation of both AC-mito and AC-ER prior to Drp1- and ER-mediated fission. (Fig. 3, Extended Data Figs. 9, 10, Supp Figs. 1–8, Supp. Videos 13–19). Approximately 5% of cells transfected with AC-mito expressed off a CMV promoter displayed overexpression artifacts (i.e. increased clustering and reduced mobility of mitochondria) (Supp. Video 20). To address this, we expressed AC-mito using a ubiquitin UbC promoter. This dramatically reduced the prevalence of overexpression artifacts (less than 0.01% of transfected cells). We did not detect a change in mitochondrial membrane potential, fission rate, or ER-mitochondria contacts in cells expressing the AC probes (Extended Data Fig. 9). In cells expressing both AC-mito and AC-ER, we invariably observed AC-mito accumulation prior to AC-ER (Fig. 3D, Supp. Fig. 9, Supp. Video 21).
Figure 3: Mitochondria- and ER-associated actin accumulates prior to mitochondrial fission.
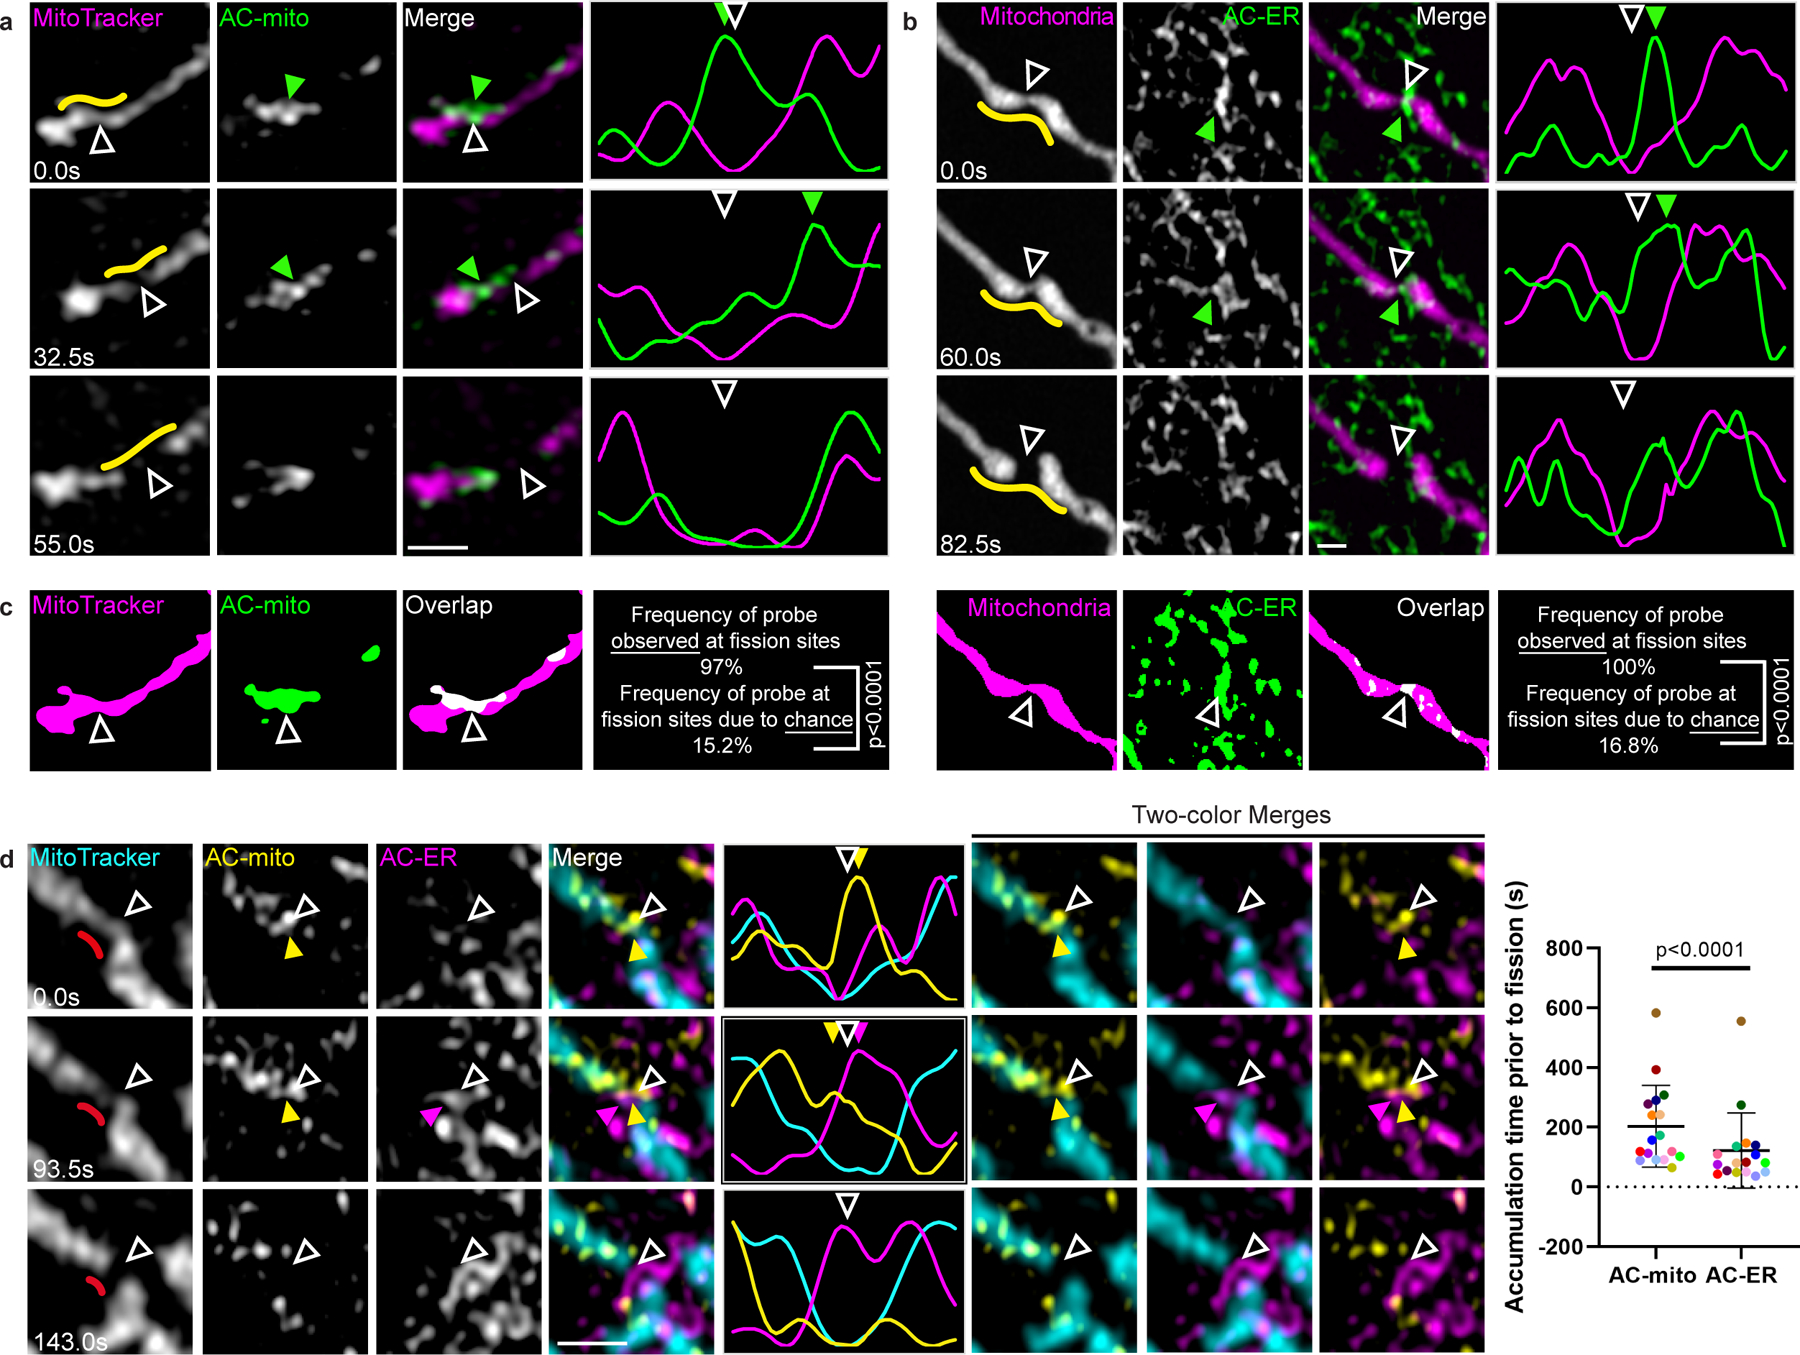
A) AC-mito accumulates at mitochondrial fission sites. AC-mito accumulation is evident prior to mitochondrial fission. Hollow arrows mark the site of mitochondrial fission. Green arrows mark the location of AC-mito accumulation. Yellow lines indicate the area used to generate the line scan. Scale bar: 1 µm. These results were reproducible across 21 independent experiments. B) AC-ER accumulates at mitochondrial fission sites. Similar to A except cells are co-expressing BFP-mito and AC-ER. These results were reproducible across 21 independent experiments. C) Examples of AC probe areas used to determine that accumulation at mitochondrial fission sites is not due to chance. Images show the mitochondria and AC probe areas generated by the images from the first timepoints in A and B. The frequency of the AC probes observed at fission sites (AC-mito: 32/33 fission events, AC-ER: 31/31 fission events) is compared to the frequency that the probe would be expected at fission sites due to chance as detailed under Methods. P-values determined by Fisher’s exact test. D) AC-mito accumulates at mitochondrial fission sites prior to AC-ER accumulation. The first timepoint shows AC-mito accumulation in the absence of AC-ER accumulation. Subsequently, AC-ER accumulates and mitochondrial fission occurs. Hollow arrows mark the site of mitochondrial fission. Yellow arrows mark AC-mito accumulation and magenta arrows mark AC-ER accumulation. The red lines in the left column mark the area used to the generate the line scan. Scale bar: 1 µm. This order of events is consistently observed and quantified in the scatter plot. Each dot color corresponds to an individual fission event (n = 17 fission events). P-values determined by two-tailed ratio paired t-test. These results were reproducible across 7 independent experiments.
Conclusion
Membrane-anchored AC probes provide a novel tool for studying membrane-associated actin dynamics with much higher effective resolution than cytoplasmic actin probes. In addition to the plasma membrane19, the variety of subcellular compartments, protein targets, and corresponding subcellular or sub-organellar processes that can be studied will increase as additional nanobodies or other kinds of protein binding motifs and subcellular membrane targeting sequences are developed. In addition, future studies switching the fluorescent markers for EM compatible probes, and/or proximity markers for downstream mass spectrometry analyses such as APEX220 or TurboID21 will likely reveal new insights into fundamental processes and molecular mechanisms in actin and organelle cell biology.
Methods
Cell culture.
U2OS, HeLa, and Hap1 cells were purchased from ATCC. HeLa cells stably expressing LifeAct-mCherry were a gift from the Wedlich-Soldner lab22. Cells were grown in DMEM supplemented with 10% fetal bovine serum at 37°C with 5% CO2. Cells were transfected with Lipofectamine 2000 (ThermoFisher). Cells were plated onto either 8-well #1.5 imaging chambers or #1.5 35mm dishes (Cellvis) that were coated with 10µg/mL fibronectin in PBS at 37°C for 30 minutes prior to plating. 50nM MitoTracker Deep Red (ThermoFisher) was added for 30 minutes then washed for at least 30 minutes to allow for recovery time before imaging in FluoroBrite (ThermoFisher) medium.
Airyscan confocal imaging.
Cells were imaged with a Plan-Apochromat 63x/1.4NA oil objective on an inverted Zeiss 880 LSM Airyscan confocal microscope with the environmental control system supplying 37°C, 5% CO2 and humidity for live cell imaging. The GFP channels were imaged with a 488nm laser line at ~500nW laser power. The mCherry or tagRFP channels were imaged with 561nm laser at ~1µW laser power. The MitoTracker Deep Red channel was imaged with ~250nW laser power. For timelapse imaging, the zoom factor was set between 3x-6x to increase the frame rate. In all cases, the maximum pixel dwell time (~0.684µs/pixel) and 2x Nyquist optimal pixel size (~40nm/pixel) was used.
Spinning disk confocal imaging.
Cells were imaged with a Plan-Apochromat 40x/1.3NA oil objective on a Zeiss CSU Spinning Disk Confocal Microscope with a CSU-X1 Yokogawa spinning disk scan head on a Prime 95B sCMOS camera (Teledyne Photometrics). The 488/561/647nm laser powers were set at 100/200/20µW with 300/300/150ms exposure times, respectively.
Antibodies.
We used the rabbit anti-Fis1 antibody against the N-terminal cytoplasmic facing side of the human Fis1 protein, made by Prestige Antibodies Powered by Atlas Antibodies (Sigma-Aldrich, catalog #: HPA017430). The amino acid sequence of the antigen is: MEAVLNELVSVEDLLKFEKKFQSEKAAGSVSKSTQFEYAWCLVRSKYNDDIRKGIVLLEELLPKGS KEEQRDYVFYLAVGNYRLKEYEKALKYVRGLLQTEPQNNQAKELERLIDKAMKKD.
Immunofluorescence.
Cells were washed in PBS then fixed with 4% PFA for 30 minutes before permeabilization with 0.1% Triton X-100 for 30 minutes. Cells were then blocked overnight with 4% BSA at 4°C. Cells were then incubated with primary antibody for 2 hours, rinsed 3x with PBS for 10 minutes each, then incubated with secondary antibodies (Jackson Immunoresearch Laboratories) for 1 hour, rinsed 3x with PBS for 10 minutes each, then counterstained with Alexa405-phalloidin (ThermoFisher) for 30 minutes, then rinsed with PBS 3x for 10 minutes each, then mounted with ProLong Glass antifade reagent (ThermoFisher).
Image processing and analysis.
After acquisition, images were Airyscan processed using the auto-filter 2D-SR settings in Zen Blue (ZEISS). All images were post-processed and analyzed using Imaris (BITPLANE) and Fiji software23. All images shown are from single focal planes unless stated otherwise.
Data quantification and statistics.
All line scans were normalized and plotted in Excel. All statistical analyses and graphs were generated using GraphPad Prism 8 software. All graphs display horizontal lines marking average values and error bars indicating standard deviation.
AC probe “accumulation” calculation (Supp. Fig. 5):
Using Fiji, a square selection was drawn around a region with obvious AC probe accumulation (1.5 µm2 for mitochondria, 0.6 µm2 for ER). The mean pixel intensity of the AC probe and mCherry control probe within the selection was measured. Another square of equal dimensions was drawn in an adjacent area with mCherry signal but without obvious AC probe accumulation. Mean pixel intensity was also measured in this region. The mean pixel intensity in the accumulated region was then divided by the mean pixel intensity in the region without accumulation.
Determination of coefficient of variance:
We measured the extent of sub-organellar “accumulation” by quantifying the coefficient of variance as follows: In Fiji, the mCherry-mito or mCherry-ER signal was used to generate a mask of the mitochondria or ER, respectively. A selection was generated based on this mask (see Fig. 2d and Supp. Fig. 14a). The mean pixel intensity and standard deviation within the mask were measured. Coefficient of variance was determined by dividing the standard deviation by the mean pixel intensity.
Determination of % overlap:
Masks of ER, mitochondria, actin, and AC/mCherry probes were generated in Fiji. For AC probes, thresholding was set to mask only the top 25% of AC probe signal based on maximum pixel intensity (see the “clipped” panels in Supp. Fig. 2). All other masks were generated using default thresholding settings in Fiji, which uses the IsoData algorithm developed by Ridler and Calvard24. The integrated density of each mask was calculated. Areas of overlap between masks were generated using Fiji’s “Image Calculator” and the integrated density of these areas was also measured. These values were used to calculate the % overlap (i.e. integrated density for area of overlap between AC-mito and mitochondria divided by integrated density for mitochondria area yields % of mitochondria overlapped by AC-mito). This percentage was interpreted as the probability of AC probes localizing to fission sites by chance (Fig. 3c).
Colocalization analysis:
Pearson’s correlation coefficient was determined using Fiji’s “Coloc 2” plugin (https://imagej.net/Coloc_2). For analysis of colocalization in regions with or without AC probe accumulation (Fig. 2c), a square selection was drawn around a region with obvious AC probe accumulation and an equal-sized square was drawn in an adjacent region without AC probe accumulation. Square sizes were 1.5 µm2 for AC-mito analysis and 0.6 µm2 for AC-ER analysis. For mitochondria-ER contact analysis (Supp. Fig. 11c), a peripheral region (98.5 µm2) of the cell containing mitochondria and ER was selected. This was done to prevent artificially high values resulting from the large amount of ER and mitochondria overlap typically observed in the perinuclear region, which is too dense to resolve by Airyscan confocal microscopy.
FRAP analysis:
FRAP experiments were performed on a Zeiss 880 Airyscan confocal microscope using a Plan-Apochromat 63x/1.4 Oil DIC objective. Transfected cells were maintained at 37°C with 5% CO2 in FluoroBrite DMEM (Gibco) and 10% FBS (VWR) culture medium. 488nm and 561nm excitation laser lines and Airyscan detectors were driven by Zeiss Zen black software. FRAP experiments were done in one focal plane, using the following conditions: 3 pre-bleach frames were acquired at maximum speed with 488nm laser at 25µW and 561nm laser at 13µW power. The photobleaching of selected regions was done with 488nm laser at 5mW power at maximum speed for 30 iterations. The post-bleach acquisition was done with 488nm at pre-bleach imaging settings for 100 frames. The fluorescence intensity of the acquired images were quantified in Fiji following the principles as outlined in Lippincott-Schwartz et al. 201825. The mobile fraction was determined as the percentage of fluorescence recovery at full recovery. The t1/2 was determined as the time taken for the fluorescence intensity in the bleached region to recover to 50% of the full recovery value after bleaching. If objects moved in or out of the ROI during the recovery phase, they were not included in our analyses.
Actin wave pixel intensity measurements:
Square selections were made in Fiji (3 selections per cell) and the mean pixel intensity was measured over time. The selections used were 10.1 µm2 for data collected using Airyscan confocal and 32.8 µm2 for data collected using spinning disk confocal microscopy.
Mitochondrial membrane potential:
The mean threshold value for each cell was obtained through thresholding to include mitochondria using the MitoTracker Deep Red channel. The average pixel intensity in the thresholded region was measured. The relative intensity for each cell was then calculated by dividing each cell’s mean threshold value by the average mean threshold value of all un-transfected cells within the same image. The relative signal intensity of each transfected and un-transfected cell was then plotted and graphed.
Plasmids.
Drp1-mCherry was a kind gift from Gia Voeltz (Addgene plasmid #49152). mCherry-Cytob5RR was a gift from Nica Borgese26. Halo-Sec6127, Halo-Fis1 (Addgene plasmid #111136), LifeAct-mScarlet (Addgene plasmid #85054), and mTagBFP2-mito28 used for experiments shown in Figure 2 were gifts from the Lippincott-Schwartz lab. All custom actin nanobody probes were generated starting from the commercial vector of actin chromobody-tagGFP or actin chromobody-tagRFP (ChromoTek) and cloned via the BglII and NotI restriction sites. The following amino acid sequences were attached to the C-terminal of the actin chromobody probes to target the protein either to mitochondria or the ER:
Fis1 (AC-mito and LifeAct-GFP-Fis1):
IQKETLKGVVVAGGVLAGAVAVASFFLRNKRR3
Cytb5mito (aka “Cytob5RR”) (AC-GFP-Cytb5mito and LifeAct-GFP-Cytb5mito):
FEPSETLITTVESNSSWWTNWVIPAISALVVALMYRR29
Cytb5ER (AC-ER):
IDSSSSWWTNWVIPAISAVAVALMYRLYMAED3
LifeAct-GFP-Fis1, LifeAct-GFP-Cytb5mito, and AC-GFP-Cytb5mito were generated using PFU Ultra II for megaprimer PCR insertion30. The PCR primers, intended modifications, insert templates, and destination plasmids are listed in Supplementary Table 1. All constructs were sequenced completely across their coding region.
Extended Data
Extended Data Figure 1: AC-ER accumulates alongside mitochondria.
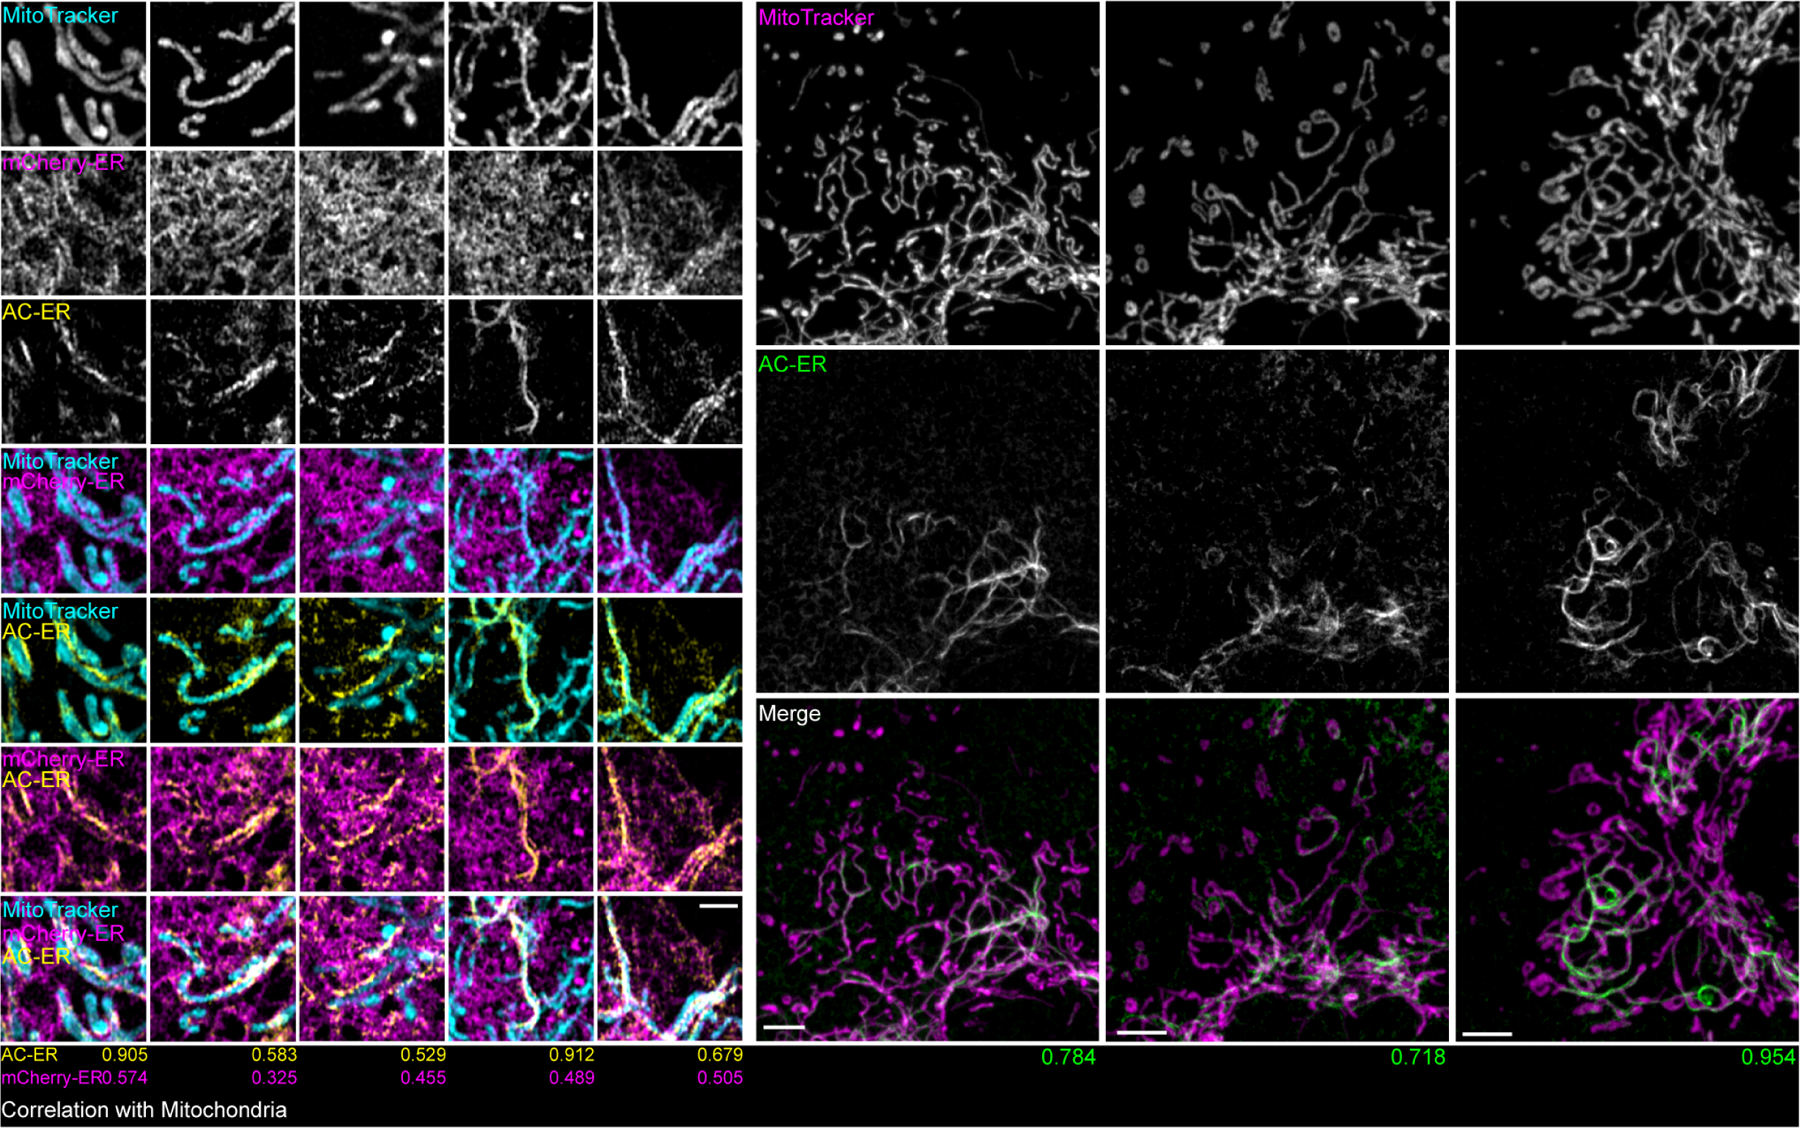
Left: five high magnification examples of AC-ER accumulating specifically alongside mitochondria are shown. Note that the mCherry-ER control probe does not specifically accumulate in these regions. The degree of correlation with the MitoTracker channel (Mander’s correlation coefficient) is shown below each example for both the AC-ER and mCherry control probes. Scale bar: 1 µm. Right: three low magnification examples are shown. Maximum intensity projections are shown. Scale bars: 5 µm. These results were reproducible across 21 independent experiments.
Extended Data Figure 2: AC probes provide higher sensitivity and specificity for imaging sub-organellar F-actin accumulation.
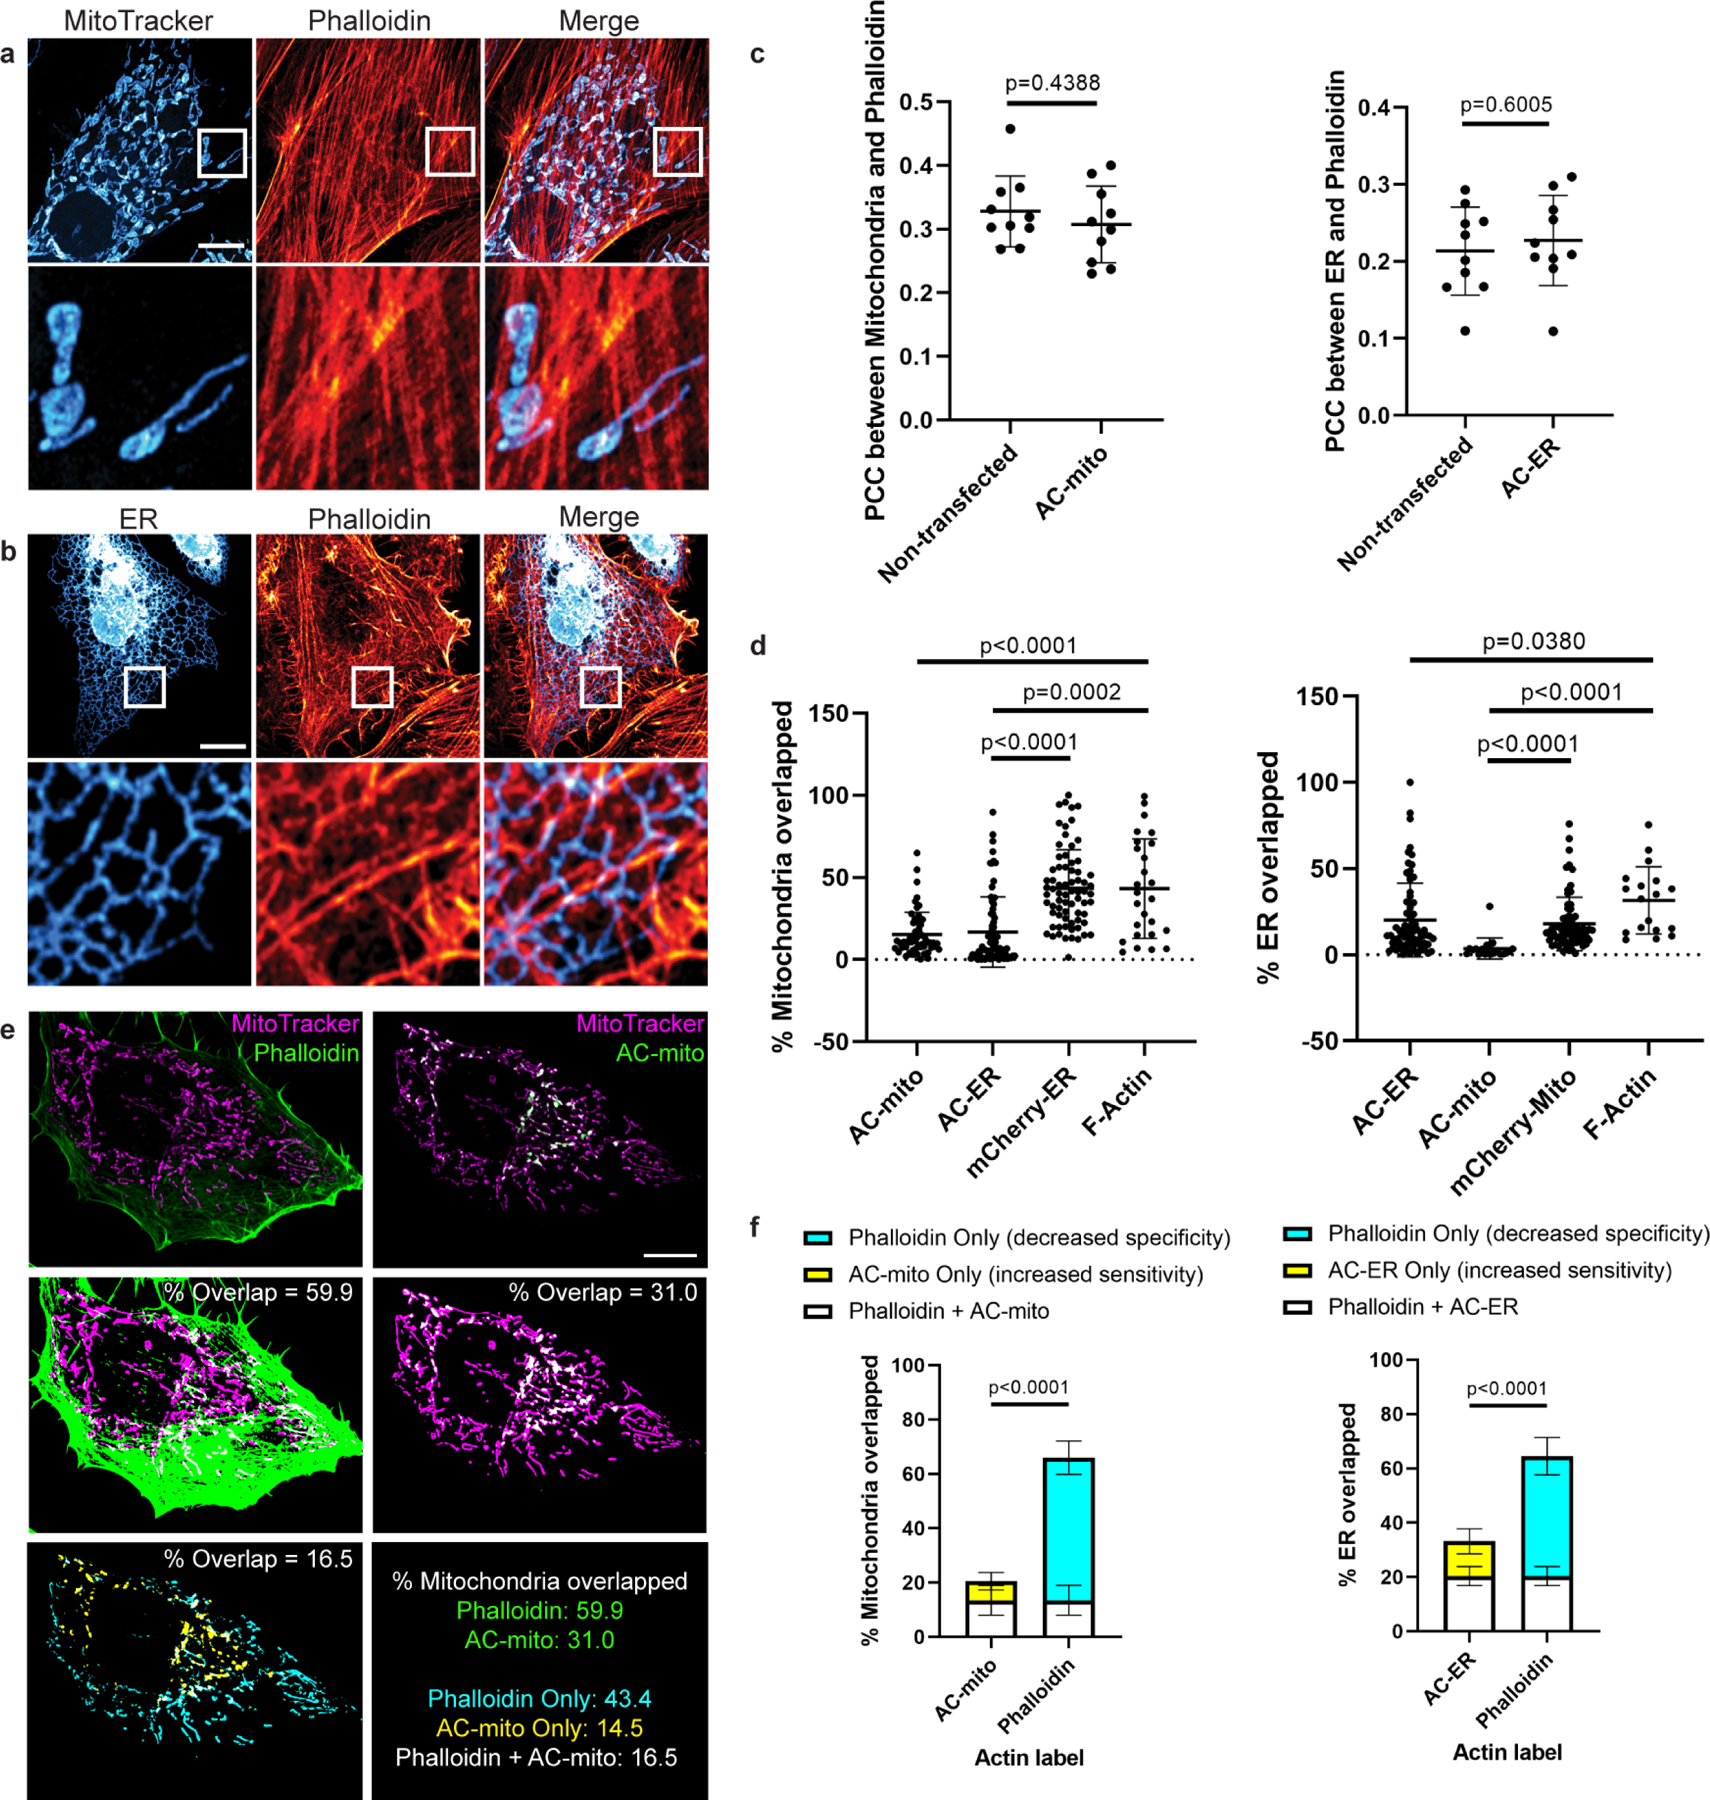
A) Maximum projection of cells stained with phalloidin and MitoTracker do not show obvious sites of accumulation of actin on mitochondria. Scale bar: 10µm. These results were reproducible across 12 independent experiments. B) Maximum projection of cells expressing an ER marker counterstained with phalloidin do not show obvious accumulation of actin on any specific region of the ER. Scale bar: 10µm. These results were reproducible across 12 independent experiments. C) Expression of AC probes does not alter actin accumulation on mitochondria or the ER. Left graph: HeLa cells were either not transfected or transfected with AC-mito, then stained with MitoTracker and phalloidin. Pearson’s correlation coefficient between MitoTracker and phalloidin was determined for each condition. Right graph: HeLa cells were either transfected with mCherry-ER only or co-transfected with mCherry-ER and AC-ER, then stained with phalloidin. Pearson’s correlation coefficient between mCherry-ER and phalloidin was determined for each condition. N = 10 cells per condition. P-values determined by two-tailed Welch’s t-test. D) Quantification of the percentage of mitochondria or ER overlapped by AC probes, mCherry-tagged control probes, or F-actin probes. Our AC probes display more specific labeling compared to their corresponding controls or pan-actin probes. Quantification of overlap was carried out as displayed in E and described under Methods. Mitochondria overlap: AC-mito: n = 53 cells, AC-ER: n = 76 cells, mCherry-ER: n = 71 cells, F-actin: n = 26 cells. ER overlap: AC-mito: n = 20 cells, AC-ER: n = 73 cells, mCherry-mito: n = 71 cells, F-actin: n = 18 cells. P-values determined by two-tailed Welch’s t-test. E) An example of a HeLa cell expressing AC-mito and stained with MitoTracker and phalloidin. Scale bar: 10µm. The top row shows standard images of the cell. The center row shows the corresponding mitochondrial area in magenta and phalloidin or AC-mito area in green. Areas of overlap are shown in white and quantified. The lower left panel displays the area of overlap between mitochondria and phalloidin in cyan and the area of overlap between mitochondria and AC-mito in yellow. The area of overlap between the two is shown in white and quantified. The lower right panel summarizes the qunatification for this example. Green: percentage of mitochondria overlapped by phalloidin or AC-mito. Cyan: percentage of mitochondria overlapped by only phalloidin. This is the proportion of non-specific phalloidin overlap. Yellow: percentage of mitochondria overlapped by only AC-mito. This represents the proportion of actin that phalloidin lacks the sensitivity to detect. White: percentage of mitochondria overlapped by both phalloidin and AC-mito. These results were reproducible across 12 independent experiments. F) Further quantification of E across multiple cells either transfected with AC-mito and labelled with MitoTracker and phalloidin (left graph) or co-transfected with AC-ER and mCherry-ER and labelled with phalloidin (right graph). Averages and standard deviation are shown. N = 10 cells per condition. P-values determined by the two-tailed ratio paired t-test.
Extended Data Figure 3: AC-mito expression does not alter endogenous Fis1 localization to mitochondria.

Maximum projection of cells expressing AC-mito and non-transfected cells show similar levels of endogenous anti-Fis1 immunofluorescence. Note that the anti-Fis1 antigen is the Fis1 N-terminus, which is not present in the AC-mito protein, which contains only the C-terminus of Fis1. Scale bar: 20 µm. These results were reproducible across 2 independent experiments.
Extended Data Figure 4: Alternate membrane-targeting and actin-binding motifs yield similar results.
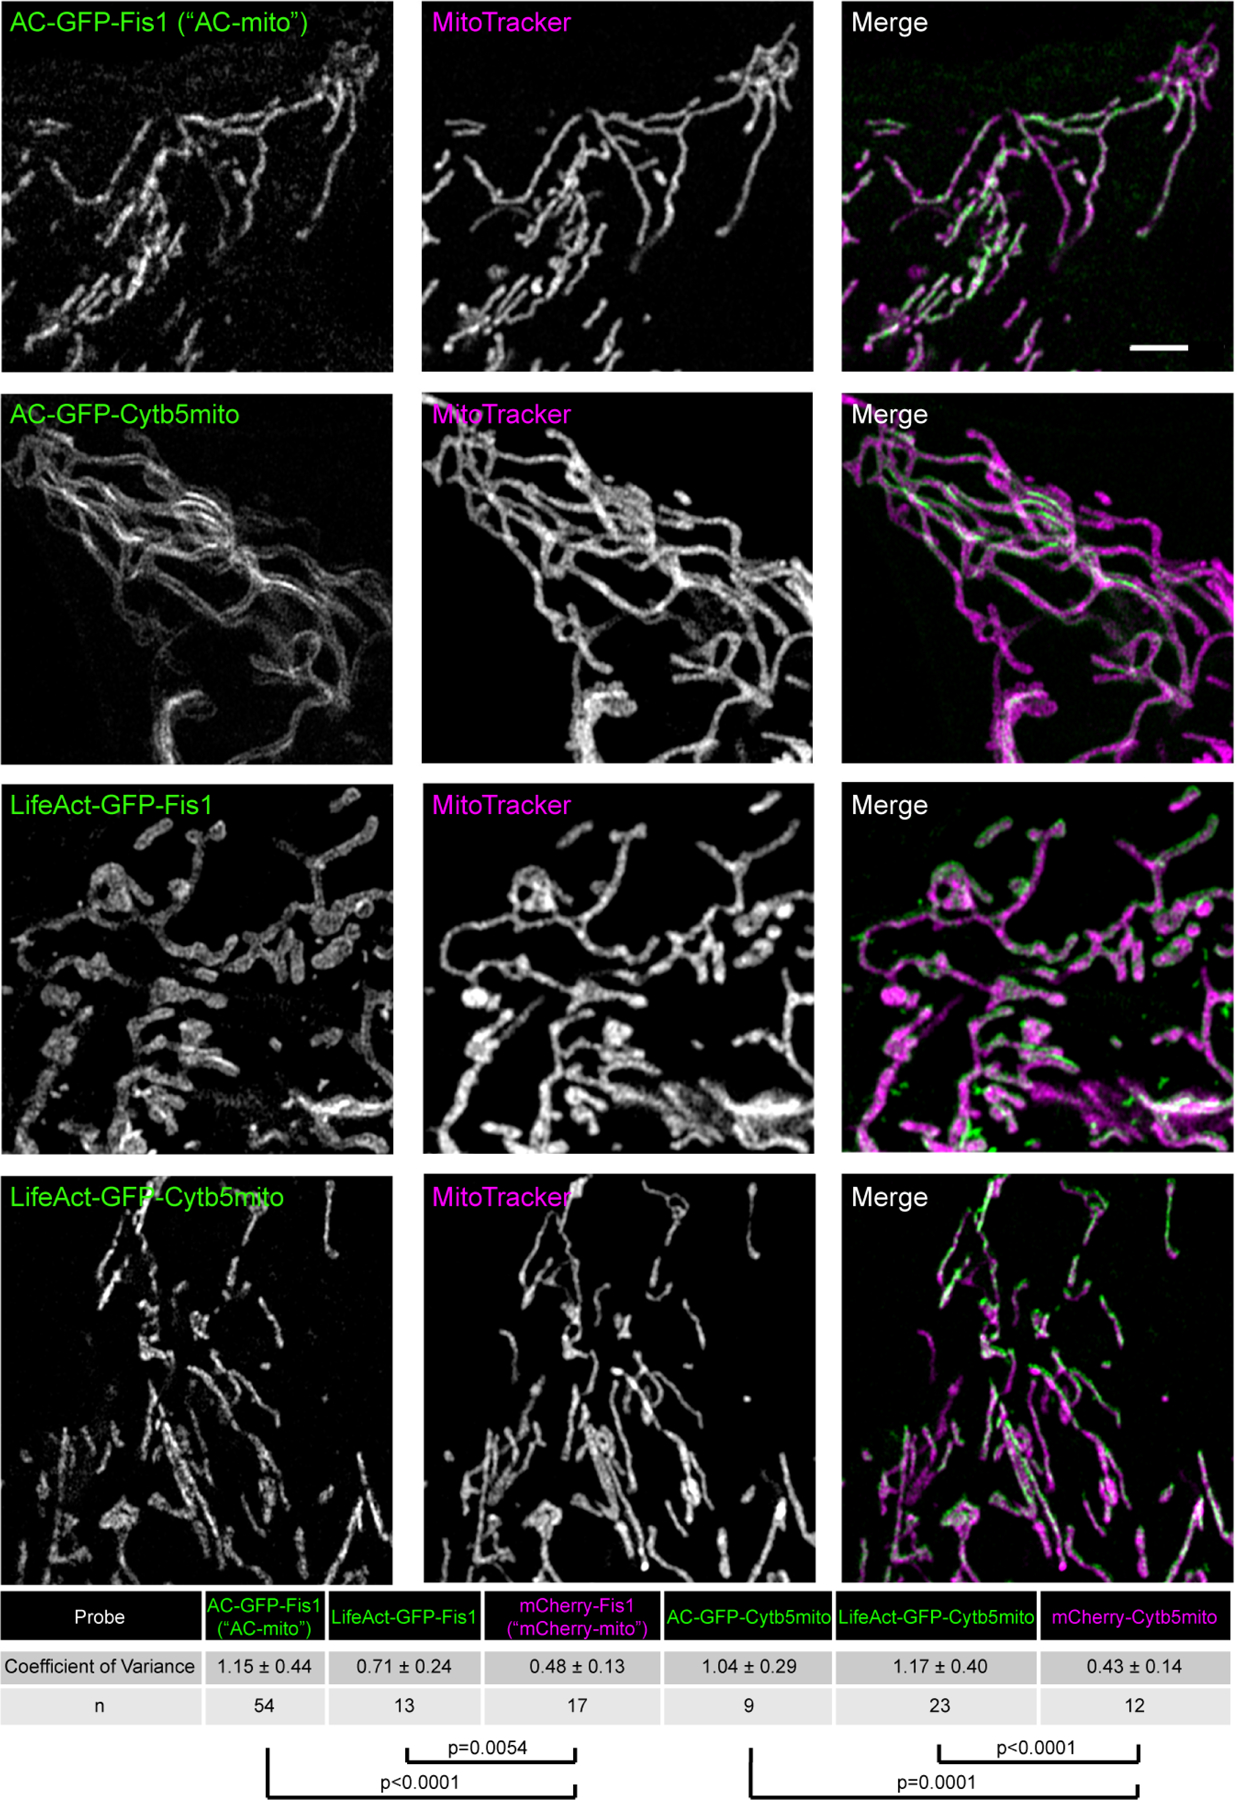
Switching the actin nanobody motif with LifeAct (Fis1-LifeAct-GFP) yields similarly increased accumulation compared to control constructs as quantified by the coefficient of variance. Switching the Fis1 mitochondrial outer membrane targeting sequence for Cytb5mito (Cytb5mito-AC-GFP) also yields similar results. Scale bar: 5 µm. The table displays the degree of accumulation as quantified by the average coefficient of variance (standard deviation/mean pixel intensity in the mitochondrial region) ± the standard deviation for each probe compared to control probes. N indicates the number of cells analyzed. P-values determined by two-tailed Welch’s t-test. These results were reproducible across 7 independent experiments.
Extended Data Figure 5: Comparison of AC probe dynamics in “accumulated” vs. “diffuse” regions.
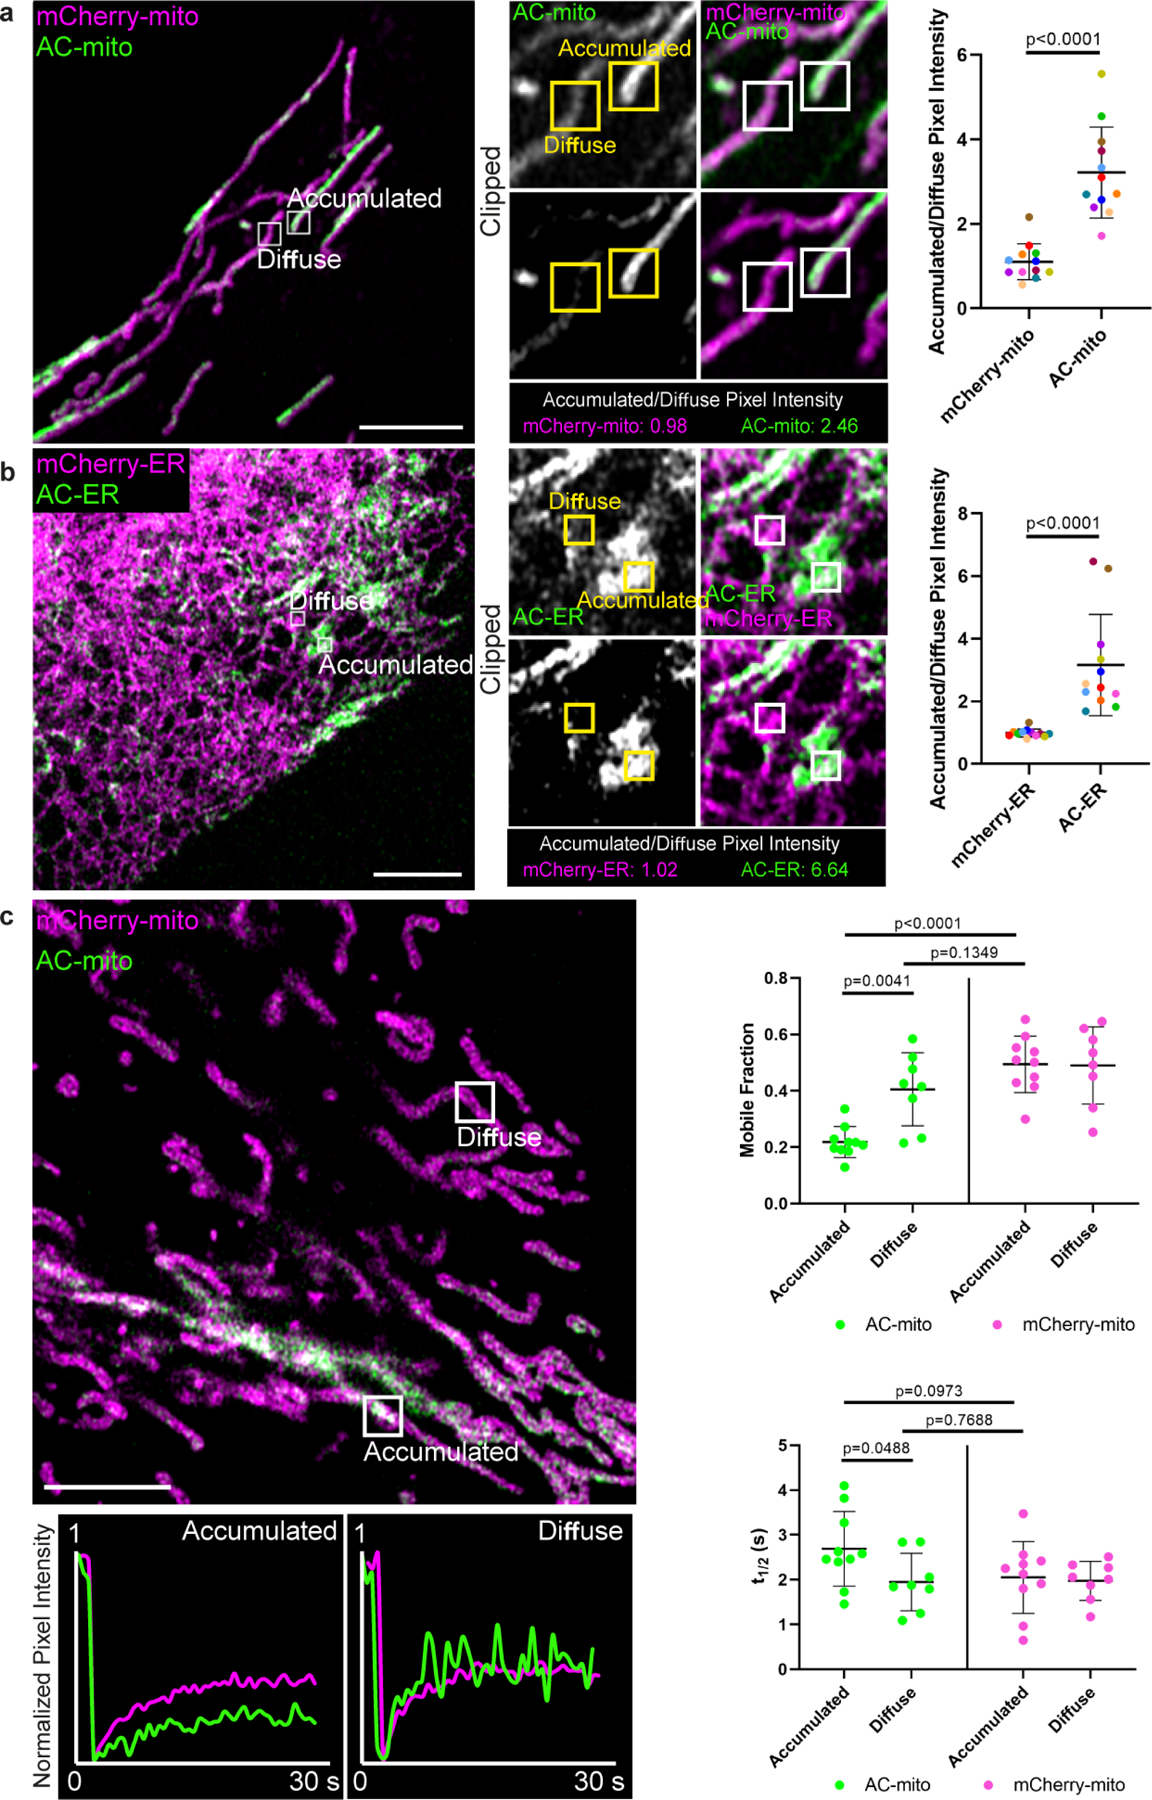
A) Example of a cell containing regions with accumulated vs. diffuse AC probe localization. Regions with AC-mito accumulation (“Accumulated”) and without AC-mito accumulation (“Diffuse”) are indicated. Panels in the lower row (“Clipped”) display thresholded AC-mito signal (displaying only the top 25% signal) while the top row displays the same region without thresholding. Scale bar: 5 µm. The mean pixel intensity in boxed regions was determined for AC-mito and the mCherry-mito control probe and the ratio was calculated (mean pixel intensity in accumulated region/mean pixel intensity in diffuse region). The results for the example shown are displayed below the panels and quantification across multiple cells (n= 12 cells) is displayed in the scatter plot. Each dot color corresponds to an individual region in which pixel intensity was measured. P-values determined via a two-tailed ratio paired t-test. These results were reproducible across 9 independent experiments. B) Example of AC-ER accumulation. Same as A, showing results for AC/mCherry-ER. C) AC-mito and mCherry-mito have similar mobility in diffuse regions. FRAP was performed on the indicated accumulated and diffuse regions. Fluorescence recovery over time for the example shown is displayed beneath the image. Quantification of the mobile fraction (top scatter plot) and t1/2 (bottom scatter plot) across multiple cells is also displayed. Accumulated regions: n = 10 cells, diffuse regions: n = 8 cells. P-values determined by two-tailed Welch’s t-test. These results were reproducible across 3 independent experiments.
Extended Data Figure 6: Actin depolymerization destroys AC-mito and AC-ER accumulation.
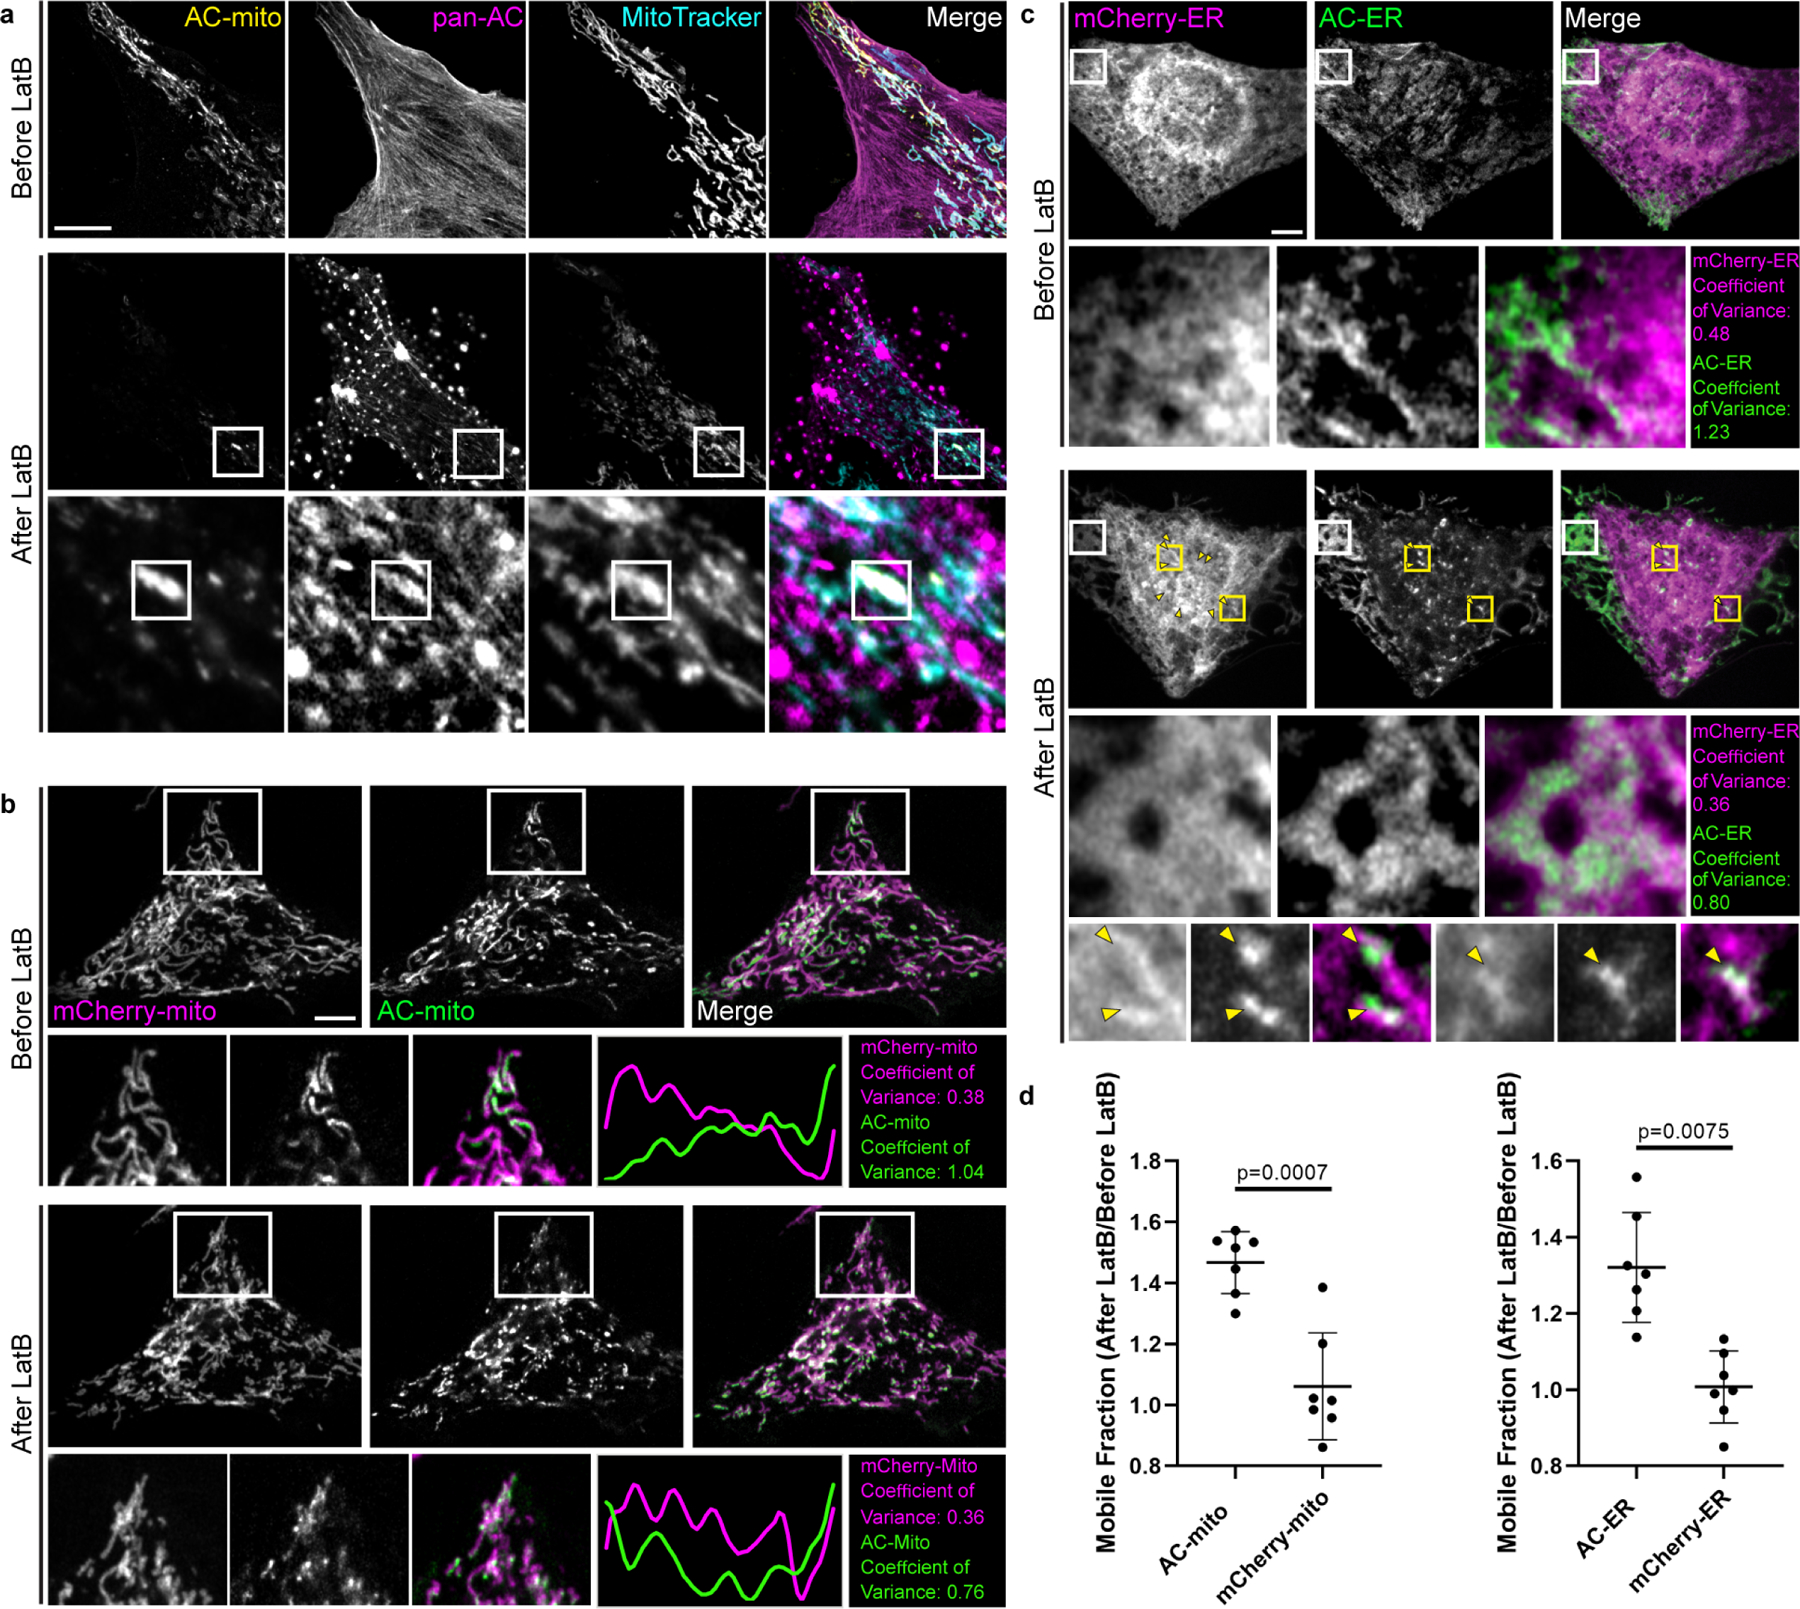
A) U2OS cells stained with MitoTracker and expressing AC-mito and pan-AC (cytoplasmic AC-tagRFP) were imaged before and after treatment with 2 µM Latrunculin B (LatB) for 30 minutes. After LatB treatment, AC-mito displayed significantly reduced accumulation at specific regions on mitochondria. This loss of accumulation was observed in all cells imaged after treatment with LatB or Cytochalasin D (n = 6 cells). The magnified images in the bottom row show an example of LatB treatment causing actin aggregates which colocalize with AC-mito. Maximum intensity projections are shown. Scale bar: 5 µm. These results were reproducible across 5 independent experiments. B) HeLa cells co-expressing AC-mito and the mCherry-mito control probe before and after treatment with LatB including example insets showing loss of AC-mito accumulation following LatB treatment. The yellow line in the merged inset indicates the area used to generate the line scan. The coefficient of variance was calculated before and after LatB treatment in the boxed region as described under Methods. Scale bar: 5 µm. These results were reproducible across 5 independent experiments. C) HeLa cells co-expressing AC-ER and the mCherry-ER control probe before and after treatment with LatB. The white box marks an area where AC-ER accumulation is lost following LatB treatment. The coefficient of variance for mCherry/AC-ER was calculated before and after LatB treatment in the white boxed region. Yellow arrows label areas of mCherry/AC-ER aggregation that result from LatB treatment. Higher magnification versions of some of these regions (marked by the yellow boxes) are shown in the bottom row. Scale bar: 5 µm. These results were reproducible across 5 independent experiments. D) FRAP-based quantificaton of mobile fractions before and after LatB treatment. FRAP was performed on cells co-expressing the mCherry-mito control probe and AC-mito (left graph) or the mCherry-ER control probe and AC-ER (right graph) before and after treatment with LatB. The mobile fraction of each probe was calculated and is displayed as a ratio of the mobile fracton after LatB treatment/the mobile fraction before LatB treatment. The AC probe mobility is increased following LatB treatment while the mobility of the corresponding mCherry control probes is unchanged. N = 7 cells per condition. P-values determined by two-tailed ratio paired t-test. These results were reproducible across 3 independent experiments.
Extended Data Figure 7: AC-ER dynamically co-accumulates with F-actin during actin wave cycling.
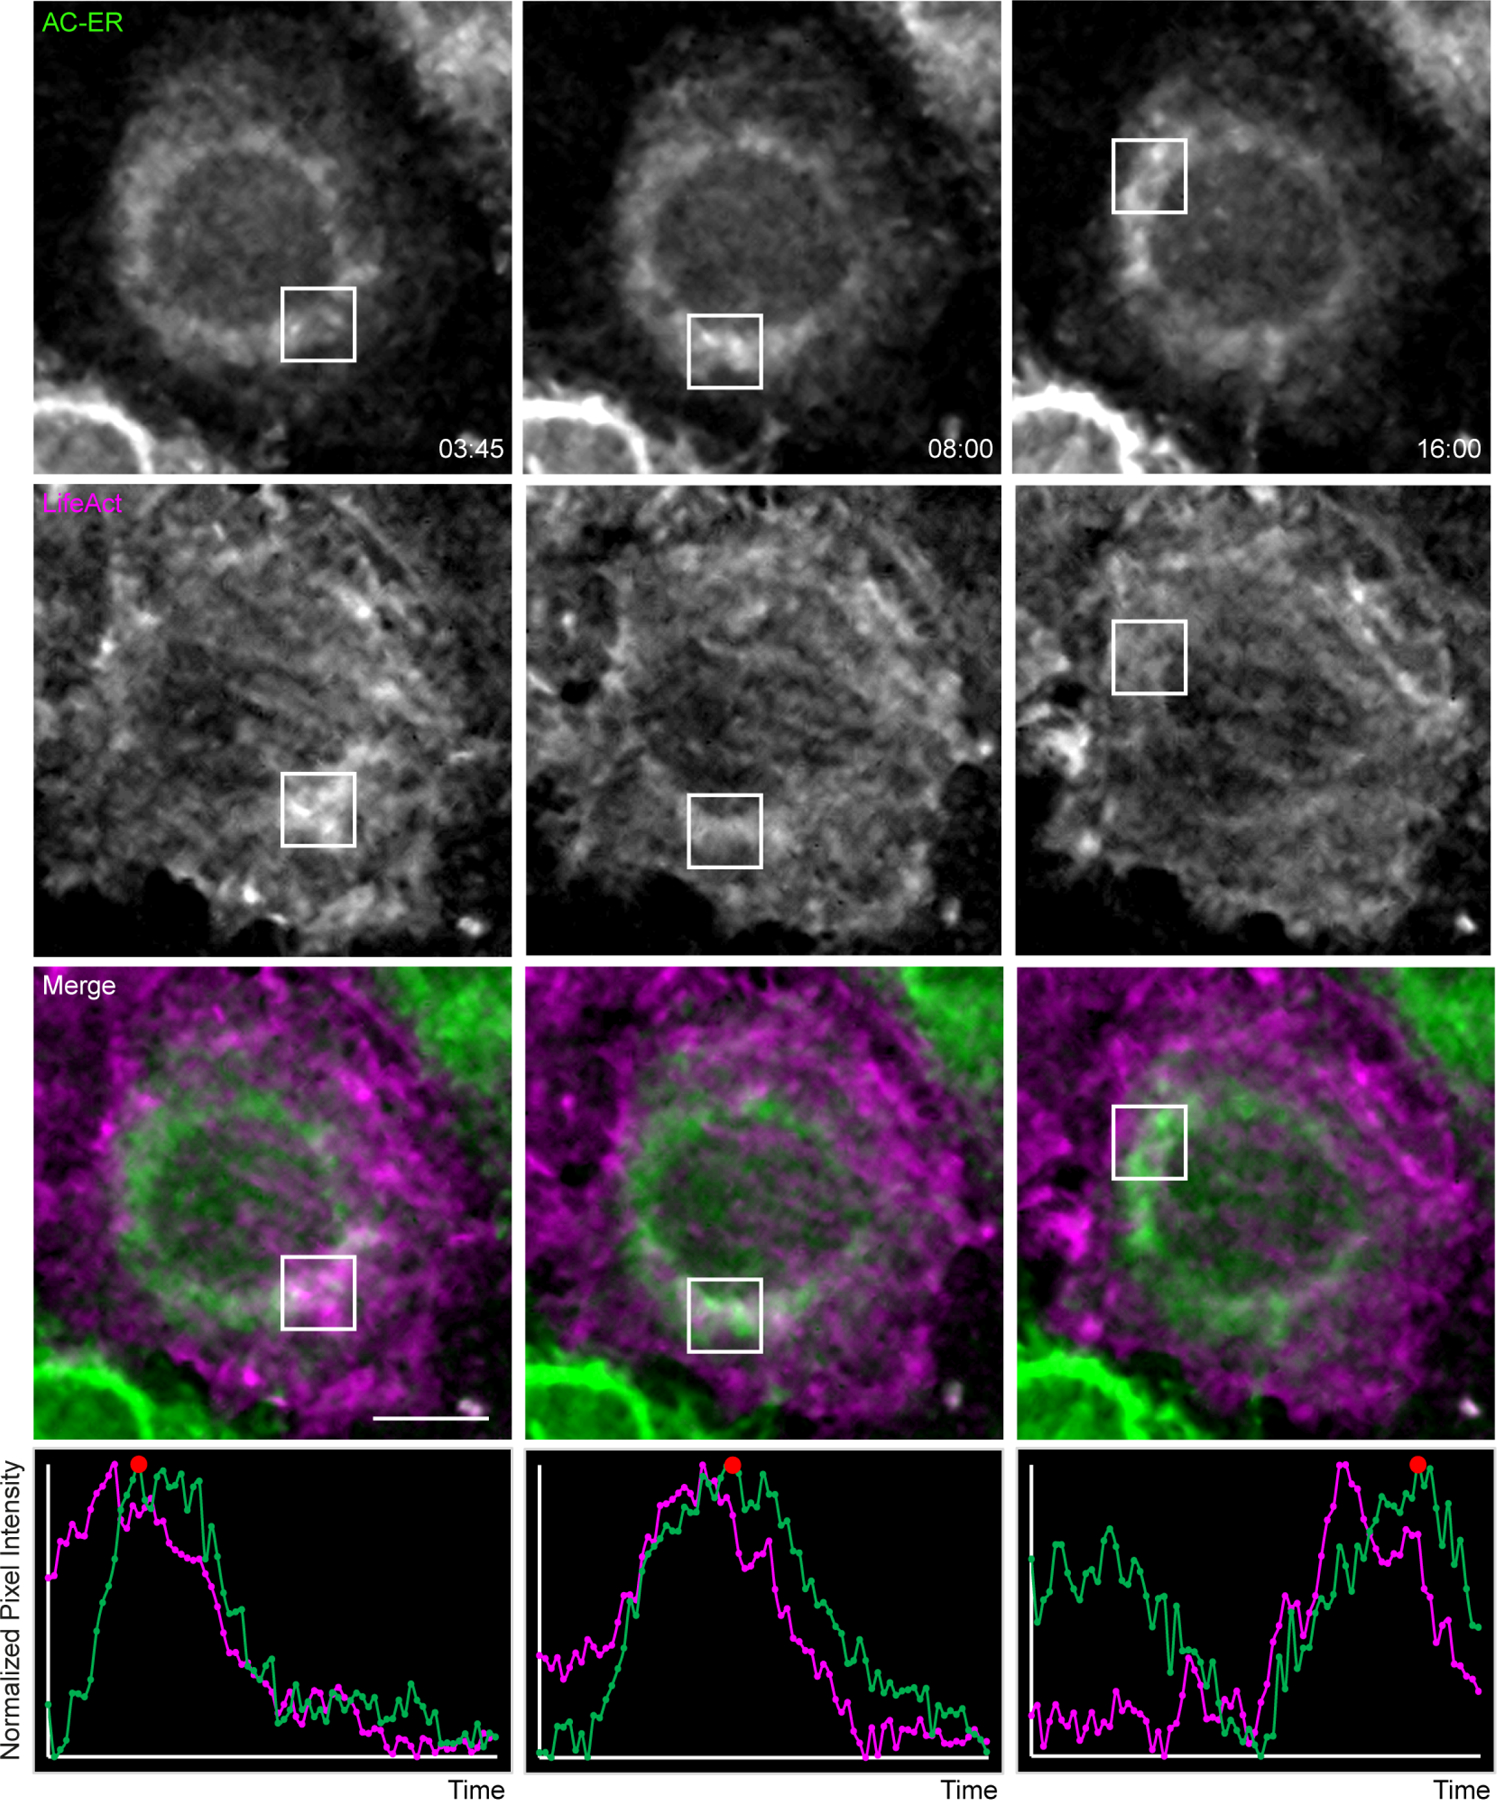
Actin waves were imaged in HeLa cells co-expressing AC-ER and the F-actin marker LifeAct. Boxes mark regions of LifeAct accumulation at different timepoints. Graphs displaying normalized pixel intensity over time in the boxed regions are displayed as insets. This figure represents chosen timepoints from Supplementary Videos 8 and 9. The actin wave dynamics are much more easily visualized in the movies. Scale bar: 5 µm. These results were reproducible across 4 independent experiments.
Extended Data Figure 8: Impact of ionomycin treatment on cells expressing AC probes.
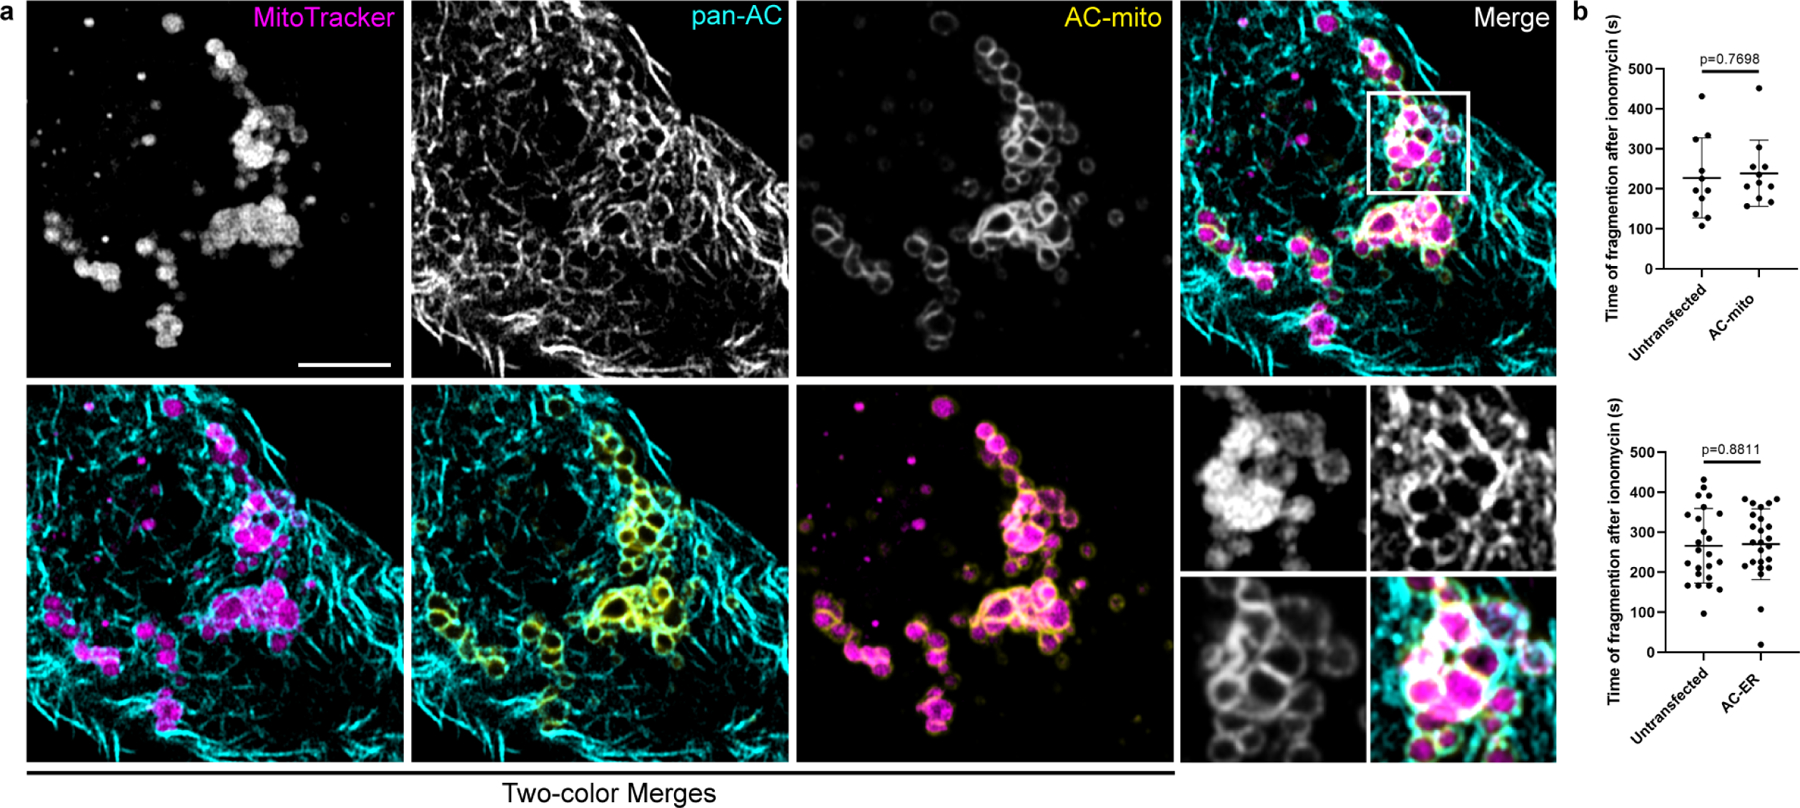
A) HeLa cells stained with MitoTracker and expressing AC-mito and pan-AC (cytoplasmic AC-tagRFP) were treated with 10 µM ionomycin for 10 minutes. Fragmented mitochondria surrounded by both pan-AC and AC-mito can be visualized. Scale bar: 5 µm. These results were reproducible across 5 independent experiments. B) HeLa cells expressing AC-mito or AC-ER and counterstained with MitoTracker were treated with 10 µM ionomycin and imaged for 10 minutes. The time after ionomycin addition when mitochondrial fragmentation became evident was recorded for each cell. Cells from the same field displaying no AC-mito or AC-ER signal were considered untransfected. AC-mito: n= 11 cells, AC-ER: n = 24 cells. P-values determined by two-tailed Welch’s t-test
Extended Data Figure 9: Mitochondria- and ER-associated actin accumulates during Drp1-mediated mitochondrial fission.
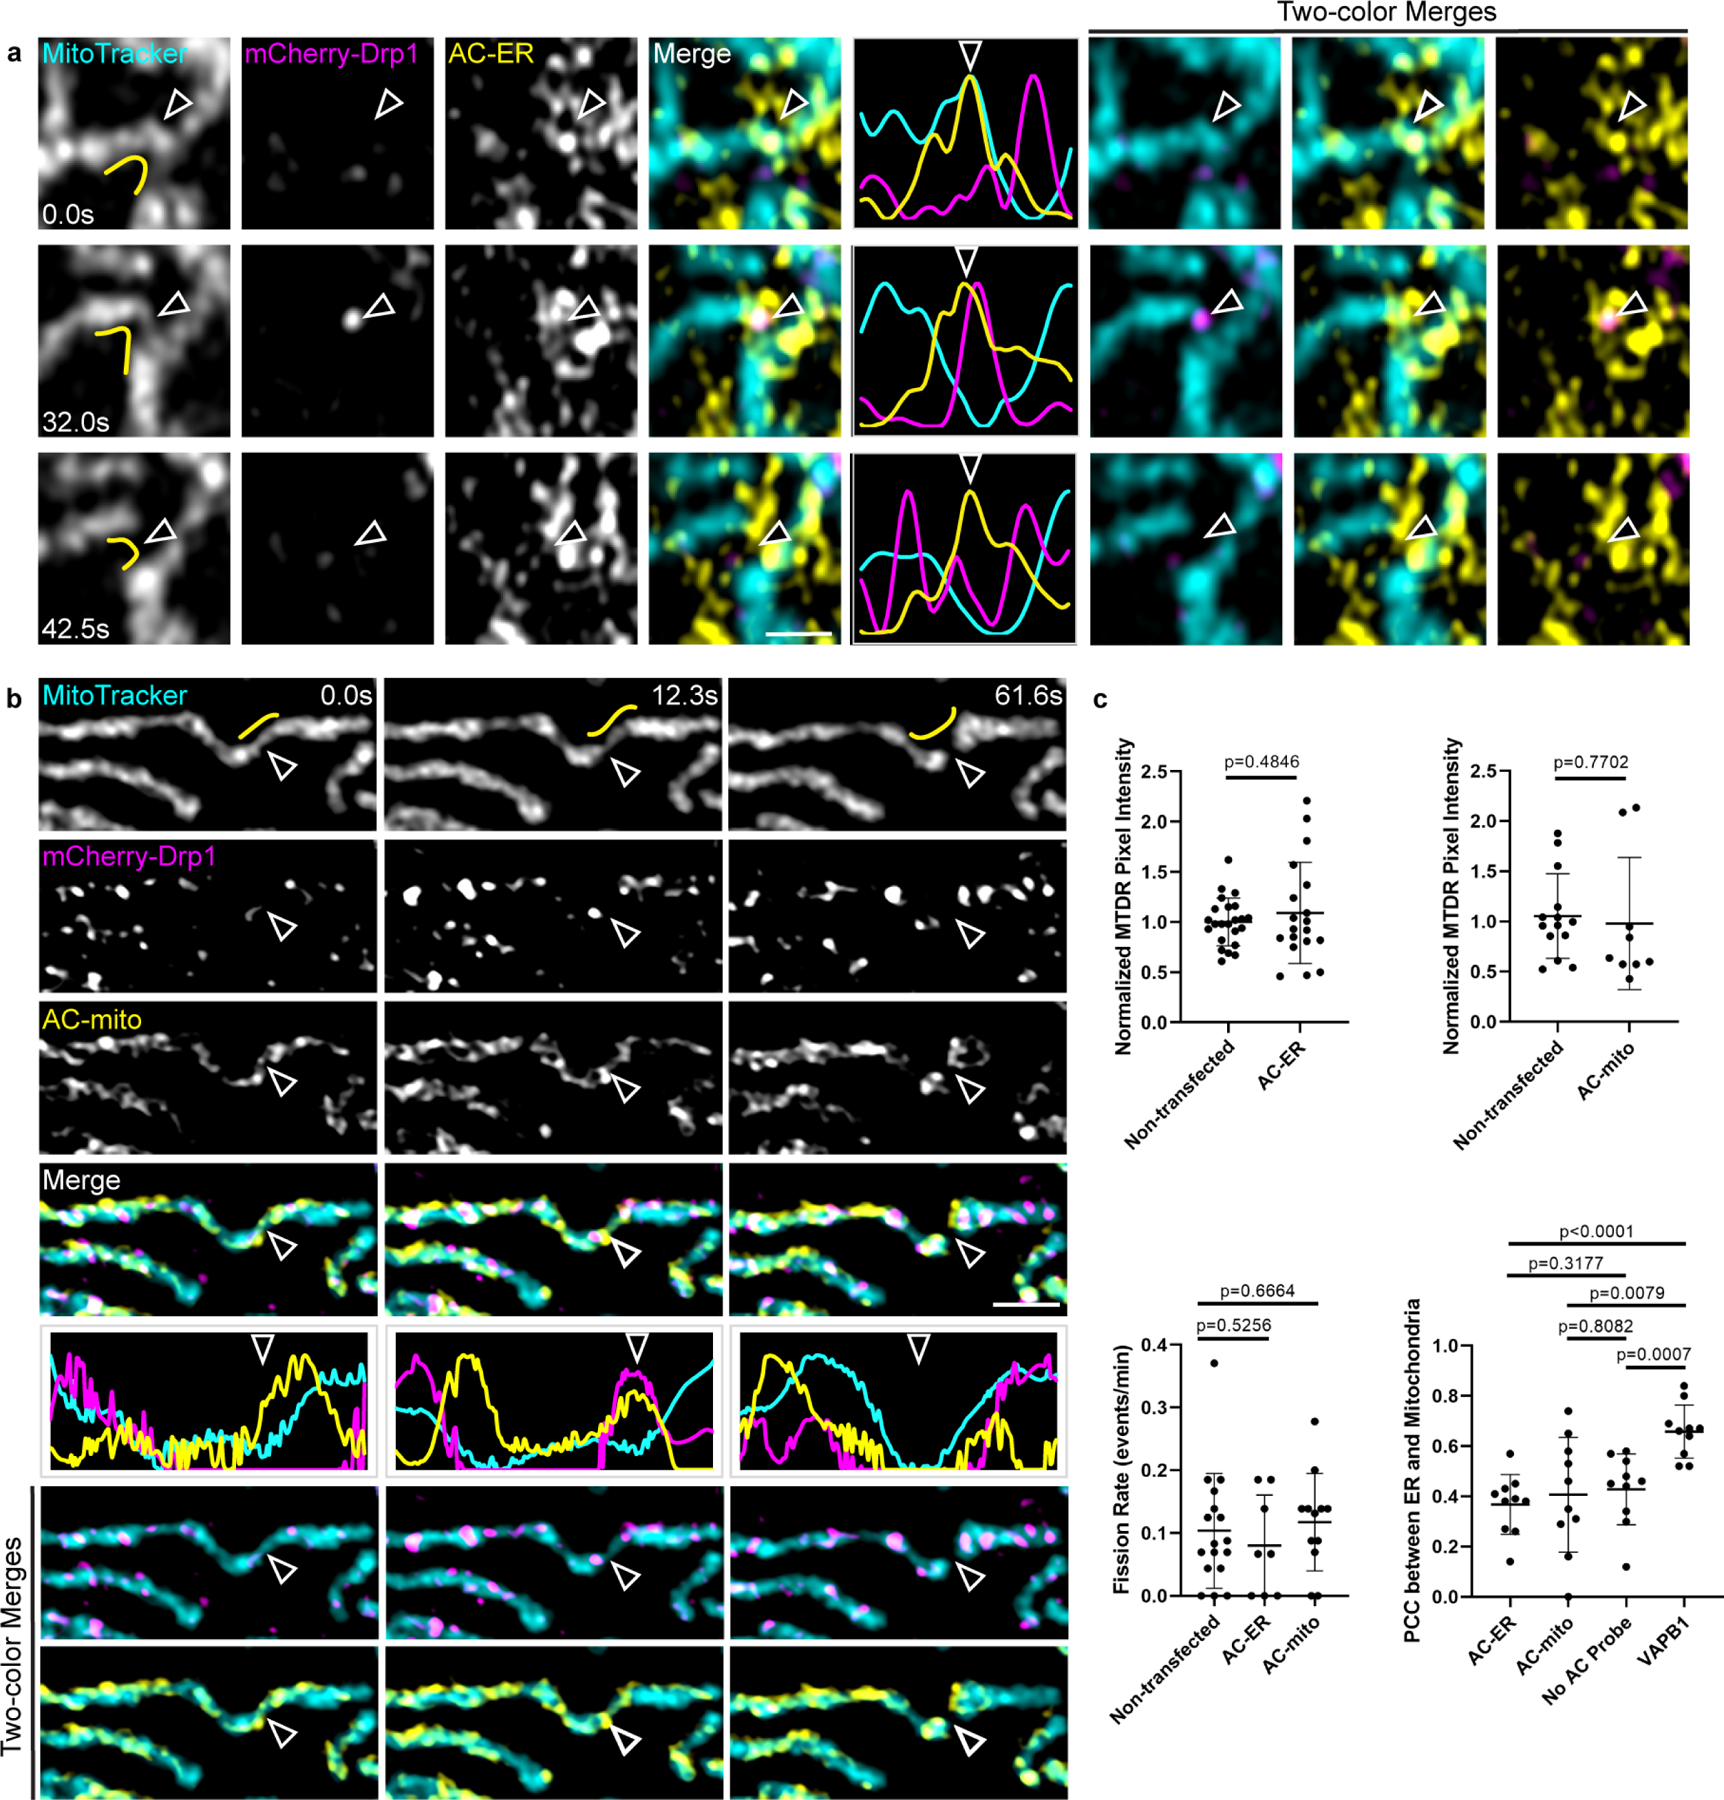
A) AC-ER accumulates prior to Drp1-mediated fission. AC-ER accumulation is evident prior to Drp1 recruitment and mitochondrial fission. Hollow arrows mark the location of mitochondrial fission. Yellow lines in the left column mark the area used to generate the line scans. Scale bar: 1 µm. These results were reproducible across 8 independent experiments. B) AC-mito accumulates prior to Drp1-mediated fission. Same as A with cells expressing AC-mito instead of AC-ER. C) Expression of AC probes does not alter mitochondrial membrane potential, mitochondrial fission rate, or ER-mitochondria contact sites. Top graphs: the pixel intensity of MitoTracker Deep Red (MTDR) was measured in cells that were not transfected vs. neighboring cells expressing AC-mito/ER and normalized as described under Methods. Left graph: non-transfected: n = 23 cells, AC-ER: n = 19 cells. Right graph: non-transfected: n = 14 cells, AC-mito: n = 9 cells. P-values determined by two-tailed Welch’s t-test. Bottom left graph: the number of fission events were counted in cells that were not transfected or in cells expressing AC-mito/ER. Non-transfected: n = 17 cells, AC-ER: n = 8 cells, AC-mito: n = 12 cells. P-values determined by two-tailed Welch’s t-test. Bottom right graph: HeLa cells were transfected with mCherry-ER alone “No AC Probe”, AC-ER+mCherry-ER “AC-ER”, AC-mito+mCherry-ER “AC-mito, or VAPB1-Halo+mCherry-ER “VAPB1” (positive control for changing ER-mitochondria contacts) and counterstained with MitoTracker. A region of the cell was selected as described under Methods and Pearson’s correlation coefficient between MitoTracker and mCherry-ER was determined. N = 10 cells per condition. P-values determined by two-tailed Welch’s t-test.
Extended Data Figure 10: Mitochondria- and ER-associated actin accumulates during ER-mediated mitochondrial fission.
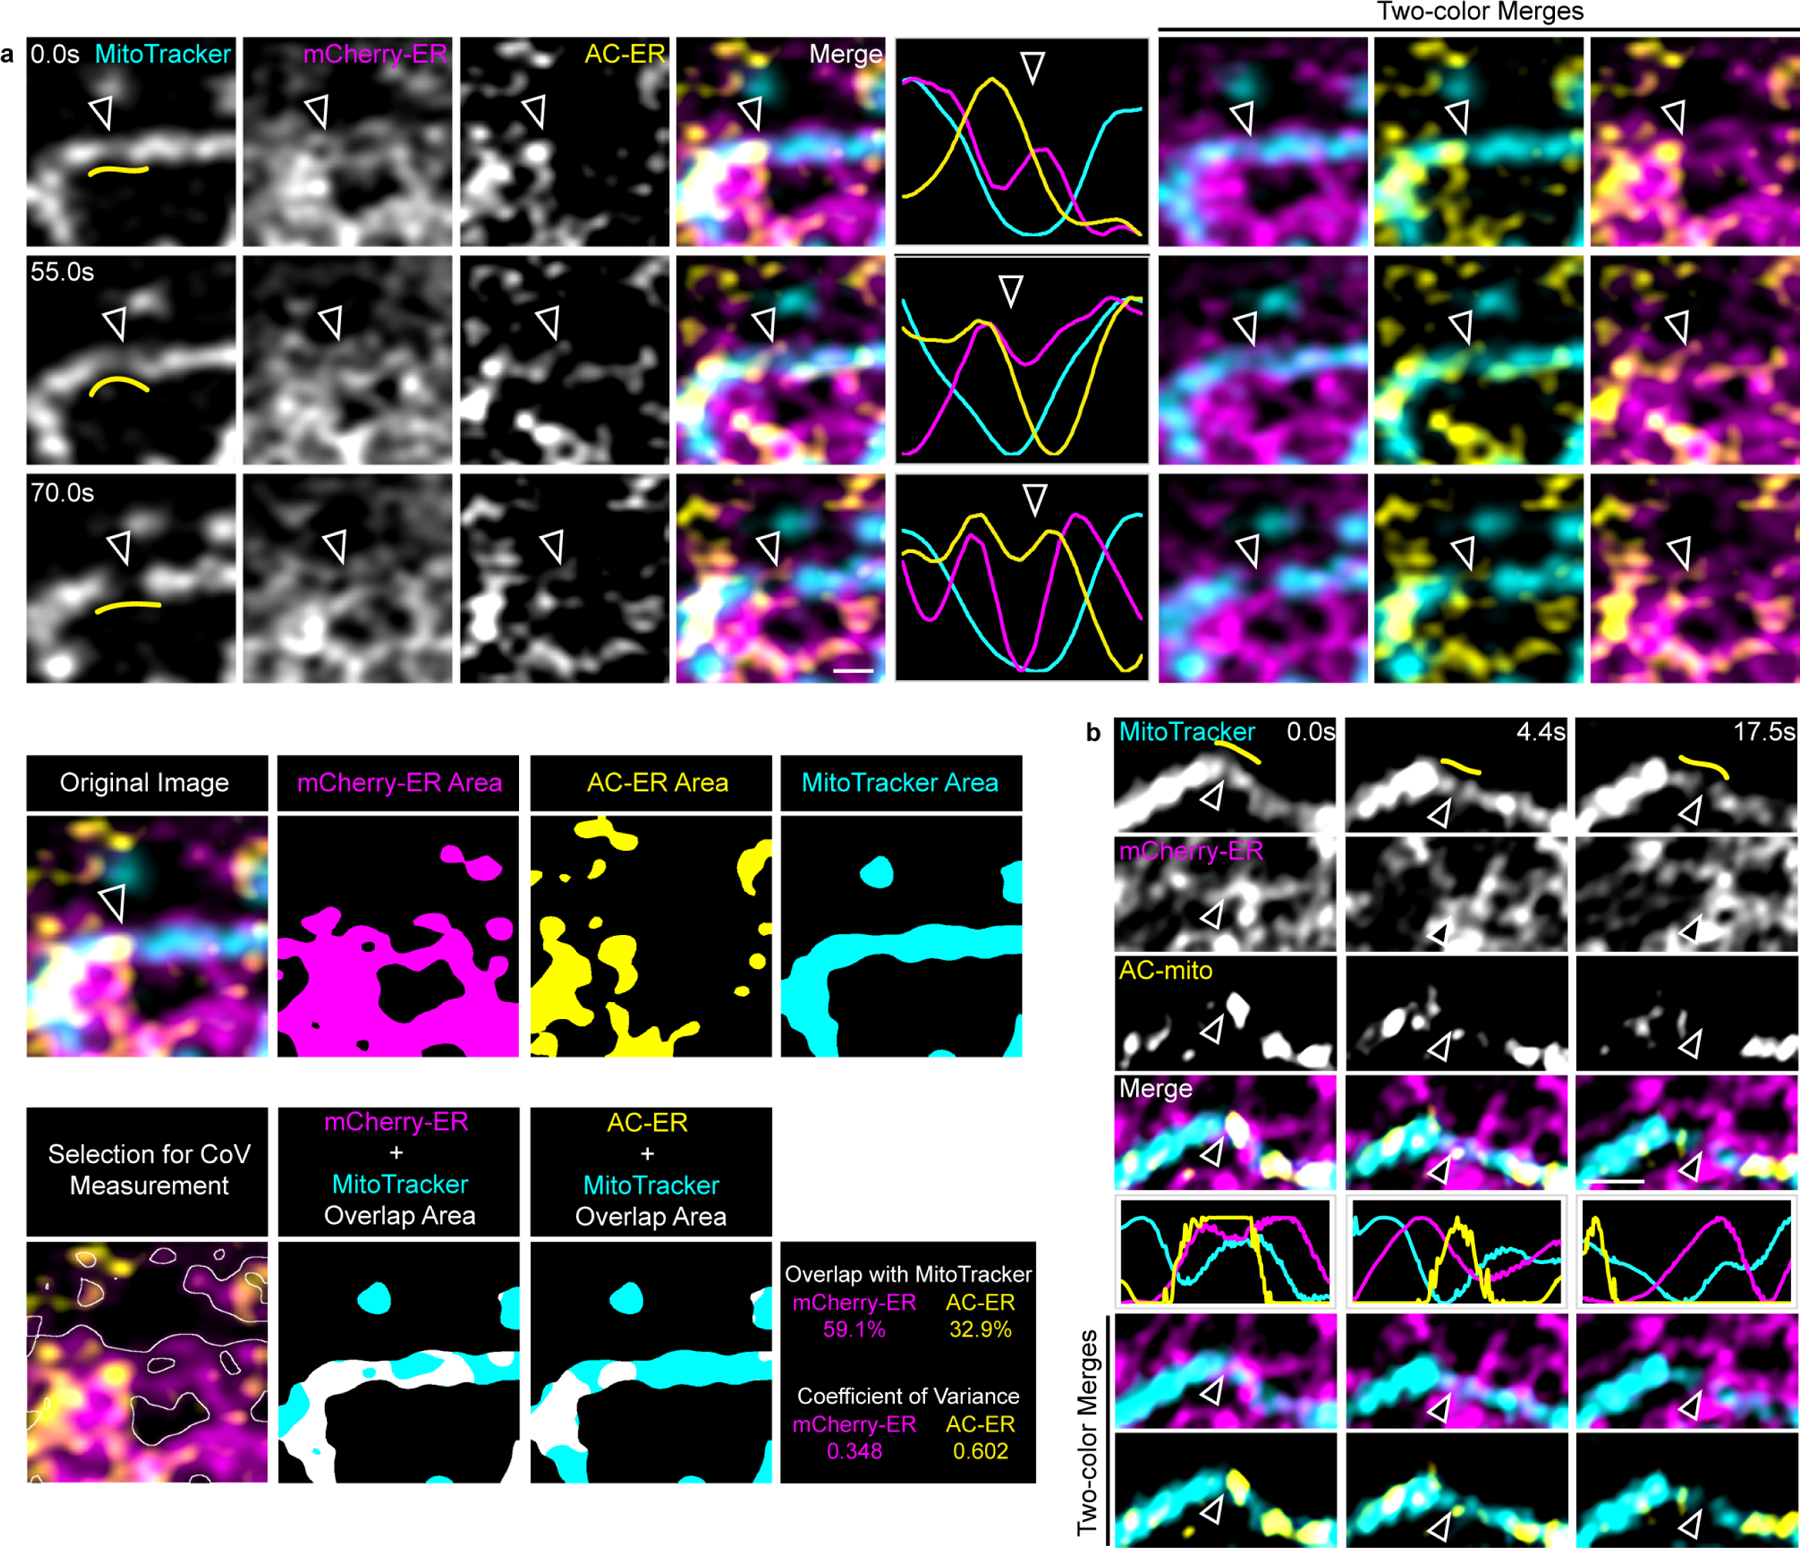
A) AC-ER specifically accumulates at fission sites prior to ER-mediated fission. AC-ER accumulation is evident during ER-mediated mitochondrial fission. Hollow arrows mark the location of mitochondrial fission. Yellow lines in the left column mark the area used to generate the line scans. Scale bar: 1 µm. Example images of the areas used to determine the degree of MitoTracker overlap and coefficient of variance for mCherry/AC-ER and the resulting values are also shown. These results were reproducible across 19 independent experiments. B) AC-mito accumulates prior to ER-mediated fission. Same as A with cells expressing AC-mito instead of AC-ER.
Supplementary Material
Supplementary Video 1: Live cell imaging of mitochondria-associated actin. A Hap1 cell expressing AC-mito counterstained with MitoTracker shows dynamic subdomains of actin enrichment on mitochondria.
Supplementary Video 2: Live cell imaging of mitochondria-associated actin. A Hap1 cell expressing AC-mito counterstained with MitoTracker shows dynamic subdomains of actin enrichment on mitochondria.
Supplementary Video 3: Live cell imaging of ER-associated actin. A Hap1 cell expressing AC-ER counterstained with MitoTracker shows dynamic subdomains of actin enrichment on the ER, in particular at ER-mitochondria contact sites.
Supplementary Video 4: Live cell imaging of ER-associated actin. A Hap1 cell expressing AC-ER counterstained with MitoTracker shows dynamic subdomains of actin enrichment on the ER, in particular at ER-mitochondria contact sites.
Supplementary Video 5: FRAP of cell co-expressing AC-mito and mCherry-mito. FRAP of U2OS cells co-expressing AC-mito and mCherry-mito shows that AC-mito is highly mobile but less mobile than mCherry-mito.
Supplementary Video 6: FRAP of cell co-expressing AC-ER and mCherry-ER. FRAP of U2OS cells co-expressing AC-ER and mCherry-ER shows that AC-ER is highly mobile but less mobile than mCherry-ER.
Supplementary Video 7: Live imaging of LifeAct and AC-mito durng actin wave cycling. Co-accumulation of LifeAct and AC-mito is observable in several regions of the cell during actin wave cycling. Scale bar: 5 µm. Graphs display the normalized average pixel intensity over time within the indicated boxed regions. This video corresponds to Figure 2B.
Supplementary Video 8: Live imaging of LifeAct and AC-ER durng actin wave cycling (single cell). Co-accumulation of the F-actin marker LifeAct and AC-ER is observable during actin wave cycling. Scale bar: 5 µm. Graphs display the normalized average pixel intensity over time within the indicated boxed regions. This video corresponds to Extended Data Figure 7.
Supplementary Video 9: Live imaging of LifeAct and AC-ER during actin wave cycling (field of cells). Co-accumulation of LifeAct and AC-ER is concsistently observed during actin wave cycling in multiple cells. The box indicates the cell shown in Extended Data Figure 7 and Supplementary Video 8. Scale bar: 10 µm.
Supplementary Video 10: Live imaging of AC-mito and Halo-mito during mitochondrial fission. Live imaging of AC-mito, Halo-mito (Halo-Fis1), and mitochondria (BFP-mito) in HeLa cells reveals accumulation of mitochondria-associated actin prior to fission. Scale bar: 1 µm. This video corresponds to Figure 2D.
Supplementary Video 11: Live imaging of AC-mito and mitochondrial fragmentaion with ionomycin treatment. Live imaging of AC-mito in HeLa cells counterstained with MitoTracker treated with 10 µM ionomycin reveals mitochondrial fragmentation. Fragmention occurs simultaneously across cells regardless of AC-mito expression. Scale bar: 20 µm.
Supplementary Video 12: Live imaging of AC-ER and mitochondrial fragmentaion with ionomycin treatment. Live imaging of AC-ER in HeLa cells counterstained with MitoTracker treated with 10 µM ionomycin reveals mitochondrial fragmentation. Fragmention occurs simultaneously across cells regardless of AC-ER expression. Scale bar: 20 µm.
Supplementary Video 13: Live imaging of AC-mito during mitochondrial fission. Live imaging of AC-mito in HeLa cells counterstained with MitoTracker reveals accumulation of mitochondria-associated actin prior to fission. Scale bar: 0.5 µm. This video corresponds to Figure 3A.
Supplementary Video 14: Live imaging of AC-ER during mitochondrial fission. Live imaging of AC-ER in HeLa cells co-expressing BFP-mito reveals accumulation of ER-associated actin prior to fission. Scale bar: 1 µm. This montage corresponds to Figure 3B.
Supplementary Video 15: Live imaging of AC-ER during Drp1-mediated mitochondrial fission. Live imaging of AC-ER and mCherry-Drp1 in HeLa cells counterstained with MitoTracker reveals accumulation of ER-associated actin prior Drp1 accumulation and mitochondrial fission. Scale bar: 1 µm. This video corresponds to Extended Data Figure 9A.
Supplementary Video 16: Live imaging of AC-mito during Drp1-mediated mitochondrial fission. Live imaging of AC-mito and mCherry-Drp1 in HeLa cells counterstained with MitoTracker reveals accumulation of mitochondria-associated actin prior Drp1 accumulation and mitochondrial fission. Scale bar: 1 µm. This video corresponds to Extended Data Figure 9B.
Supplementary Video 17: Live imaging of AC-mito and mCherry-mito during mitochondrial fission. Live imaging of AC-mito and mCherry-mito in HeLa cells counterstained with MitoTracker reveals accumulation of mitochondria-associated actin prior to mitochondrial fission. Scale bar: 1 µm. This video corresponds to Supplementary Figure 5.
Supplementary Video 18: Live imaging of AC-ER during ER-mediated mitochondrial fission. Live imaging of AC-ER and mCherry-ER in HeLa cells counterstained with MitoTracker reveals accumulation of ER-associated actin prior to ER-mediated mitochondrial fission. Scale bar: 1 µm. This video corresponds to Extended Data Figure 10A.
Supplementary Video 19: Live imaging of AC-mito during ER-mediated mitochondrial fission. Live imaging of AC-mito and mCherry-ER in HeLa cells counterstained with MitoTracker reveals accumulation of mitochondria-associated actin prior to ER-mediated mitochondrial fission. Scale bar: 1 µm. This video corresponds to Extended Data Figure 10B.
Supplementary Video 20: Example of artifact resulting from AC-mito overexpression. Live imaging of AC-mito in a HeLa cell counterstained with MitoTracker. Mild mitochondrial clustering and a decrease in mitochondrial movement is evident in the perinuclear region coinciding with a high degree of AC-mito signal. Scale bar: 10 µm.
Supplementary Video 21: Live imaging of AC-mito and AC-ER during mitochondrial fission. Live imaging of AC-mito and AC-ER in HeLa cells counterstained with MitoTracker reveals accumulation of mitochondria-associated actin prior to accumulation of ER-associated actin. Scale bar: 1 µm. This video corresponds to Figure 3D.
Supplementary Figure 1: Montage of AC-mito accumulation during mitochondrial fission. AC-mito accumulation prior to mitochondrial fission is shown across 20 time points. Scale bar: 0.5 µm. This montage corresponds to Figure 3A.
Supplementary Figure 2: Montage of AC-ER accumulation during mitochondrial fission. AC-ER accumulation prior to mitochondrial fission is shown across 20 time points. Mitochondria are labeled with BFP-mito. Scale bar: 0.5 µm. This montage corresponds to Figure 3B.
Supplementary Figure 3: Montage of AC-ER accumulation during Drp1-mediated mitochondrial fission. AC-ER accumulation prior to Drp1 recruitment and mitochondrial fission is shown across 20 time points. Scale bar: 0.5 µm. This montage corresponds to Extended Data Figure 9A.
Supplementary Figure 4: Montage of AC-mito accumulation during Drp1-mediated mitochondrial fission. AC-mito accumulation prior to Drp1 recruitment and mitochondrial fission is shown across 20 time points. Scale bar: 0.5 µm. This montage corresponds to Extended Data Figure 9B.
Supplementary Figure 5: Mitochondria-associated actin accumulates specifically at mitochondrial fission sites. AC-mito accumulation is evident at sites of mitochondrial fission. Hollow arrows mark the location of mitochondrial fission. Yellow lines in the left column mark the area used to generate the line scans. Scale bar: 1 µm. Example images of the areas used to determine the degree of MitoTracker overlap and coefficient of variance for mCherry/AC-mito and the resulting values are also shown.
Supplementary Figure 6: Montage of AC-mito accumulation during mitochondrial fission. AC-mito accumulation prior to mitochondrial fission is shown across 20 time points. Scale bar: 0.5 µm. This montage corresponds to Supplementary Figure 5.
Supplementary Figure 7: Montage of AC-ER accumulation during ER-mediated mitochondrial fission. AC-ER accumulation prior to ER-mediated mitochondrial fission is shown across 20 time points. Scale bar: 0.5 µm. This montage corresponds to Extended Data Figure 10A.
Supplementary Figure 8: Montage of AC-mito accumulation during ER-mediated mitochondrial fission. AC-mito accumulation prior to ER-mediated mitochondrial fission is shown across 20 time points. Scale bar: 0.5 µm. This montage corresponds to Extended Data Figure 10B.
Supplementary Figure 9: Montage of AC-mito and AC-ER accumulation during mitochondrial fission. AC-mito accumulation followed by AC-ER accumulation, followed by mitochondrial fission is shown across 35 time points. Scale bar: 0.5 µm. This montage corresponds to Figure 3D.
Supplementary Table 1: Primers and plasmids used to generate the expression constructs for these studies.
Acknowledgements
We are grateful to Stephanie Harada (Salk Institute for Biological Studies) for help with the cartoon diagram for Fig. 1. We would like to also thank Christopher Obara and Jennifer Lippincott-Schwartz (Janelia Farms) for critical feedback and suggestions on the manuscript. We would also like to thank our reviewers for critical comments that greatly improved the quality, rigor, and interpretability of our work. This work was also greatly improved by feedback on our initial bioRxiv preprint received via Twitter. The Waitt Advanced Biophotonics Center is funded by the Waitt Foundation and Core Grant application NCI CCSG (CA014195). This work was supported by the Transgenic Core Facility of the Salk Institute with funding from NIH-NCI CCSG: P30 014195. R.G. laboratory is funded by grants from HFSP RGP0021/2016 and the Cluster of Excellence CIBSS- Centre for Integrative Biological Signaling Studies (DFG, EXC-2189). G.S.S. is supported by NIH grant no. R01 AR069876 and the Salk Institute Audrey Geisel Chair in Biomedical Science. O.A.Q. lab is supported by NIGMS Grant R15 GM119077 and by funding from the University of Richmond School of Arts & Sciences.
Footnotes
Ethics Declaration
The authors declare no competing interests.
Data Availability
The original source data for quantification and the raw imaging data used for all the presented figures and videos will be made available from zenodo.org doi: 10.5281/zenodo.2851619.
References
- 1.Rocchetti A, Hawes C & Kriechbaumer V Fluorescent labelling of the actin cytoskeleton in plants using a cameloid antibody. Plant Methods 10, 12, doi: 10.1186/1746-4811-10-12 (2014). [DOI] [PMC free article] [PubMed] [Google Scholar]
- 2.Melak M, Plessner M & Grosse R Actin visualization at a glance. J Cell Sci 130, 525–530, doi: 10.1242/jcs.189068 (2017). [DOI] [PubMed] [Google Scholar]
- 3.Rapaport D Finding the right organelle. Targeting signals in mitochondrial outer-membrane proteins. EMBO reports 4, 948–952, doi: 10.1038/sj.embor.embor937 (2003). [DOI] [PMC free article] [PubMed] [Google Scholar]
- 4.Riedl J et al. Lifeact: a versatile marker to visualize F-actin. Nat Methods 5, 605–607, doi: 10.1038/nmeth.1220 (2008). [DOI] [PMC free article] [PubMed] [Google Scholar]
- 5.Sprague BL & McNally JG FRAP analysis of binding: proper and fitting. Trends in cell biology 15, 84–91, doi: 10.1016/j.tcb.2004.12.001 (2005). [DOI] [PubMed] [Google Scholar]
- 6.Sprague BL, Pego RL, Stavreva DA & McNally JG Analysis of binding reactions by fluorescence recovery after photobleaching. Biophys J 86, 3473–3495, doi: 10.1529/biophysj.103.026765 (2004). [DOI] [PMC free article] [PubMed] [Google Scholar]
- 7.Panza P, Maier J, Schmees C, Rothbauer U & Sollner C Live imaging of endogenous protein dynamics in zebrafish using chromobodies. Development 142, 1879–1884, doi: 10.1242/dev.118943 (2015). [DOI] [PMC free article] [PubMed] [Google Scholar]
- 8.Shirai YM et al. Cortical actin nodes: Their dynamics and recruitment of podosomal proteins as revealed by super-resolution and single-molecule microscopy. PloS one 12, e0188778, doi: 10.1371/journal.pone.0188778 (2017). [DOI] [PMC free article] [PubMed] [Google Scholar]
- 9.Bisaria A, Hayer A, Garbett D, Cohen D & Meyer T Membrane-proximal F-actin restricts local membrane protrusions and directs cell migration. Science 368, 1205, doi: 10.1126/science.aay7794 (2020). [DOI] [PMC free article] [PubMed] [Google Scholar]
- 10.Moore AS, Wong YC, Simpson CL & Holzbaur EL Dynamic actin cycling through mitochondrial subpopulations locally regulates the fission-fusion balance within mitochondrial networks. Nature communications 7, 12886, doi: 10.1038/ncomms12886 (2016). [DOI] [PMC free article] [PubMed] [Google Scholar]
- 11.Manor U et al. A mitochondria-anchored isoform of the actin-nucleating spire protein regulates mitochondrial division. eLife 4, doi: 10.7554/eLife.08828 (2015). [DOI] [PMC free article] [PubMed] [Google Scholar]
- 12.Chakrabarti R et al. INF2-mediated actin polymerization at the ER stimulates mitochondrial calcium uptake, inner membrane constriction, and division. J Cell Biol 217, 251–268, doi: 10.1083/jcb.201709111 (2018). [DOI] [PMC free article] [PubMed] [Google Scholar]
- 13.Korobova F, Ramabhadran V & Higgs HN An actin-dependent step in mitochondrial fission mediated by the ER-associated formin INF2. Science 339, 464–467, doi: 10.1126/science.1228360 (2013). [DOI] [PMC free article] [PubMed] [Google Scholar]
- 14.Korobova F, Gauvin TJ & Higgs HN A role for myosin II in mammalian mitochondrial fission. Curr Biol 24, 409–414, doi: 10.1016/j.cub.2013.12.032 (2014). [DOI] [PMC free article] [PubMed] [Google Scholar]
- 15.Yang C & Svitkina TM Ultrastructure and dynamics of the actin-myosin II cytoskeleton during mitochondrial fission. Nat Cell Biol 21, 603–613, doi: 10.1038/s41556-019-0313-6 (2019). [DOI] [PMC free article] [PubMed] [Google Scholar]
- 16.De Vos KJ, Allan VJ, Grierson AJ & Sheetz MP Mitochondrial function and actin regulate dynamin-related protein 1-dependent mitochondrial fission. Curr Biol 15, 678–683, doi: 10.1016/j.cub.2005.02.064 (2005). [DOI] [PubMed] [Google Scholar]
- 17.Li S et al. Transient assembly of F-actin on the outer mitochondrial membrane contributes to mitochondrial fission. J Cell Biol 208, 109–123, doi: 10.1083/jcb.201404050 (2015). [DOI] [PMC free article] [PubMed] [Google Scholar]
- 18.Ji WK, Hatch AL, Merrill RA, Strack S & Higgs HN Actin filaments target the oligomeric maturation of the dynamin GTPase Drp1 to mitochondrial fission sites. eLife 4, e11553, doi: 10.7554/eLife.11553 (2015). [DOI] [PMC free article] [PubMed] [Google Scholar]
- 19.Bisaria A, Hayer A, Garbett D, Cohen D & Meyer T Membrane proximal F-actin restricts local membrane protrusions and directs cell migration. BioRxiv, 705509 (2019). [DOI] [PMC free article] [PubMed] [Google Scholar]
- 20.Lam SS et al. Directed evolution of APEX2 for electron microscopy and proximity labeling. Nat Methods 12, 51–54, doi: 10.1038/nmeth.3179 (2015). [DOI] [PMC free article] [PubMed] [Google Scholar]
- 21.Branon TC et al. Efficient proximity labeling in living cells and organisms with TurboID. Nature biotechnology 36, 880–887, doi: 10.1038/nbt.4201 (2018). [DOI] [PMC free article] [PubMed] [Google Scholar]
- 22.Wales P et al. Calcium-mediated actin reset (CaAR) mediates acute cell adaptations. eLife 5, doi: 10.7554/eLife.19850 (2016). [DOI] [PMC free article] [PubMed] [Google Scholar]
- 23.Schindelin J et al. Fiji: an open-source platform for biological-image analysis. Nat Methods 9, 676–682, doi: 10.1038/nmeth.2019 (2012). [DOI] [PMC free article] [PubMed] [Google Scholar]
- 24.Ridler T & Calvard S Picture thresholding using an iterative selection method. IEEE trans syst Man Cybern 8, 630–632 (1978). [Google Scholar]
- 25.Lippincott-Schwartz J, Snapp EL & Phair RD The Development and Enhancement of FRAP as a Key Tool for Investigating Protein Dynamics. Biophys J 115, 1146–1155, doi: 10.1016/j.bpj.2018.08.007 (2018). [DOI] [PMC free article] [PubMed] [Google Scholar]
- 26.Borgese N, Gazzoni I, Barberi M, Colombo S & Pedrazzini E Targeting of a tail-anchored protein to endoplasmic reticulum and mitochondrial outer membrane by independent but competing pathways. Molecular Biology of the Cell 12, 2482–2496 (2001). [DOI] [PMC free article] [PubMed] [Google Scholar]
- 27.Omari S et al. Noncanonical autophagy at ER exit sites regulates procollagen turnover. Proceedings of the National Academy of Sciences of the United States of America 115, E10099–e10108, doi: 10.1073/pnas.1814552115 (2018). [DOI] [PMC free article] [PubMed] [Google Scholar]
- 28.Subach OM, Cranfill PJ, Davidson MW & Verkhusha VV An enhanced monomeric blue fluorescent protein with the high chemical stability of the chromophore. PloS one 6, e28674, doi: 10.1371/journal.pone.0028674 (2011). [DOI] [PMC free article] [PubMed] [Google Scholar]
- 29.Borgese N, Gazzoni I, Barberi M, Colombo S & Pedrazzini E Targeting of a tail-anchored protein to endoplasmic reticulum and mitochondrial outer membrane by independent but competing pathways. Mol Biol Cell 12, 2482–2496, doi: 10.1091/mbc.12.8.2482 (2001). [DOI] [PMC free article] [PubMed] [Google Scholar]
- 30.Geiser M, Cebe R, Drewello D & Schmitz R Integration of PCR fragments at any specific site within cloning vectors without the use of restriction enzymes and DNA ligase. BioTechniques 31, 88–90, 92 (2001). [DOI] [PubMed] [Google Scholar]
Associated Data
This section collects any data citations, data availability statements, or supplementary materials included in this article.
Supplementary Materials
Supplementary Video 1: Live cell imaging of mitochondria-associated actin. A Hap1 cell expressing AC-mito counterstained with MitoTracker shows dynamic subdomains of actin enrichment on mitochondria.
Supplementary Video 2: Live cell imaging of mitochondria-associated actin. A Hap1 cell expressing AC-mito counterstained with MitoTracker shows dynamic subdomains of actin enrichment on mitochondria.
Supplementary Video 3: Live cell imaging of ER-associated actin. A Hap1 cell expressing AC-ER counterstained with MitoTracker shows dynamic subdomains of actin enrichment on the ER, in particular at ER-mitochondria contact sites.
Supplementary Video 4: Live cell imaging of ER-associated actin. A Hap1 cell expressing AC-ER counterstained with MitoTracker shows dynamic subdomains of actin enrichment on the ER, in particular at ER-mitochondria contact sites.
Supplementary Video 5: FRAP of cell co-expressing AC-mito and mCherry-mito. FRAP of U2OS cells co-expressing AC-mito and mCherry-mito shows that AC-mito is highly mobile but less mobile than mCherry-mito.
Supplementary Video 6: FRAP of cell co-expressing AC-ER and mCherry-ER. FRAP of U2OS cells co-expressing AC-ER and mCherry-ER shows that AC-ER is highly mobile but less mobile than mCherry-ER.
Supplementary Video 7: Live imaging of LifeAct and AC-mito durng actin wave cycling. Co-accumulation of LifeAct and AC-mito is observable in several regions of the cell during actin wave cycling. Scale bar: 5 µm. Graphs display the normalized average pixel intensity over time within the indicated boxed regions. This video corresponds to Figure 2B.
Supplementary Video 8: Live imaging of LifeAct and AC-ER durng actin wave cycling (single cell). Co-accumulation of the F-actin marker LifeAct and AC-ER is observable during actin wave cycling. Scale bar: 5 µm. Graphs display the normalized average pixel intensity over time within the indicated boxed regions. This video corresponds to Extended Data Figure 7.
Supplementary Video 9: Live imaging of LifeAct and AC-ER during actin wave cycling (field of cells). Co-accumulation of LifeAct and AC-ER is concsistently observed during actin wave cycling in multiple cells. The box indicates the cell shown in Extended Data Figure 7 and Supplementary Video 8. Scale bar: 10 µm.
Supplementary Video 10: Live imaging of AC-mito and Halo-mito during mitochondrial fission. Live imaging of AC-mito, Halo-mito (Halo-Fis1), and mitochondria (BFP-mito) in HeLa cells reveals accumulation of mitochondria-associated actin prior to fission. Scale bar: 1 µm. This video corresponds to Figure 2D.
Supplementary Video 11: Live imaging of AC-mito and mitochondrial fragmentaion with ionomycin treatment. Live imaging of AC-mito in HeLa cells counterstained with MitoTracker treated with 10 µM ionomycin reveals mitochondrial fragmentation. Fragmention occurs simultaneously across cells regardless of AC-mito expression. Scale bar: 20 µm.
Supplementary Video 12: Live imaging of AC-ER and mitochondrial fragmentaion with ionomycin treatment. Live imaging of AC-ER in HeLa cells counterstained with MitoTracker treated with 10 µM ionomycin reveals mitochondrial fragmentation. Fragmention occurs simultaneously across cells regardless of AC-ER expression. Scale bar: 20 µm.
Supplementary Video 13: Live imaging of AC-mito during mitochondrial fission. Live imaging of AC-mito in HeLa cells counterstained with MitoTracker reveals accumulation of mitochondria-associated actin prior to fission. Scale bar: 0.5 µm. This video corresponds to Figure 3A.
Supplementary Video 14: Live imaging of AC-ER during mitochondrial fission. Live imaging of AC-ER in HeLa cells co-expressing BFP-mito reveals accumulation of ER-associated actin prior to fission. Scale bar: 1 µm. This montage corresponds to Figure 3B.
Supplementary Video 15: Live imaging of AC-ER during Drp1-mediated mitochondrial fission. Live imaging of AC-ER and mCherry-Drp1 in HeLa cells counterstained with MitoTracker reveals accumulation of ER-associated actin prior Drp1 accumulation and mitochondrial fission. Scale bar: 1 µm. This video corresponds to Extended Data Figure 9A.
Supplementary Video 16: Live imaging of AC-mito during Drp1-mediated mitochondrial fission. Live imaging of AC-mito and mCherry-Drp1 in HeLa cells counterstained with MitoTracker reveals accumulation of mitochondria-associated actin prior Drp1 accumulation and mitochondrial fission. Scale bar: 1 µm. This video corresponds to Extended Data Figure 9B.
Supplementary Video 17: Live imaging of AC-mito and mCherry-mito during mitochondrial fission. Live imaging of AC-mito and mCherry-mito in HeLa cells counterstained with MitoTracker reveals accumulation of mitochondria-associated actin prior to mitochondrial fission. Scale bar: 1 µm. This video corresponds to Supplementary Figure 5.
Supplementary Video 18: Live imaging of AC-ER during ER-mediated mitochondrial fission. Live imaging of AC-ER and mCherry-ER in HeLa cells counterstained with MitoTracker reveals accumulation of ER-associated actin prior to ER-mediated mitochondrial fission. Scale bar: 1 µm. This video corresponds to Extended Data Figure 10A.
Supplementary Video 19: Live imaging of AC-mito during ER-mediated mitochondrial fission. Live imaging of AC-mito and mCherry-ER in HeLa cells counterstained with MitoTracker reveals accumulation of mitochondria-associated actin prior to ER-mediated mitochondrial fission. Scale bar: 1 µm. This video corresponds to Extended Data Figure 10B.
Supplementary Video 20: Example of artifact resulting from AC-mito overexpression. Live imaging of AC-mito in a HeLa cell counterstained with MitoTracker. Mild mitochondrial clustering and a decrease in mitochondrial movement is evident in the perinuclear region coinciding with a high degree of AC-mito signal. Scale bar: 10 µm.
Supplementary Video 21: Live imaging of AC-mito and AC-ER during mitochondrial fission. Live imaging of AC-mito and AC-ER in HeLa cells counterstained with MitoTracker reveals accumulation of mitochondria-associated actin prior to accumulation of ER-associated actin. Scale bar: 1 µm. This video corresponds to Figure 3D.
Supplementary Figure 1: Montage of AC-mito accumulation during mitochondrial fission. AC-mito accumulation prior to mitochondrial fission is shown across 20 time points. Scale bar: 0.5 µm. This montage corresponds to Figure 3A.
Supplementary Figure 2: Montage of AC-ER accumulation during mitochondrial fission. AC-ER accumulation prior to mitochondrial fission is shown across 20 time points. Mitochondria are labeled with BFP-mito. Scale bar: 0.5 µm. This montage corresponds to Figure 3B.
Supplementary Figure 3: Montage of AC-ER accumulation during Drp1-mediated mitochondrial fission. AC-ER accumulation prior to Drp1 recruitment and mitochondrial fission is shown across 20 time points. Scale bar: 0.5 µm. This montage corresponds to Extended Data Figure 9A.
Supplementary Figure 4: Montage of AC-mito accumulation during Drp1-mediated mitochondrial fission. AC-mito accumulation prior to Drp1 recruitment and mitochondrial fission is shown across 20 time points. Scale bar: 0.5 µm. This montage corresponds to Extended Data Figure 9B.
Supplementary Figure 5: Mitochondria-associated actin accumulates specifically at mitochondrial fission sites. AC-mito accumulation is evident at sites of mitochondrial fission. Hollow arrows mark the location of mitochondrial fission. Yellow lines in the left column mark the area used to generate the line scans. Scale bar: 1 µm. Example images of the areas used to determine the degree of MitoTracker overlap and coefficient of variance for mCherry/AC-mito and the resulting values are also shown.
Supplementary Figure 6: Montage of AC-mito accumulation during mitochondrial fission. AC-mito accumulation prior to mitochondrial fission is shown across 20 time points. Scale bar: 0.5 µm. This montage corresponds to Supplementary Figure 5.
Supplementary Figure 7: Montage of AC-ER accumulation during ER-mediated mitochondrial fission. AC-ER accumulation prior to ER-mediated mitochondrial fission is shown across 20 time points. Scale bar: 0.5 µm. This montage corresponds to Extended Data Figure 10A.
Supplementary Figure 8: Montage of AC-mito accumulation during ER-mediated mitochondrial fission. AC-mito accumulation prior to ER-mediated mitochondrial fission is shown across 20 time points. Scale bar: 0.5 µm. This montage corresponds to Extended Data Figure 10B.
Supplementary Figure 9: Montage of AC-mito and AC-ER accumulation during mitochondrial fission. AC-mito accumulation followed by AC-ER accumulation, followed by mitochondrial fission is shown across 35 time points. Scale bar: 0.5 µm. This montage corresponds to Figure 3D.
Supplementary Table 1: Primers and plasmids used to generate the expression constructs for these studies.
Data Availability Statement
The original source data for quantification and the raw imaging data used for all the presented figures and videos will be made available from zenodo.org doi: 10.5281/zenodo.2851619.


