SUMMARY
Aberrant aggregation of RNA binding protein TDP-43 in neurons is a hallmark of frontotemporal lobar degeneration caused by progranulin haploinsufficiency1,2. However, the mechanism leading to TDP-43 proteinopathy remains unclear. Here we use single-nucleus RNA-sequencing (snRNA-seq) to show that progranulin deficiency promotes microglial transition from a homeostatic to disease-specific state that causes endolysosomal dysfunction and neurodegeneration. These defects persist even when Grn−/− microglia are cultured ex vivo. In addition, snRNA-seq reveals selective loss of excitatory neurons at disease end-stage, characterized by prominent nuclear and cytoplasmic TDP-43 granules and nuclear pore defects. Remarkably, conditioned media from Grn−/− microglia is sufficient to promote TDP-43 granule formation, nuclear pore defects and cell death in excitatory neurons via the complement activation pathway. Consistent with these results, deleting C1qa and C3 mitigates microglial toxicity, and rescues TDP-43 proteinopathy and neurodegeneration. These results uncover previously unappreciated contributions of chronic microglial toxicity to TDP-43 proteinopathy during neurodegeneration.
Dominant mutations in the human progranulin (GRN) gene drastically reduce progranulin (PGRN) protein levels and are a major cause of familial forms of frontotemporal lobar degeneration (FTLD) characterized by aggregation of RNA binding protein TDP-43 in neuronal cytoplasm and dendrites3,4. However, the mechanisms underlying TDP-43 proteinopathy in PGRN deficiency remain unclear. Emerging evidence indicates that PGRN may regulate vesicular trafficking via the endolysosomal pathway5. Consistent with this idea, Grn knockout (Grn−/−) mouse brain show an age-dependent upregulation of lysosomal and innate immunity genes6,7. One major functional implication of these transcriptomic changes converges on microglia, where PGRN deficiency promotes lysosomal dysfunction and production of complements that preferentially affect synaptic connections in the thalamocortical circuit. While these results support an important role for microglia in neurodegeneration caused by PGRN deficiency, recent results indicate that neurons in Grn−/− mice and FTLD-GRN patients contain prominent accumulation of abnormal lysosomes8, suggesting that these lysosomal defects may render PGRN-deficient neurons more vulnerable to degeneration. Furthermore, proteomic analyses of postmortem brain tissues from FTLD-GRN patients show an association between TDP-43 aggregates and lysosomal proteins9; however, the mechanism for this remains unclear.
Single-cell transcriptomics in Grn−/− thalamus
To unravel the contributions of glial and neuronal pathologies to neurodegeneration in Grn−/− thalamus, we performed single-nucleus RNA-sequencing (snRNA-seq)10,11 in microdissected thalami from 2, 4, 7, 12 and 19 months old Grn+/+ and Grn−/− mice. We isolated nuclei from 38 thalamus samples, including 3–4 biological replicates per age per genotype, and captured 193,033 single nuclei with an average capture rate of 5,080 nuclei per sample (Extended Data Fig. 1a). On average, 49,000 reads and 1,126 median genes were generated per nucleus (Supplementary Table 1). Unbiased clustering based on known cell type-specific markers identified 16 distinct cell clusters, including three excitatory neuron clusters (c3, c12, c13), two inhibitory neuron clusters (c6 somatostatin+ and c9 reelin+ interneurons), two immature neuron clusters (c2, c15), two oligodendroglial clusters (c1, c10), immature oligodendroglia (c16), oligodendroglia precursor cells (c5), endothelial cells (c8), astrocytes (c7), and microglia (c4) (Fig. 1a, Extended Data Fig. 1b–e). Two clusters (c11, c14) contained nuclei doublets and were excluded (Extended Data Fig. 1d).
Figure 1 |. Single-nucleus RNA-seq reveals age-dependent microglial pathology and neuronal vulnerability in the thalamus of Grn−/− mice.
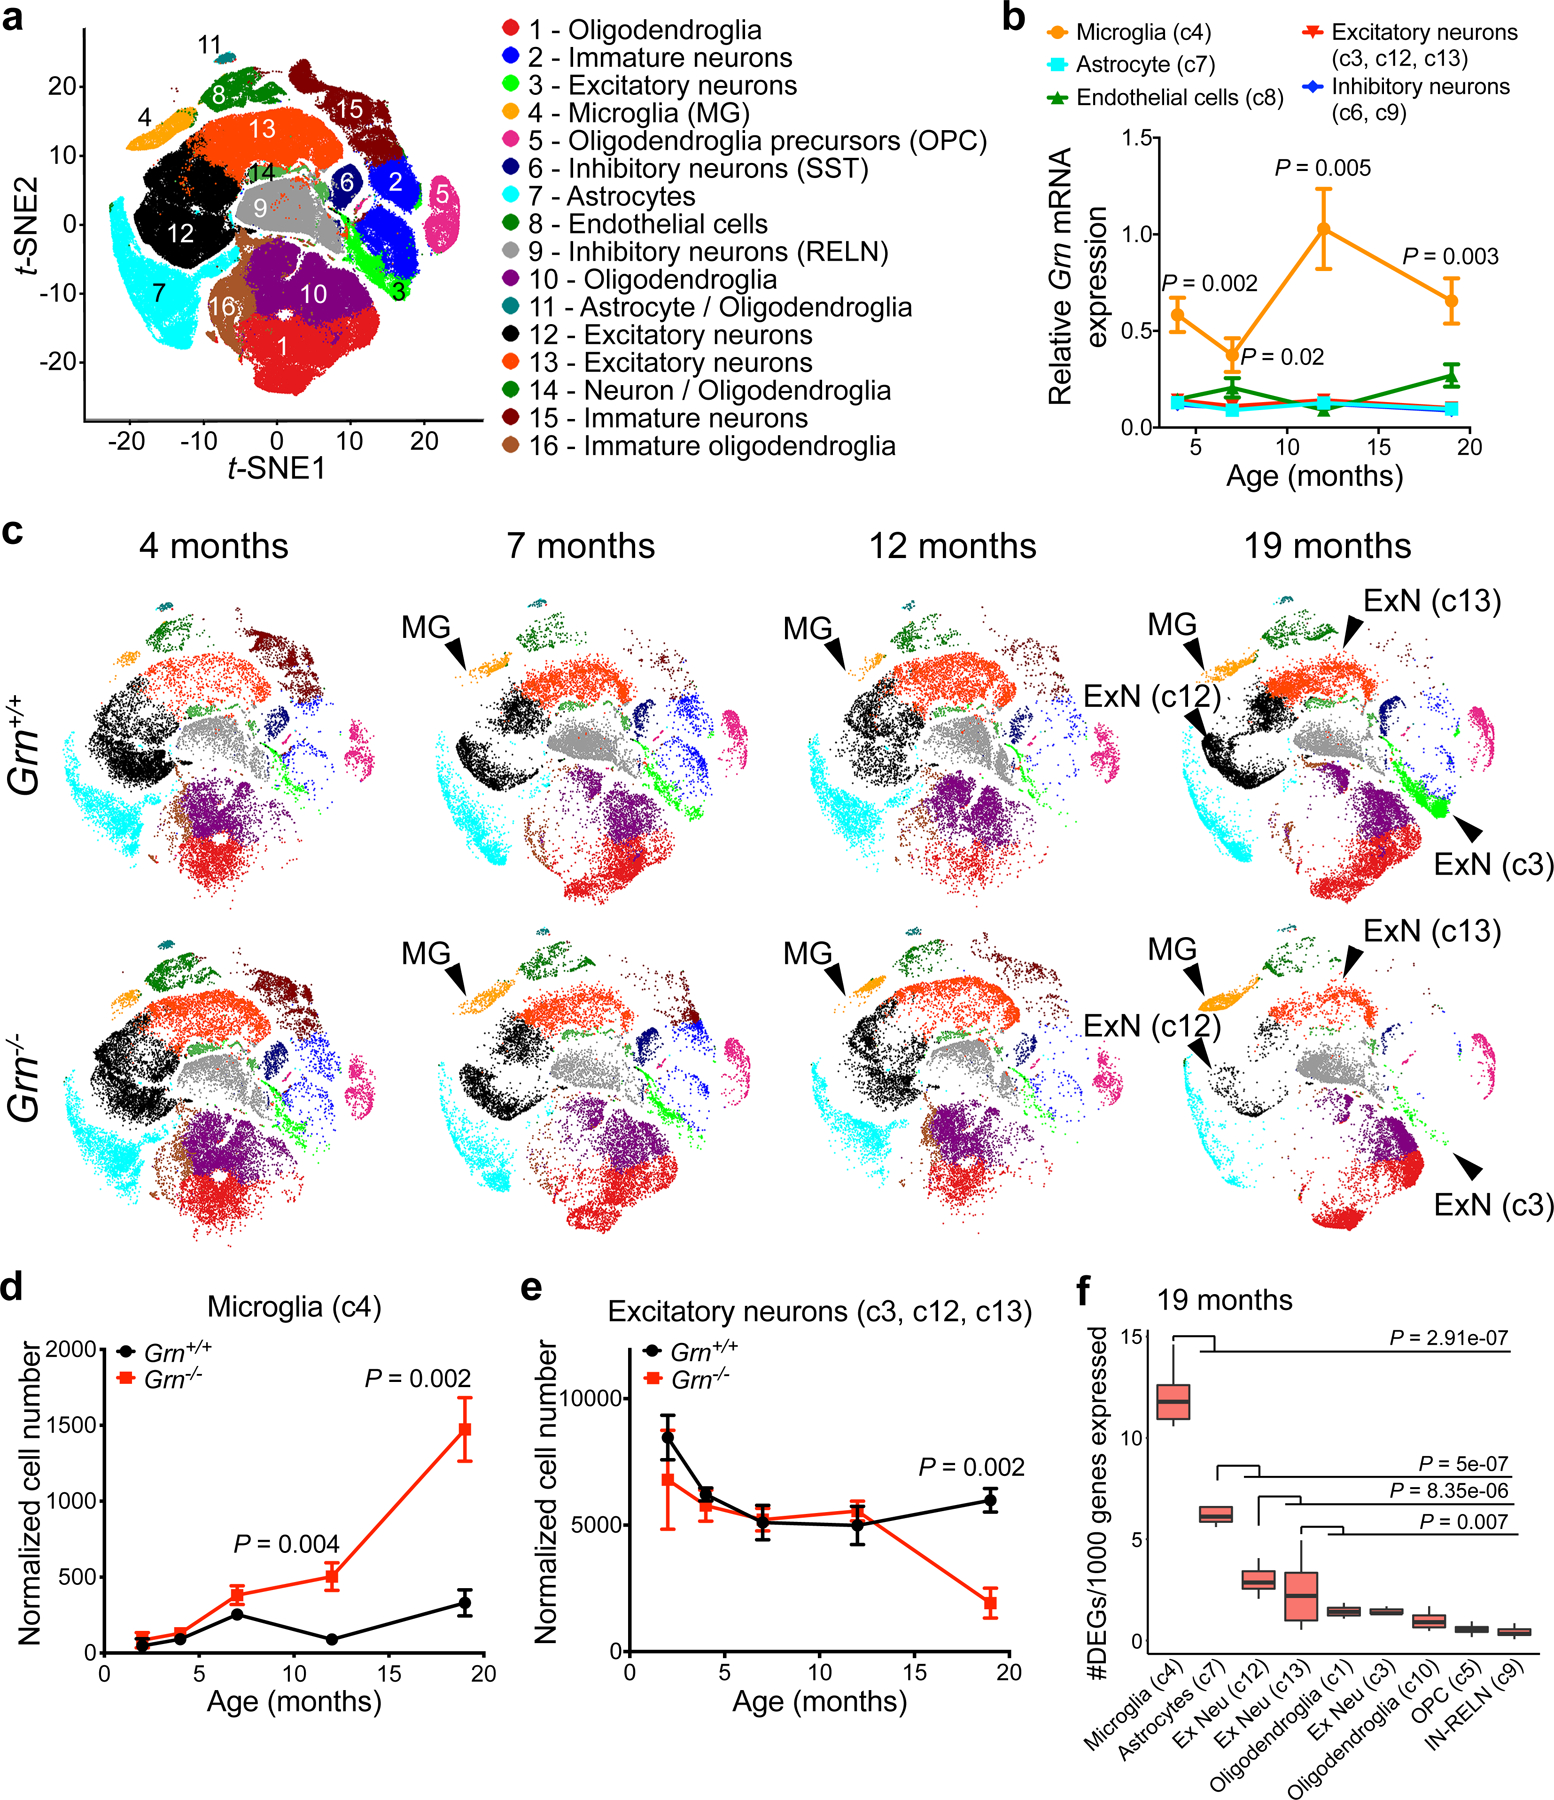
a. Unbiased clustering of single-nucleus RNA-seq (snRNA-seq) data from Grn+/+ and Grn−/− thalamus at 2, 4, 7, 12 and 19 months reveals 16 distinct cell clusters. b. Age-dependent increases of Grn mRNA expression in microglia in Grn+/+ thalamus, whereas Grn mRNA levels remain low in astrocytes, excitatory neurons (c3, c12 and c13), inhibitory neurons and endothelial cells. Data represent mean ± s.e.m.. n= 4 mice per genotype per age. Statistics use two-way ANOVA, with multiple comparisons between microglia and excitatory neurons. c. t-SNE plots show that the 16 cell clusters in Grn+/+ thalamus remain unchanged from 4 to 19 months (top row). In contrast, the microglia cluster (c4) in Grn−/− thalamus shows changes in cell density and distribution in t-SNE plots from 7, 12 to 19 months, whereas the excitatory neuron clusters, including c3, c12 and c13, show significant reduction in cell density at 19 months. d–e. Normalized cell counts for microglia (c4) and excitatory neuron clusters (c3, c12 and c13) in Grn+/+ and Grn−/− thalamus. Data represent mean ± s.e.m.. n= 4 mice per genotype per age. Statistics use two-tailed unpaired Student’s t test. f. Gene burden analysis for glia and neuronal clusters in Grn−/− thalamus compared to Grn+/+ thalamus at 19 months. Box plots show the median and 25–75th percentiles and the whiskers represent the maximum and minimum. Statistics use Mann-Whitney U test.
We first determined the relative abundance of Grn mRNA transcripts in different cell types in Grn+/+ thalamus. Compared to astrocytes, excitatory neurons, inhibitory neurons and endothelial cells, Grn mRNA in microglia was significantly higher at 4, 7, 12 and 19 months (Fig. 1b). Consistent with these results, violin plots showed that cumulative Grn mRNA across all ages was indeed most abundant, albeit somewhat heterogeneous, in the microglia cluster, but showed a biphasic pattern in the excitatory neuron clusters (c3, c12, c13) (Extended Data Fig. 1f). These results, while different from two recent single-cell transcriptomics studies due to differences in brain regions or technology platforms12,13, suggest that PGRN may be required to suppress aberrant microglial activation during ageing. Next, visualization of clusters across different ages using a t-distribution Stochastic Neighbor Embedding (t-SNE) algorithm showed that the abundance of most cell types in Grn+/+ thalamus remained relatively stable from 2 to 19 months. However, the microglial cluster in Grn−/− thalamus underwent dynamic changes from 7 to 19 months, accompanied by a progressive increase in the relative number of microglia in Grn−/− thalamus (Fig. 1c–d). Interestingly, a significant loss of excitatory neurons (clusters c3, c12, c13) and a modest increase of inhibitory neurons (clusters c6, c9) was noted in Grn−/− thalamus at 19 months (Fig. 1e, Extended Data Fig. 1g). Surprisingly, unlike microglia, the astroglial cluster (c7) in Grn−/− thalamus showed no significant change in cell number (Extended Data Fig. 1h). Next, we performed “gene burden” analysis to determine the number of genes differentially expressed in each cluster between Grn+/+ and Grn−/− thalamus after normalizing for different cell numbers and gene detection rates across clusters. This analysis showed that Grn−/− microglia were the only cluster to show a significant increase in burden score at 12 months (Extended Data Fig. 1i), followed by a more drastic increase at 19 months (Fig. 1f). In contrast, the burden scores for Grn−/− astrocytes and excitatory neuron clusters c12 and c13 increased only at 19 months.
Grn−/− microglia transition from homeostasis to disease state
To determine how PGRN deficiency alters the transcriptomes in thalamic microglia (Th-MG), we performed hierarchical clustering of snRNA-seq profiles averaged by animal. While Grn+/+ Th-MG exhibited very limited changes from 2 to 19 months, Grn−/− Th-MG showed transcriptomic changes that began at 7 months and became more drastic at 12 and 19 months (Extended Data Fig. 2a). Next, we performed subclustering and unsupervised pseudotime analysis to identify age-dependent changes in Grn+/+ and Grn−/− Th-MG14,15. Similar to recent studies12,16, pseudotime analyses showed that Grn+/+ Th-MG exhibited a limited transition from 2 to 19 months amongst three subclusters, 4A, 4B and 4C (Extended Data Fig. 2b, Supplementary Table 2), which expressed genes such as cysteine protease inhibitor (Cst3, 4A), coagulation factor XIIIa (F13a1, 4B), plexin domain containing 2 (Plxdc2, 4C), and homeostatic genes (Cx3cr1, P2ry12, Siglech, and Mef2c, 4C). By contrast, Grn−/− Th-MG exhibited drastically different trajectories, especially at 12 and 19 months when most Grn−/− Th-MG were represented by subclusters 4D, 4E and 4F (Extended Data Fig. 2c), which downregulated homeostatic genes P2ry12 and Tmem119, and overexpressed genes implicated in inflammation, lysosomal function and neurodegeneration, including Apoe, Adam33, Ctsb, Gpnmb, and Igf1 (Extended Data Fig. 2d–f).
Analysis of differentially expressed genes (DEGs) in Grn+/+ and Grn−/− Th-MG revealed that Grn−/− Th-MG exhibited progressive gene expression changes that began with 45 DEGs at 7 months, 65 DEGs at 12 months, and 265 DEGs at 19 months (Supplementary Table 3). Of these DEGs, 21 core genes were consistently dysregulated in Grn−/− Th-MG at 7, 12 and 19 months (Extended Data Fig. 2f–g), including those implicated in negative regulation of cellular component organization, protein localization to membrane, dendrite development, negative regulation of cell migration, and Ras protein signal transduction. In contrast, functional annotations of 265 DEGs in 19 months Grn−/− Th-MG showed much more expanded GO terms, including plasma membrane bounded cell projection, exocytosis, phagocytosis, protein complex assembly, ion homeostasis/transport, MAPK cascade, and receptor tyrosine kinase signaling. Comparisons between 19 months Grn−/− Th-MG and disease-associated microglial (DAM) genes17 revealed 32 genes shared with Alzheimer’s Disease (AD) DAM genes and 30 genes with amyotrophic lateral sclerosis (ALS) DAM genes (P = 8.42 × 10⁻²⁸ and 8.59 × 10⁻¹⁵, respectively) (Extended Data Fig. 2h). GO analysis of the 32 genes shared between Grn−/− Th-MG and AD DAM revealed terms including activation of innate immune response, myeloid activation, leukocyte degranulation, cation homeostasis and macroautophagy (Extended Data Fig. 2i). Despite the partial overlaps, the majority of DEGs in Grn−/− Th-MG were unique, suggesting that Grn−/− Th-MG possess their own disease-specific features. Validations using immunohistochemistry confirmed loss of P2Y12, Tmem119 and intracellular vesicle trafficking regulator Numb, and up-regulation of ApoE, Adam33, Cathepsin B, IGF1 and GPNMB in Grn−/− microglia (Extended Data Fig. 3a–c). Together, these results support that Grn−/− microglia age-dependently lose their homeostatic state, and acquire defects that partially overlap with, but are significantly divergent from AD and ALS DAMs (Extended Data Fig. 3d).
Progressive TDP-43 proteinopathy in Grn−/− thalamic neurons
To characterize the selective loss of excitatory neurons in 19 month old Grn−/− thalamus, we identified cluster-specific genes, including Ttr (Transthyretin), Pde4d (Phosphodiesterase 4D) and Cntnap2 (Contactin associated protein like 2) for cluster c3, Prkcd (Protein kinase C Delta) for cluster c12, and Foxp2 (Forkhead Box P2) for cluster c13 (Extended Data Fig. 4a–d). Stereology-based quantification showed progressive loss of PKCδ+ and Foxp2+ neurons in Grn−/− thalamus from 12 to 19 months (Extended Data Fig. 4e–f). Remarkably, many Foxp2+ Grn−/− neurons were surrounded by abundant Grn−/− Th-MG that contained Foxp2+ debris in their cytoplasm (Fig. 2a), suggesting that Grn−/− Th-MG might be neurotoxic and have phagocytosed dead Grn−/− neurons.
Figure 2 |. TDP-43 proteinopathy and nuclear pore defects in Grn−/− thalamic neurons.
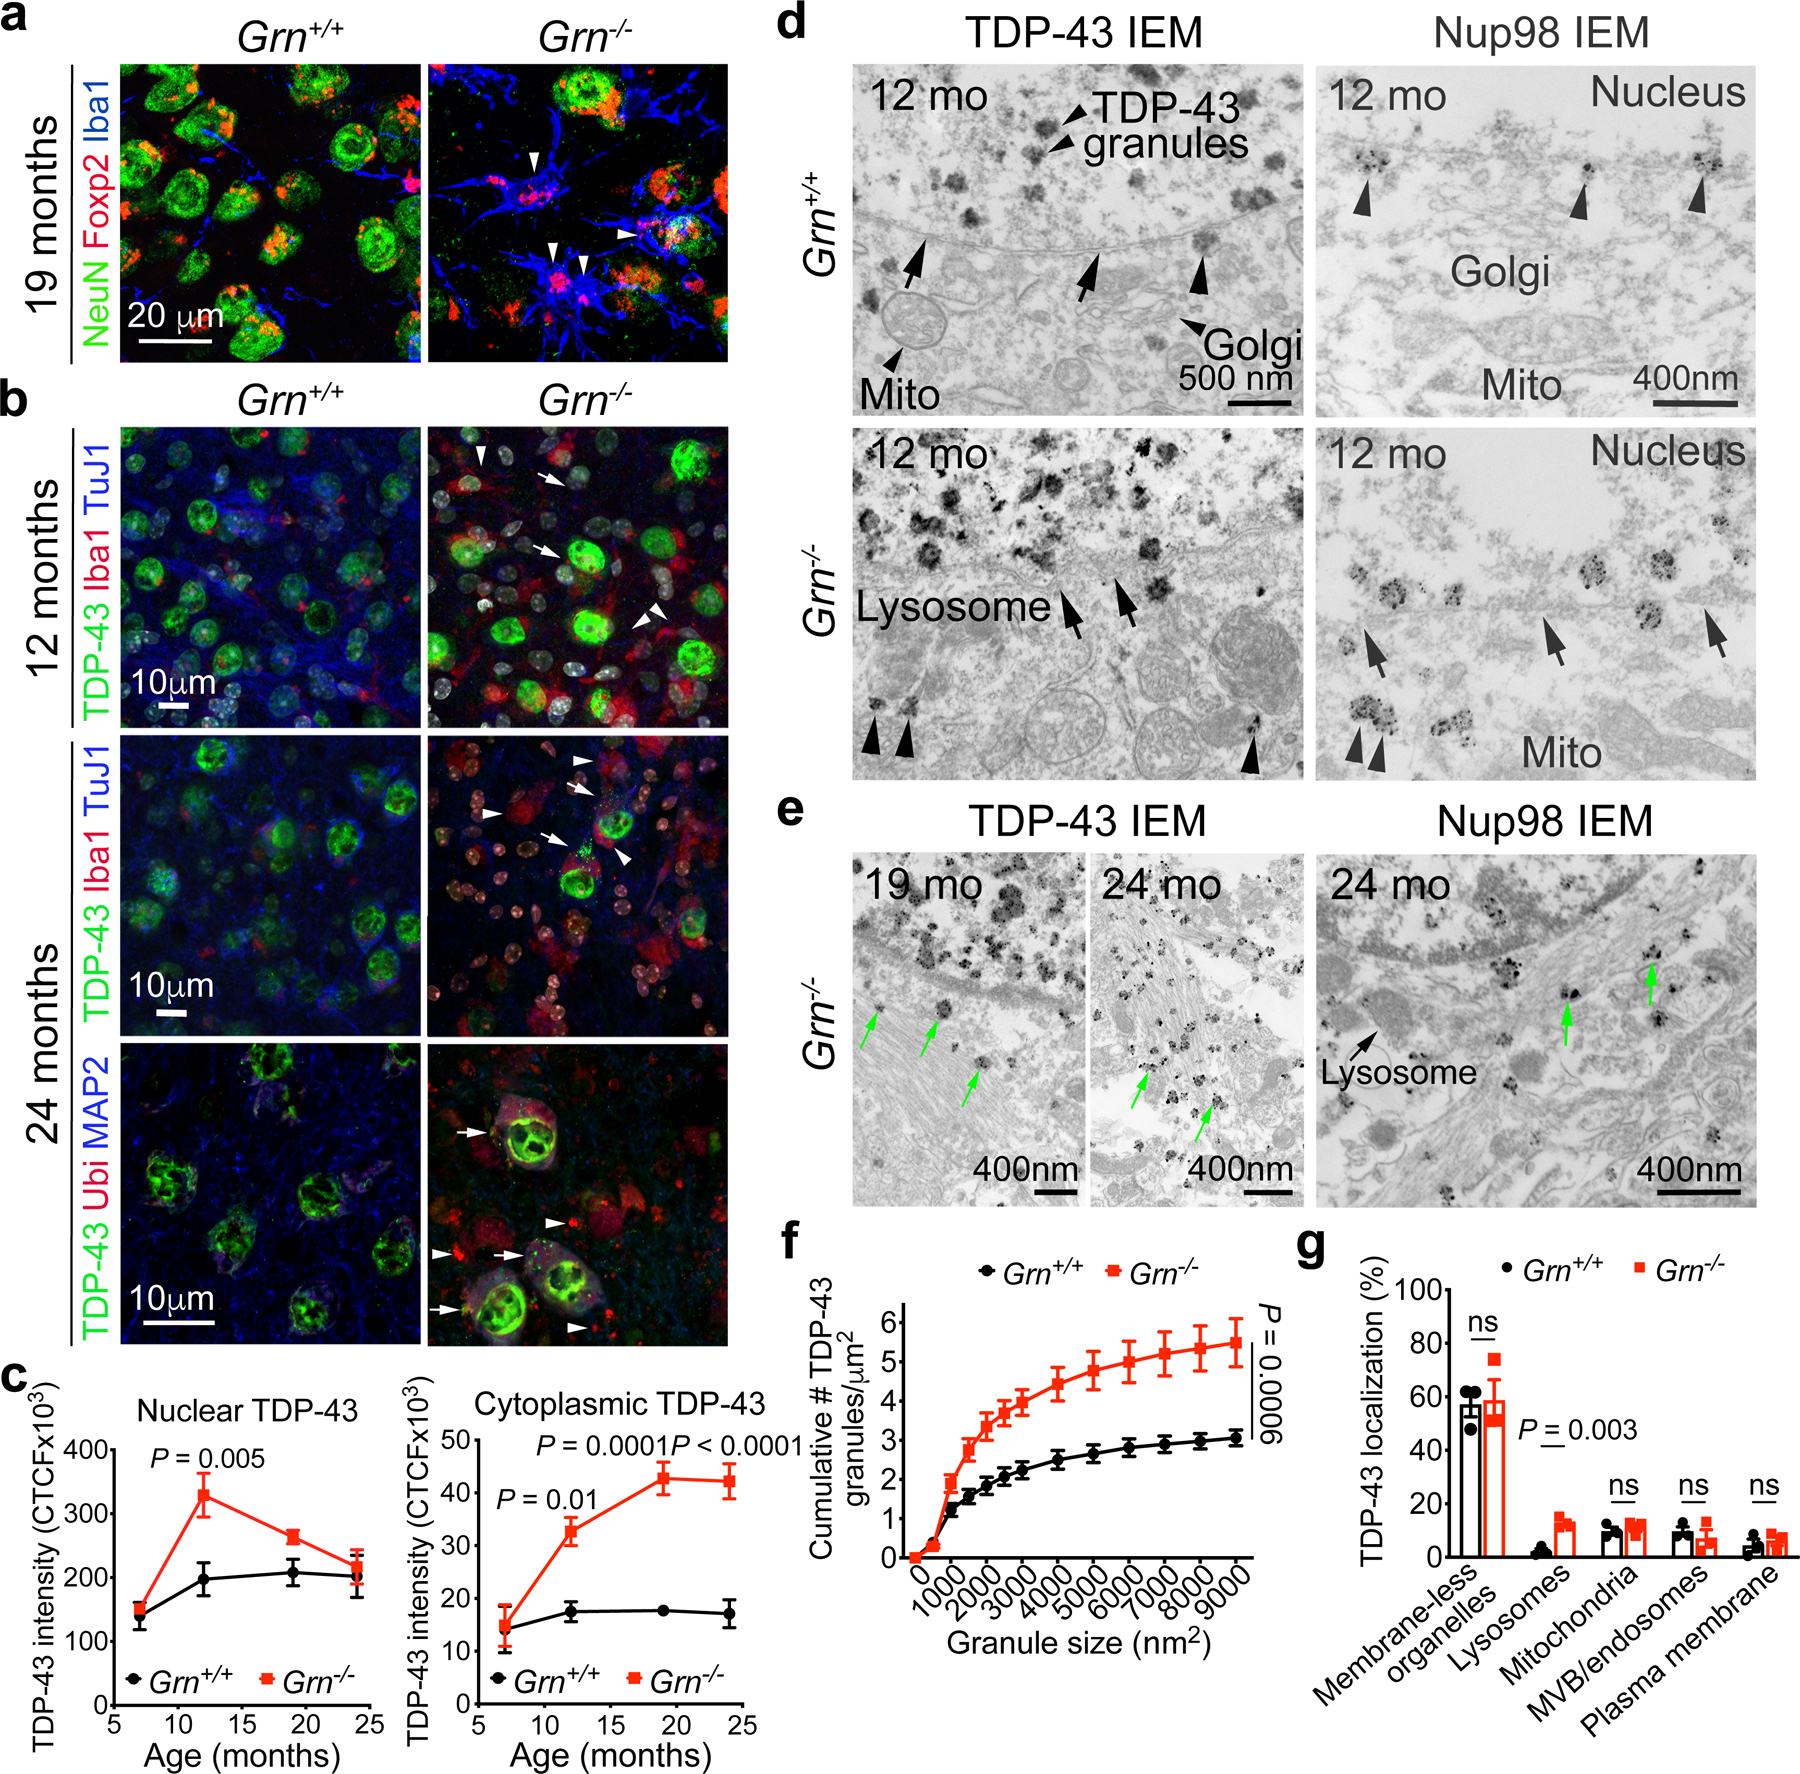
a. At 19 months, prominent Grn−/− microglia surround Foxp2+ Grn−/− thalamic neurons (arrowheads), which contain a robust increase in nuclear and cytoplasmic TDP-43 (arrows). b. At 12–24 months, many Grn−/− thalamic neurons shows distinct cytoplasmic TDP-43 aggregates (arrows, right upper panel), many colocalizing with ubiquitin (arrows, right lower panel). Arrowheads highlight Iba1+ microglia (right upper panel) and ubiquitin+ aggregates not positive for TDP-43 (right lower panel). c. Quantification of nuclear and cytoplasmic TDP-43 intensity in Grn+/+ and Grn−/− thalamic neurons from 7 to 24 months. Confocal images containing >40 neurons were captured from n=3 mice per age per genotype. Data represent mean ± s.e.m.. Statistics use two-way ANOVA with multiple comparisons. d. Immunogold electron microscopy for TDP-43 and Nup98 in 12 months old Grn+/+ and Grn−/− thalamic neurons. Arrows in left upper panel indicate intact nuclear membrane and arrowheads indicate rare TDP-43 near the nuclear pore in Grn+/+ neurons. In contrast, Grn−/− neurons contain cytoplasmic TDP-43 granules attached to abnormal lysosomes (arrowheads, left lower panel), and show frequently disrupted nuclear membrane (arrows) and displacement of Nup98 proteins from the nuclear membrane to the cytoplasm (arrowheads, right lower panel). e. By 19–24 months, many TDP-43 granules (green arrows, left panels) and Nup98 proteins (green arrows, right panel) are embedded within filamentous protein aggregates in the cytoplasm of Grn−/− neurons. f–g. Quantification of TDP-43 granules and their association with intracellular organelles at 19 months. IEM images from 7 to 21 neurons per mouse, 3 mice for each genotype, were used for quantification. Data represent mean ± s.e.m. Statistics use two-way ANOVA for panel f and two-tailed unpaired Student’s t test for panel g, ns, not significant.
We next sought to determine whether TDP-43 proteinopathy might contribute to loss of Grn−/− thalamic neurons. Unlike Grn+/+ thalamic neurons that showed stable nuclear TDP-43 proteins, Grn−/− thalamic neurons showed increased nuclear TDP-43 beginning at 12 months, accompanied by a persistent accumulation of TDP-43 in cytoplasm at 12 months (Fig. 2b, upper panels). By 24 months, many Grn−/− neurons contained discrete cytoplasmic TDP-43+ aggregates colocalized with ubiquitin (Fig. 2b, arrows in right panels, Fig. 2c). Consistent with these results, immunogold electron microscopy (IEM) showed almost all TDP-43 proteins in 12 months Grn+/+ thalamic neurons were in the nucleus as membrane-free granules (Fig. 2d, left upper panel). A small number of TDP-43 granules in Grn+/+ neurons were attached to mitochondria (9.8%), multivesicular bodies (MVB)/endosomes (9.7%), plasma membrane (4.4%) and lysosomes (2.2%). In contrast, Grn−/− neurons contained a much higher density of TDP-43 granules in the nucleus (Fig. 2e–f), and more cytoplasmic TDP-43 granules in Grn−/− neurons were attached to abnormally enlarged lysosomes (Fig. 2d, arrowheads in left lower panel, Fig. 2g). By 19–24 months, most TDP-43 granules were embedded within filamentous protein aggregates (Fig. 2e), similar to findings in FTLD-GRN patients18. In addition to the TDP-43 phenotypes, IEM for nuclear pore protein Nup98, an essential component of the nucleoporin complexes19, showed that all Nup98 proteins in Grn+/+ neurons were detected along the nuclear membrane (Fig. 2d, arrowheads in right upper panel). In contrast, most Nup98 proteins in Grn−/− neurons were displaced from the nuclear membrane at 12 months (Fig. 2d, arrowheads in right lower panel), or in filamentous aggregates at 24 months (Fig. 2e).
Grn−/− microglia promote TDP-43 proteinopathy
To determine how Grn−/− microglia might promote TDP-43 proteinopathy and nuclear pore defects in Grn−/− neurons, we isolated primary microglia from postnatal day 3 Grn+/+ and Grn−/− mice (P3-MG), performed single-cell RNA-seq (scRNA-seq), and compared them with snRNA-seq data from Th-MG (Extended Data Fig. 5a). Unbiased clustering revealed 4 major clusters in Grn+/+ and Grn−/− P3-MG, with cluster A exhibiting distinct separation between the two genotypes (Extended Data Fig. 5b). Co-clustering of scRNA-seq P3-MG with snRNA-seq data from 2 to 19 months Th-MG further demonstrated the overlap between the transcriptomic profiles of P3-MG-A and Th-MG (Extended Data Fig. 5c). Therefore, only P3-MG-A cells were used in further analysis. Among the 160 DEGs in cluster A in Grn−/− P3-MG, 34 were shared with 19 months Th-MG (P = 1.42 × 10⁻²⁹), and hierarchical analysis based on DEGs showed that P3-MG and 19 months Th-MG clustered based on their Grn genotype (Extended Data Fig. 5d–e). Consistent with these results, NanoString nCounter neuroinflammation panel identified 100 DEGs in Grn−/− P3-MG, 14 of which were consistently up- or down-regulated in 19 months Grn−/− Th-MG (P = 1.35 × 10⁻¹⁷, Extended Data Fig. 5e–g). Western blots validated several DEGs in P3-MG, including Cathepsin B, Myosin Va, Adam33, ATG7, Mef2c and Numb (Extended Data Fig. 5h).
To determine whether Grn−/− microglia secreted factor(s) to promote TDP-43 proteinopathy and nuclear pore defects in Grn−/− neurons, we harvested serum-free microglia conditioned media (MCM) from Grn+/+ and Grn−/− P3-MG. In parallel, we prepared low-density primary neuron cultures from the cerebral cortex and ganglionic eminences (GE) of embryonic day 15.5 (E15.5) Grn+/+ and Grn−/− mice, which provided an enriched source of excitatory neurons and GABAergic inhibitory neurons, respectively. After 14 days in vitro (DIV14), Grn+/+ and Grn−/− cortical neurons or GE-derived GABAergic neurons were incubated with Grn+/+ or Grn−/− MCM to determine their impacts on neuronal survival using cleaved caspase-3 antibody (Extended Data Fig. 6). This approach showed that Grn+/+ MCM induced cell death in 15.6% of Grn+/+ cortical neurons and 31.6% of Grn−/− cortical neurons, whereas Grn−/− MCM caused much more cell death in Grn+/+ and Grn−/− cortical neurons (Fig. 3a). Interestingly, Grn+/+ and Grn−/− GABAergic neurons were significantly more resistant to cell death induced by Grn−/− MCM (Fig. 3b). These results are consistent with the snRNA-seq data and support that Grn−/− microglia produce factors that preferentially kill excitatory neurons.
Figure 3 |. Progranulin deficient microglia promote TDP-43 proteinopathy in Grn−/− neurons.
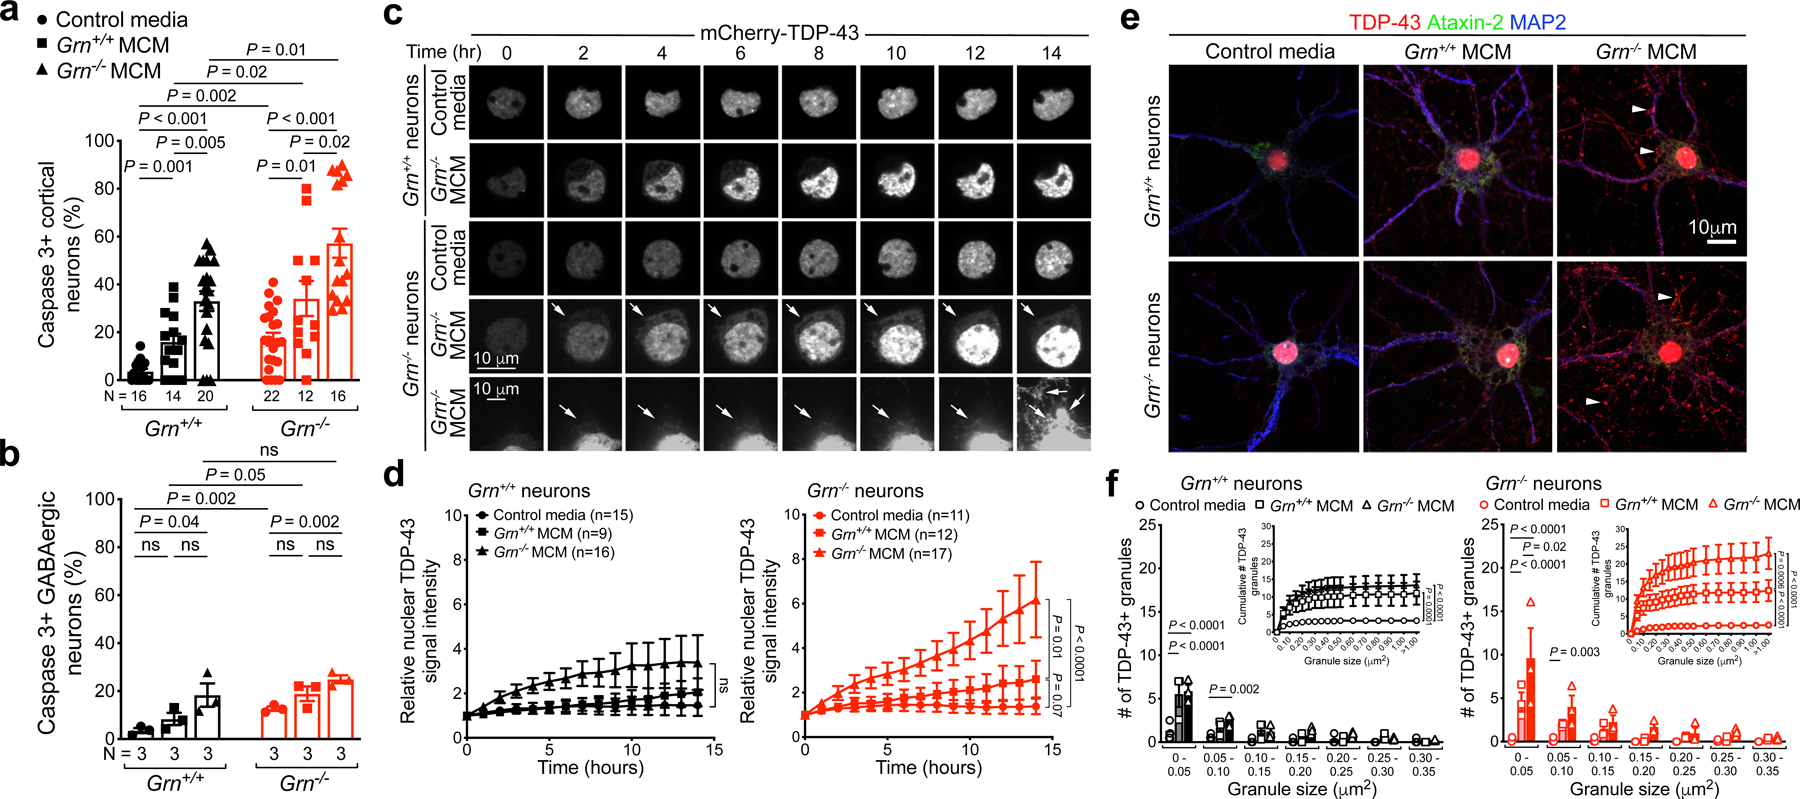
a–b. Grn−/− microglia conditioned media (MCM) promote more cell death in Grn−/− cortical neurons (a) than GABAergic neurons (b). Data represent mean ± s.e.m. Statistics use two-tailed unpaired Student’s t test. N indicates the number of independent cultures used for quantification. c. Images of mCherry-TDP-43-expressing Grn+/+ cortical neurons treated with control media (1st row) or Grn−/− microglia conditioned media (MCM)(2nd row), and Grn−/− neurons treated with control media (3rd row) or Grn−/− MCM (4th and 5th rows). Arrows in 4th and 5th rows indicate the extension of mCherry-TDP-43 from nucleus to cytoplasm. d. Quantification of nuclear mCherry-TDP43 signal in Grn+/+ and Grn−/− neurons for each time point in panel c. The left graph represents nuclear mCherry-TDP-43 signal in Grn+/+ neurons, whereas the right graph represents data from Grn−/− neurons. Data represent mean ± s.e.m. Statistics use two-way ANOVA, ns, not significant. The number of neurons analyzed is indicated in each graph. See METHODS for the numbers of independent cultures for each condition. e. Confocal images of Grn+/+ and Grn−/− neurons treated with control media, Grn+/+ MCM or Grn−/− MCM. Grn−/− neurons treated with Grn−/− MCM show robust accumulation of TDP-43 granules in the cytoplasm and dendrites (arrowheads), whereas the distribution of Ataxin-2 in these neurons is diffuse with no evidence of granule formation. f. Quantification shows most TDP-43 granules in Grn+/+ and Grn−/− neurons induced by Grn+/+ or Grn−/− MCM are smaller than 0.05 μm2. Compared to Grn+/+ MCM, Grn−/− MCM promotes more and larger TDP-43 granules in Grn−/− neurons. Data represent mean ± s.e.m., from 3 independent cultures. Statistics in dot plots use two-tailed unpaired Student’s t test, whereas and the statistics in the cumulative plots use two-way ANOVA.
Next, we asked whether Grn−/− MCM can induce TDP-43 pathology similar to those in Grn−/− thalamic neurons. To test this, we expressed mCherry-TDP-43 in Grn+/+ and Grn−/− cortical neurons and used live imaging to monitor the distribution of mCherry-TDP-43 after treatment with control media, Grn+/+ MCM or Grn−/− MCM. Grn+/+ cortical neurons treated with control media, Grn+/+ MCM or Grn−/− MCM showed no significant increase in nuclear mCherry-TDP-43 signals (Fig. 3c–d, Supplementary Videos 1–2). By contrast, Grn−/− cortical neurons exhibited a modest increase in nuclear mCherry-TDP-43 when treated with Grn+/+ MCM, and a highly significant increase in nuclear and cytoplasmic mCherry-TDP-43 when treated with Grn−/− MCM (arrows in 4th row, Fig. 3c, Supplementary Videos 3–4). Remarkably, several Grn−/− MCM-treated Grn−/− neurons showed marked increases in nuclear mCherry-TDP-43, which quickly extended into cytoplasm as distinct granular structures (arrows in 5th row, Fig. 3c, Supplementary Video 5), suggesting a breach in the integrity of nuclear pore in these neurons. In support of this, 3D structured illumination microscopy (SIM) showed that, compared to Grn+/+ neurons, Nup98 distribution in the Grn−/− neurons was more uneven when cultured in control media or Grn−/− MCM. Furthermore, Grn−/− MCM significantly reduced Nup98 density in Grn+/+ and Grn−/− neurons (Extended Data Fig. 7).
To characterize Grn−/− MCM-induced cytoplasmic TDP-43 phenotypes, we showed that Grn−/− MCM induced a modest accumulation of endogenous TDP-43 in the cytoplasm and dendrites of Grn+/+ neurons, and much more abundant TDP-43 accumulation in Grn−/− neurons (Fig. 3e–f). Similar to Grn−/− thalamic neurons, cytoplasmic TDP-43 granules in MCM-treated Grn+/+ or Grn−/− neurons showed partial overlap with LAMP1+ late endosomes/early lysosomes and Tom20+ mitochondria, but not with Ataxin-2+ stress granules (Extended Data Fig. 8a–d). To compare Grn−/− MCM-induced TDP-43 proteinopathy with arsenite-induced TDP-43 granules20–22, we treated Grn+/+ and Grn−/− cortical neurons with 10μM sodium arsenite, which induced robust formation of G3BP1+ stress granules, TDP-43 granules, and cell death regardless of genotype. Intriguingly, arsenite-induced TDP-43 granules in Grn+/+ and Grn−/− neurons were distinctly separated from G3BP1+ granules, despite ultrastructural features similar to those induced by Grn−/− MCM (Extended Data Fig. 9). Collectively, these results support that Grn−/− microglia are indeed neurotoxic and Grn−/− MCM-induced TDP-43 granules in Grn−/− neurons are different from stress granules.
Blocking complements mitigates neurodegeneration
Given the profound vesicular trafficking defects in Grn−/− Th-MG and P3-MG, we asked whether these defects may facilitate the production of complements via intracellular membrane-bound organelles23,24, thereby providing potential sources for neurotoxicity. In support of this, immunohistochemistry showed a marked increase of C1q and C3b in Grn−/− Th-MG as early as 7 months old (Extended Data Fig. 10a). By 12 months, Grn−/− Th-MG contained abundant C1q and C3b that colocalized with LAMP2+ or Cathepsin B+ vesicles; however, no C1q or C3b was detected in Grn−/−;C1qa−/−;C3−/− Th-MG (Fig. 4a–b). Finally, ELISA assays showed Grn−/− MCM contained significantly more C1q and C3b than Grn+/+ MCM, whereas no C1q or C3b was detected in Grn−/−;C1qa−/−;C3−/− MCM (Extended Data Fig. 10b).
Figure 4 |. Complements C1q and C3b promote TDP-43 granule formation and neurodegeneration in Grn−/− mice.
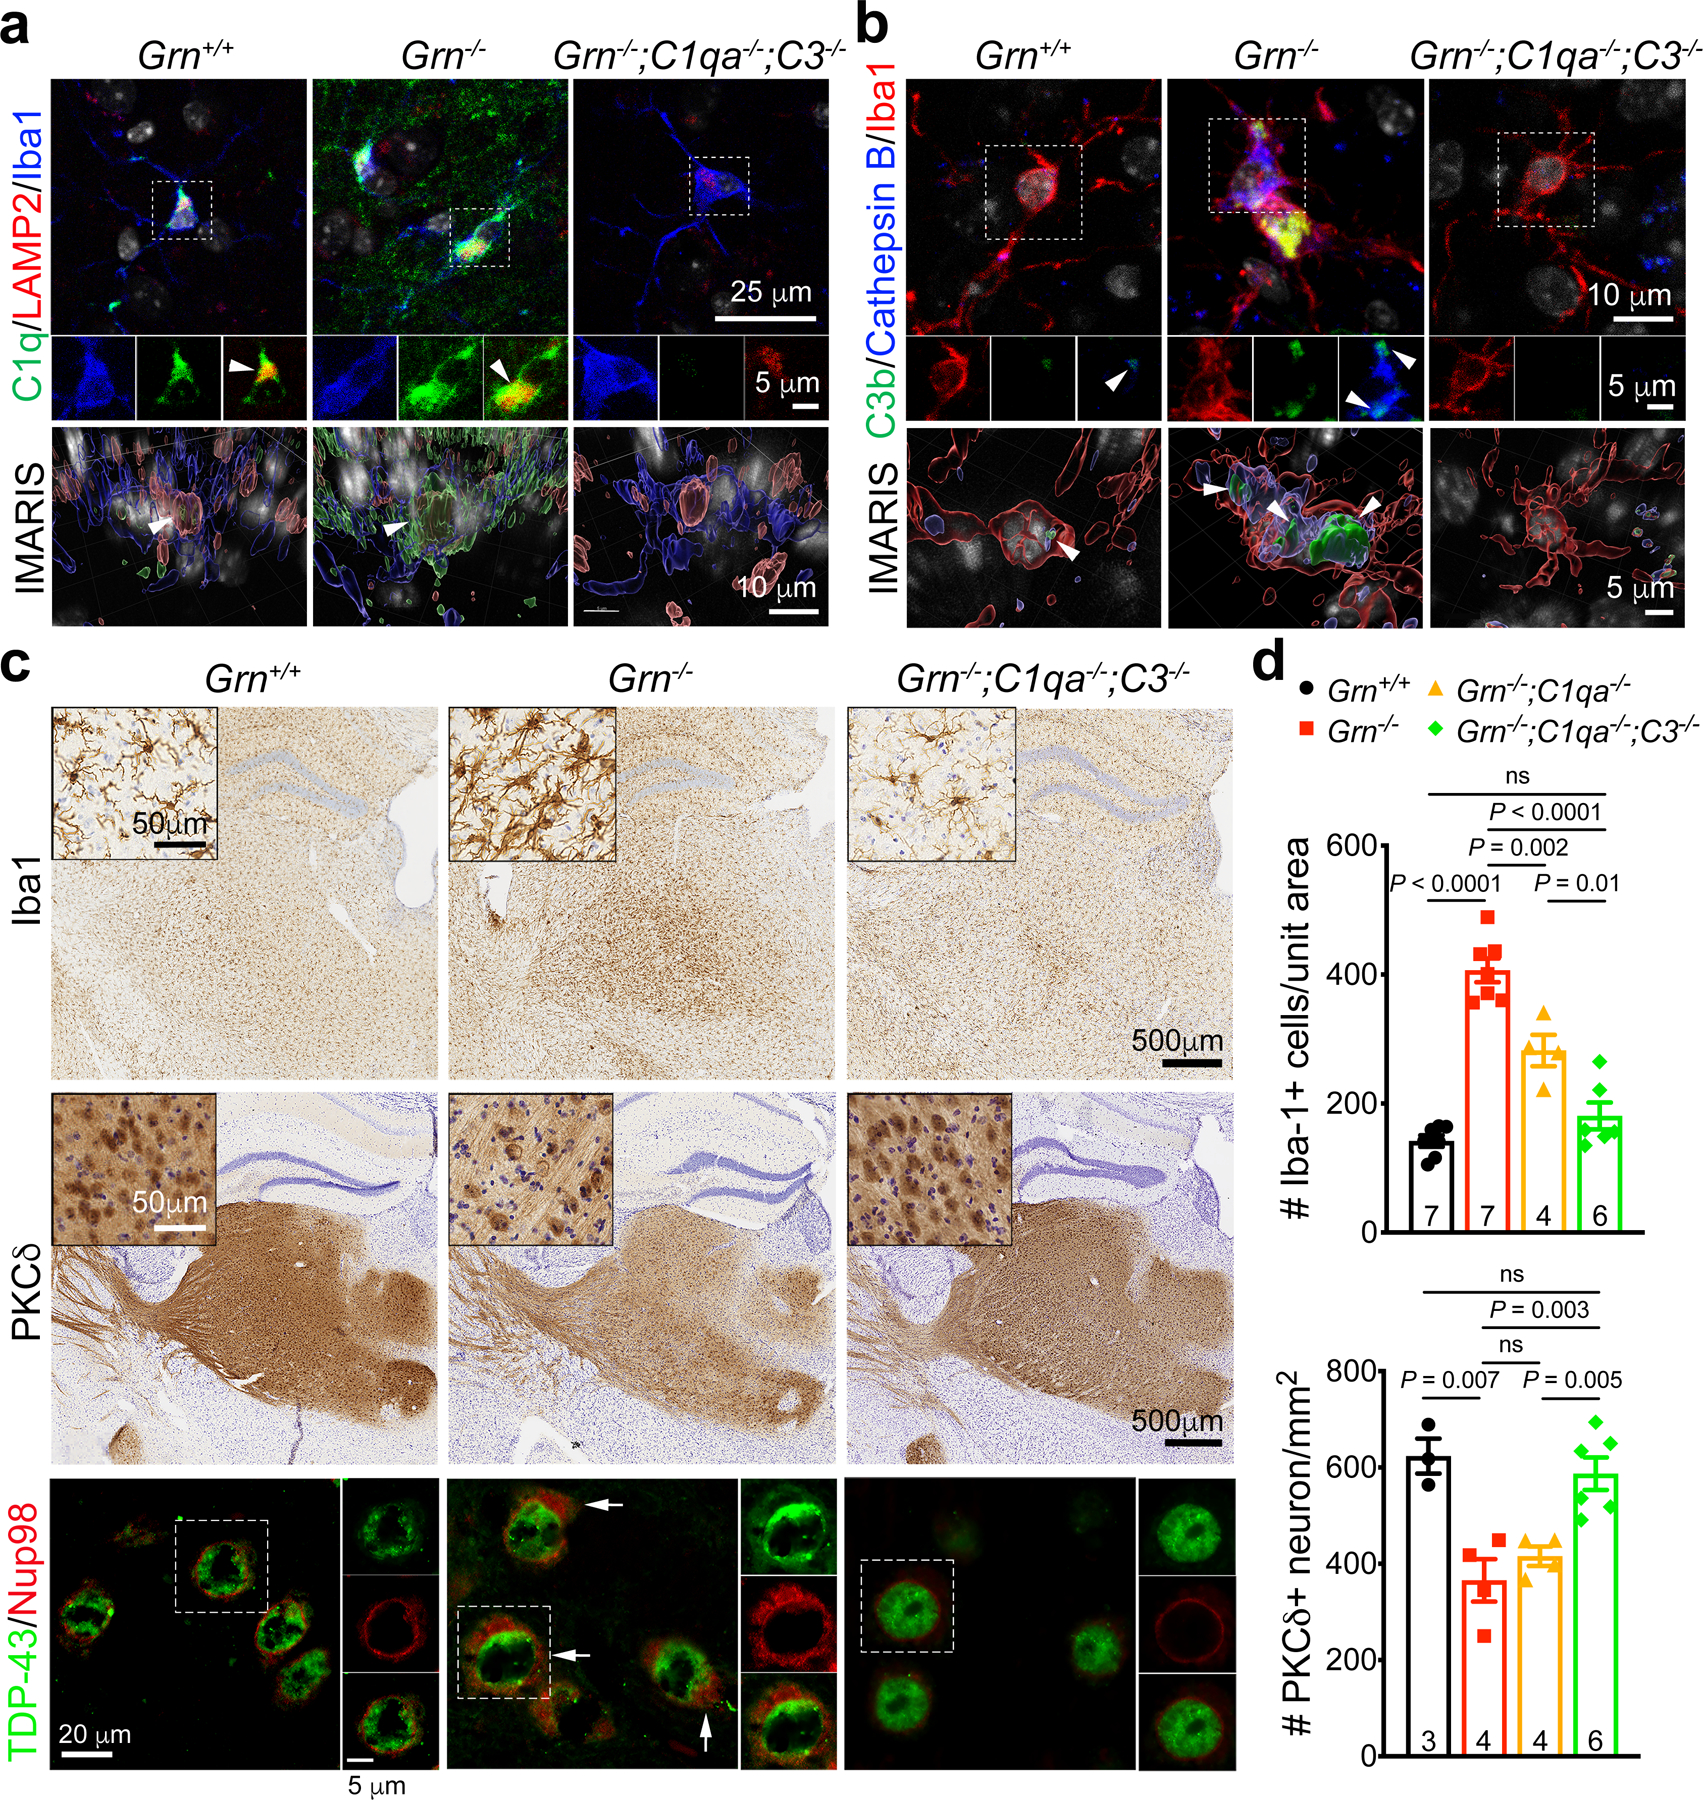
a–b. Confocal and IMARIS 3D images of C1q and C3b proteins in the cytoplasm of Th-MG in 12 months old Grn+/+, Grn−/− and Grn−/−;C1qa−/−;C3−/− mice. Small amounts of C1q and C3b proteins are detected in Grn+/+ Th-MG where they colocalize with LAMP2+ or Cathepsin B+ vesicles (left panels), whereas much more abundant C1q and C3b proteins are present in Grn−/− Th-MG where these two proteins show overlap with LAMP2+ and Cathepsin B+ vesicles (arrowheads). No C1q or C3b signals are detected in Grn−/−;C1qa−/−;C3−/− Th-MG. Similar results were obtained from n=3 mice per genotype. c. Immunohistochemistry show a near complete rescue of microgliosis (1st row) and PKCδ+ neuron loss (2nd row) in the ventral thalamus of 12 months old Grn−/−;C1qa−/−;C3−/− mice. Insets are higher magnifications for Iba1+ microglia and PKCδ+ neurons. Confocal images show the presence of cytoplasmic TDP-43 and Nup98 in Grn−/− neurons (arrows, 3rd row), but not in Grn−/−;C1qa−/−;C3−/− neurons. d. Stereology quantification of microglia and PKCδ+ neuron in 12 months old Grn+/+, Grn−/−, Grn−/−;C1qa−/− and Grn−/−;C1qa−/−;C3−/− mice. Data represent mean ± s.e.m. The number of mice for each genotype is indicated at the bottom of each graph. Statistics use two-tailed unpaired Student’s t test, ns, not significant.
To determine whether C1q and C3b are sufficient to induce TDP-43 proteinopathy, we treated Grn+/+ and Grn−/− neurons with purified human C1q, C1q+C3b, or C4. These results showed C1q and C1q+C3b, but not C4, could increase cytoplasmic TDP-43 granules in Grn+/+ and Grn−/− neurons (Extended Data Fig. 10c–d). Curiously, compared to Grn−/− MCM, C1q and C3b only modestly increased cell death in Grn+/+ or Grn−/− neurons. To investigate whether removing C1q and C3 might alter the neurotoxic properties of Grn−/− microglia, we prepared MCM from P3 Grn−/−;C1qa−/− and Grn−/−;C1qa−/−;C3−/− mice and showed that both failed to increase TDP-43 granules or cell death in Grn+/+ and Grn−/− neurons (Extended Data Fig. 10e). These results suggested that Grn−/− microglia may use additional mechanisms, such as complement-mediated assembly of protein complexes or other non-complement-dependent mechanism to promote TDP-43 proteinopathy and/or neuronal cell death. To test the former hypothesis, we showed that vitronectin, which blocks complement membrane attack complex (MAC), protected Grn+/+ and Grn−/− neurons from Grn−/− MCM-induced cell death (Extended Data Fig. 10f). Furthermore, histopathology showed a modest reduction in microgliosis and partial rescue of PKCδ+ neurons in 12 months old Grn−/−;C1qa−/− thalamus, but a near complete rescue of microgliosis and PKCδ+ neurons in the thalamus of Grn−/−;C1qa−/−;C3−/− mice (Fig. 4c–d). Thalamic neurons in Grn−/−;C1qa−/−;C3−/− mice also showed a marked reduction in cytoplasmic TDP-43 and Nup98 (Fig. 4c).
Conclusion
By combining single-cell transcriptomics, in vitro validations and mouse genetics, we provide critical insights supporting microglia toxicity as a key disease-driving factor that promotes neurodegeneration in PGRN deficiency. Our results delineate a cascade of molecular and cellular events initiated by the transition of Grn−/− microglia from a homeostatic to disease-specific state, which promotes accumulation of nuclear and cytoplasmic TDP-43, nuclear pore defects and cell death in Grn−/− excitatory neurons during ageing (Extended Data Fig. 11). Remarkably, neurotoxicity in Grn−/− microglia can be mitigated by deleting C1q and C3 or by blocking complement-mediated formation of membrane attack complex. While our results support that blocking complement activation can mitigate the neurotoxic properties of Grn−/− microglia, we cannot rule out other cell-intrinsic defects in Grn−/− microglia and/or neurons that may propagate neurodegeneration. In support of the latter possibility, cytoplasmic TDP-43 granules in Grn−/− neurons preferentially attach to lysosomes, suggesting that lysosomal defects in Grn−/− neurons may facilitate TDP-43 protein aggregate formation7,8,25. Indeed, TDP-43 granules induced by Grn−/− microglia are morphologically different from stress granules20–22. Whether they are related to those induced by axotomy, traumatic brain injury or muscle regeneration26–28 remains to be investigated.
METHODS
Mice
All experiments were conducted in accordance with the University of California San Francisco Institutional Animal Care and Use Committee guidelines (IACUC Protocol #AN169548). Mice carrying deletion of exons 2–13 of the mouse progranulin (Grn−/−) gene (Grntm1.1Far/Mmjax) were from previous studies in our laboratory29,30. C1qa−/− mice were a generous gift from Dr. Marina Botto (Imperial College London, United Kingdom)31 and C3−/− mice (C3tm1Crr/J, JAX #003641) were obtained from the Jackson Laboratories. The C1qa−/− and C3−/− mice were intercrossed with Grn−/− mice to generate Grn−/−;C1qa−/− and Grn−/−;C1qa−/−;C3−/− mice.
Single-nucleus RNA-sequencing (snRNA-seq): sample preparation
Fresh thalami from Grn+/+ and Grn−/− mice at age 2, 4, 7, 12 and 19 months old (all littermates for each age group, including 4 biological replicates per age, per genotype) were microdissected for nuclei isolation. Microdissected thalami were homogenized in 5 ml RNAase-free lysis buffer (0.32 M sucrose, 5 mM CaCl2, 3 mM MgAc2, 0.1 mM Tris-HCl, 1 mM DTT, 0.1% Triton X-100 in DEPC-treated water) using glass dounce homogenizer (Thomas Scientific) on ice. The homogenate was loaded into a 30 ml polycarbonate ultracentrifuge tube (Beckman-Coulter), 9 ml of sucrose solution (1.8 M sucrose, 3 mM MgAc2, 1 mM DTT, 10 mM Tris-HCl in DEPC-treated water) was added to the bottom of the tube with the homogenate, and the tube was centrifuged at 107,000 g for 2.5 hours at 4°C. After removing the supernatants, pellets containing the nuclei were incubated in 250 μl of DEPC-treated water-based PBS for 20 min on ice before resuspending the pellets using the same solution. Nuclei were counted using a hemocytometer and single-nucleus capture was performed using the 10X Genomics Single-Cell 3’ system (ver 2). For each sample, the intended target capture was 4,000 nuclei per sample and library preparation was performed using the manufacturer’s protocol. Single-nuclei libraries from individual samples were pulled and sequenced on the HiSeq 2500 System (Illumina) at UCSF Genomics Core Facility. RNA integrity analysis was performed using the Agilent 2100 Bioanalyzer and RNA Pico Chip assay to ensure that all samples had RNA integrity number (RIN) > 6.5. One sample from 2 months old Grn+/+ mouse and one from 19 months old Grn−/− mouse were removed due to suboptimal RNA quality (Extended Data Fig. 1a).
Primary microglia from Grn+/+ and Grn−/− mice at postnatal day (P) 3, which were co-cultured with astrocyte for 14 days and mono-cultured with serum-free media for additional 72 hours, were prepared (see microglia culture section for detail). The targeted cell volume was 4,000 cells for each sample and library construction was performed using the 10X Genomics Single-Cell 3’ system’s protocol (ver 3). Single-cell libraries from individual samples were pulled and sequenced on the HiSeq 2500 System (Illumina) at UCSF Genomics Core Facility.
snRNA-seq and scRNA-seq: data processing, dimensionality reduction, clustering and t-SNE visualization
For library demultiplexing, CellRanger software v. 1.3.1 was used for fastq file generation, read alignment and UMI quantification. CellRanger was used with default parameters, except for using pre-mRNA reference file (ENSEMBL, GRCh38) to insure capturing intronic reads originating from pre-mRNA transcripts abundant in the nuclear fraction. Individual expression matrices containing numbers of Unique Molecular Identifiers (UMIs) per nucleus per gene were filtered to retain nuclei with at least 500 genes expressed and less than 5% of total UMIs originating from mitochondrial and ribosomal RNAs. Genes expressed in less than three nuclei were filtered out. In addition, mitochondrial RNAs were filtered out to exclude transcripts coming from outside the nucleus to avoid biases introduced by nuclei isolation and ultracentrifugation. Individual matrices were combined. UMIs were normalized to the total UMIs per nucleus and log transformed. Filtered log-transformed UMI matrix was used to perform truncated singular value decomposition (SVD) with k=50. Scree plot was generated to select the number of significant principle components (PCs) by localizing the last PC before the explained variance reaches plateau. The significant PCs were used to calculate Jaccard distance-weighted nearest neighbor distances; number of nearest neighbors was assigned to root square of number of nuclei. Resulting graph with Jaccard-weighted edges was used to perform Louvain clustering32.
snRNA-seq and scRNA-seq: cell type annotation, quantification of cell types, differential gene expression analysis and gene ontology (GO) analysis
To visualize nuclei transcriptomic profiles in two-dimensional space, t-distributed Stochastic Neighbor Embedding (t-SNE) was performed with the selected PCs and combined with cluster annotations. Cell types were annotated based on expression of known marker genes visualized on the t-SNE plot and by performing unbiased gene marker analysis. For the latter, MAST33 was used to perform differential gene expression analysis by comparing nuclei in each cluster to the rest of nuclei profiles and following regression model: ~genotype + sex + cngeneson, where cngeneson is the gene detection rate. Genes with FDR<0.05 and log fold change >1 were selected as cell type markers. For heatmap generation and visualization, Morpheus was used (https://software.broadinstitute.org/morpheus).
For pseudobulk differential expression analysis of 7, 12 and 19 months old thalamic microglia (Th-MG), we utilized edgeR.sum.counts approach34. First, single-nucleus level counts for each gene expressed in Th-MG were aggregated by taking the sum of counts of each gene in all nuclei captured from each animal. After that, the aggregated counts were loaded into edgeR35, and quasi-likelihood F-test was used to identify differentially expressed genes after normalization for size factors. For 7 months old mice, sex of animals was added into the design formula; all 12 and 19 months animals were females. For Gene Ontology (GO) analysis, we used PANTHER Version 14.036,37 or Metascape38 to perform statistical overrepresentation test for DEGs from each cluster. Within each cluster, all genes tested for differential expression used cluster-specific background genes and GO Biological Processes were chosen to represent the functional properties. Processes with false discovery rate (FDR) <0.05 were considered to be significant.
Co-clustering of P3 microglia scRNA-seq data with snRNA-seq thalamus microglia data
Integration of snRNA-seq and scRNA-seq microglia data was performed with Seurat 3 R package39 using FindIntegrationAnchors and IntegrateData functions. The number of principle components for downstream analyses was selected based on scree plot. Three clusters of P3 microglia (P3-MG) from the scRNA-seq that co-clustered with 19 months old Th-MG were selected and combined into a single metacluster named P3-MG-A. Cells from P3-MG-A were used to perform differential expression analysis using MAST and the following regression model: ~genotype + sex + cngeneson. To perform hierarchical clustering of Grn+/+ and Grn−/− P3-MG and Th-MG, we first used SCTransform function of Seurat to regress out the effect of different platform, age, and brain region (10X v.3 scRNA-seq, P3 and cortex versus v.2 snRNA-seq, 19 months and thalamus) on gene expression. After transformation, we selected genes that were differentially expressed between Grn+/+ and Grn−/− microglia in either P3-MG or 19 months Th-MG, and calculated average normalized expression for each sample analyzed by pulling all microglia cells by animal. We then performed hierarchical clustering of the samples using Euclidean distance as the metric and completed clustering.
snRNA-seq: pseudotime analysis
Version 3 of Monocle R package40 was used to reconstruct trajectories of microglia from thalami of Grn+/+ and Grn−/− mice based on snRNA-seq data. Monocle 3 was used with default options, except for using reduction_method = “UMAP” and preprocess_method=“PCA” options for reduce_dimension function and cluster_method = ‘louvain’ for cluster_cells function. After reconstructing separate trajectories for Grn+/+ and Grn−/− microglia, the terminal node of each trajectory located in youngest (2 months old) microglia was chosen as the starting point to calculate pseudotime based on the single-cell trajectory. Once the pseudotime was calculated, graph_test function was used to identify genes dynamically expressed along the Grn+/+ and Grn−/− microglia trajectories. FDR-corrected p value < 0.05 was used as the cutoff to determine the significant dynamically expressed genes. In order to visualized Grn+/+ and Grn−/− microglia trajectories on the same scale, both trajectories was plotted using the same limits for UMAP1 and UMAP2 coordinates.
In order to plot expression of genes along the Grn+/+ and Grn−/− microglia trajectories side-by-side, normalized log-transformed UMI counts for both the Grn+/+ and Grn−/− microglia were averaged using sliding window approach to obtain the same number of meta-cells for both datasets. Same sliding window transformation was performed for pseudotime values of each microglia cell in both datasets. Then, the transformed UMIs were fit using the same approached used by Monocle 3 to obtain gene expression/pseudotime curves: speedglm(“expression ~ splines::ns(pseudotime, df=3)”, data = exp_data.sel, family = stats::quasipoisson(), acc=1e-3, model=FALSE, y=FALSE). Resulting transformed UMIs, pseudotime values and fit curves for both datasets were then combined in a single dataframe to be used to plot gene expression along psedotime in the Grn+/+ and Grn−/− microglia lineages side-by-side.
Immunohistochemistry and stereology counting
Immunohistochemical stains were performed on 40 μm free-floating sections of 4% PFA-fixed mouse brains. The immunostaining was developed using DAB technique and counterstained with Cresyl Violet Staining. Primary antibodies for immunohistochemistry included P2Y12 (AnaSpec, 55043A, 1:500), TMEM119 (Abcam, ab209064, 1:300), Apolipoprotein E (Abcam, ab1906, 1:200), ADAM33 (Thermo Fisher Scientific, PA5-28128, 1:500), PKC-delta (Abcam, ab182126, 1:2000), FOXP2 (Abcam, ab16046, 1:6000), C1q (Abcam, ab182451, 1:1000), C3b (Millipore, MABF972, 1:500), and Iba-1 (Wako, 019-19741, 1:3000). Secondary antibodies for immunohistochemistry included goat anti-rabbit IgG antibody (H+L), biotinylated (Vector Laboratories, BA-1000, 1:300) and goat anti-mouse IgG antibody (H+L), biotinylated (Vector Laboratories, BA-9200, 1:300). For stereology-based quantification, Iba-1-positive microglia, Foxp2-positive neurons and PKC-delta-positive neurons were counted using optical fractionator based unbiased method using Stereo Investigator on a PC that is attached to an Olympus BX5 microscope with a motorized XYZ stage (MBF Biosciences, Williston, VT)29. DAB staining images were captured using an Aperio ImageScope (Leica Biosystems) with a 40X objective.
Immunofluorescence staining was performed on 40μm free-floating sections prepared using a Leica cryostat. The following primary antibodies were used: anti-ADAM33 (Thermo Fisher Scientific, PA5-28128, 1:100), anti-Apolipoprotein E (Abcam, ab1906, 1:200), anti-Ataxin-2 (BD Biosciences, 611378, 1:600), anti-C1q (Abcam, ab182451, 1:1000), anti-C3b (Millipore, MABF972, 1:500), anti-Cathepsin B (R&D systems, AF965, 1:500), anti-Cathepsin B (Proteintech, 122161-1-AP, 1:100), anti-Cleaved Caspase 3 (Cell Signaling, 9664, 1:300), anti-G3BP (Abcam, ab56574, 1:200), anti-GAD67 (Millipore, MAB5406, 1:300), anti-GPNMB (LifeSpan BioSciences, LS-11132, 1:100), anti-FOXP2 (Abcam, ab1307, 1:500), anti-Iba1 (Novus Biologicals, NB100-1028, 1:250), anti-IGF1 (Abcam, ab40657, 1:1000), anti-Lamin B1 (Abcam, ab133741, 1:200), anti-LAMP1 (BD Biosciences, 553792, 1:500), anti-LAMP2 (BD Biosciences, 550292, 1:200), anti-MAP2 (Abcam, ab5392, 1:3000), anti-NeuN (Millipore, MAB377, 1:300), anti-Numb (gift from Dr. Yuh Nung Jan, 1:3000)41, anti-NUP98 (Abcam, ab50610, 1:100) anti-P2Y12 (AnaSpec, AS-55043A, 1:50), anti-TDP-43 (Proteintech, 10782-2-AP, 1:800), anti-Iba1 (Wako, 019-19741, 1:3000), anti-TMEM119 (Abcam, ab209064, 1:300), anti-Tom20 (Millipore, MABT166, 1:500), anti-TUJ1 (Covance, MMS-435P, 1:400), and anti-Ubiquitin (Millipore 1, MAB1510, 1:300). Secondary antibodies included donkey anti-mouse IgG (H+L), Alexa Fluor 488 (Invitrogen, A-21202, 1:300), donkey anti-rabbit IgG (H+L), Alexa Fluor 488 (Invitrogen, A21206, 1:300), donkey anti-goat IgG (H+L), Alexa Fluor 568 (Invitrogen, A-11057, 1:300), donkey anti-mouse IgG (H+L), Alexa Fluor 568 (Invitrogen, A-10037, 1:300), donkey anti-rabbit IgG (H+L), Alexa Fluor 568 (Invitrogen, A-10042, 1:300), goat anti-rat IgG (H+L), Alexa Fluor 568 (Invitrogen, A-11077, 1:300), donkey anti-rabbit IgG (H+L), Alexa Fluor 647 (Invitrogen, A-31573, 1:300), donkey anti-mouse IgG (H+L), Alexa Fluor 647 (Invitrogen, A-31571, 1:300), goat anti-chicken IgY (H+L), Alexa Fluor 633 (Invitrogen, A-21103, 1:300), donkey anti-chicken IgY (H+L), CF® 633 (Biotium, 20168, 1:300), and donkey anti-rat IgG (H+L), Alexa Fluor 594 (Invitrogen, A-21209, 1:300). Staining for TDP-43, Adam33, Lamin B1, LAMP1 and Tmem119 required antigen retrieval treatment, with incubating tissue sections in 10 mM sodium citrate (pH 6.0) at 95°C for 30 minutes. DAPI was used for fluorescent nuclear counterstaining. Confocal images were captured using a Nikon C2 Confocal Microscopy with a 60X objective. The 3D images were reconstructed from z-stacks images (2.5 μm-interval) by the surpass module in IMARIS software (Bitplane). Confocal images for TDP-43, TuJ1 and DAPI from 7, 12, 19 and 24 months old Grn+/+ and Grn−/− thalamic neurons were used to highlight the areas of interest in the cytoplasm and nucleus. The integrated intensity and mean grey values of TDP-43 were calculated using the formula, CTCF = Integrated Density – (Area of selected cell X Mean fluorescence of background readings).
Immunogold electron microscopy (IEM)
Mouse brain tissues for IEM analysis were fixed with 4% PFA overnight. Following the fixation, 40 μm-thick free-floating sections were incubated with a cryoprotectant solution for 2 hours at room temperature and freeze-thawed. The sections were incubated with 4% blocking normal goat serum for 1 hour and with anti-TDP-43 antibody (Proteintech, 10782-2-AP, 1:50) and NUP98 antibody (Abcam, ab50610, 1:50) in 1% blocking normal goat serum overnight. After that, the sections were incubated with 0.2% BSAc and 0.2% fish gelatin (both from Electron Microscopy Sciences, Hatfield, PA) in PBS for 10 minutes and with gold nanoparticle-conjugated secondary antibodies, including goat anti-rabbit IgG (H+L), Ultra Small (Electron Microscopy Sciences, 25101, 1:100) or goat anti-rat IgG (H+L), Ultra Small (Electron Microscopy Sciences, 25181, 1:100) for 2 hours. After the PBS washes, the sections were fixed in 1% glutaraldehyde for 10 minutes. The immunogold particle signal was increased using a silver enhancement kit (Electron Microscopy Sciences) at 37°C for 2 hours. Finally, the sections were post-fixed in 0.5% osmium tetroxide for 10 minutes, dehydrated, and embedded in resin. To quantify TDP-43 granule size, we used NIH ImageJ and set threshold from 0 to 60 using 8-bit images, and run particle analysis to extract granule size and number.
Primary microglia cultures, preparation of microglia conditioned media (MCM) and ELISA
Primary microglia cultures were prepared using the previously established protocols42. Briefly, cerebral cortex from P3 Grn+/+ and Grn−/− neonatal mice were dissected and cultured in the DMEM media with 20% FBS and 20 ng/ml GM-CSF. After 10–14 days in culture (DIV10-14), microglia were recovered from the mixed-glia cultures by shaking at 200 rpm for 2 hours and transferred to serum-free conditioned medium (DMEM/F12 medium with 2 mM glutamine, 5 μg/ml N-acetyl-L-cysteine, 5 μg/ml insulin, 100 μg/ml apo-transferrin, 100 ng/ml sodium selenite, 2 ng/ml TGF-β2, 100 ng/ml IL-34 and 1.5 μg/ml cholesterol) for additional 72 hours. The conditioned media from microglia were concentrated with Ultracel® - 10K (Amicon, UFC801096), and the final protein concentrations measured using BCA assay kit (Thermo Fisher, 23235). Complements in Grn+/+ and Grn−/− microglia conditioned media (MCM) were quantified using C1q ELISA kit (Abcam, ab170246) and C3b ELISA kit (Abcam, ab195461).
NanoString nCounter gene expression analysis
RNA was isolated using RNeasy Kit from four independent Grn+/+ and Grn−/− P3-MG that have been cultured for 72 hours with serum-free media. RNA integrity analysis was performed using the Agilent 2100 Bioanalyzer and RNA Pico Chip assay to confirm that all samples had RIN > 6.6. Differentially expressed genes were analyzed by nSolver software version 4.0 using the data generated by nCounter Mouse Neuroinflammation Panel (NanoString Technologies).
Western blot analyses
Protein lysates were prepared from P3 Grn+/+ and Grn−/− microglia using RIPA lysis buffer (1% NP-40, 0.1% SDS, 1% sodium deoxycholate, 20 mM Tris pH 7.6, 150 mM NaCl, 10 mM NaF, 1 mM Na3VO4) supplemented with protease inhibitor cocktail. Proteins were separated by SDS-PAGE and transferred to nitrocellulose membrane (Bio-Rad). The membranes were blocked in 5% non-fat dry milk (Bio-Rad) for 30 min before incubating with primary antibodies at 4°C overnight. Primary antibodies included anti-ADAM33 (Thermo Fisher, PA5-28128, 1:1000), anti-ATG7 (Abcam, ab133528, 1:3000), anti-Cathepsin B (Proteintech, 12216-1-AP, 1:2000), and anti-GAPDH (Millipore, MAB374, 1:4000), anti-MEF2C (Cell Signaling, 5030, 1:1000), anti-Myosin Va (Cell Signaling, 3402, 1:2000) and anti-Numb (gift from Dr. Yuh Nung Jan, 1:5000)41. On the second day, the membranes were washed with 0.1% TBST washing buffer followed by incubation with secondary antibodies conjugated with HRP at room temperature for 1 hour. Secondary antibodies used for western blots included goat anti-mouse IgG (H+L), peroxidase conjugated (Millipore, 401215, 1:5000), and goat anti-rabbit IgG (H+L), peroxidase conjugated (Millipore, 401315, 1:5000).
Primary cortical neuron and ganglionic eminence (GE)-derived GABAergic inhibitory neuron cultures
Primary cortical neurons were prepared from the cerebral cortex of E15.5 Grn+/+ and Grn−/− embryos. Briefly, the cortical plates were dissected from embryos in ice cold HBSS, then transferred to 2 ml of 0.25% trypsin/EDTA solution, and incubated in 37°C water bath for 15 min. The dissociated cells were placed in DMEM/high glucose supplemented with 10% FBS, 1X penicillin/streptomycin, and 2 mM L-glutamine (Gibco) as previously reported43,44. We routinely combined 2 or more E15.5 embryonic cortices with the goal to obtain enough cells to grow on multiple 12 mm coverslips. As such, each coverslip was considered as a biological replicate. Approximately 80,000 cells were plated on 12 mm glass coverslips, pre-coated with 1mg/ml poly-L-lysine (P2636, Sigma) in borate buffer solution, in 24-well plates. On in vitro day 1 (DIV1), cultured cortical neurons were switched to Neurobasal medium with 2% B-27 supplement (Invitrogen) and 200 μM L-glutamine twice to completely remove serum from culture media. On DIV2, 5 μM of Ara C was added to culture media to inhibit the growth of glial cells. Immunostaining using GAD67 (Millipore, MAB5406, 1:500) and MAP2 (Abcam, ab5392, 1:3000) showed that >95% of these cortical neurons were excitatory neurons. Only 1–5% were GAD67+ inhibitory neurons. Primary GABAergic inhibitory neuron cultures were prepared by dissecting the lateral (LGE) and medial ganglionic eminences (MGE) from E15.5 Grn+/+ and Grn−/− embryos45. The dissociation and preparation of GE-derived GABAergic inhibitory neurons were similar to the procedures for cortical neurons. Both Grn+/+ and Grn−/− cortical neurons and GE-derived GABAergic inhibitory neurons were used for experiments on DIV14.
Confocal microscopy analyses of TDP-43 granules, Ataxin-2 and cell death in primary cortical neurons
To characterize the effects of MCM on TDP-43 protein accumulation in neuronal cytoplasm and neuronal cell death, we treated Grn+/+ and Grn−/− cortical neurons and GE-derived GABAergic inhibitory neurons with MCM (100 or 250 μg) for 24 hours. Similar experiments were used to determine the effects of purified human complements C1q, C3b and C4 (Complement Technology, Inc., A099, A114 and A105, respectively) and human vitronectin (LifeSpan Biosciences, LS-G4249). To analyze cell death, cortical neuron cultures were immunostained with antibodies for Cleaved Caspase 3 (Cell Signaling, 9664, 1:300), MAP2 (Abcam, ab5392, 1:3000) and GAD67 (Millipore, MAB5406, 1:300). For each coverslip, 3–6 regions containing at least 10 MAP2+ neurons were chosen at random for quantification. Images were captured using a Nikon C2 Confocal Microscopy with a 10X objective and 2X digital zoom. Total MAP2+ neurons and cleaved caspase 3 and MAP2 double positive (caspase 3+;MAP2+) neurons were counted to determine the percentage of neurons undergoing cell death. To analyze TDP-43 granules, stress granule markers and other intracellular organelles, cortical neuron cultures were stained with antibodies for TDP-43 (Proteintech, 10782-2-AP, 1:800), Ataxin-2 (BD Biosciences, 611378, 1:600), G3BP (Abcam, ab56574, 1:200), LAMP1 (BD Biosciences, 553792, 1:500), Tom20 (Millipore, MABT166, 1:500) and MAP2 (Abcam, ab5392, 1:3000). For each coverslip, 6–12 images were chosen at random and images were captured using the Nikon C2 confocal microscope with a 60X objective.
We used two different approaches to quantify TDP-43 granules in confocal microscopy. First, we used NIH ImageJ to quantify the size and density of TDP-43 granules in the cytoplasm and dendrite of cultured Grn+/+ and Grn−/− neurons treated with control media, Grn+/+ MCM or Grn−/− MCM. We set threshold from 35 to 85 using grayscale 16-bit images, and run particle analysis to extract granule size and number. Second, the signal intensities of TDP-43 were quantified using NIH ImageJ by using MAP2 to highlight the areas of interest in cytoplasm and dendrites. The integrated intensity and mean grey values of TDP-43 were calculated using the formula: CTCF = Integrated Density – (Area of selected cell x Mean fluorescence of background readings). After acquiring the CTCF values, we normalized the signal intensity of TDP-43 in each condition to the CTCF values in Grn+/+ neurons under control media to obtain the relative fold change of TDP-43. The intensity plot profile was performed using Nikon Intensity Profile System.
Live-imaging of neurons expressing mCherry-TDP-43
For transfection of pcDNA-mCherry-FLAG-TDP-43 plasmid46, primary cortical neurons (1.6 × 10⁵ cells) from E15.5 Grn+/+ and Grn−/− embryos were seeded on each chamber of 4-chamber 35 mm glass bottom dish, which was pre-coated with 1mg/ml poly-L-lysine in borate buffer solution, and cultured overnight with DMEM/high glucose supplemented with 10% FBS, 1X penicillin/streptomycin, and 2 mM L-glutamine. On DIV1, cultured cortical neurons were switched to Neurobasal medium with 2% B-27 supplement and 200 μM L-glutamine. On DIV6-8, pcDNA-mCherry-FLAG-TDP-43 plasmid (0.5 μg/chamber) was mixed with Lipofectamine LTX Reagent (8 μl/chamber, Thermo Fisher Scientific) or Lipofectamine PLUS Reagent (16 μl/chamber, Thermo Fisher Scientific) in Opti-MEM (80 μl/chamber, Thermo Fisher Scientific) and added to cultured cortical neurons and incubated for 6 hours at 37°C in 5% CO2. After the transfection, media were changed to Neurobasal medium with 2% B-27 supplement and 200 μM L-glutamine. At 18 hours after the transfection, Grn+/+ and Grn−/− MCM (250μg/ml) were added to the cultured neurons and time-lapse sequences were acquired on a Yokogawa CSU-X1 spinning disk confocal microscope system with a Nikon 60x N.A. 1.49 objective and a Photometrics BSI Prime back-thinned sCMOS camera47. 37°C and 5% CO2 were maintained throughout the experiment. The corrected total cell fluorescence (CTCF) of nuclear TDP-43 were quantified using NIH ImageJ by measuring normalized nuclear fluorescence intensity over time.
Nuclear pore protein Nup98 distribution analysis
To evaluate the distribution of nuclear pore protein Nup98, cortical neuron cultures were immunostained with antibodies for NUP98 (Abcam, ab50610, 1:200), Lamin A (Abcam, ab26300, 1:200), Lamin B1 (Abcam, ab133741, 1:200) and MAP2 (Abcam, ab5392, 1:3000)48. Note that Lamin A and Lamin B1 antibodies, both rabbit polyclonal antiboides, were added together to further enhance the detection of the nuclear membrane. Detection for Lamin A and B1 used the same secondary antibodies. After staining, the samples were post-fixed using 3% PFA with 0.1% glutaraldehyde for 10 min. Images were obtained by DeltaVision OMX-SR (GE Healthcare Life Sciences) with 0.125 μm z-stack-thickness. Analyses were processed in ImageJ using our novel macro titled “Quadrat Intensity Scanner” (available below). The function of this macro is to divide a region of interest (the nucleus) into squares (quadrats) with dimensions of 20 pixels, and overlapping by 10 pixels, and report the integrated intensity within each square. The set of intensities was exported to Excel and normalized to the average intensity for the whole nucleus, then summarized in a histogram to depict uniformity of nuclear pore distribution across the nucleus.
“Quadrat Intensity Scanner”:
//An algorithm for determining integrated quadrat intensity within a region of interest
//Created by Dr. Jeffrey W Hofmann(11/18/19), with the intent to quantify distribution of nuclear pores within a user-defined nucleus
//University of California San Francisco, Department of Pathology, 513 Parnassus Ave, San Francisco, California 94143
//Start with an 8-bit black and white image, and freehand select a region of interest; then run this macro.
macro “Uniformity of Intensity distribution”{
run(“Clear Results”);
//Determine the bounds of a rectangle containing the region of interest
Roi.getBounds(x_bound, y_bound, Roi_w, Roi_h);
//Establishes arrays to store x and y coordinates of all points within ROI
Roi.getContainedPoints(array_x, array_y);
//Allows user to set size of quadrats
quad_size=getNumber(“Quadrat dimension: “, 20);
//Allows user to set spacing of quadrats (Overlap is helpful to avoid missing important areas)
spacing=getNumber(“Overlap quadrats by (recommend 50% dimension): “, 10);
//Enter 1 if you want to visualize all quadrats after the algorithm finishes running
show_1=getNumber(“1 to show boxes, 0 to not show: “, 1);
//Starting at upper left of ROI...
x_current=x_bound;
y_current=y_bound;
Overlay.clear;
run(“Set Measurements...”, “ mean decimal=4”);
//tiling through the entire ROI left to right, then top to bottom...
while(y_current < y_bound + Roi_h - quad_size){
//Are all 4 corners of the quadrat within the ROI? Score of 4 = Yes
  score=0;
  //Searching through all points of the ROI...
  for(i=1; i<lengthOf(array_x); i++){
    //Is the top left corner in the ROI?
    if(x_current == array_x[i] && y_current == array_y[i]){
      score++;}
    //Is the top right corner in the ROI?
    if(x_current+quad_size == array_x[i] && y_current == array_y[i]){
      score++;}
    //Is the bottom left corner in the ROI?
    if(x_current == array_x[i] && y_current+quad_size == array_y[i]){
      score++;}
    //Is the bottom right corner in the ROI?
    if(x_current+quad_size == array_x[i] && y_current+quad_size == array_y[i]){
      score++;}}
  //If all 4 corners are within ROI, measure area, then draw a rectangle
  if(score==4){
    //Roi.remove;
    makeRectangle(x_current,y_current,quad_size,quad_size,0);
    run(“Measure”);
    if(show_1 == 1){
   Overlay.drawRect(x_current,y_current,quad_size,quad_size);}}
//Move location to next space
  //advance once to the right
  x_current+=spacing;
  //if at the right edge of ROI, move down and reset to left edge
  if(x_current > x_bound + Roi_w - quad_size){
    x_current = x_bound;
    y_current += spacing;}}
Overlay.show;}
Statistics and Reproducibility
This section details the number of times each experiment was repeated independently to support the conclusion in each figure panel. It also specifies which statistic methods were used and whether the statistical tests were one-sided or two-sided. All experiments using Grn+/+ and Grn−/− mice were determined by the ages (prenatal and postnatal) of mice. Selection of mice within each age group was completely random and both male and female mice were used throughout the project.
For snRNA-seq analyses of Grn+/+ and Grn−/− thalami (Figure 1 and Extended Data Figure 1), 4 mice were used per genotype per age. Due to suboptimal RIN number, sample #1 from 2 months old Grn+/+ mice and sample #4 from 19 months old Grn−/− mice were excluded. Detailed information related to snRNA-seq, including the number of nuclei and depth of sequencing are available in Supplementary Table 1. Statistics for Grn mRNA in different cell clusters in Grn+/+ thalamus were performed using multiple t tests and the P values in Figure 1b represented the comparison between microglia (MG, c4) and excitatory neurons (ExNeu, c3, c12, c13) clusters. Additional comparisons were performed between MG and astrocyte (AST, c7) cluster, MG and endothelial cell (END, 8), and MG and inhibitory neuron (InNeu, c6, c9) cluster with similar results. Statistics for the cumulative Grn mRNA expression from 2 to 19 months old Grn+/+ thalamus (violin plots in Extended Data Figure 1f) were performed using MAST33 and the P values for comparisons amongst different cell clusters were provided in the figure legends. Statistics for normalized cell number in microglia cluster (Figure 1d), excitatory neuron clusters (Figure 1e), astrocyte cluster (Extended Data Figure 1g) and inhibitory neurons (Extended Data Figure 1h) were performed using two-tailed unpaired Student’s t test. Statistics for the gene burden analyses in different cell clusters in 12 months old thalamus (Extended Data Figure 1i) and 19 months old thalamus (Figure 1f) were performed using Mann-Whitney U test. Statistics for the differentially expressed gene (DEG) analyses (Supplementary Table 2B and 2C) were performed using Moran’s I test.
As indicated previously, the volcano plot in Extended Data Figure 2f was generated using Meta Cell pseudobulk approach, and the statistics performed using MAST. The determination of the statistical significance of the overlapping between DEGs in 19 months old Grn−/− Th-MG and AD- and ALS-related DAM genes (Extended Data Figure 2h) was performed using the hypergeometric test. The interacting map for gene ontology (GO) terms of the 32 genes shared between 19 months Grn−/− Th-MG and AD DAM (Extended Data Figure 2i) is generated using Metascape38. Validations of selected DEGs (P2ry12, Tmem119, ApoE, Adam33, Ctsb, Numb, Igf1, and Gpnmb) in 12 and 19 months old Grn−/− Th-MG were performed using immunohistochemistry or immunofluorescent confocal microscopy in 3 independent mice per age per genotype with similar results (Extended Data Figure 3). Stereology-based quantification of excitatory neuron phenotypes in Grn−/− thalamus was performed in 3–4 independent mice per age per genotype. The exact numbers were indicated in Extended Data Figure 4f and the corresponding figure legend.
Characterizations of nuclear and cytoplasmic TDP-43 in Grn−/− thalamic neurons in Figure 2 were performed using confocal microscopic images from N = 3 mice per age per genotype (Figure 2b–c) and IEM from two independent mice per genotype at 12, 19 and 24 months (Figure 2d–g). Quantification of TDP-43 immunofluorescent intensity was performed using NIH ImageJ on confocal images captured from 7, 12, 19 and 24 months old Grn+/+ and Grn−/− thalamic neurons using identical settings in Nikon C2 microscope. 15–22 images were obtained from each mouse to derive the average TDP-43 abundance for each independent biological sample. The data in Figure 2c represent results from N = 3 independent biological samples (mice) per age per genotype and the statistics were performed using two-way ANOVA with multiple comparisons. To quantify TDP-43 granules in IEM, we obtained 10–21 high magnification (11,500x) images per mouse, from N = 3 Grn+/+ and Grn−/− thalami at 19 months old. Statistics for Figure 2f used two-way ANOVA and for Figure 2g used two-tailed unpaired Student’s t test.
Stereology counting of excitatory neurons in Grn+/+ and Grn−/− thalami were performed using StereoInvestigator software (MicroBrightField) as previously described49. The numbers of mice used per age per genotype were indicated in the figure legend for Extended Data Figure 4, and the statistics for the comparisons between Grn+/+ and Grn−/− mice used two-tailed unpaired Student’s t test.
Experiments using primary microglia and neurons were repeated at least three times, with the exact numbers reported in figure legends. Data analysis from these cultures involved capturing confocal images using magnification(s) with sufficient number of images to cover the entire coverslips. The subcellular localization of G3BP1 in Grn+/+ and Grn−/− neurons in control media or after sodium arsenite treatment was comparable to results published in two independent studies. For instance, endogenous G3BP1 proteins can be detected in both the nucleus and cytoplasm of hippocampal neurons and cerebellar Purkinje cell neurons50. Furthermore, sensory neurons cultured from dorsal root ganglia (DRG) contain remarkably high abundance of endogenous G3BP1 in the nucleus and cytoplasm51. Consistent with these results, ectopic expression of GFP-tagged G3BP1 in DRG sensory neurons showed abundant GFP-G3BP1 signals in the nucleus and cytoplasm. Interestingly, axonal injury caused by nerve crush can affect G3BP1 granule formation in axons.
Extended Data
Extended Data Figure 1 |. Single-nucleus RNA-sequencing (snRNA-seq) analysis of age-dependent transcriptomic changes in the thalamus of Grn−/− mice.
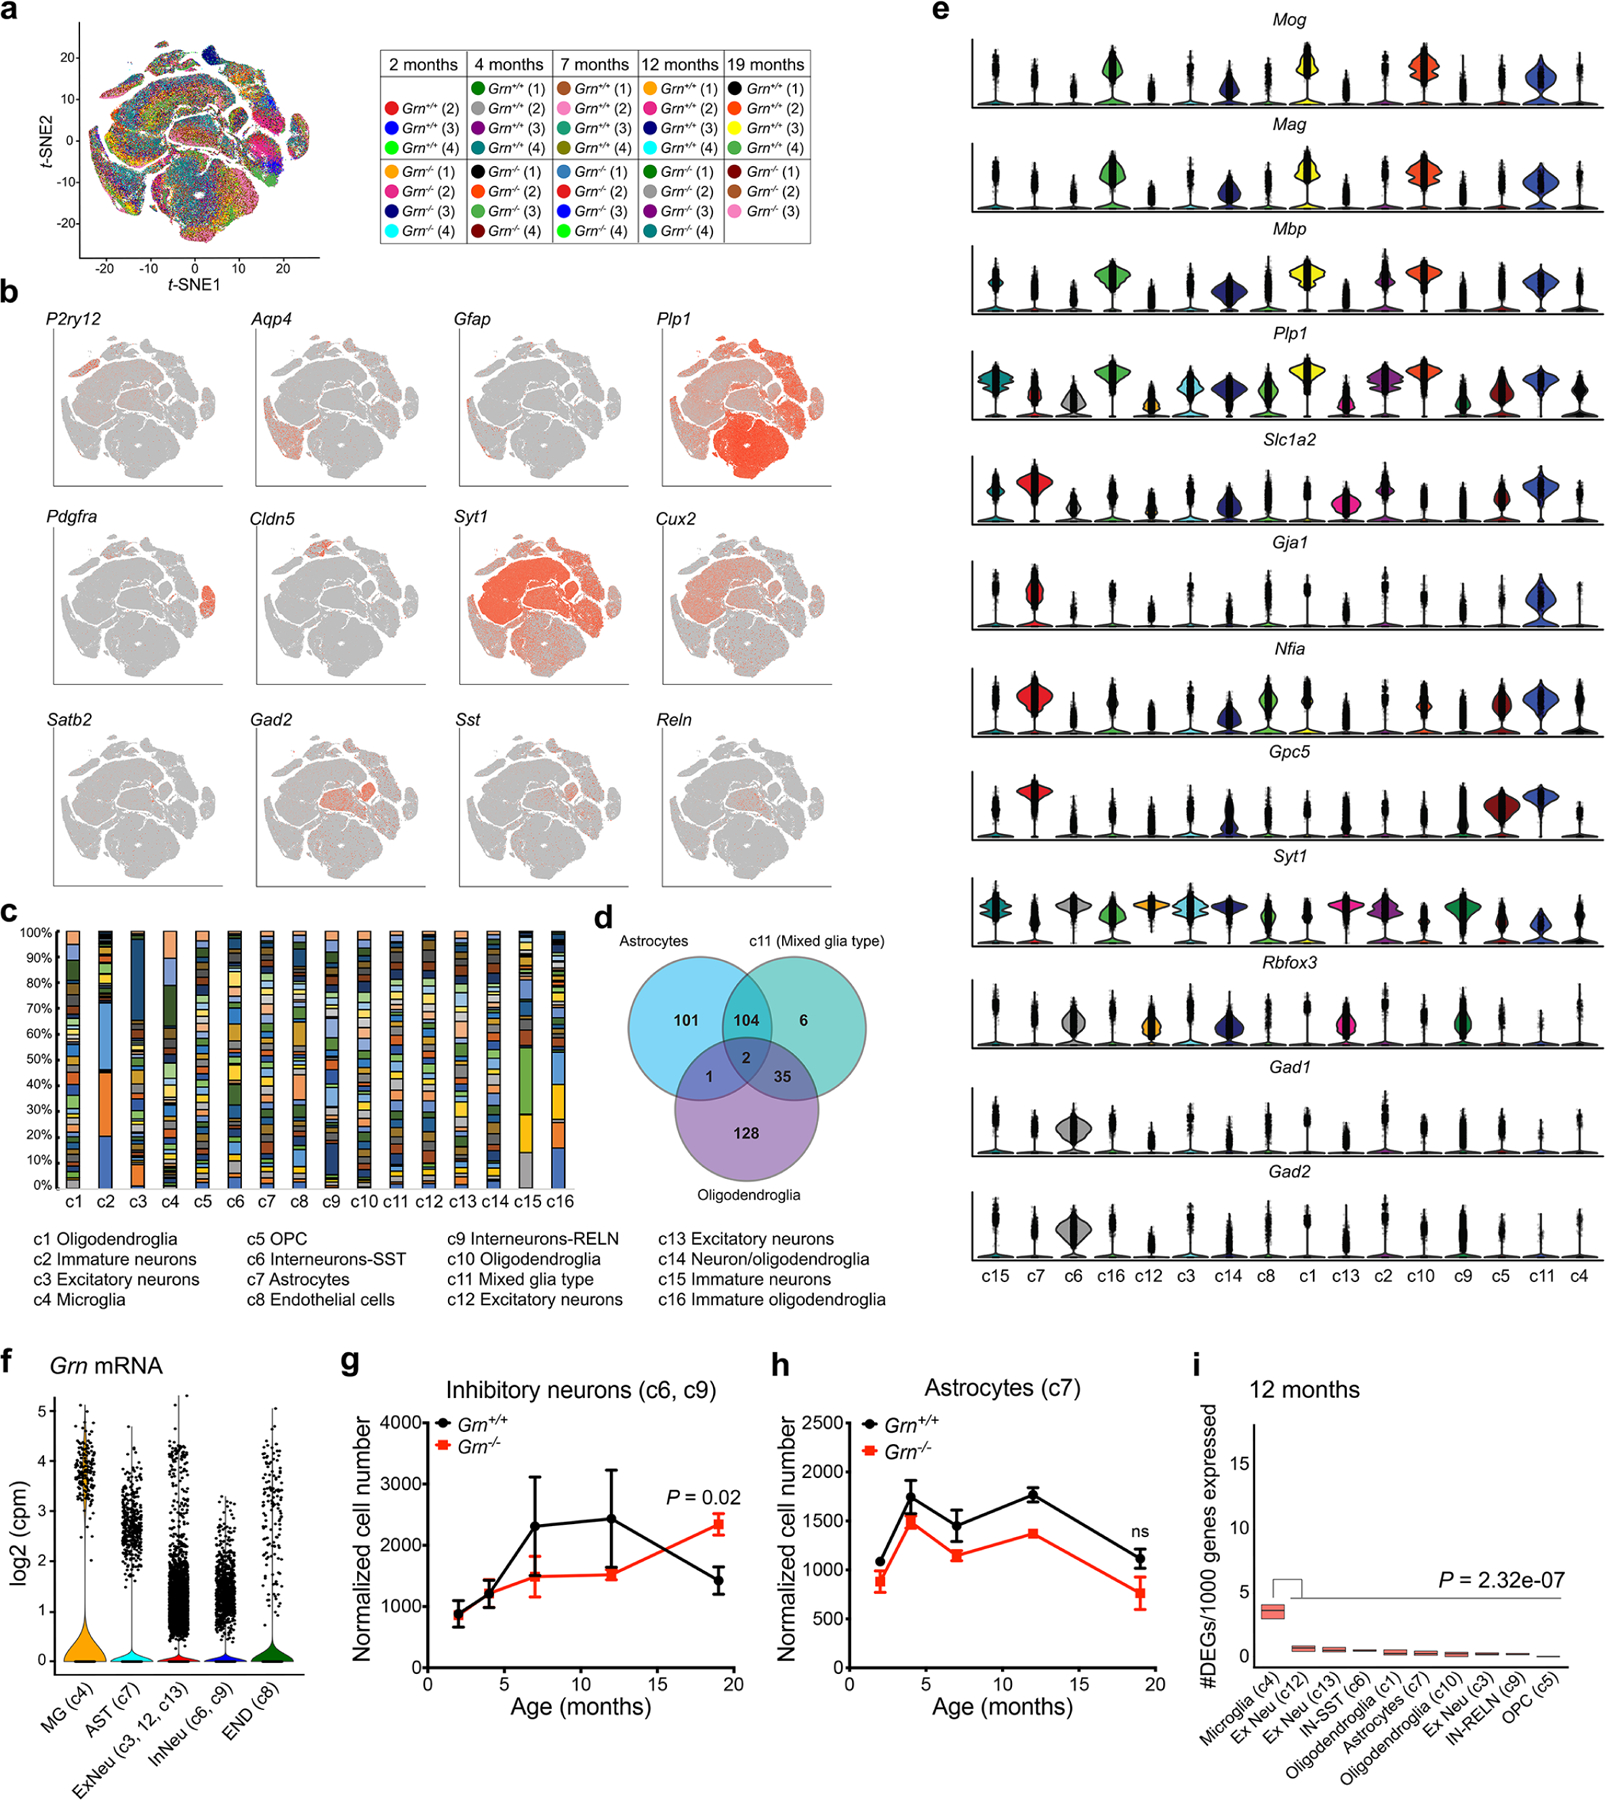
a. Unbiased clustering of snRNA-seq data from 2, 4, 7, 12 and 19 months old Grn+/+ and Grn−/− thalamus identifies 16 different cell types. A table outlines the number and age of Grn+/+ and Grn−/− mice used for microdissecting thalamus for snRNA-seq. Two samples, #1 in 2 months old Grn+/+ and #4 in 19 months old Grn−/−, are excluded due to suboptimal RNA quality. b–c. Subtype-specific markers for microglia (P2ry12), astrocytes (Aqp4, Gfap), oligodendroglial precursor cells (OPC)(Pdgfra), endothelial cells (Cldn5), synaptic marker (Syt1), excitatory neurons (Cux2, Satb2), oligodendroglia (Plp1), and inhibitory neurons (Gad2, Sst, Reln). c. Individual contribution to different cell cluster from each sample. d. Venn diagram shows the overlap of gene expression between cluster 11 and astrocyte and oligodendroglia clusters. These results indicate that cluster 11 contains mixed identity. e. Violin plots demonstrate that cells in cluster 11 express markers of myelinating oligodendroglia (Mog, Mag, Mbp, Plp1) and astrocytes (Slc1a2, Gja1, Nfia, Gpc5). Although cells in cluster 11 express low level of neuronal marker Syt1, they express very low level of other neuronal markers, e.g. Rbfox3, Gad1 and Gad2. f. Violin plots that show the cumulative Grn mRNA expression from 2 to 19 months in microglia (MG, c4), astrocytes (AST, c7), excitatory neurons (ExNeu, c3, c12, c13), inhibitory neurons (InNeu, c6, c9) and endothelial cells (END, c8). Statistical comparisons using MAST reveal Grn mRNA expression MG is consistently higher than other cell clusters with the following P values: MG vs AST: 2.53 × 10−40, MG vs ExNeu: 1.15 × 10⁻⁸, MG vs InNeu: 8.79 × 10⁻¹⁷, MG vs END: 1.45 × 10⁻¹⁷. In addition, comparisons between ExNeu and other cell clusters show the following P values: ExNeu vs AST: 8.46 × 10−75, ExNeu vs InNeu: 5.57 × 10⁻¹³, and ExNeu vs END: 1.38 × 10−09. g–h. Normalized cell counts for inhibitory neurons (c6, c9) and astrocytes (c7) in Grn+/+ and Grn−/− thalamus. Data represent mean ± s.e.m. Statistics use two-tailed unpaired Student’s t test. i. Gene burden analysis for glia and neuronal clusters in Grn+/+ and Grn−/− thalamus at 12 months old. These analyses calculate the number of genes differentially expressed in each cluster in Grn−/− thalamus after normalizing the number of nuclei in each cluster. Box plots show the median and 25–75th percentiles. Statistics were performed using Mann-Whitney U test.
Extended Data Figure 2 |. Age-dependent changes in the transcriptomes and subclustering of microglia in Grn+/+ and Grn−/− thalamus.
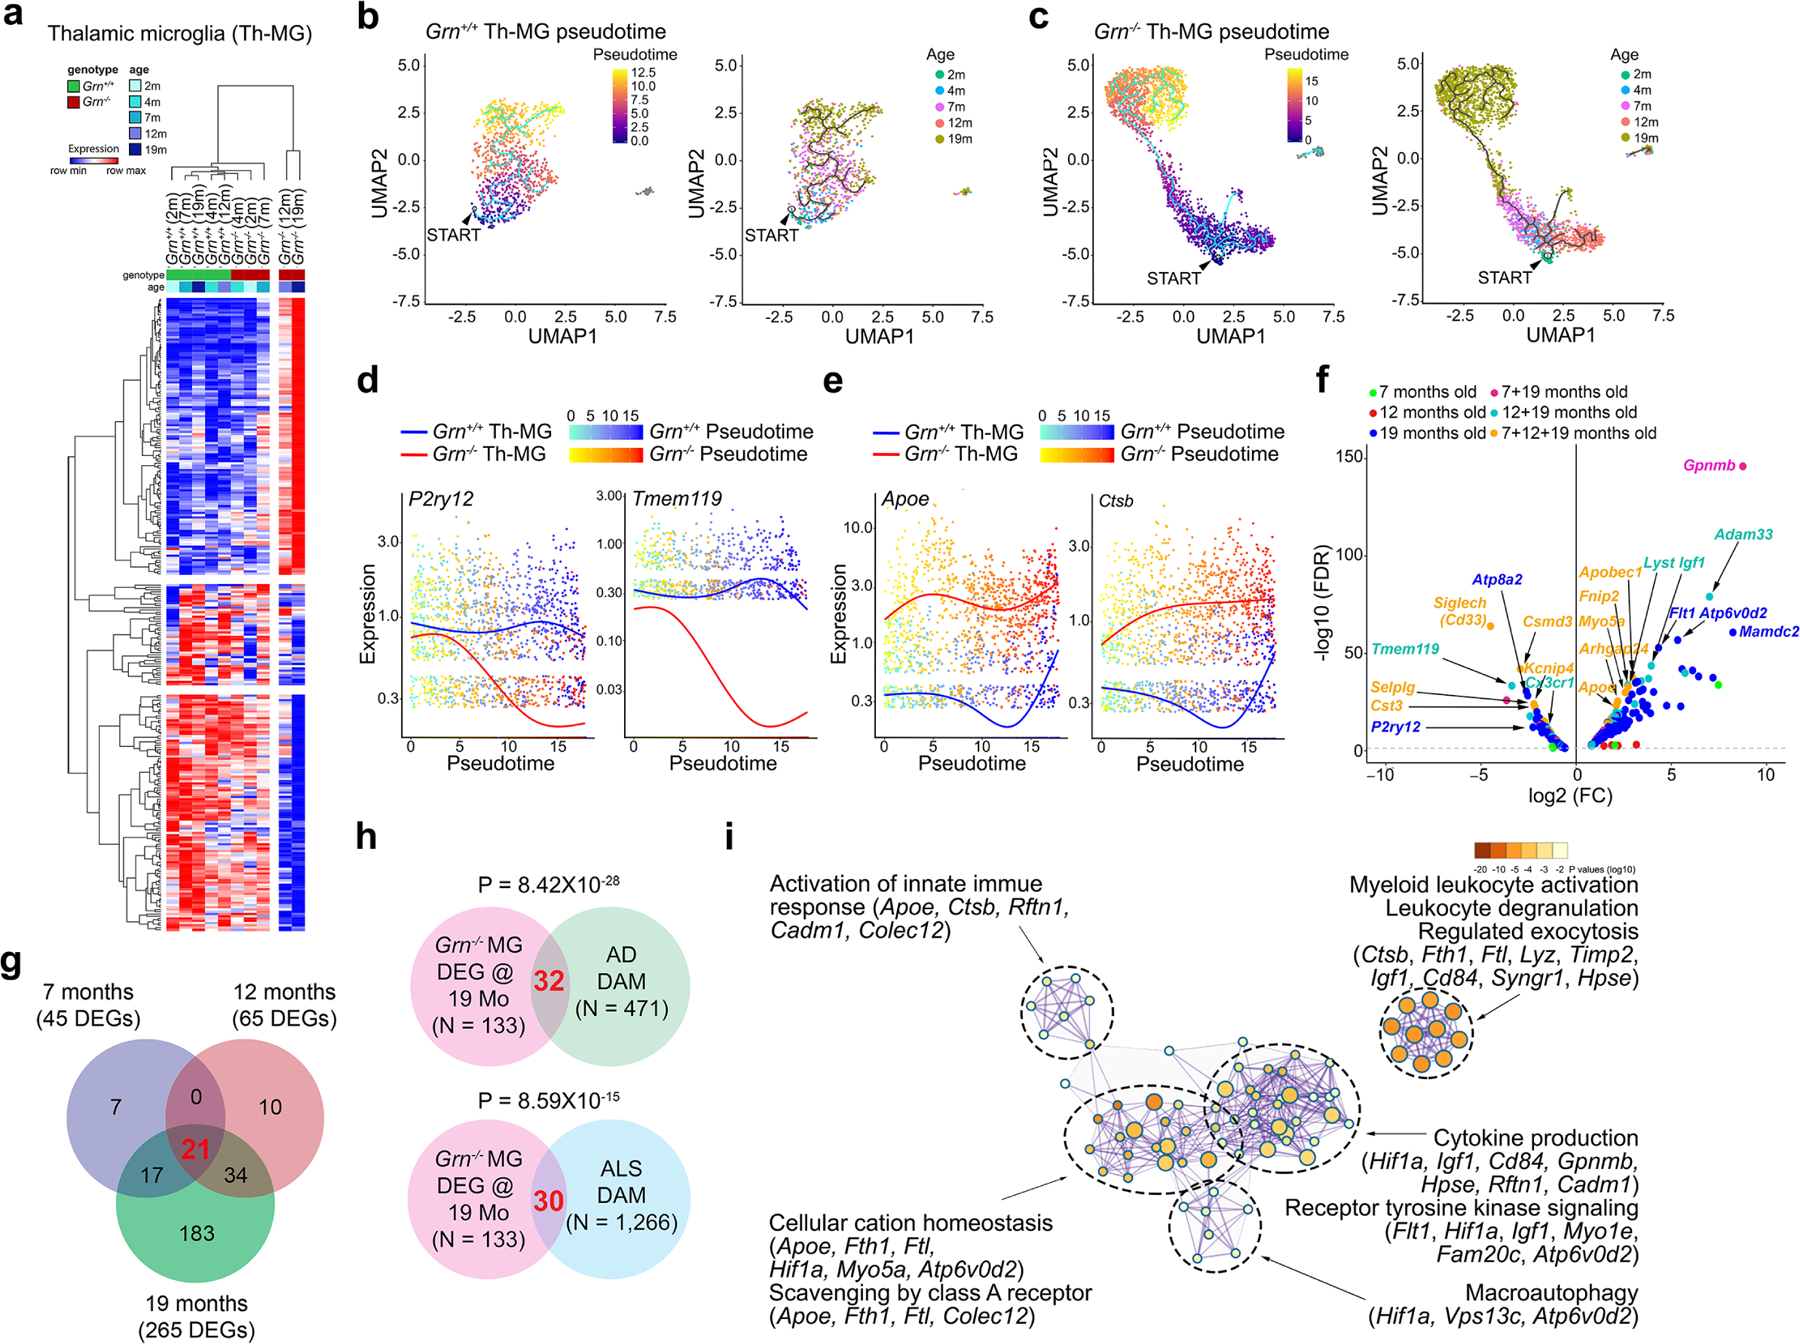
a. Heatmap of differentially expressed genes in Grn−/− thalamic microglia show progressive transcriptomic changes from 7, 12 to 19 months. b–c. Pseudotime analyses of snRNA-seq data reveal modest transition of trajectory and subclusters in Grn+/+ thalamic microglia from 2 to 19 months. In contrast, Grn−/− microglia exhibit drastic changes in trajectory and subcluster distribution, especially at 12 and 19 months. The small clusters toward the right of UMAP graphs in Grn+/+ and Grn−/− Th-MG most likely represent a small number of microglia-related cells, such as macrophages, or other unidentified cell types. The presence of this very small cluster does not contribute to the pseudotime results for Grn+/+ or Grn−/− Th-MG. d–e. Combined pseudotime analyses show age-dependent downregulation of homeostasis genes, P2ry12 and Tmem119, and upregulation of genes associated with microglial activation, including Apoe and Ctsb, in Grn−/− microglia. f. Volcano plot showing persistent up- or downregulated genes in Grn−/− microglia from 7 to 19 months. Most differentially expressed genes (DEGs) in Grn−/− microglia are detected at 7 and 19 months (dark red), 12 and 19 months (light blue), or 7, 12 and 19 months (beige), whereas a smaller number of DEGs are detected only in 7 months (green), 12 months (red) or 19 months (dark blue). Statistics for DEGs in volcano plot use MAST. See METHODS for details of the “Meta Cell” pseudobulk approach to generate the volcano plot. g. Venn diagram showing a progressive increase in differentially expressed genes in Grn−/− Th-MG from 7, 12 to 19 months. h. Venn diagrams showing limited overlap of differentially expressed genes in 19 months Grn−/− Th-MG and AD DAM genes, and 19 months Grn−/− Th-MG and ALS DAM genes. Statistics use hypergeometric test. i. Metascape interacting map of GO terms of the 32 genes shared by 19 months Grn−/− Th-MG and AD DAM.
Extended Data Figure 3 |. Immunohistochemical validations of differentially expressed genes in the thalamus of Grn−/− mice.
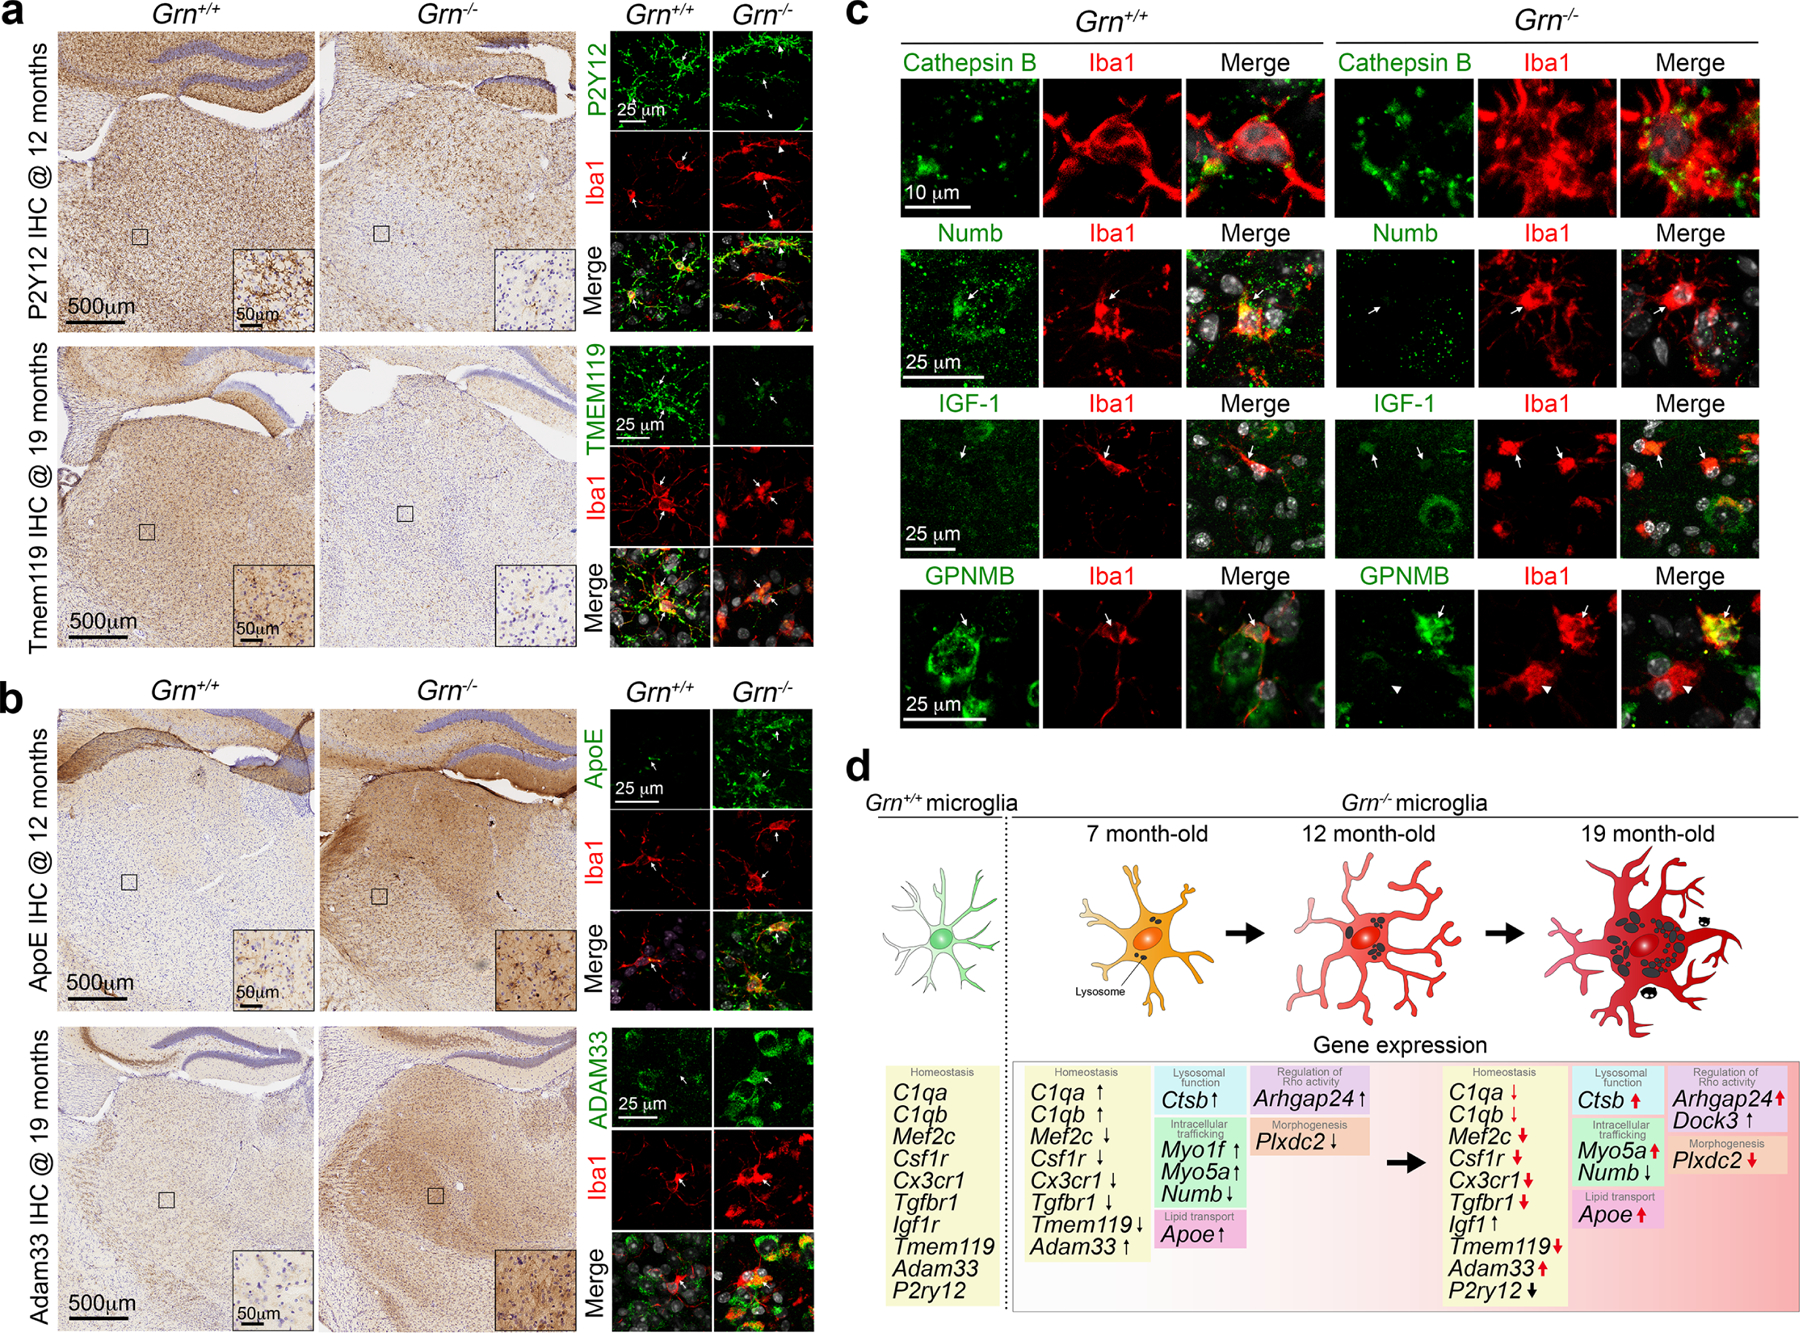
a–b. Validations using immunohistochemistry and confocal microscopy confirm the downregulation of P2Y12 and Tmem119 in Grn−/− thalamic microglia at 12 and 19 months, respectively (panel a). In contrast, Grn−/− thalamic microglia show marked increases in ApoE and Adam33 protein detected by immunohistochemical staining and confocal microscopy (panel b). Insets are high magnification images from the boxed areas in the ventral thalamus. Confocal images on the right panels are obtained from 12 months old Grn+/+ and Grn−/− thalamus. Immunohistochemistry was performed in 3 independent mice per genotype, whereas the confocal images were from two independent mice. c. Confocal images showing upregulated expression of Cathepsin B, IGF-1 and GPNMB in 12 months old Grn−/− thalamic microglia. In contrast, Grn−/− thalamic microglia show reduced expression of Numb. The validations were performed in N=3 independent mice per genotype with similar results. d. A proposed model showing the age-dependent transition of Grn−/− thalamic microglia from a homeostatic state to disease state from 7 to 19 months. The defects in Grn−/− microglia downregulate homeostatic genes (C1qa, C1qb, Mef2c, Csf1r, Cx3cr1, Tgfbr1, Tmem119, Adam33, Igf1, P2ry12), and upregulate genes related to lysosomal functions (Ctsb), lipid transport (Apoe), intracellular trafficking (Myo1f, Myo5a, Numb) and signal pathways (Arhgap24, Dock3).
Extended Data Figure 4 |. Single-nucleus RNA-sequencing (snRNA-seq) analysis of excitatory neuron clusters in the thalamus of Grn+/+ and Grn−/− mice.
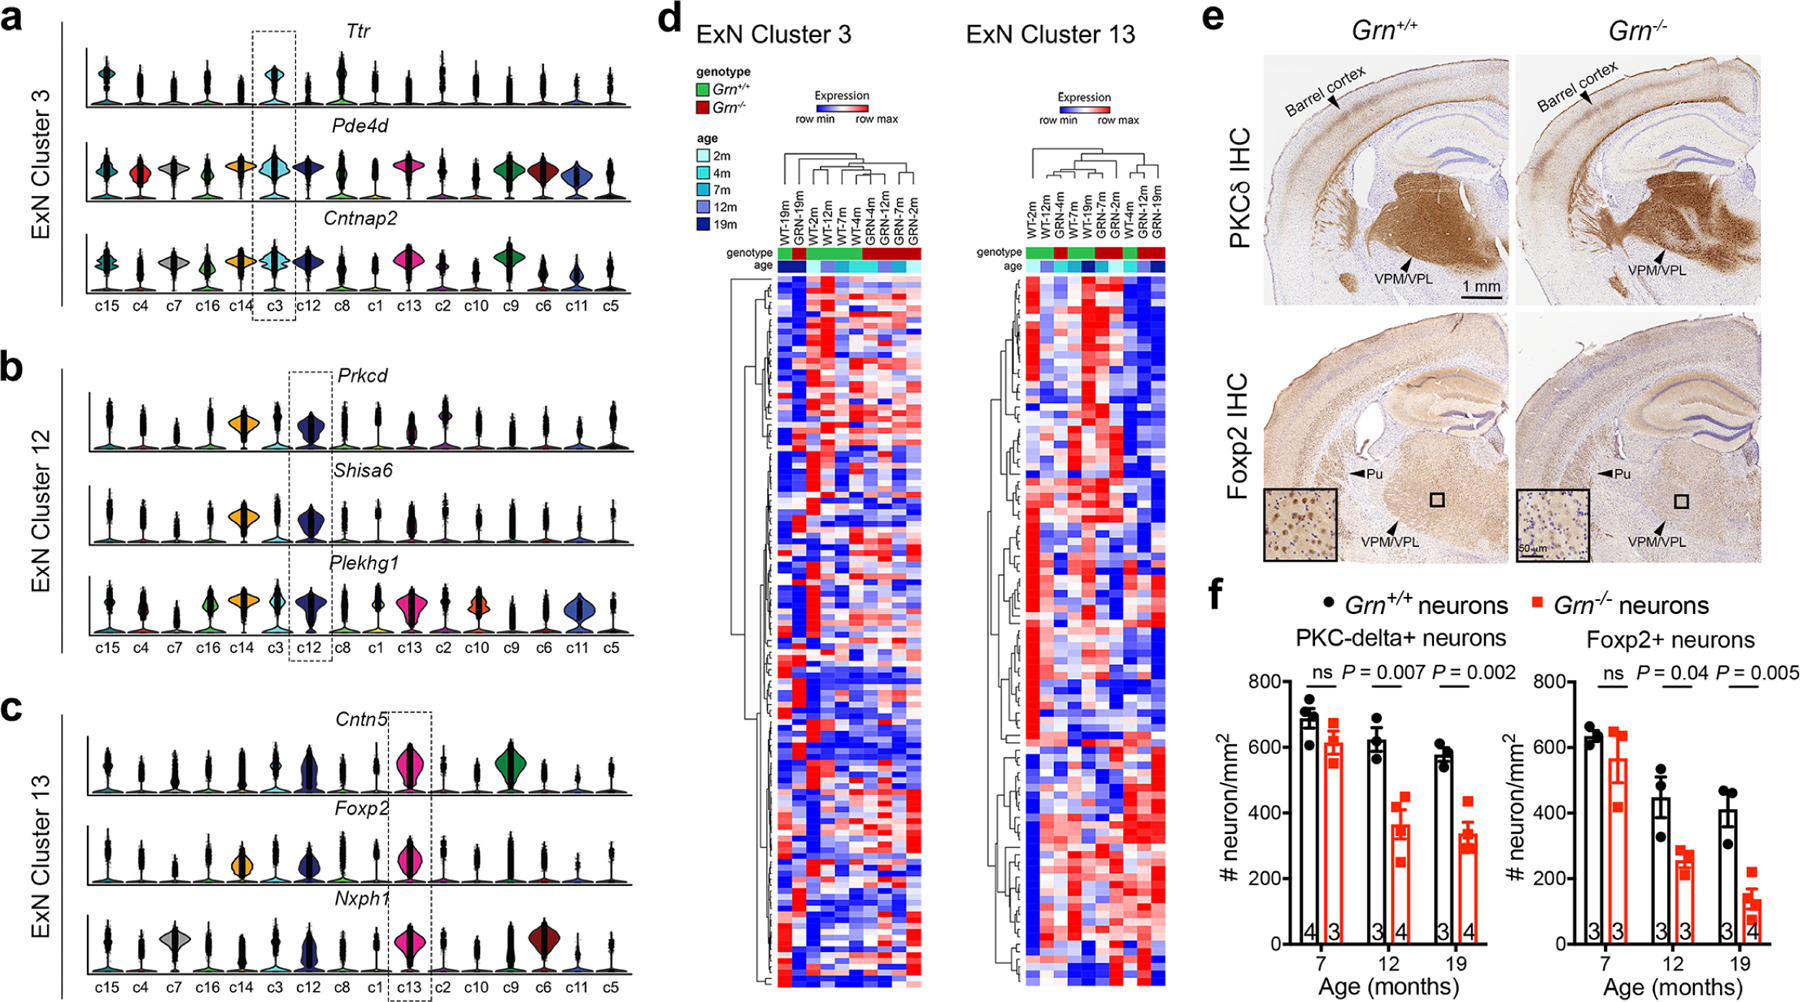
a–c. snRNA-seq identifies three distinct clusters of excitatory neurons based on the combined expression of Ttr (Transthyretin), Pde4d (Phosphodiesterase 4D) and Cntnap2 (Contactin associated protein like 2) in cluster 3, Prkcd (Protein kinase C Delta), Shisa6 (Shisa family member 6) and Plekhg1 (Pleckstrin homology and RhoGEF domain containing G1) in cluster 12, and Cntn5 (Contactin 5), Foxp2 (Forkhead Box P2) and Nxph1 (Neurexophilin 1) in cluster 13. d. Heatmaps of cluster 3 and cluster 13 show no definitive age-dependent changes in the transcriptomes. e. Comparison of excitatory neuron subtypes in 19 months old Grn+/+ and Grn−/− thalamus using immunohistochemical stains for PKCδ (upper panels) and Foxp2 (lower panels) reveals loss of PKCδ+ and Foxp2+ neurons, most prominently affecting neurons in the ventral posterolateral (VPL) and ventral posteromedial (VPM) nuclei of the thalamus. f. Stereology quantification of PKCδ+ and Foxp2+ neurons in the ventral thalamus of Grn+/+ and Grn−/− mice at 7, 12 and 19 months old. Data represent mean ± s.e.m., and the number of mice for each age and genotype is indicated at the bottom of each dataset. Statistics uses two-tailed unpaired Student’s t test. ns, not significant.
Extended Data Figure 5 |. Characterization of P3 primary microglia from Grn+/+ and Grn−/− mice using single cell RNA-seq, NanoString nCounter neuroinflammation panel, and western blots.
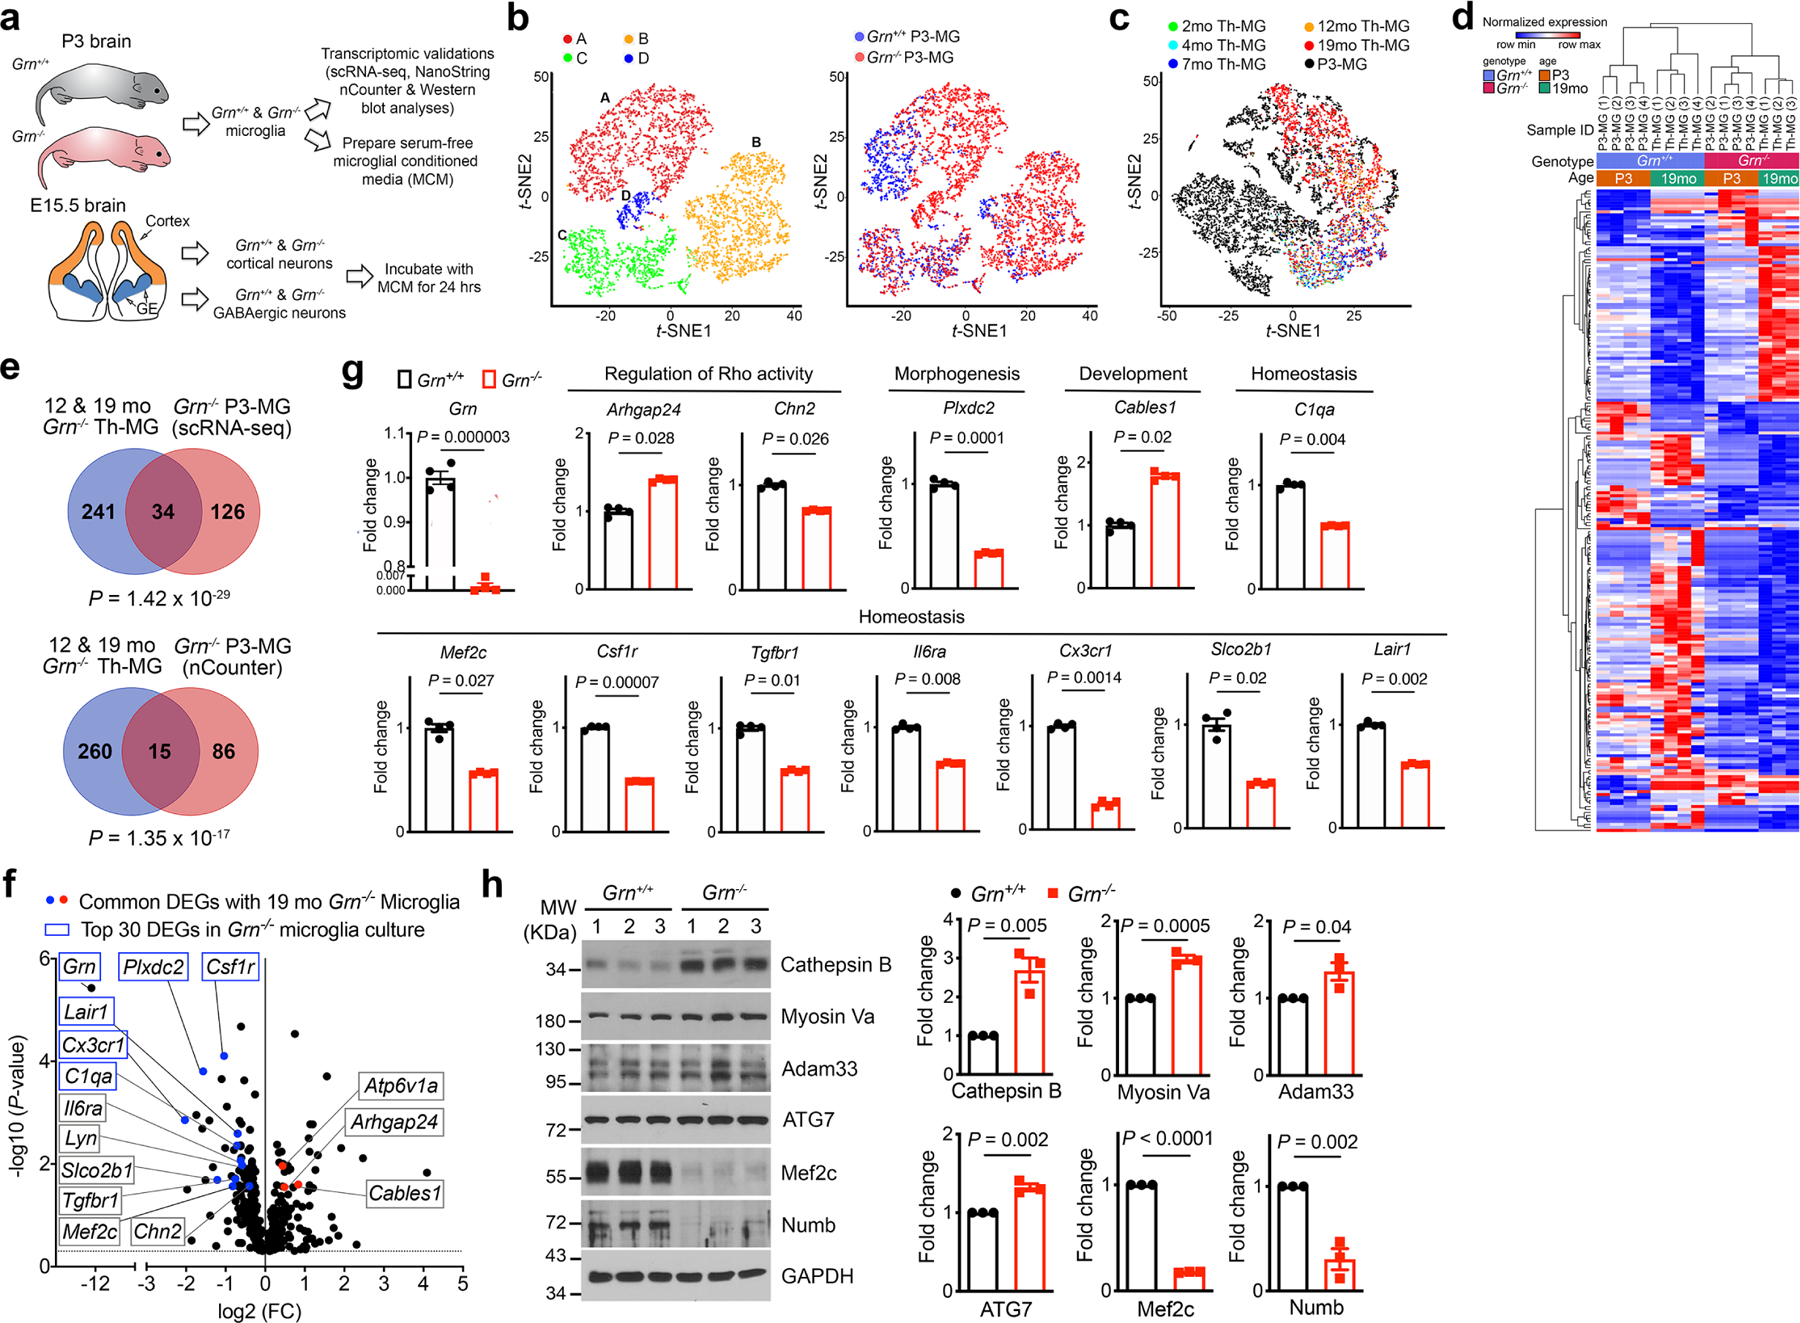
a. A schematic diagram illustrating the study design to characterize primary microglia from postnatal day 3 (P3) Grn+/+ and Grn−/− mice using scRNA-seq and NanoString nCounter neuroinflammation panel, and to prepare serum-free conditioned media from Grn+/+ and Grn−/− P3-MG. In parallel, primary cortical neurons and GABAergic inhibitory neurons are isolated from the developing cortex and ganglionic eminences of embryonic day 15.5 (E15.5) Grn+/+ and Grn−/− mice. After 14 days in vitro (DIV), Grn+/+ and Grn−/− microglial conditioned media (MCM) are added to Grn+/+ and Grn−/− excitatory neurons or GABAergic inhibitory neurons and incubate for 24 hours. b. t-SNE plots of scRNA-seq data from Grn+/+ and Grn−/− P3-MG revealed 4 distinct clusters and the extent of overlapping in cell density and cluster distribution between Grn+/+ and Grn−/− P3-MG. c. Comparison of clusters A of P3-MG with 2 to 19 months (mo) thalamic microglia (Th-MG) reveals more overlapping between P3-MG (black) and 19mo Th-MG (red). d. Hierarchical clustering of gene expression in Grn+/+ and Grn−/− P3-MG cluster A and 19 months old Th-MG. e. Venn diagrams showing the extent of overlapping between DEGs from 12 and 19 months old Th-MG and DEGs in P3-MG identified by scRNA-seq (upper panel) or DEGs in P3-MG identified by NanoString nCounter Neuroinflammation panel (lower panel). Statistics use the hypergeometric test. f. Volcano plot showing the up- and down-regulated genes in Grn−/− P3-MG revealed by nCounter neuroinflammation panel. Statistics use nSolver software version 4.0, provided by the NanoString Technologies, Inc. g. Quantification of the DEGs in Grn−/− P3-MG that are shared with 19 months Grn−/− Th-MG, including upregulation of Arhgap24 and Cables1, and downregulation of Chn2, Plxdc2, C1qa, Mef2c, Csf1r, Cx3cr1, Tgfbr1, Il6ra, Lair1, and Slco2b1. Data represent mean ± s.e.m., n = 4 for each genotype. Statistics uses two-tailed unpaired Student’s t test. h. Western blots and quantification show upregulation of Cathepsin B, Myosin Va, Adam33 and ATG7, but downregulation of Mef2c and Numb. Data represent mean ± s.e.m., n = 3 for each protein. Statistics uses two-tailed unpaired Student’s t test.
Extended Data Figure 6 |. Grn−/− microglial conditioned media (MCM)-induced cell death in Grn+/+ and Grn−/− cortical neurons and GABAergic neurons.
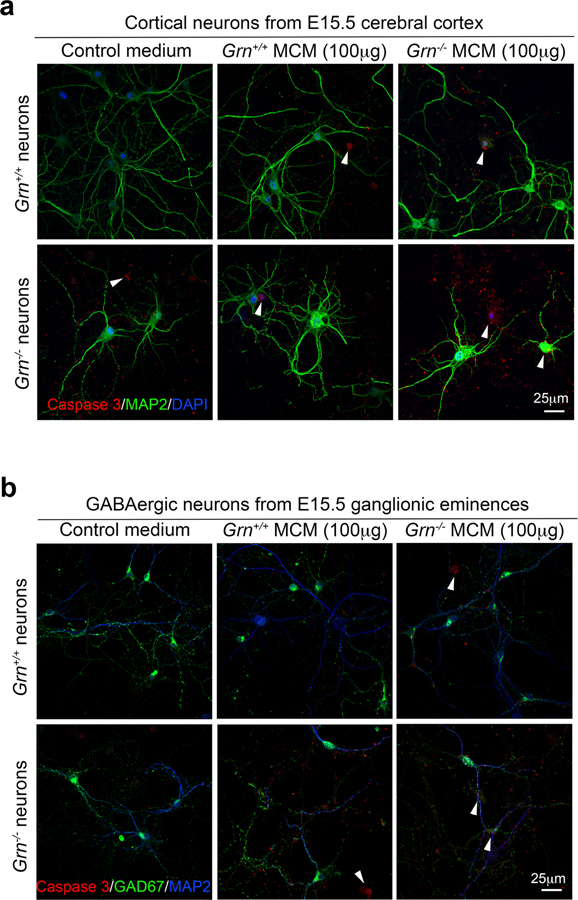
a. Representative confocal images of Grn+/+ and Grn−/− cortical neurons treated with control media, Grn+/+ MCM or Grn−/− MCM (100μg/ml) overnight. Immunofluorescent stains are performed using antibodies for MAP2 (green) and cleaved caspase 3 (red). Nuclei are highlighted using DAPI. b. Representative confocal microscopic images of GE-derived Grn+/+ and Grn−/− GABAergic interneurons treated with control media, Grn+/+ MCM or Grn−/− MCM (100μg/ml) overnight. Immunofluorescent stains are performed using antibodies for GAD67 (green) and cleaved caspase 3 (red). Nuclei are highlighted using DAPI.
Extended Data Figure 7 |. Nuclear pore defects in Grn−/−neurons treated with Grn−/− microglial conditioned media (MCM).
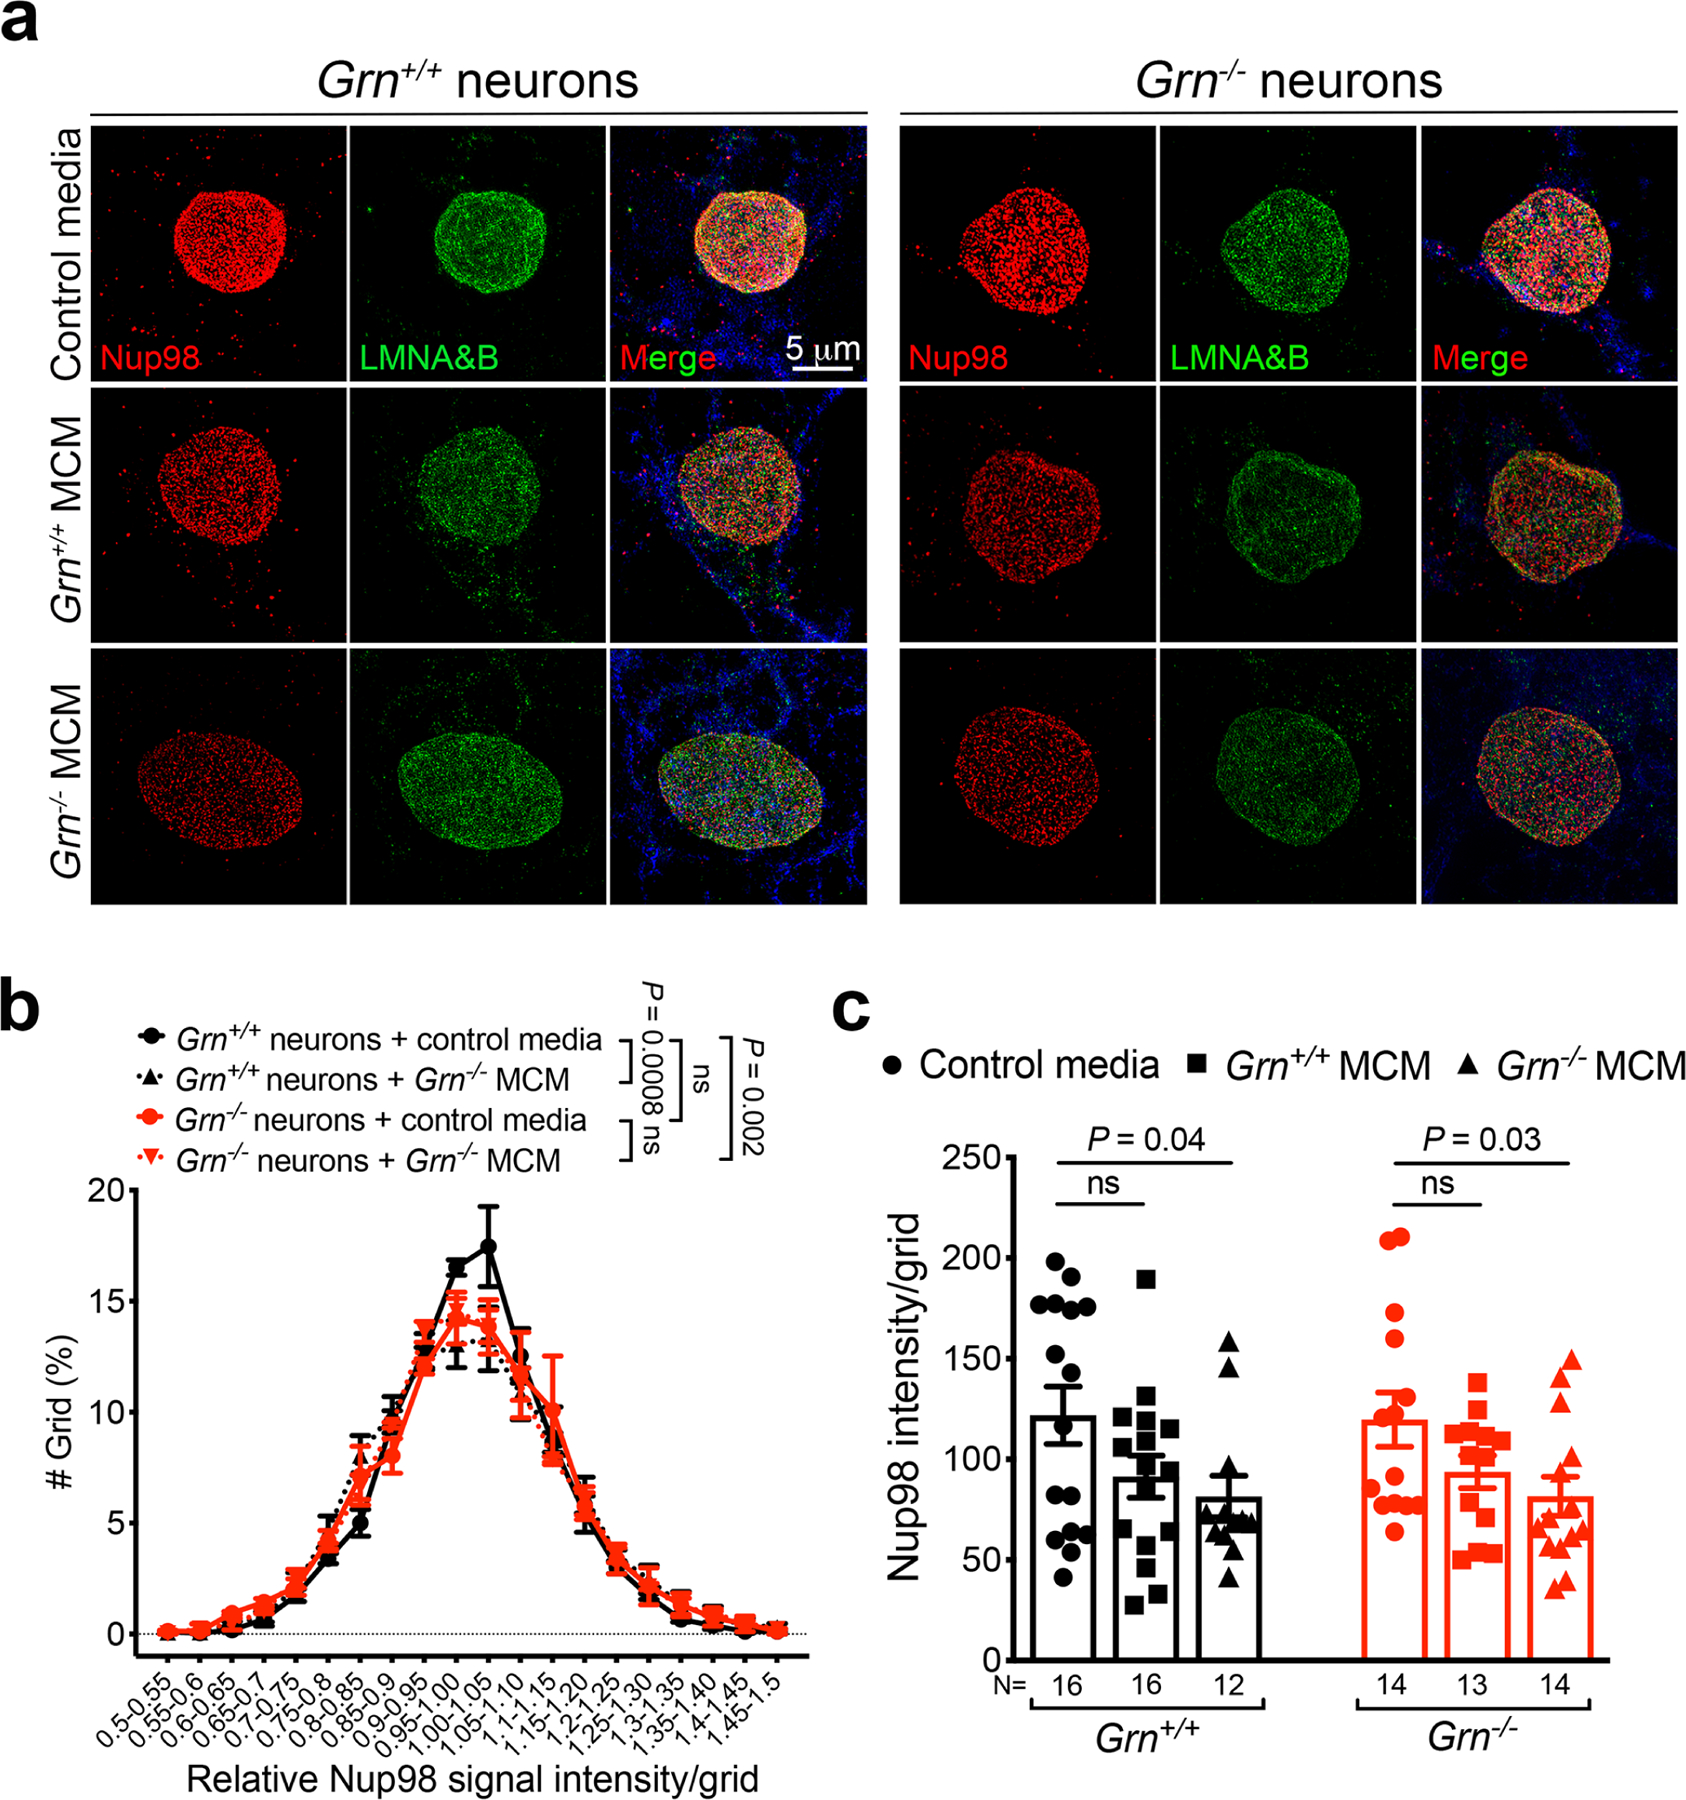
a. 3D Structured Illumination Microscopy (SIM) images of Nup98 and Lamin A/B in Grn+/+ and Grn−/− cortical neurons treated with control media, Grn+/+ MCM and Grn−/− MCM (250μg/ml). Nup98 is shown in red, Lamin A/B in green and MAP2 in blue. b. Nup98 intensity distribution per intranuclear grid (0.44 × 0.44 μm2) in Grn+/+ and Grn−/− cortical neurons treated with control media and Grn−/− MCM (250μg/ml)(see METHODS for specific algorithms). Nup98 is less evenly distributed in Grn−/− cortical neurons in control media. When Grn+/+ neurons are treated with Grn−/− MCM, they show significant uneven distribution of Nup98 than Grn+/+ neurons treated with control media. Interestingly, Grn−/− neurons treated with Grn−/− MCM do not show further defects in Nup98 distribution compared to Grn−/− in control media. Data represent mean ± s.e.m., Data are from 3 independent cultures. Statistics use two-way ANOVA. c. Average of Nup98 intensity in the small grids in Grn+/+ and Grn−/− cortical neurons treated with control media, Grn+/+ MCM and Grn−/− MCM (250μg/ml). Data represent mean ± s.e.m.. The numbers listed below each dataset represent the number of neurons analyzed from 3 independent cultures. Statistics uses two-tailed unpaired Student’s t test.
Extended Data Figure 8 |. Overlap between TDP-43 granules in Grn+/+ and Grn−/− neurons with lysosomal marker LAMP1, but not with mitochondrial marker Tom20 and stress granule marker Ataxin-2.
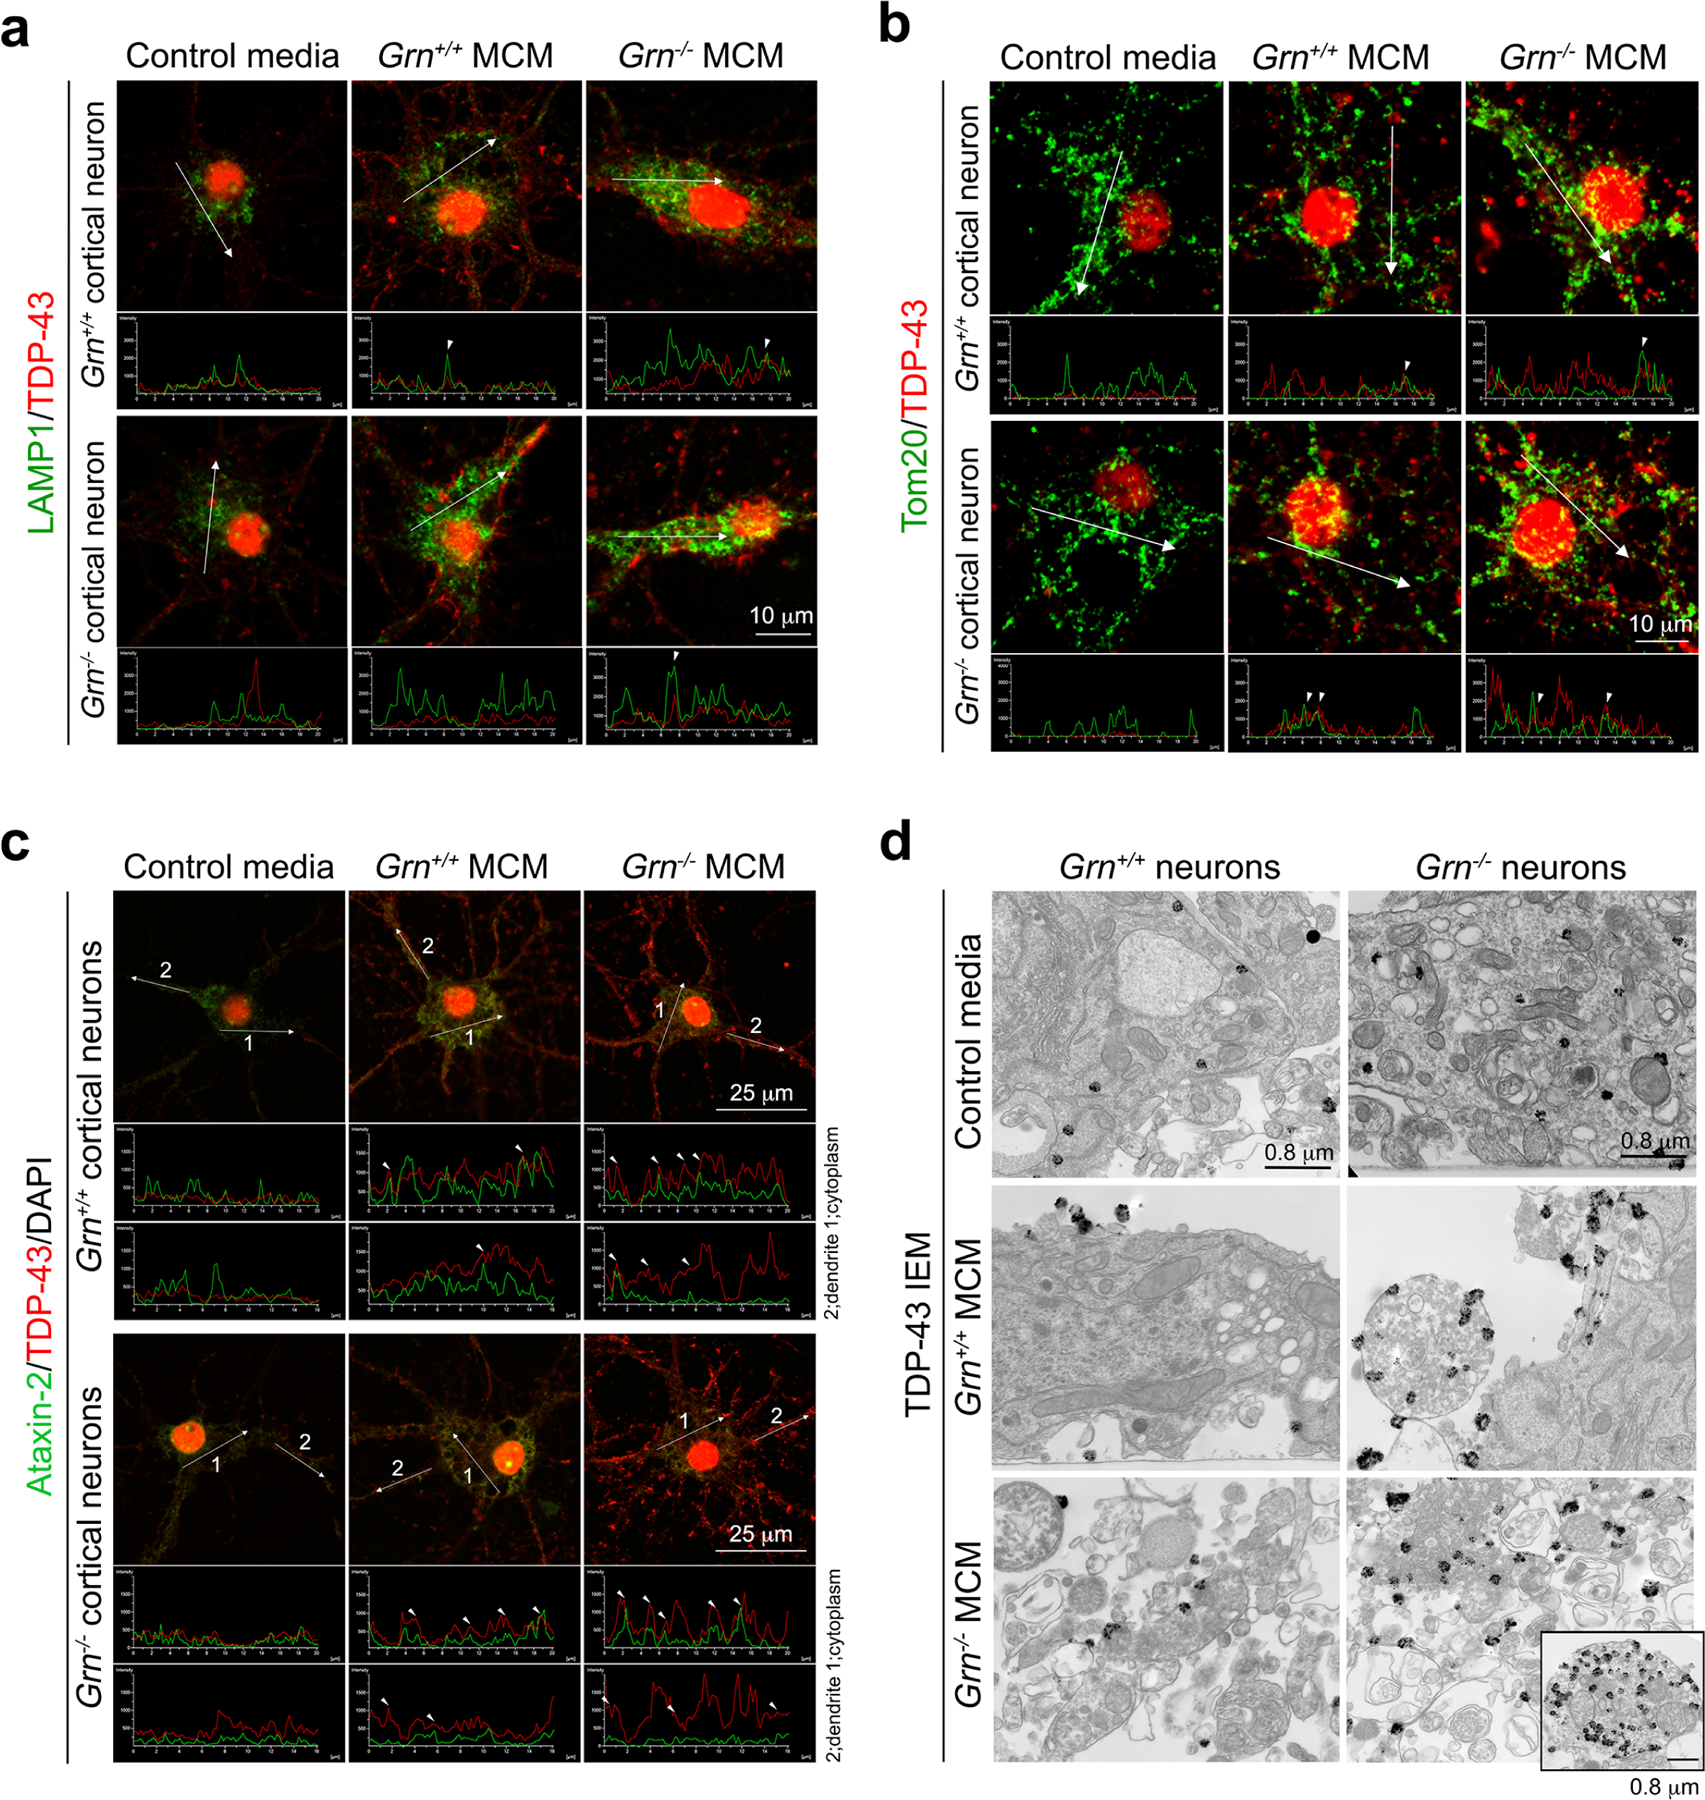
a–c. Confocal images of TDP-43 granules and LAMP1+ lysosomes (a), Tom20+ mitochondria (b), or Ataxin-2+ stress granules (c) in Grn+/+ and Grn−/− cortical neurons treated with control media, Grn+/+ MCM and Grn−/− MCM (250μg/ml). TDP-43 is shown in red and LAMP1, Tom20, and Ataxin-2 in green. Intensity plots shown below confocal images are performed using Nikon Intensity Profile System. Images are collected in the cytoplasm and dendrites. d. Immunogold electron microscopic images of TDP-43 granules in Grn+/+ and Grn−/− neurons treated with control media, Grn+/+ MCM or Grn−/− MCM (250μg/ml). Inset in right lower panel shows a small spherical structure, which likely represent a cross section of dendrite that contains many lysosomes with TDP-43 granules attached.
Extended Data Figure 9 |. Sodium arsenite-induced TDP-43 granules in Grn+/+ and Grn−/− cortical neurons do not colocalize with G3BP1+ stress granules.
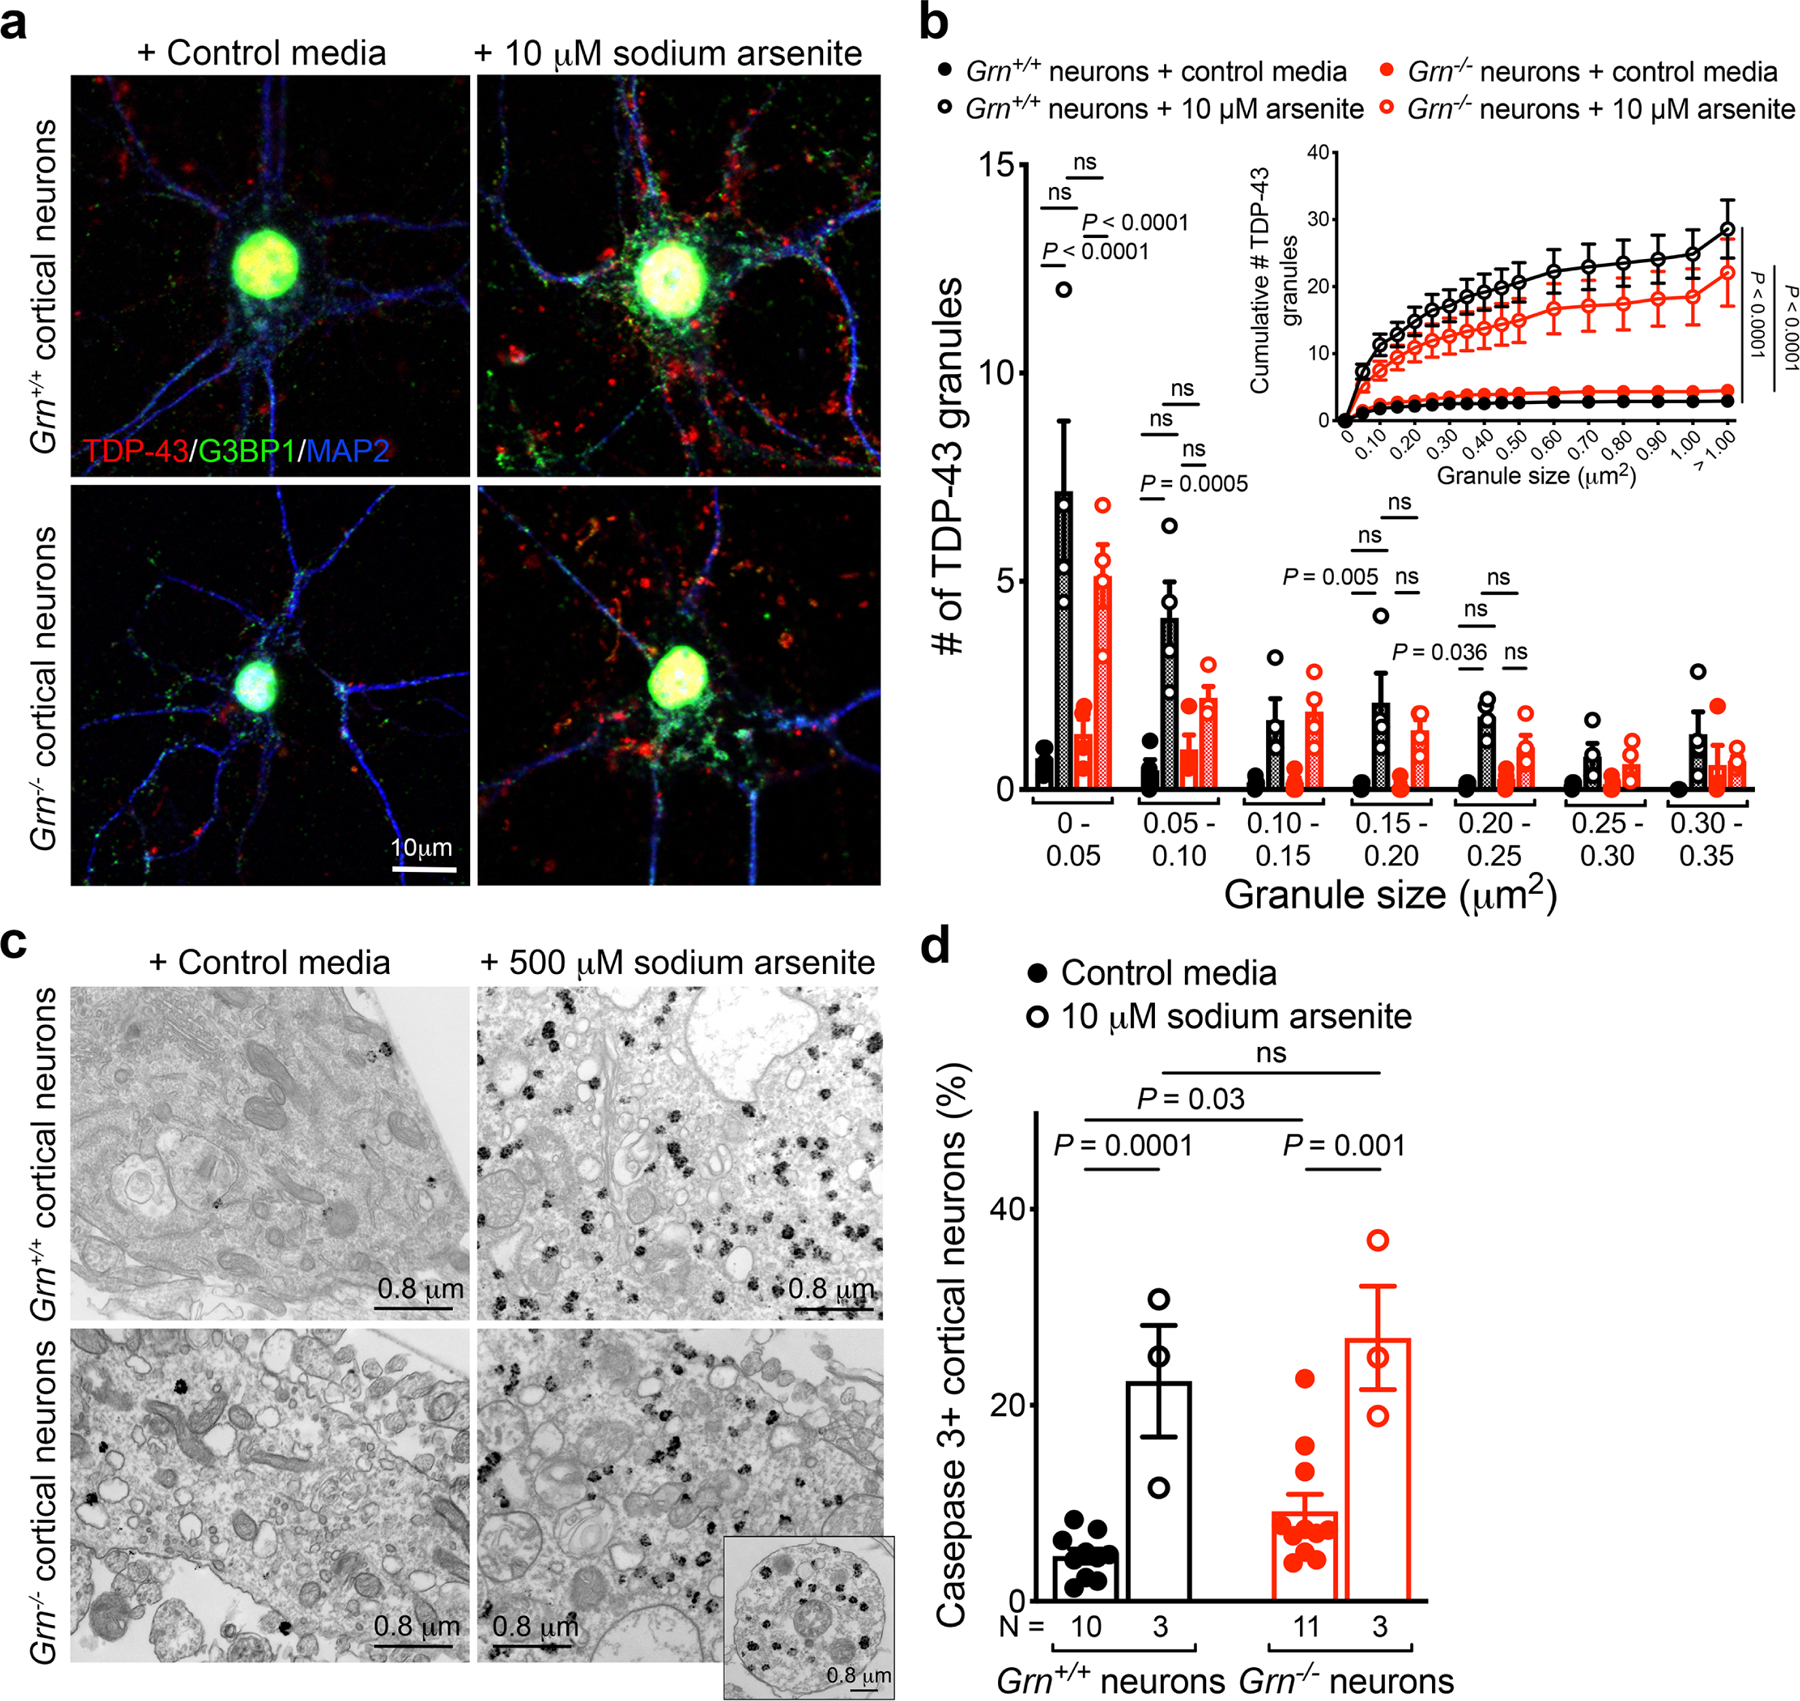
a. Sodium arsenite treatment (10 μM, 1 hr) induces prominent TDP-43 granules (red) and G3BP1+ granules (green) in Grn+/+ and Grn−/− cortical neurons. However, the TDP-43 granules and G3BP1+ granules show no evidence of colocalization in these neurons. b. Quantification using NIH ImageJ shows that the majority of TDP-43 granules are smaller than 0.05 μm2. In contrast to Grn−/− MCM treatment, sodium arsenite induces similar TDP-43 granule formation in Grn+/+ and Grn−/− cortical neurons. Images in panel a and quantification in panel b were obtained from four independent cultures. Data represent mean ± s.e.m.. Statistics use two-way ANOVA with multiple comparisons. c. Immunogold electron microscopy (IEM) reveals that TDP-43 granules induced by sodium arsenite (500 μM) have morphology similar to those in Grn−/− thalamic neurons (Figure 2d) and Grn−/− cortical neurons treated with Grn−/− MCM (Extended Data Figure 8d). At least 8 IEM images were analyzed from 2 independent cultures per condition. d. Grn+/+ and Grn−/− cortical neurons are equally vulnerable to sodium arsenite treatment (10 μM, 1 hr). Data represent mean ± s.e.m. N indicates the number of independent cultures. Statistics use two-tailed unpaired Student’s t test, ns, not significant.
Extended Data Figure 10 |. C1q and C3b produced by Grn−/− microglia promote TDP-43 granule formation and cell death in Grn−/− neurons.
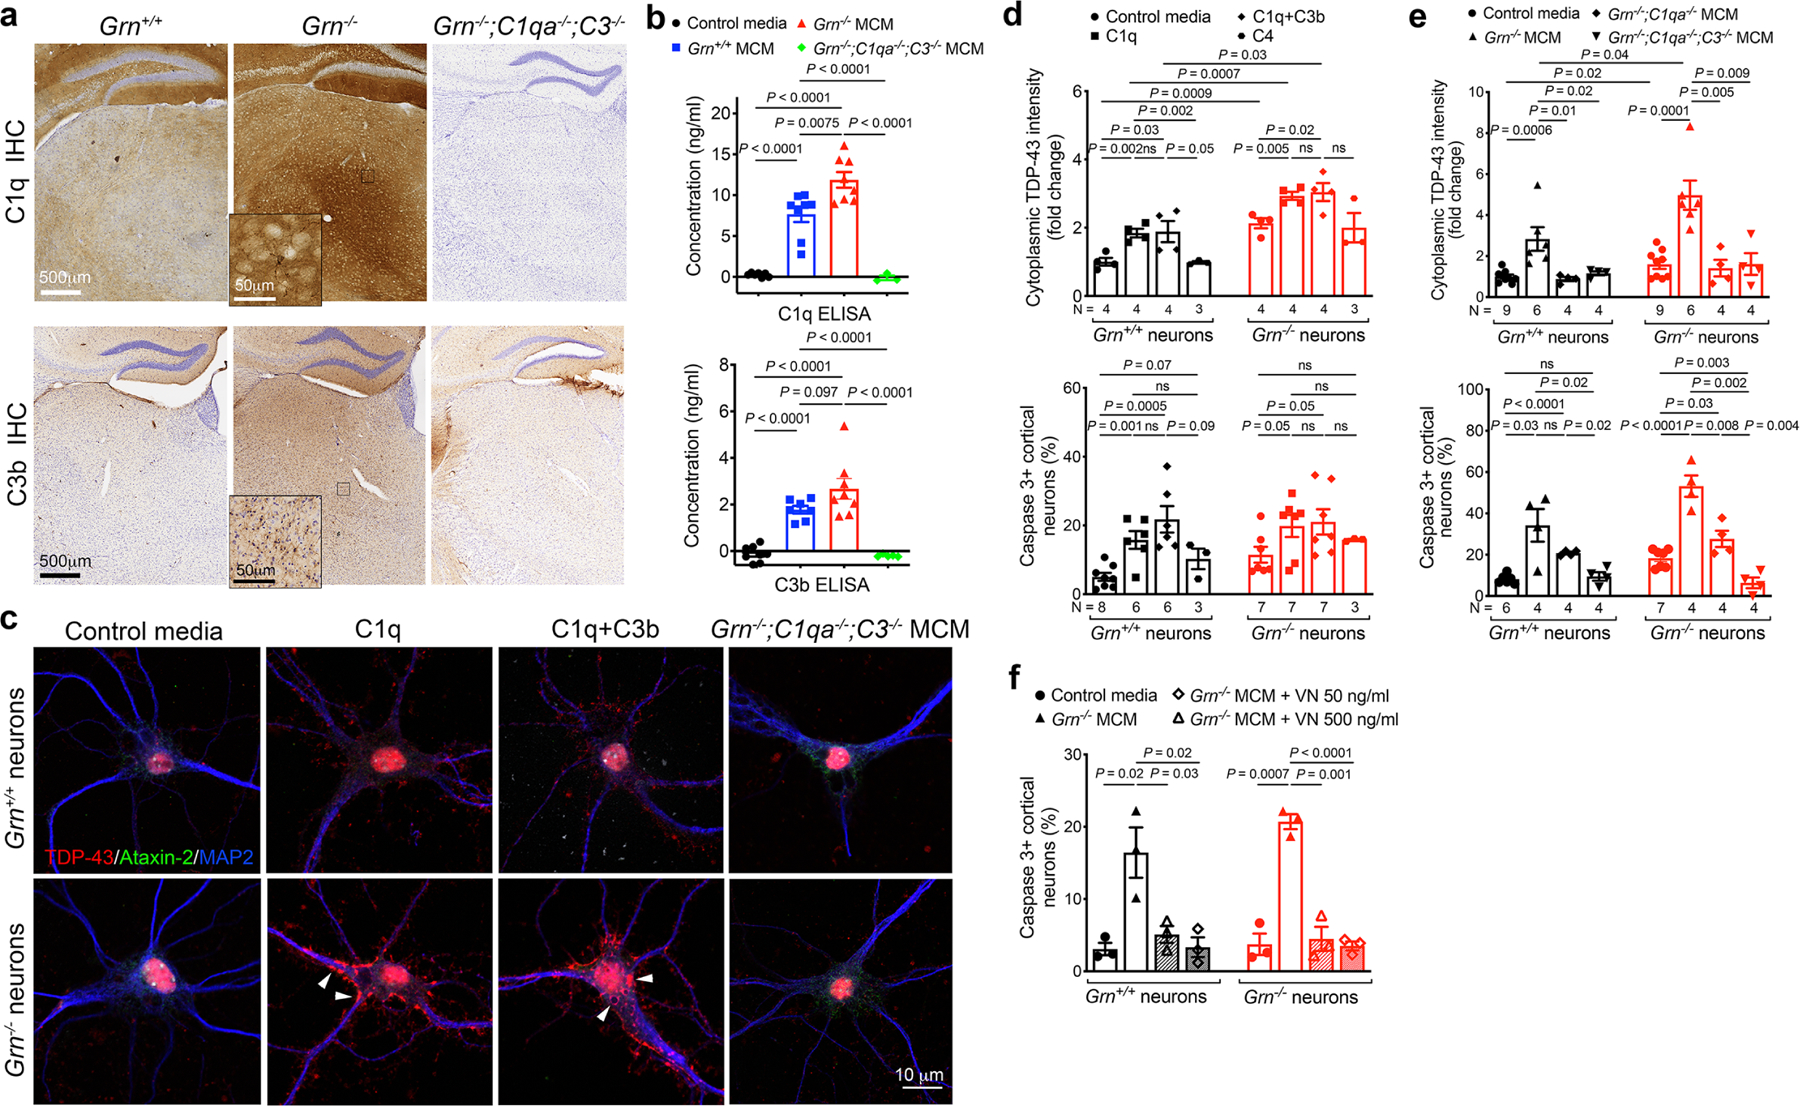
a. Immunohistochemical images of Grn+/+, Grn−/− and Grn−/−;C1qa−/−;C3b−/− mice at 7 months show the upregulation of C1q and C3b in the ventral thalamus of Grn−/− mice. No C1q or C3b staining is detected in Grn−/−;C1q−/−;C3b−/− mouse brain, confirming the specificity of these antibodies. Insets in Grn−/− panels represent higher magnification of the boxed regions in the ventral thalamus. Results were analyzed in 3 mice per genotype. b. ELISA assays for C1q and C3b show increases of both proteins in Grn−/− MCM, but no C1q or C3b is detected in Grn−/−;C1qa−/−;C3−/− MCM. Data represent mean ± s.e.m., from 8 independent microglial cultures for Grn+/+ and Grn−/− MCM, and 3 independent cultures from Grn−/−;C1qa−/−;C3−/− MCM. Statistics use two-tailed unpaired Student’s t test. c. Confocal images of cultured Grn+/+ and Grn−/− cortical neurons treated with purified human C1q (1μg/ml) or C1q+C3b (1μg/ml, each) indicate that complements are sufficient to promote the formation of TDP-43 granules in Grn+/+ and Grn−/− cortical neurons, whereas Grn−/−;C1qa−/−;C3−/− MCM fail to induce TDP-43 granule formation. d. Quantification of cytoplasmic TDP-43 intensity (upper panel) and cell death (lower panel) in Grn+/+ and Grn−/− neurons treated with C1q, C1q+C3b and C4. N in upper panel and lower panel indicates the number of independent cultures analyzed. On average, 6–8 images are obtained from each culture. Statistics use two-tailed unpaired Student’s t test. e. Quantification of cytoplasmic TDP-43 intensity (upper panel) and cell death (lower panel) in Grn+/+ and Grn−/− neurons treated with control media, Grn−/− MCM, Grn−/−;C1qa−/− MCM or Grn−/−;C1qa−/−;C3−/− MCM. Data represent mean ± s.e.m. Statistics use two-tailed unpaired Student’s t test, ns, not significant. N in upper panel and lower panel indicates the number of independent cultures analyzed. On average, 6–8 images are obtained from each culture. f. Quantification of cell death of Grn+/+ and Grn−/− neurons treated with Grn−/− MCM (250 μg/ml) and two different concentrations of vitronectin (50 or 500 ng/ml), an inhibitor of the complement membrane attack complex. Data represent mean ± s.e.m. Statistics uses two-tailed unpaired Student’s t test, ns, not significant. Data are obtained from 3 independent cultures.
Extended Data Fig. 11 |. Proposed model for the neurotoxic properties of Grn−/− microglia in promoting neurodegeneration in Grn−/− neurons.
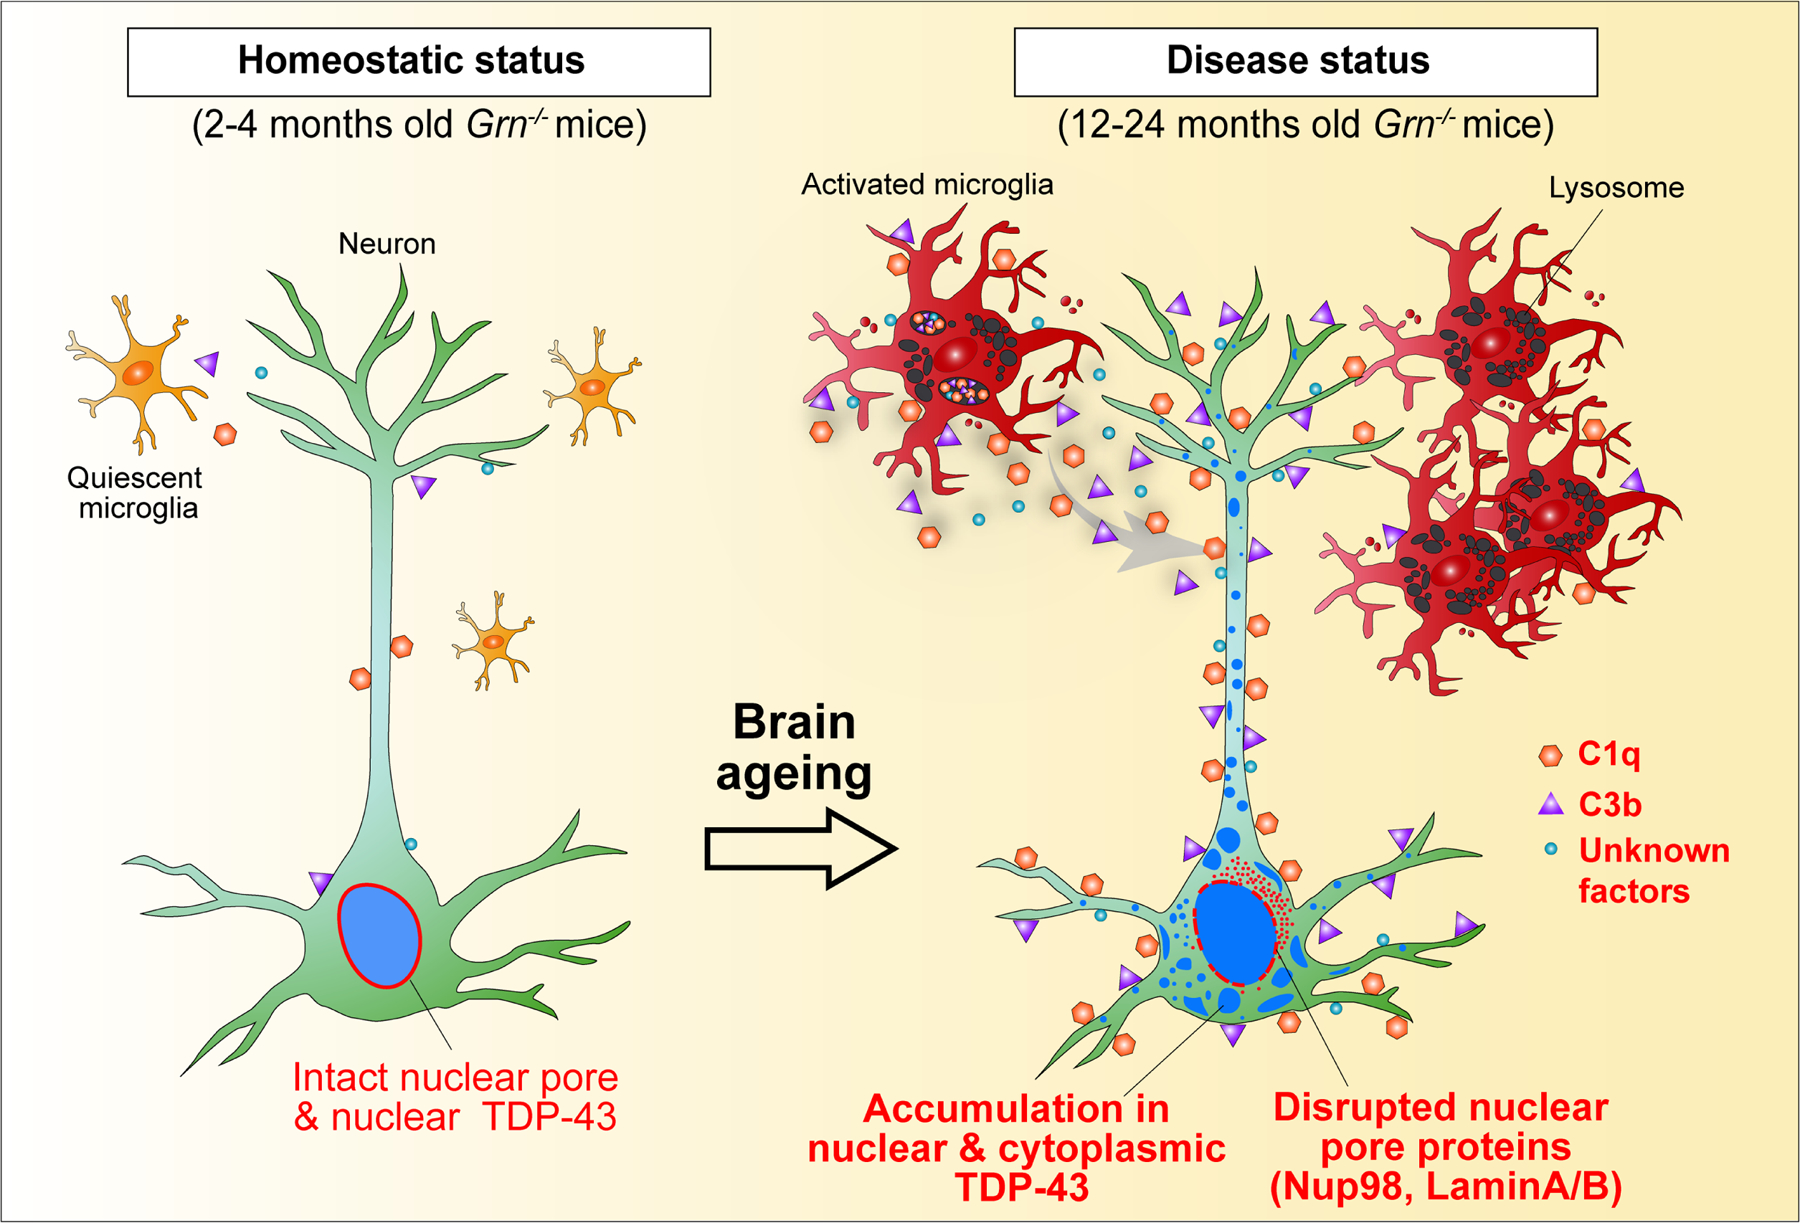
Grn−/− microglia show progressive transcriptomic changes from 7 to 12 months old. Based on gene burden analysis from snRNA-seq data, Grn−/− microglia is the first cell cluster in the thalamus to show significant transcriptomic changes at 12 months. By 19 months, Grn−/− microglia exhibit much more profound changes in their transcriptomes, affecting the expression of genes implicated in plasma membrane bounded cell projection, exocytosis, phagocytosis, protein complex assembly, ion homeostasis/transport, MAPK cascade and receptor tyrosine kinase signaling. Consistent with the snRNA-seq results, immunohistochemistry and in vitro cultures show that Grn−/− microglia show marked reduction in proteins required for homeostasis, including Tmem119 and P2Y12, but have elevated expression of lysosomal and proinflammatory proteins, including Cathepsin B, ApoE, Adam33, and many others. Our results suggest that the lysosomal defects in Grn−/− microglia may facilitate the production of complements, C1q and C3b, which promote the accumulation of nuclear and cytoplasmic TDP-43 granules, nuclear pore defects, and ultimately cell death in Grn−/− neurons. Interestingly, while purified human C1q and C3b can promote TDP-43 granule formation and cell death in Grn−/− neurons, these effects are less robust compared with Grn−/− microglia condition media (MCM). These results suggest that Grn−/− microglia may produce other unknown factors to facilitate neurodegeneration in Grn−/− neurons. This model does not exclude the possibility that complements C1q and C3b may have cell autonomous effects to activate Grn−/− microglia.
Supplementary Material
Acknowledgements
This work has been supported by grants from the National Institutes of Health (R01 AA027074 [E.J.H. and A.R.K.], R01 AG057462 [E.J.H. and J.D.], R01 AG068290 [E.J.H.], U01 MH105989 [A.R.K. and E.J.H.], K99 MH121534 [D.V.], K99 GM126136 [X.S.], R01 GM124334 [B.H.], R01 NS107480 [T.W.], and S10 RR026758 [T.W.]), Department of Veterans Affairs (I01 BX002978 [E.J.H.]), The Bluefield Project to Cure FTD (W.W.S., B.L.M., T.C.W., R.V.F., E.J.H.), NSF Graduate Research Fellowship (M.K.C.), AHA Predoctoral Fellowship 19PRE3480616 and UCSF Discovery Fellowship (J.C.), Banting Postdoctoral Fellowship from the Government of Canada 201409BPF-335868 (A.M.L.), the Glenn Foundation and the Cure Alzheimer’s Fund (S.A.L.), and the Japan Society for the Promotion of Science and Ochanomizu University Scholarship (K.H.). T.C.W. and J.P.T. are Howard Hughes Medical Institute (HHMI) Investigators and B.H. is a Chan Zuckerberg Biohub Investigator. S.A.L. would like to thank anonymous donors for their support. We thank Ivy Hsieh for immunogold electron microscopy, Yaoxuan Chen for mouse husbandry and histopathology, UCSF Nikon Imaging Center for 3D Structured Illumination Microscopy, Dr. Arturo Alvarez-Buylla for many helpful advice, and Dr. Laura Mitic and Dr. Rodney Pearlman for their supports.
Footnotes
The authors declare no competing financial interests.
Online Content
Methods, Extended Data Figures and Tables, supplementary information, Nature Research reporting summaries, source data, statements of data availability and associated accession codes are available in the online version of this paper. References unique to these sections appear only in the online paper.
Data Availability.
The raw single-nuclei RNA-sequencing (snRNA-seq) and single-cell RNA-seq (scRNA-seq) data have been deposited to the SRA Accession #PRJNA507872 and #PRJNA614533, respectively. The data that support the findings of this study are included in the manuscript. Source Data are provided for Figures 1–4 and Extended Data Figures 1–11.
References
- 1.Hofmann JW, Seeley WW & Huang EJ RNA Binding Proteins and the Pathogenesis of Frontotemporal Lobar Degeneration. Annu Rev Pathol 14, 469–495, 10.1146/annurev-pathmechdis-012418-012955 (2019). [DOI] [PMC free article] [PubMed] [Google Scholar]
- 2.Mackenzie IR et al. A harmonized classification system for FTLD-TDP pathology. Acta Neuropathol 122, 111–113, 10.1007/s00401-011-0845-8 (2011). [DOI] [PMC free article] [PubMed] [Google Scholar]
- 3.Baker M et al. Mutations in progranulin cause tau-negative frontotemporal dementia linked to chromosome 17. Nature 442, 916–919, 10.1038/nature05016 (2006). [DOI] [PubMed] [Google Scholar]
- 4.Cruts M et al. Null mutations in progranulin cause ubiquitin-positive frontotemporal dementia linked to chromosome 17q21. Nature 442, 920–924, 10.1038/nature05017 (2006). [DOI] [PubMed] [Google Scholar]
- 5.Kao AW, McKay A, Singh PP, Brunet A & Huang EJ Progranulin, lysosomal regulation and neurodegenerative disease. Nat Rev Neurosci 18, 325–333, 10.1038/nrn.2017.36 (2017). [DOI] [PMC free article] [PubMed] [Google Scholar]
- 6.Lui H et al. Progranulin Deficiency Promotes Circuit-Specific Synaptic Pruning by Microglia via Complement Activation. Cell 165, 921–935, 10.1016/j.cell.2016.04.001 (2016). [DOI] [PMC free article] [PubMed] [Google Scholar]
- 7.Chang MC et al. Progranulin deficiency causes impairment of autophagy and TDP-43 accumulation. J Exp Med, 10.1084/jem.20160999 (2017). [DOI] [PMC free article] [PubMed]
- 8.Ward ME et al. Individuals with progranulin haploinsufficiency exhibit features of neuronal ceroid lipofuscinosis. Sci Transl Med 9, 10.1126/scitranslmed.aah5642 (2017). [DOI] [PMC free article] [PubMed] [Google Scholar]
- 9.Laferriere F et al. TDP-43 extracted from frontotemporal lobar degeneration subject brains displays distinct aggregate assemblies and neurotoxic effects reflecting disease progression rates. Nat Neurosci 22, 65–77, 10.1038/s41593-018-0294-y (2019). [DOI] [PubMed] [Google Scholar]
- 10.Habib N et al. Div-Seq: Single-nucleus RNA-Seq reveals dynamics of rare adult newborn neurons. Science 353, 925–928, 10.1126/science.aad7038 (2016). [DOI] [PMC free article] [PubMed] [Google Scholar]
- 11.Lake BB et al. Neuronal subtypes and diversity revealed by single-nucleus RNA sequencing of the human brain. Science 352, 1586–1590, 10.1126/science.aaf1204 (2016). [DOI] [PMC free article] [PubMed] [Google Scholar]
- 12.Hammond TR et al. Single-Cell RNA Sequencing of Microglia throughout the Mouse Lifespan and in the Injured Brain Reveals Complex Cell-State Changes. Immunity 50, 253–271 e256, 10.1016/j.immuni.2018.11.004 (2019). [DOI] [PMC free article] [PubMed] [Google Scholar]
- 13.Ximerakis M et al. Single-cell transcriptomic profiling of the aging mouse brain. Nat Neurosci 22, 1696–1708, 10.1038/s41593-019-0491-3 (2019). [DOI] [PubMed] [Google Scholar]
- 14.Cao J et al. Comprehensive single-cell transcriptional profiling of a multicellular organism. Science 357, 661–667, 10.1126/science.aam8940 (2017). [DOI] [PMC free article] [PubMed] [Google Scholar]
- 15.Qiu X et al. Reversed graph embedding resolves complex single-cell trajectories. Nat Methods 14, 979–982, 10.1038/nmeth.4402 (2017). [DOI] [PMC free article] [PubMed] [Google Scholar]
- 16.Matcovitch-Natan O et al. Microglia development follows a stepwise program to regulate brain homeostasis. Science 353, aad8670, 10.1126/science.aad8670 (2016). [DOI] [PubMed] [Google Scholar]
- 17.Keren-Shaul H et al. A Unique Microglia Type Associated with Restricting Development of Alzheimer’s Disease. Cell 169, 1276–1290 e1217, 10.1016/j.cell.2017.05.018 (2017). [DOI] [PubMed] [Google Scholar]
- 18.Kao PF et al. Detection of TDP-43 oligomers in frontotemporal lobar degeneration-TDP. Ann Neurol 78, 211–221, 10.1002/ana.24431 (2015). [DOI] [PMC free article] [PubMed] [Google Scholar]
- 19.Griffis ER, Xu S & Powers MA Nup98 localizes to both nuclear and cytoplasmic sides of the nuclear pore and binds to two distinct nucleoporin subcomplexes. Mol Biol Cell 14, 600–610, 10.1091/mbc.e02-09-0582 (2003). [DOI] [PMC free article] [PubMed] [Google Scholar]
- 20.McGurk L et al. Poly(ADP-Ribose) Prevents Pathological Phase Separation of TDP-43 by Promoting Liquid Demixing and Stress Granule Localization. Mol Cell 71, 703–717 e709, 10.1016/j.molcel.2018.07.002 (2018). [DOI] [PMC free article] [PubMed] [Google Scholar]
- 21.Gasset-Rosa F et al. Cytoplasmic TDP-43 De-mixing Independent of Stress Granules Drives Inhibition of Nuclear Import, Loss of Nuclear TDP-43, and Cell Death. Neuron 102, 339–357 e337, 10.1016/j.neuron.2019.02.038 (2019). [DOI] [PMC free article] [PubMed] [Google Scholar]
- 22.Mann JR et al. RNA Binding Antagonizes Neurotoxic Phase Transitions of TDP-43. Neuron 102, 321–338 e328, 10.1016/j.neuron.2019.01.048 (2019). [DOI] [PMC free article] [PubMed] [Google Scholar]
- 23.Liszewski MK et al. Intracellular complement activation sustains T cell homeostasis and mediates effector differentiation. Immunity 39, 1143–1157, 10.1016/j.immuni.2013.10.018 (2013). [DOI] [PMC free article] [PubMed] [Google Scholar]
- 24.West EE, Afzali B & Kemper C Unexpected Roles for Intracellular Complement in the Regulation of Th1 Responses. Adv Immunol 138, 35–70, 10.1016/bs.ai.2018.02.001 (2018). [DOI] [PubMed] [Google Scholar]
- 25.Liu G et al. Endocytosis regulates TDP-43 toxicity and turnover. Nat Commun 8, 2092, 10.1038/s41467-017-02017-x (2017). [DOI] [PMC free article] [PubMed] [Google Scholar]
- 26.Moisse K et al. Divergent patterns of cytosolic TDP-43 and neuronal progranulin expression following axotomy: implications for TDP-43 in the physiological response to neuronal injury. Brain Res 1249, 202–211, 10.1016/j.brainres.2008.10.021 (2009). [DOI] [PubMed] [Google Scholar]
- 27.Wiesner D et al. Reversible induction of TDP-43 granules in cortical neurons after traumatic injury. Exp Neurol 299, 15–25, 10.1016/j.expneurol.2017.09.011 (2018). [DOI] [PubMed] [Google Scholar]
- 28.Vogler TO et al. TDP-43 and RNA form amyloid-like myo-granules in regenerating muscle. Nature 563, 508–513, 10.1038/s41586-018-0665-2 (2018). [DOI] [PMC free article] [PubMed] [Google Scholar]
Additional References
- 29.Martens LH et al. Progranulin deficiency promotes neuroinflammation and neuron loss following toxin-induced injury. J Clin Invest 122, 3955–3959, 10.1172/JCI63113 (2012). [DOI] [PMC free article] [PubMed] [Google Scholar]
- 30.Nguyen AD et al. Murine knockin model for progranulin-deficient frontotemporal dementia with nonsense-mediated mRNA decay. Proc Natl Acad Sci U S A 115, E2849–E2858, 10.1073/pnas.1722344115 (2018). [DOI] [PMC free article] [PubMed] [Google Scholar]
- 31.Botto M et al. Homozygous C1q deficiency causes glomerulonephritis associated with multiple apoptotic bodies. Nat Genet 19, 56–59, 10.1038/ng0598-56 (1998). [DOI] [PubMed] [Google Scholar]
- 32.Bhaduri A, Nowakowski TJ, Pollen AA & Kriegstein AR Identification of cell types in a mouse brain single-cell atlas using low sampling coverage. BMC Biol 16, 113, 10.1186/s12915-018-0580-x (2018). [DOI] [PMC free article] [PubMed] [Google Scholar]
- 33.Finak G et al. MAST: a flexible statistical framework for assessing transcriptional changes and characterizing heterogeneity in single-cell RNA sequencing data. Genome Biol 16, 278, 10.1186/s13059-015-0844-5 (2015). [DOI] [PMC free article] [PubMed] [Google Scholar]
- 34.Crowell HL et al. On the discovery of subpopulation-specific state transitions from multi-sample multi-condition single-cell RNA sequencing data. bioRxiv, 713412, 10.1101/713412 (2020). [DOI] [PMC free article] [PubMed]
- 35.McCarthy DJ, Chen Y & Smyth GK Differential expression analysis of multifactor RNA-Seq experiments with respect to biological variation. Nucleic Acids Res 40, 4288–4297, 10.1093/nar/gks042 (2012). [DOI] [PMC free article] [PubMed] [Google Scholar]
- 36.Mi H, Muruganujan A & Thomas PD PANTHER in 2013: modeling the evolution of gene function, and other gene attributes, in the context of phylogenetic trees. Nucleic Acids Res 41, D377–386, 10.1093/nar/gks1118 (2013). [DOI] [PMC free article] [PubMed] [Google Scholar]
- 37.Thomas PD et al. PANTHER: a library of protein families and subfamilies indexed by function. Genome Res 13, 2129–2141, 10.1101/gr.772403 (2003). [DOI] [PMC free article] [PubMed] [Google Scholar]
- 38.Zhou Y et al. Metascape provides a biologist-oriented resource for the analysis of systems-level datasets. Nat Commun 10, 1523, 10.1038/s41467-019-09234-6 (2019). [DOI] [PMC free article] [PubMed] [Google Scholar]
- 39.Stuart T et al. Comprehensive Integration of Single-Cell Data. Cell 177, 1888–1902 e1821, 10.1016/j.cell.2019.05.031 (2019). [DOI] [PMC free article] [PubMed] [Google Scholar]
- 40.Cao J et al. The single-cell transcriptional landscape of mammalian organogenesis. Nature 566, 496–502, 10.1038/s41586-019-0969-x (2019). [DOI] [PMC free article] [PubMed] [Google Scholar]
- 41.Huang EJ et al. Targeted deletion of numb and numblike in sensory neurons reveals their essential functions in axon arborization. Genes Dev 19, 138–151, 10.1101/gad.1246005 (2005). [DOI] [PMC free article] [PubMed] [Google Scholar]
- 42.Bohlen CJ et al. Diverse Requirements for Microglial Survival, Specification, and Function Revealed by Defined-Medium Cultures. Neuron 94, 759–773 e758, 10.1016/j.neuron.2017.04.043 (2017). [DOI] [PMC free article] [PubMed] [Google Scholar]
- 43.Lee S et al. Activation of HIPK2 Promotes ER Stress-Mediated Neurodegeneration in Amyotrophic Lateral Sclerosis. Neuron 91, 41–55, 10.1016/j.neuron.2016.05.021 (2016). [DOI] [PMC free article] [PubMed] [Google Scholar]
- 44.Shang Y, Zhang J & Huang EJ HIPK2-Mediated Transcriptional Control of NMDA Receptor Subunit Expression Regulates Neuronal Survival and Cell Death. J Neurosci 38, 4006–4019, 10.1523/JNEUROSCI.3577-17.2018 (2018). [DOI] [PMC free article] [PubMed] [Google Scholar]
- 45.Spiegel I et al. Npas4 regulates excitatory-inhibitory balance within neural circuits through cell-type-specific gene programs. Cell 157, 1216–1229, 10.1016/j.cell.2014.03.058 (2014). [DOI] [PMC free article] [PubMed] [Google Scholar]
- 46.Alami NH et al. Axonal transport of TDP-43 mRNA granules is impaired by ALS-causing mutations. Neuron 81, 536–543, 10.1016/j.neuron.2013.12.018 (2014). [DOI] [PMC free article] [PubMed] [Google Scholar]
- 47.Stehbens S, Pemble H, Murrow L & Wittmann T Imaging intracellular protein dynamics by spinning disk confocal microscopy. Methods Enzymol 504, 293–313, 10.1016/B978-0-12-391857-4.00015-X (2012). [DOI] [PMC free article] [PubMed] [Google Scholar]
- 48.Schermelleh L et al. Subdiffraction multicolor imaging of the nuclear periphery with 3D structured illumination microscopy. Science 320, 1332–1336, 10.1126/science.1156947 (2008). [DOI] [PMC free article] [PubMed] [Google Scholar]
- 49.Zhang J et al. Essential function of HIPK2 in TGFbeta-dependent survival of midbrain dopamine neurons. Nature neuroscience 10, 77–86, 10.1038/nn1816 (2007). [DOI] [PMC free article] [PubMed] [Google Scholar]
- 50.Martin S et al. Deficiency of G3BP1, the stress granules assembly factor, results in abnormal synaptic plasticity and calcium homeostasis in neurons. J Neurochem 125, 175–184, 10.1111/jnc.12189 (2013). [DOI] [PubMed] [Google Scholar]
- 51.Sahoo PK et al. Axonal G3BP1 stress granule protein limits axonal mRNA translation and nerve regeneration. Nat Commun 9, 3358, 10.1038/s41467-018-05647-x (2018). [DOI] [PMC free article] [PubMed] [Google Scholar]
Associated Data
This section collects any data citations, data availability statements, or supplementary materials included in this article.


