

Abstract
The MAPK/ERK Kinase MEK is a shared effector of the frequent cancer drivers KRAS and BRAF that has long been pursued as a drug target in oncology1, and more recently in immunotherapy2,3 and aging4. However, many MEK inhibitors (MEKi) are limited due to on-target toxicities5–7 and drug resistance8–10. Accordingly, a molecular understanding of the structure and function of MEK within physiological complexes could provide a template for the design of safer and more effective therapies. Here we report X-ray crystal structures of MEK bound to the scaffold KSR (Kinase Suppressor of Ras) with various MEKi, including the clinical drug trametinib. The structures reveal an unexpected mode of binding in which trametinib directly engages KSR at the MEK interface. Through complexation, KSR remodels the prototypical MEKi allosteric pocket thereby impacting binding and kinetics, including drug residence time. Moreover, trametinib binds KSR-MEK but disrupts the related RAF-MEK complex through a mechanism that exploits evolutionarily conserved interface residues that distinguish these subcomplexes. Based on these insights we created trametiglue, which limits adaptive resistance to MEKi through enhanced interfacial binding. Together, our results reveal the plasticity of an interface pocket within MEK subcomplexes that has implications for the design of next generation drugs targeting the RAS pathway.
Among MEKi, the drugs trametinib, cobimetinib, selumetinib, and binemetinib, have been identified as therapeutics for cancer or Mendelian diseases referred to as RASopathies1,11. Trametinib was first approved by the FDA for the treatment of BRAF V600E/K mutant melanoma, and is now in development for several other cancers, including KRAS positive cancers12. Trametinib forms the basis for several combination therapies, including with RAFi13, autophagy inhibitors14, checkpoint blockade3,15, and KRAS(G12C) inhibitors16. However, unlike most targeted therapies, trametinib was serendipitously identified through phenotypic screens17. Despite its clinical utility, the mechanism of action for trametinib is not fully understood. Indeed, the structural and functional basis for the distinct pharmacological properties of trametinib relative to other MEKi remains elusive.
Trametinib Engages the KSR:MEK Interface
It is increasingly rare to lack structural data on ligand-target complexes of clinically approved drugs18. While we too were unable to obtain co-crystals of isolated MEK1 with trametinib, when purified in complex with human KSR1 or KSR2, we were able to determine 3.3 Å and 2.8 Å structures of trametinib bound to the KSR1:MEK1 and KSR2:MEK1 complexes, respectively (Extended Data Figure 1A). In the trametinib-bound structures, the compound occupies the typical MEKi allosteric site adjacent to ATP19,20, consistent with the characterization of trametinib as an ATP non-competitive kinase inhibitor21 (Figure 1A). However, trametinib also engages an extended sub-pocket that reaches the KSR interaction interface (Figure 1B).
Figure 1. The trametinib binding pocket in MEK extends to the KSR interaction interface.
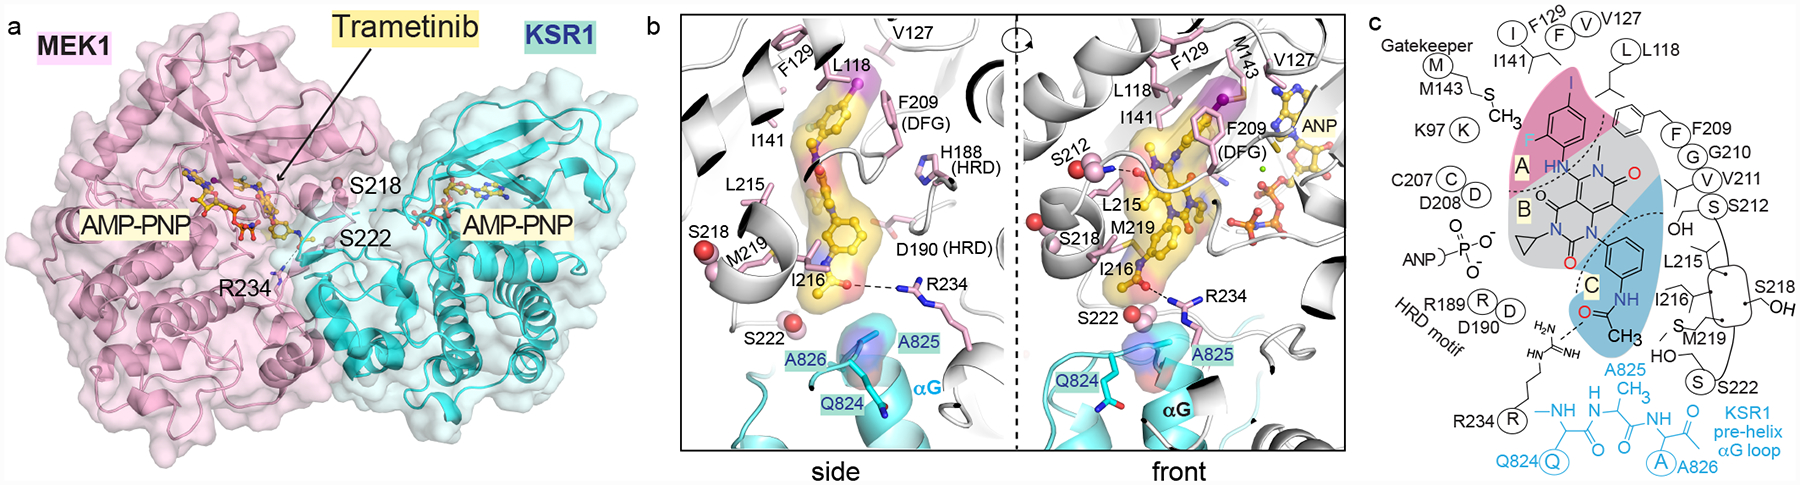
A. Trametinib bound to KSR1:MEK1:AMP-PNP. See Extended Data Figure 1 for trametinib bound to KSR2:MEK1:AMP-PNP.
B. Trametinib contacts include A825 in the pre-helix αG loop of KSR1. Direct contacts of trametinib with MEK1 also highlighted.
C. 2D schematic of the trametinib binding pocket.
Overall, trametinib can be subdivided into 3 pharmacophores (Figure 1C). The A section, including the 2-fluoro, 4-iodo substituted phenyl group, is sandwiched between the gatekeeper Met143, conserved lysine (Lys97) of subdomain II, and several hydrophobic residues at the C-terminus of helix αC (Leu118) and beginning of β-strand 4 (Val127, F129) in MEK1. The second B section packs on one-side against the N-terminal end of the activation segment, including the DFG motif starting at Asp208. This portion of the inhibitor also generates a hydrogen bond to the backbone amide of Ser212, which is also key to several other MEKi22. The opposite side of the B section, including the cyclo-propyl ring, lies immediately adjacent to the phosphates of ATP. The unique portion of trametinib, not found in any other clinical MEK inhibitor, includes the 3-substituted phenyl acetamide group, which we refer to as section C. This section of trametinib is located in a pocket formed at the interface of MEK and KSR with contacts including the activation segment of MEK through direct interactions with a 310-helix, Leu215, Ile216, and Met219, Arg189 and Asp190 of the HRD motif, an acetamide-Arg234 salt bridge located at the end of the activation segment, and on KSR at Ala825 and Pro878 in KSR1 and KSR2, respectively that emanate from the pre-αG loop (Figure 1B,C; Extended Data Figure 1C,D). Highlighting the functional importance of this region, the pre-helix αG loop in KSR has previously been implicated in oncogenic signaling with the RASG12V suppressor allele P696L in C. elegans ksr-123. Overall, the crystal structures suggest that the trametinib binding pocket is formed in part through the KSR:MEK interaction interface.
KSR Modulates Target Engagement of MEKi
To better understand the unique properties of trametinib, we also solved structures of KSR2:MEK1 and KSR1:MEK1 bound to cobimetinib (2.99 Å and 3.10 Å, respectively), selumetinib (3.09 Å and 3.21 Å, respectively), and PD0325901 (3.19 Å and 3.63 Å, respectively) (Extended Data Fig 1A). Unlike trametinib, KSR1 and KSR2 do not directly interact with the other MEKi ligands that we analyzed, suggesting that the direct engagement of KSR is a unique feature of trametinib (Figure 2A). Indeed, whereas the terminal -CH3 group within trametinib is within a bonding distance of ~3 Å to KSR1 or KSR2 (Extended Data Figure 2A), the other MEKi that we analysed are up to 10 Å from direct contact with the KSR:MEK interaction interface.
Figure 2: Binding of KSR to MEK creates an enlarged allosteric binding pocket for inhibitors.
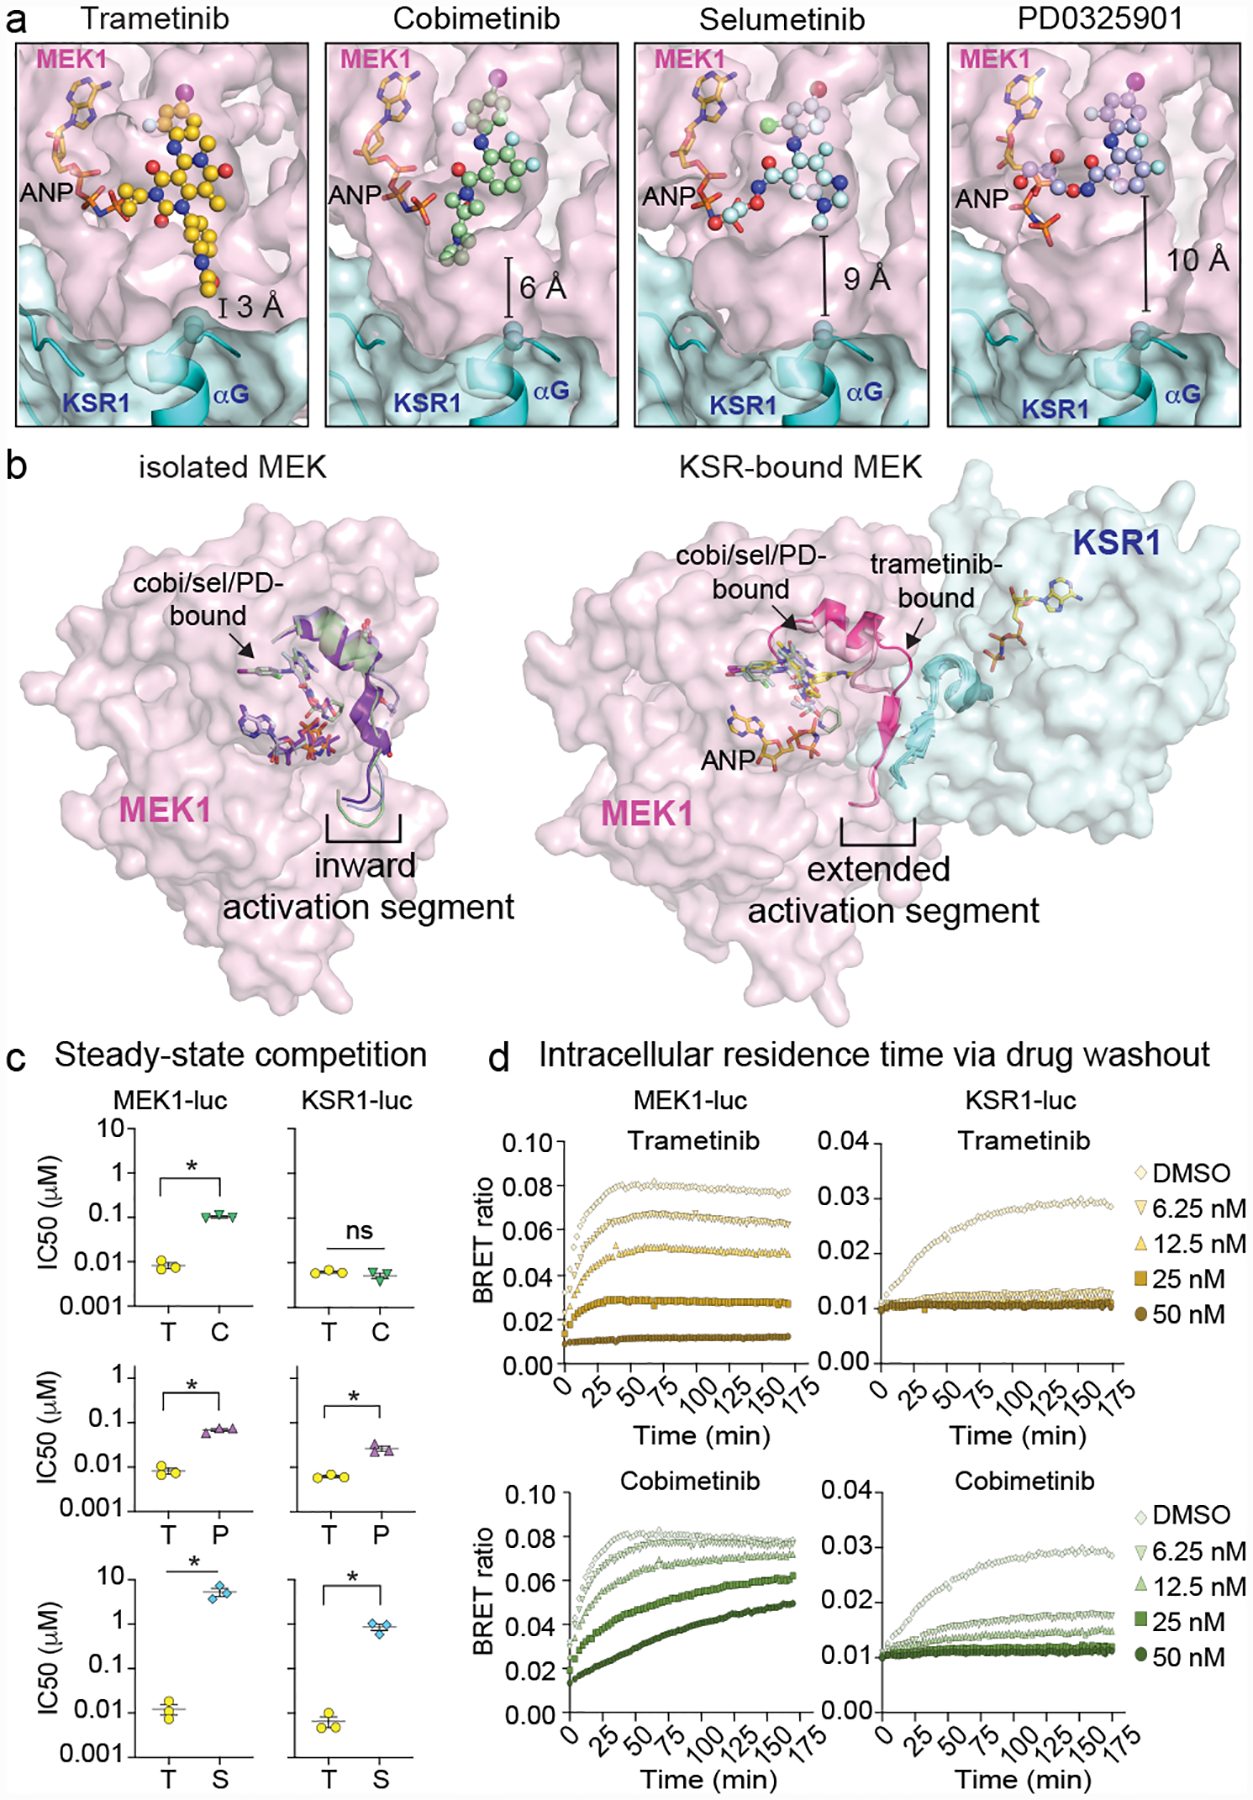
A. Binding comparison of MEKi in KSR1:MEK1. Of the analysed MEKi, only trametinib directly engages KSR1.
B. Structures of isolated MEK1 bound to cobimetinib (PDB ID 4LMN; activation segment colored green), selumetinib (4U7Z; blue) and PD0325901 (3VVH; purple) compared to the KSR1:MEK1 complex for the indicated MEKi. Binding of KSR1 to MEK1 stabilizes an outward orientation of the MEK1 activation segment. See Extended Data Figure 2 for additional analysis and electron density maps.
C. Comparison of trametinib IC50 values vs other MEKi on MEK1-luc and KSR1-luc. Mean and standard errors determined from 3 independent experiments. Each drug was compared to trametinib using an unpaired two-tailed t test where an asterisk represents a P-value less than 0.05. MEK-luc: T(trametinib) vs. C(cobimetinib) p<0.0001, t=16.85, df=4; T vs P(PD0325901) P=0.0004, t=11.26, df=4; T vs S(selumetinib) P=0.0081, t=4.985, df=4; KSR-luc: T vs C P=0.223, t=1.425, df=4; T vs P P=0.0046, t=5.735, df=4, T vs S P=0.0036, df=4.
D. Representative intracellular residence time plots for cells pre-treated with a range of sub-saturating levels of trametinib and cobimetinib that were transfected with MEK1-luc (left) and mouse KSR1-luc (right). The build-up signal (height and rate) is proportional to the dissociation of the indicated compounds on MEK1 or KSR1-bound MEK complex following the addition of Tram-bo (1 μM) on cells that were pre-treated and then washed of the MEKi. Note the DMSO curves are the same in both the trametinib and cobimetinib plots due to the experimental design where all data was collected at once on one plate. See replicate data in Supplementary Figure 2.
Compared with isolated MEK1, the MEKi pocket differs in shape and size when MEK1 is in complex with KSR1/2 (Figure 2B). Unlike isolated MEK1 bound to PD0325901 (PDB code: 3VVH), selumetinib (4U7Z), and cobimetinib (4LMN), MEK1 displays substantial structural differences in the N-terminal end of the activation loop, 310-helix, and Ser218-Ser222 sites, as these motifs extend up to ~9Å away from the active site of MEK1 upon complexation to KSR (Extended Data Figure 2B). This large shift in activation loop conformation, and concomitant increase in the size of the MEKi allosteric pocket, is stabilized through the pre-helix αG loop on KSR, and also through the formation of unique anti-parallel β-sheet shared between MEK1 and KSR1 or KSR2 (Extended Data Figure 2C). Specific to KSR1:MEK1, the 3-residue antiparallel β-sheet structure within the activation segment extends to a 4-residue stretch upon complexation with trametinib (D–E). This structural change, which occurs in a segment connecting the key phospho-regulatory sites S218 and S222 in MEK1, creates a further expanded pocket so as to accommodate the phenyl-acetamide group in trametinib. The same rearrangement does not occur within KSR2:MEK1, as the anti-parallel activation segments adopt an extended six-residue sheet irrespective of MEKi engagement (Extended Data Figure 2D–E). KSR1 also differs from KSR2 by a unique helical extension (αG’) and at several motifs (Extended Data Figure 3).
Together, the structural comparisons suggest that the MEKi allosteric pocket differs substantially between isolated MEK, in which the activation segment adopts an ‘inward’ configuration, and the KSR-bound state, in which the same region adopts an ‘extended’ conformation (Figure 2B). Additionally, in the complex, trametinib is accommodated through an enlarged allosteric binding pocket in MEK that is remodelled through direct contacts with KSR. To investigate pharmacological readouts of MEK and KSR-bound MEK in vivo, we adapted a target engagement assay24 to measure MEKi interactions within a cellular context. Briefly, we synthesized a bodipy-conjugated version of trametinib (tram-bo) to serve as a fluorescent small molecule tracer for bioluminescence resonance energy transfer (BRET) with Nanoluciferase (luc) tagged versions of KSR1 or MEK1 (Extended Data Figure 4A–G). When expressed in cells, both KSR1-luc or MEK1-luc, but not control kinases, generated BRET with tram-bo that could be competed with free trametinib, suggesting that tram-bo binds the same allosteric pocket as trametinib (Extended Data Figure 4H). Further, a W781D KSR1 mutant at the MEK1 interaction interface ablated the BRET dose response (Extended Data Figure 4I). Thus, MEK1-luc serves as a reporter for several states of MEK that are accessible within live cells, including free MEK. Whereas energy transfer between KSR1-luc and tram-bo depends on the formation of the KSR:MEK complex in vivo.
Under equilibrium binding conditions, we obtained near identical steady-state IC50 values of 6.7 +/− 0.5 and 7.6 +/− 1.1 nM for trametinib against KSR1-luc and MEK1-luc, respectively (Supplementary Figure 2). However, with cobimetinib, PD0325901, and selumetinib, we obtained markedly distinct potency values, differing by as much as ~20-fold for cobimetinib (IC50 = 5.1 +/− 0.7 nM on KSR1-luc and 102.8 +/− 5 nM on MEK1-luc; Figure 2C). Furthermore, PD0325901, cobimetinib, and selumetinib all competed tram-bo with more potent IC50 values on KSR1-luc over MEK1-luc (Extended Data Figure 5A), suggesting that KSR-bound MEK represents a high-affinity target for these MEKi in vivo. The only exception we found was the compound CH5126766 with relatively low μM IC50 values in comparison to other MEKi (Supplementary Figure 2), which may reflect the unique mechanism of action proposed for this compound25.
The significantly distinct IC50s for MEK1-luc and KSR1-luc with the MEKi PD0325901, cobimetinib, and selumetinib would be consistent with a model in which these compounds bind multiple distinct configurations of MEK as represented by ‘inward’ and ‘extended’ conformations observed in crystal structures (Figure 2B). Moreover, the presence of KSR1 could hinder the dissociation of PD0325901, cobimetinib, and selumetinib from MEK1 by sterically occluding drug release, potentially favoring drug ‘rebinding’26 that leads to more potent apparent IC50 values observed within the complex; as supported by co-expression analysis (Extended Data Figure 5B). Whereas, the near-identical IC50s for trametinib on KSR1-luc and MEK1-luc, would be consistent with this compound engaging a single target configuration in vivo. In particular, we propose that under the conditions of our competition assays within engineered cell lines, trametinib is unique in demonstrating selectivity for the extended activation segment conformation that we observe in structures of KSR-bound MEK.
We next performed washout experiments on cells pre-treated with the different MEKi to which we then added tram-bo (Extended Data Figure 4G). In these experiments, the velocity of the BRET build-up curve, as measured by the association of fluorescent tracer over time, is proportional to the dissociation and intracellular residence time of free-ligand24. Over a range of MEKi concentrations both above and near the IC50 values, we observed varying dissociation kinetics among the MEKi on both MEK1-luc and KSR1-luc (Supplementary Figure 2). Trametinib demonstrated the slowest dissociation kinetics with no detectable BRET signal recovery over a 175-minute time course on KSR1-luc, and to a lesser extent MEK1-luc, over a range of inhibitor concentrations (Figure 2D, top panels); this was also observed through MEK1-luc and KSR1 co-expression (Extended Data Figure 5C). In comparison, cobimetinib dissociated more readily from both MEK1-luc and KSR1-luc, despite similar IC50 values on the complex relative to trametinib (Figure 2D, lower panels). This data suggests that within the nonequilibrium conditions of a washout experiment, which may mimic target occupancy and pharmacology under the dynamic conditions typically observed in vivo24, certain MEKi specifically engage KSR-bound MEK for extended periods of time.
Trametinib Binds KSR:MEK, Disrupts RAF:MEK
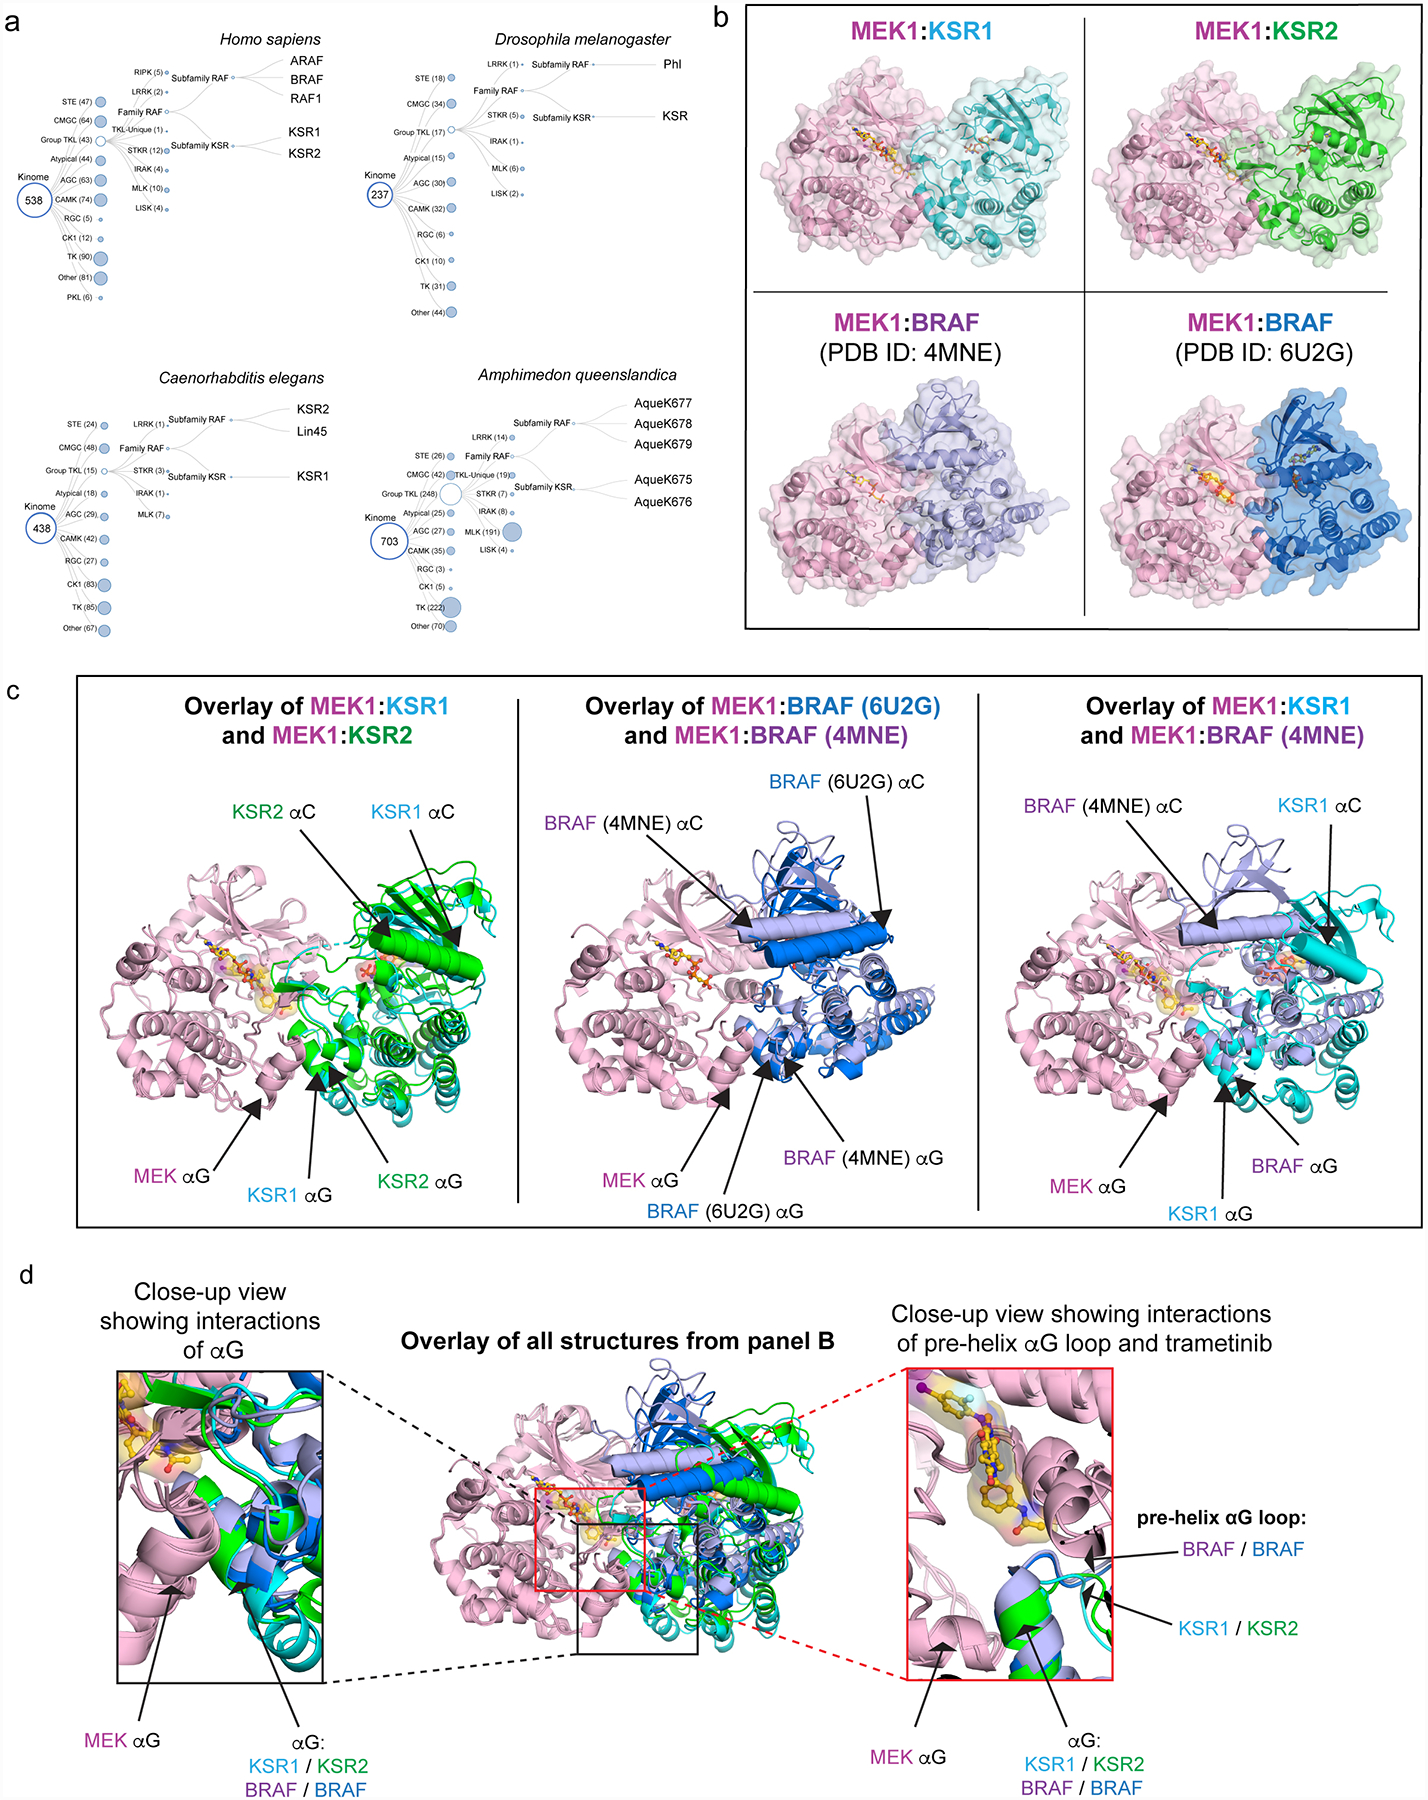
KSR belongs to the larger family of RAF kinases27. However, unlike BRAF, CRAF/RAF1, or ARAF, KSR1 and KSR2 are characterized as pseudokinases due to active site mutations. Notably, KSR and RAF pairs co-exist across a variety of metazoan species (Extended Data Figure 6A). Further, much like the KSR:MEK complexes, BRAF and MEK1 can form a similar complex centered on reciprocal helix αG interactions (Extended Data Figure 6B–D28–31).
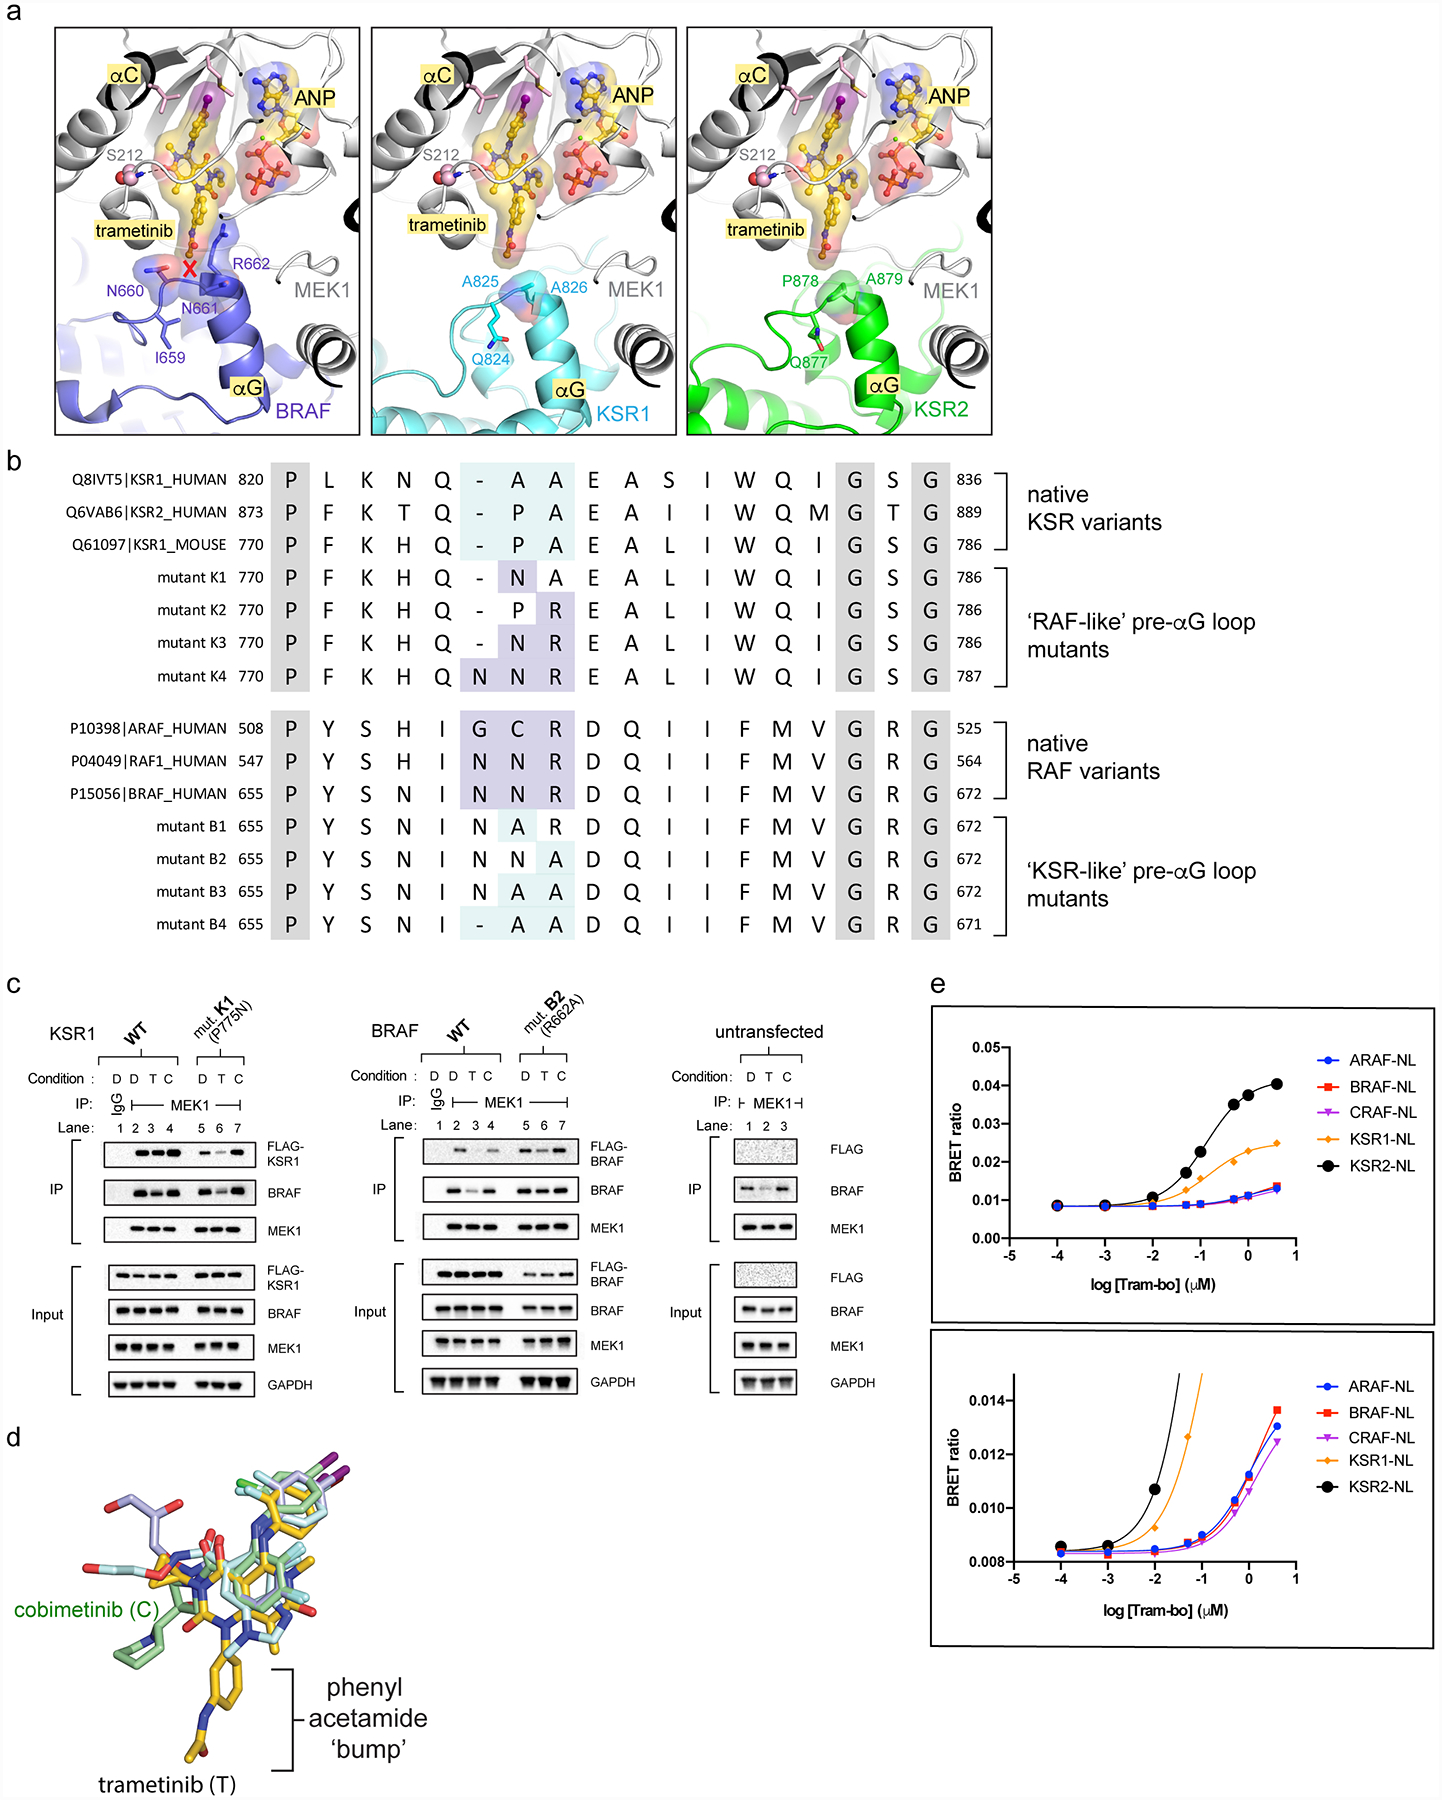
Previous work on several clinical MEKi have suggested that trametinib weakens the interaction of MEK towards RAF9, yet our crystal structures and functional analysis clearly demonstrate binding of trametinib to MEK in the presence of KSR. We therefore next sought to understand how trametinib may impede binding of MEK to RAF yet favor binding towards KSR. For this, we superimposed the BRAF:MEK1 crystal structure onto the KSR:MEK1:trametinib structures that we determined, which revealed a putative steric clash between the phenyl acetamide of trametinib and the pre-helix αG loop in BRAF (Figure 3A). In particular, the N660-N661-R662 motif in human BRAF is predicted to effectively reduce the size of the trametinib binding pocket, thereby preventing binding of BRAF to MEK in the presence of drug (Extended Data Figure 7A). In contrast, the equivalent motif in KSR includes a gap followed by residues with relatively small side chains. For example, human KSR1 includes the sequence GAP-A825-A826 at the pre-helix αG loop. Notably, the ‘small’ versus ‘large’ pre-helix αG loops in KSR and RAF family kinases are highly conserved (Figure 3B). Thus, our structural analysis suggested that the mechanism of action for trametinib could depend, at least in part, on exploiting evolutionarily conserved differences in the size and composition of the pre-helix αG loop among KSR pseudokinases and RAF sub-family kinases.
Figure 3: The trametinib binding site distinguishes KSR from RAF.

A. Structural overlay of the BRAF:MEK1, KSR1:MEK1, and KSR2:MEK1 complexes predicts a clash between trametinib and the pre-helix αG loop of BRAF.
B. Sequence alignment of RAF kinases and KSR pseudokinases at the trametinib-binding site. Numbering for human KSR1, KSR2, and BRAF highlighted.
C. And D.
IP/WB of endogenous MEK1 from lysates of HCT116 cells transfected with FLAG-tagged wild-type and mutant versions of full-length mouse KSR1 (panel C) or human BRAF (panel D). Cells were treated with DMSO or 200 nM trametinib for 1 hour prior to harvesting cells. IgG was used as a control for non-specific binding of proteins during IPs (lanes 1 vs 2). Transfected KSR1 and BRAF were detected using anti-FLAG antibody. All other western blot signals were detected using specific antibodies against endogenous proteins; note, the antibody against BRAF detects both endogenous and transfected FLAG-tagged BRAF. Blots are representative of three independent experiments with similar results, uncropped blots in Supplementary Figure 1.
To test the hypothesis that trametinib acts differentially upon KSR and RAF proteins at the MEK interaction interface, we generated a reciprocal set of mutants in which we systematically altered the sequences in the pre-helix αG loop of KSR and RAF to a set of ‘RAF-like’ and ‘KSR-like’ alleles, respectively (Extended Data Figure 7B). The mutants, along with wild-type (WT) controls, were transfected into cells and evaluated for binding to endogenous MEK, in the presence and absence of trametinib, via co-immunoprecipitation (co-IP). Addition of trametinib to cells expressing wild-type KSR1 led to sustained pulldown of KSR1 (Figure 3C; lanes 2 vs 3), but as expected based on previously published results9, diminished binding of BRAF (Figure 3D; lanes 2 vs 3).
Mutations that made KSR1 more ‘RAF-like’ largely resulted in loss of function with respect to pulldown via MEK1 (Figure 3C; compare lanes 2 vs 4, 6, 8, or 10). However, one KSR allele, mutant K1(P775N) demonstrated diminished pulldown relative to WT-KSR1 at baseline, and further complex destabilization in the presence of trametinib much like wild-type BRAF (Figure 3C; compare lanes 4 vs 5 to 2 vs 3). Two of the tested ‘KSR-like’ alleles in BRAF (mutants B2-R662A and B3-N661A/R662A) allowed for sustained pulldown in the presence of trametinib relative to WT-BRAF (Figure 3D, compare lanes 2 vs 3 to 6 vs 7 and 8 vs 9). In contrast, cobimetinib, which does not possess an analogous phenyl acetamide ‘bump’ as trametinib, did not alter complex stability towards the K1 and B2 mutants of KSR1 and BRAF, respectively (Extended Data Figure 7C,D). Thus, space-creating mutations R662A(B2) and N661A/R662A(B3) in the pre-helix αG loop of BRAF enable binding of trametinib to stable RAF-MEK complexes, whereas a space-reducing mutation P775N(K1) in KSR1 diminished the stability of mutant KSR-MEK complexes, which was further hindered in the presence of trametinib.
Together, the results of our structural and functional analysis support a model in which the natural residues within the pre-helix αG loops of RAF and KSR disfavor or favor, respectively, direct binding to MEK in the presence of trametinib. Consistent with this model and predicted selectivity differences among isoforms, tram-bo generated strong BRET binding signals for human KSR2-luc and KSR1-luc in cells, and much weaker BRET signals towards ARAF-luc, BRAF-luc, and CRAF-luc (Extended Data Figure 7E).
To further examine trametinib interactions with MEK when isolated or in complex with KSR or RAF, we used in vitro binding analysis (Extended Figure 8). For these studies, we generated a biotinylated version of trametinib similar in structure to the conjugated version of the drug21 used to pull-down and identify MEK as a target of the compound. For isolated MEK1 or MEK1:BRAF, we obtained KD values of 131 +/− 9.4 nM and 217 +/− 3.2 nM, respectively. Whereas, we measured KD values of 63.9 +/− 4.7 and 70.4 +/− 4.4 nM against KSR1:MEK1 and KSR2:MEK1, respectively. Further, we found significant differences in off rates (kdis(1/s); Extended Data Figure 8B), which relates to drug residence time32, with drug-target lifetimes of 23.1 +/− 0.6 and 27.6 +/− 2.2 minutes for isolated MEK1 and BRAF:MEK1, respectively, compared to 90.1 +/− 5.2 and 84.8 +/− 2.4 minutes for KSR1:MEK1 and KSR2:MEK1, respectively. Thus, in vitro binding kinetics of trametinib towards MEK1 are distinctly enhanced in the presence of bound KSR1 or KSR2.
Searching publicly available datasets, we identified two CRISPR screens in which KSR1 emerged as a strong modifier of potency for trametinib or a trametinib+dabrafenib combination within cellular models, which is supportive of an in vivo role for endogenous KSR in the mechanism of action of trametinib (Extended Data Figure 9A). Given our structural insights, the results of these screens could be revisited based on a model in which KSR serves as a direct co-receptor for trametinib. Indeed, we propose that KSR pseudokinases and RAF kinases share an overlapping binding site towards MEK, and that through these interactions centered around helix αG, trametinib is able to sustain binding of MEK directly towards KSR over RAF (Extended Data Figure 9B). Through this biochemical mechanism, and reported differences in circulating half-life33, trametinib would display greater specificity and residence time towards KSR-bound states of MEK.
A New-Generation Trametinib Analog
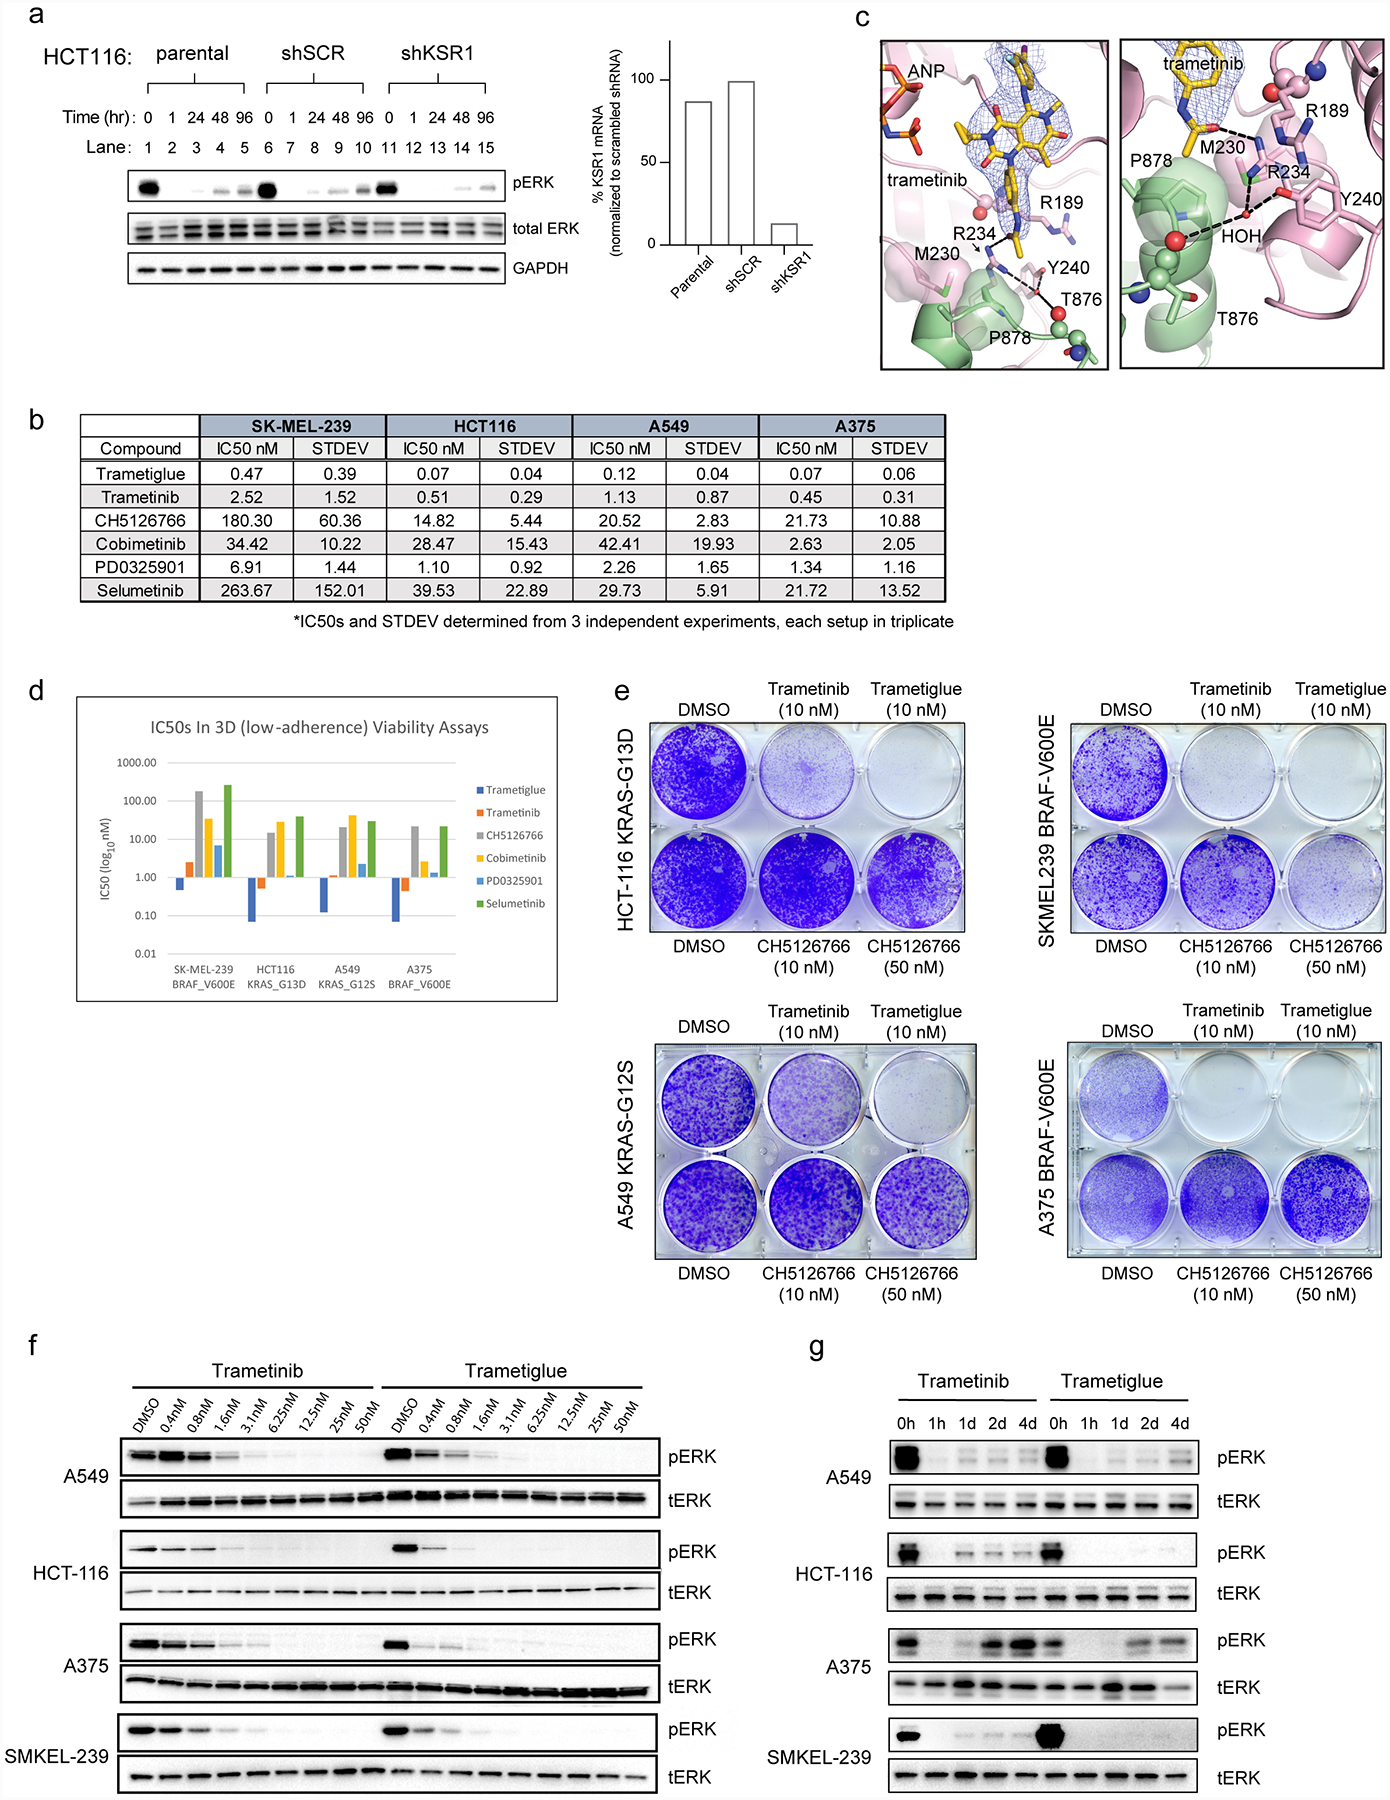
A significant limitation of trametinib, and several clinical MEKi, is the susceptibility of this class of compounds to adaptive forms of drug-resistance34. For example, because trametinib is unable to effectively ‘trap’ RAF kinases within inactive complexes with MEK, it has been proposed that the efficacy of trametinib is lost over time due to release of negative feedback signaling downstream of RAS and drug escape via active RAF kinases, including BRAF and CRAF9. The adaptive resistance to MEKi is also KSR1-dependent35, which we confirmed (Extended Data Figure 10A). A MEKi that has been reported to effectively promote, and thereby trap, RAF-bound MEK is the compound CH512676625. However, unlike trametinib, CH5126766 is orders of magnitude weaker in terms of biochemical and cellular potency (Extended Data Figures 5A,10B); thus, a compound that would retain the potency and slow off-rate kinetics of trametinib combined with the functional impact of CH5126766 on higher-order MAPK signaling complexes could represent a potential therapeutic advance. To test if we could overcome adaptive resistance to MEKi through alterations at the interfacial binding site of KSR-MEK, and potentially RAF-MEK, we created a derivative of trametinib, which we term trametiglue (Figure 4A).
Figure 4: Trametiglue targets both KSR-MEK and RAF-MEK with unprecedented potency and selectivity via unique interfacial binding interactions.
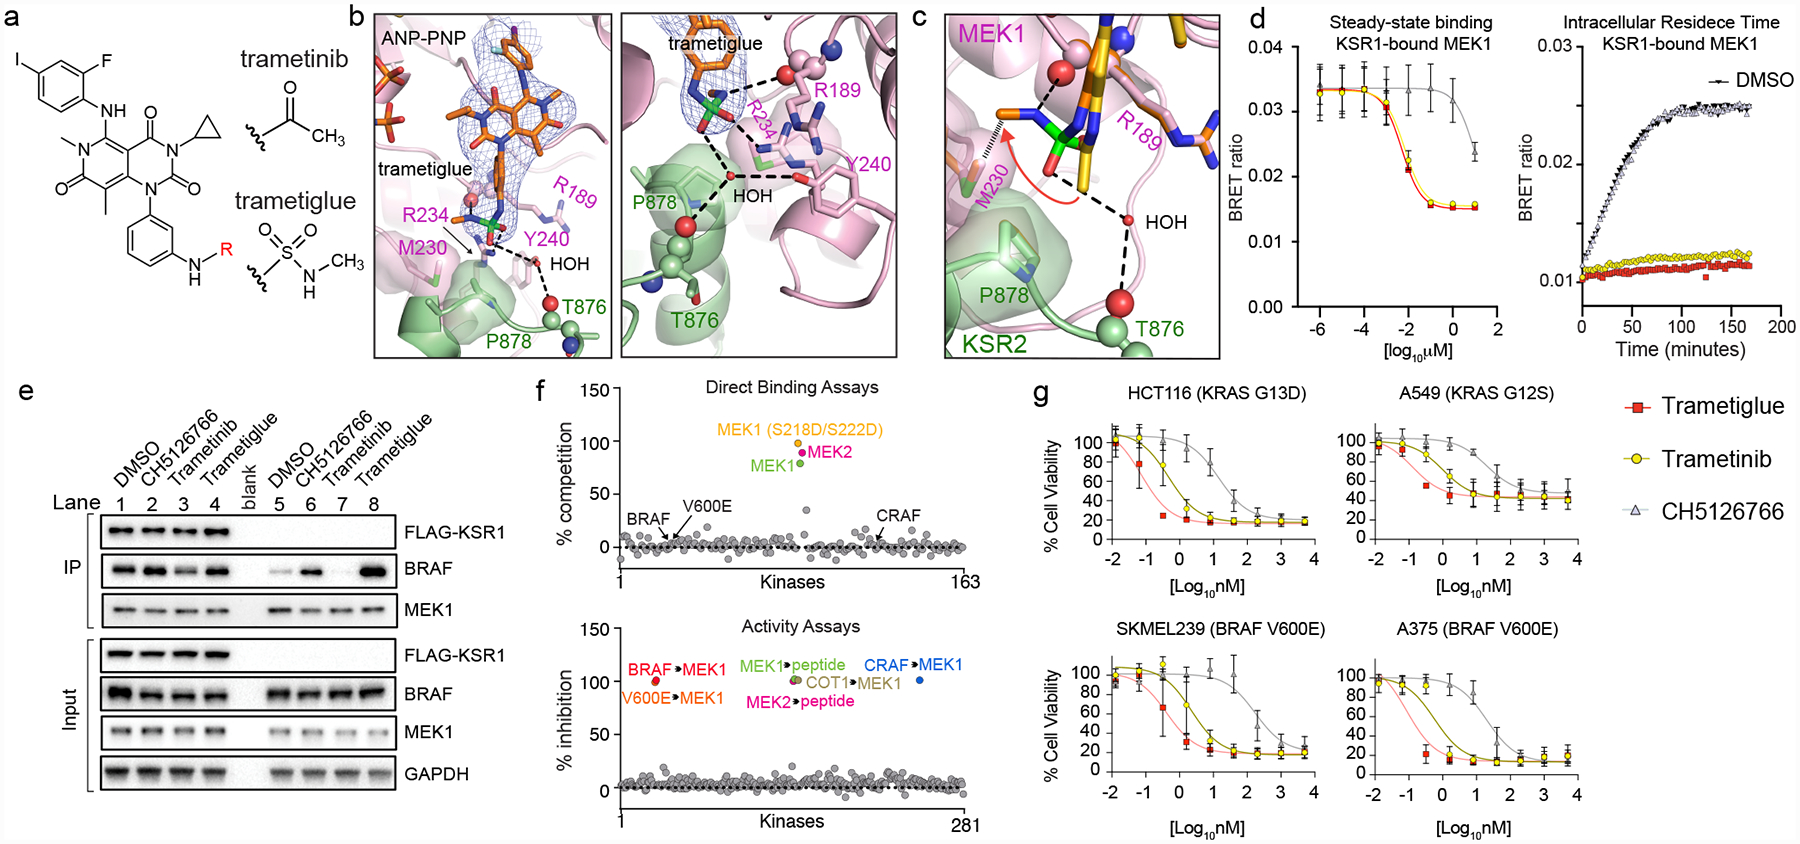
A. Chemical structures of trametinib and trametiglue.
B. X-ray crystal structure of trametiglue bound to KSR2:MEK1:AMP-PNP. Fo-Fc omit electron density map, contoured at 3.0 σ with a 2.0 Å cutoff around ligand. Left panel shows the entire inhibitor binding pocket; right panel highlights contacts around the sulfamide group of trametiglue.
C. Overlay of trametinib (yellow) and trametiglue (orange). The sulfamide group of trametiglue, relative to the acetamide in trametinib, generates unique contacts at the interfacial binding region of KSR-bound MEK. In particular, the -NHSO2NHCH3 module of trametiglue facilitates unique space-filling via M230 and the peptide backbone of R189 in MEK1 and a water-mediated H-bond towards the backbone of T876 in KSR2.
D. Trametiglue retains the strong binding potency and residence time of trametinib on KSR-bound MEK as determined under steady-state conditions (left) and intracellular residence (right panel; all compounds tested at 6.25 nM) formats. Each point and error bars represent the mean and SEM of three independent experiments. Data points for the intracellular residence time experiments represent the average of two technical replicates, each repeated three independent times. Additional data in Supplementary Figure 2.
E. Trametiglue, unlike trametinib but similar to CH5126766, enhances interactions between endogenous BRAF and MEK1. IP/WB of endogenous MEK1 from HCT116 cells. Lanes 1–4 are cells transfected with FLAG-KSR1, and lanes 5–8 are untransfected samples. Cells were treated with DMSO, 200 nM CH5126766, 200 nM trametinib, or 200 nM trametiglue for 1 hour prior to harvesting cells and IPs. Blots are representative of three independent experiments with similar results.
F. In vitro profiling of 1 μM trametiglue demonstrates high selectivity towards MEK1 and MEK2 in direct binding assays (top). Trametiglue also displays high selectivity in a panel of active kinases measured for inhibition of MEK1 and MEK2 substrate phosphorylation or direct MEK1 phosphorylation by the upstream kinases as indicated (bottom). See Source Data Fig. 4.
G. Cell viability dose-responses on K-RAS and BRAF mutant lines. Assays conducted under low-adherence conditions and representative of three independent experiments, each conducted in technical triplicate. Mean and standard deviations in Extended Data Figure 10B.
Trametiglue possesses a sulfamide group in place of the key acetamide moiety within trametinib. We focused on sulfamide based on (i) the use of this moiety as an acetamide bioisostere, (ii) the lack of previously-reported sulfamide-containing derivatives of trametinib, and (iii) our analysis of the MEK inhibitor CH5126766 suggested that an analogous motif may enable the unique trapping of RAF-bound MEK.
Co-crystal structures confirmed binding of trametiglue to KSR:MEK complexes, with the compound adopting an overall similar binding-orientation as trametinib (Figure 4B). However, by virtue of the sulfamide moiety, trametiglue both directly contacts R234 in MEK and reinforces a water-mediated contact to the backbone carbonyl of T876 in KSR2. Thus, trametiglue places two H-bond donors and acceptors in exchange of the acetamide of trametinib (Extended Data Figure 10C), thereby generating distinct trajectory and space-filling interactions at the interface of KSR-MEK (Figure 4C), and we speculate possibly also RAF-MEK.
In cellular target engagement assays using the KSR-luc or MEK-luc reporters, trametiglue retained similar potency and off-rate kinetics as trametinib (Figure 4D), suggesting that the alterations at the interfacial region revealed within our crystal structures of trametiglue did not significantly impact binding to the KSR-bound state of MEK. However, in co-immunoprecipitation assays via endogenous MEK, treatment with trametiglue, unlike trametinib, markedly enhanced capture of BRAF relative to untreated samples (Figure 4E; lanes 5 vs 8, BRAF blot). This effect of trametiglue in co-IP experiments was very similar to CH5126766 (Figure 4E; lanes 5 to 6), suggesting that trametiglue, much like CH5126766 but unlike trametinib, has an ability to favor binding of BRAF towards MEK. To further characterize trametiglue, we profiled the compound in conventional in vitro kinase assays. In binding experiments, trametiglue demonstrated strong selectivity towards MEK1/2, with no direct interactions towards isolated BRAF or CRAF (Figure 4F, top). However, in substrate phosphorylation assays, trametiglue not only inhibited MEK1 and MEK2, but also upstream kinases, including inhibition of both BRAF and CRAF phosphorylation of MEK1 as substrate (Figure 4F, bottom). This profile resembles the published in vitro kinome profile of CH512676625, supporting that trametiglue shares pharmacological properties with CH5126766.
To summarize, trametiglue combines the potency and off-rate kinetics of trametinib on KSR-bound MEK with the functional ability of CH5126766 to promote, and potentially trap, inactive states of RAF-bound MEK. To test the impact of combining two distinct MEKi activities into a single compound, we screened trametiglue across a series of KRAS- and BRAF- mutant cell lines. For example, under low-adherence conditions in the cell line HCT116, trametiglue produced an IC50 of 0.07 +/− 0.04 nM, which is a ~7-fold and ~200-fold improvement in potency relative to trametinib and CH5126766, respectively (Figure 4G). This increase in activity also translated to long-term clonogenic assays (Extended Data Figure 10E), with marked enhancements in phospho-ERK inhibition over both short and long term treatments (Extended Data Figure 10F,G). Together, our data suggest trametiglue, and the simultaneous targeting of both KSR- and RAF- bound MEK with a high-potency compound, as an effective strategy to mitigate adaptive resistance via feed-back upregulation of RAS-MAPK signaling.
Discussion
Our comparative analysis reveals trametinib as a ‘bumped’ MEKi with binding enabled through a conserved ‘hole’ found in KSR-family pseudokinases relative to the related RAF sub-family kinases. To our knowledge, the targeting of trametinib to the KSR-MEK complex is the first example of a natural bump and hole system whereby a drug-binding site is remodelled through overlapping binding partners. Given the prevalence of enzyme/pseudoenzyme pairs36, more opportunities to exploit natural bump and hole systems likely exist but have yet to be uncovered. Further, our studies highlight KSR as a critical missing piece in the mechanism of action for clinical MEK inhibitors. Targeting sub-populations of MEK with compounds that possess molecular glue-like features offers a new therapeutic path for selectively antagonizing RAS driven malignancies in patients. Indeed, the finding of trametiglue provides a framework to overcome limitations in currently available MEKi through the rational design of next-generation drugs targeting the interfacial binding region of important regulatory complexes in the MAPK cascade.
METHODS
Data reporting
No statistical methods were used to predetermine sample size. The experiments were not randomized, and the investigators were not blinded to allocation during experiments and outcome assessment.
Expression and purification of KSR:MEK1 and BRAF:MEK1 complexes.
Codon optimized versions of human KSR1 (residues 591–899; Uniprot ID:Q8IVT5), human KSR2 (residues 634–950; Uniprot ID: Q6VAB6), human BRAF (residues 432–726; Uniprot ID: P15056), and rabbit MEK1 (residues 35–393; Uniprot ID: P29678) were synthesized with N-terminal hexahistidine tags and TEV-cleavage site (HHHHHHENLYFQG). Each KSR:MEK1 pair, as well as BRAF:MEK1, was sub-cloned into the pFastBac Dual expression vector, with KSR1, KSR2, or BRAF under the influence of a late polyhedron (PH) promoter and MEK1 under an early p10 promoter. A mutant version of MEK1, Ser298Asn/Ser299Lys/Tyr300Phe was used based on a previous report that these mutations eliminate a degradation site and thereby increase protein yields19. For recombinant expression and purification of KSR1, KSR2, BRAF, or MEK1, it is understood that we refer to the fragments mentioned above. Similarly, all MEK1 proteins used for expression, purification, crystallization, and biochemical studies include the Ser298Asn/Ser299Lys/Tyr300Phe mutations. The pseudokinase domains of either human KSR1 or human KSR2, or the kinase domain of human BRAF, were co-expressed with rabbit MEK1 using the baculovirus expression system (Clontech). SF21 cells were infected with baculovirus expressing the KSR1:MEK1, KSR2:MEK1, or BRAF:MEK1 complex for 72 hours and harvested typically with a cell viability of ~50–60% and density of 3–4 ×10⁶ cells/mL. Cell pastes were lysed by freeze-thawing and sonication. Following, cobalt resin (Clontech) was used to capture protein complexes, and eluted proteins were subsequently dialyzed in 20 mM Tris pH 7.8, 200 mM NaCl, 10% glycerol, and 5 mM DTT. The dialyzed sample was further purified by ion exchange chromatography using HiPrep SP HP column (GE Healthcare) for the KSR2:MEK1 or BRAF:MEK1 complex, and a HiPrep Q HP column (GE Healthcare) for the KSR1:MEK1 complex. Dialysis retentates were diluted at least five-fold and then applied to the respective columns, and eluted with linear salt gradients (50 to 500 mM NaCl) used to isolate free MEK1, and the 1:1 KSR:MEK1 complexes. Following separation, fractions containing stoichiometric KSR1:MEK1, KSR2:MEK1, or BRAF:MEK1 were confirmed by gel electrophoresis and coomassie staining. Selected fractions were then pooled, and subsequently applied to a Hiprep Superdex 200 10/300 GL size exclusion column for final purification in a buffer consisting of 20 mM Tris pH 7.8, 150 mM NaCl, 5 mM DTT, 1 mM TCEP. Each of the KSR1:MEK1 complex, KSR2:MEK1, and BRAF:MEK1 complex eluted in two peaks, representing heterodimer (minor) and heterotetramer (major) species. Excess MEK1, which was purified separately over a Hiprep Superdex 200 10/300 GL size exclusion column eluted as a monomer. For crystallization, samples of the KSR1:MEK1 or KSR2:MEK1 complex were incubated overnight with trypsin (1:1000 ratio). These samples were then subsequently applied to a Hiprep Superdex 200 10/300 GL size exclusion column for final purification in the same buffer as described above. Trypsinized samples of both the KSR1:MEK1 complex and KSR2:MEK1 complex demonstrated similar elution profile as non-trypsinized samples, with heterotetramer as the major species. Typical yields were 0.2 mg of tetrameric complex from 50 grams of pellet for KSR1:MEK1 and 0.8 mg from 50 grams of pellet for KSR2:MEK1.
Crystallization and structure determination of inhibitor-bound KSR1/2:MEK1 complexes.
The tetrameric complex of both KSR1:MEK1 and KSR2:MEK1 were concentrated to 6–9 mg/ml and incubated with 5 mM AMP-PNP in a buffer supplemented with 10 mM MgCl2. After an incubation period of approximately 10 minutes, aggregates were removed through centrifugation at 14,000 g for 10 minutes. Following, the complexes were crystallized using the hanging drop method at 20 deg C in a 1:1 ratio of protein and crystallization buffer [12% PEG-3350, 100 mM MES pH 6.25, 200 mM Magnesium Acetate]. Hexagonal shaped crystals appeared within 24 hours, and these grew to the maximum size of approximately 200 microns within 48–72 hours. Initial crystals were then transferred to a fresh solution containing MEK inhibitors (Selleckchem: Trametinib-S2673, Cobimetinib-S8041, Selumetinib-S1008, and PD0325901-S1036). Finally, the MEKi soaked crystals were back soaked into a cryosolution of 25% ethylene glycol in mother liquor prior to flash-freezing in liquid nitrogen. X-ray diffraction data was collected at the Advanced Photon Source sector 21 (Argonne National Laboratory, IL), Advanced Light Source (Lawrence Berkeley National Laboratory, CA), or the National Synchrotron Light Source II (Brookhaven, NY). Diffraction images were indexed and scaled using XDS37, and structures were solved by molecular replacement using Phaser38 based on searches of KSR2 (chain B) and MEK1 (chain C) models derived from the KSR2(KD):MEK1:ATP crystal structure (PDB code: 2Y4I). Model building was performed with Coot39. The crystallographic information files (CIF) for all the ligands were generated using Phenix based Electronic Ligand Builder and Optimization Workbench (ELBOW), and were used subsequently in the refinement process40. Rigid body and maximum likelihood-based refinement protocols were implemented through Phenix with ligands omitted from early rounds of refinement41. All crystal structures were found to share similar unit cell dimensions, space group symmetry, and X-ray diffraction properties. Pymol Molecular Graphics System (Schrödinger) was used to generate images for all structural figures presented in the manuscript. Detailed data collection and refinement statistics are included in Supplementary Data Table 1. Electron density omit maps for ligands are included in Extended Data Figure 1A.
This research used resources of the Life Sciences Collaborative Access Team beamline (sector 21) of the Advanced Photon Source, a U.S. Department of Energy (DOE) Office of Science User Facility operated for the DOE Office of Science by Argonne National Laboratory under Contract No. DE-AC02–06CH11357. Use of the LS-CAT Sector 21 was supported by the Michigan Economic Development Corporation and the Michigan Technology Tri-Corridor (Grant 085P1000817). Also, this research used resources of the National Synchrotron Light Source beamline (17-ID-1&2), a U.S. Department of Energy (DOE) Office of Science User Facility operated for the DOE Office of Science by Brookhaven National Laboratory under Contract No. DE-AC02–98CH10886. Also, this research used resources from Beamline 8.2.2 of the Advanced Light Source, a U.S. DOE Office of Science User Facility under Contract No. DE-AC02–05CH11231, which is supported in part by the ALS-ENABLE program funded by the National Institutes of Health, National Institute of General Medical Sciences, grant P30 GM124169–01.
Modeling of Trametinib onto Isolated MEK and Distance Calculations.
Docking of trametinib onto the previously determined structures of isolated MEK was performed through structural overlays using the coordinates derived from our experimental structures of KSR2:MEK1 in complex with trametinib. This analysis suggests that either the activation segment of isolated MEK or the compound must undergo significant rearrangements so as to enable drug binding (Supplementary Figure 3). Distances in Figure 2A were measured with hydrogens included in the ligand and KSR1 and were found to measure 2.4 Å and 3.5 Å between alpha and beta hydrogens of A825 and the terminal -CH3 of trametinib. In comparison, PD0325901, selumetinib, and cobimetinib are at the closest distance of ~10 Å, 9 Å, and 6 Å, respectively, within the KSR1:MEK1 complex.
Binding analysis as measured by bio-layer interferometry (BLI).
BLI measurements were performed using an Octet Red96 (Forte Bio, Inc.) system. All experiments were conducted at 25 °C with shaking at 1000 rpm, and in a buffer containing 20 mM Hepes pH 7.5, 200 mM NaCl, 1 mM ATP, 5 mM MgCl2, 0.02% Tween-20, 1% DMSO. In the first step, biotin-linked trametinib was loaded onto a streptavidin (SA; Product number 18–5019 ForteBio) Dip-and-Read sensor head to saturation. This amount of immobilization typically achieved 1.5–2.0 nm binding signal. Biosensors were then washed in buffer, treated in a solution of biocytin for 3 min, and then again washed extensively to achieve a normalized baseline signal of ~0 nm. Following, for kinetic analysis, biosensors were dipped in solutions of free MEK1, BRAF:MEK1, KSR1:MEK1, or KSR2:MEK1. Association was measured for 10 or 15 minutes, following a dissociation phase in buffer of 15 minutes. Blank sensors and buffer only data, which displayed no discernible binding, were included as controls (Extended Data Figure 8D,E). Varying the load of biotin-linked trametinib did not influence binding kinetics discernibly and therefore all experiments were conducted with 1000 nM biotin linked trametinib immobilized to saturation (Source Data Extended Data Fig. 8, sheet 4). All experiments were performed at least three independent times, with raw data processed and analyzed using global fit binding models in Fortebio software to derive KD (M), Kon (1/M·s), and Kdis (1/s) values. Drug target lifetimes (τ) were determined as the reciprocal of Kdis; titration analysis suggested dissociation of the KSR1:MEK1 and KSR2:MEK1 complexes below 500 nM (Extended Data Figure 8C) and therefore only binding data at 500 nM or above was used to determine τ (min) for KSR1:MEK1 and KSR2:MEK1. τ (min) for MEK1 and BRAF:MEK1 was also determined from binding data with protein at a concentration of 500 nM or greater. One-to-one binding models provided a high agreement with the measured binding signals based on chi-squared and R-squared values. Raw data and fitting, mean and standard deviation determinations, as well as statistical analysis, for KD, kon(1/M·s), kdis(1/s), and τ (min) are included in Source Data Extended Data Fig. 8.
Cell culture and antibodies.
HCT116, A549, and A375 cells were acquired from American Type Culture Collection. SKMEL-239 cells were generously provided by the Emily Bernstein laboratory (Mount Sinai) via Memorial Sloan Kettering Cancer Center. HCT-116, A549, and A375 cells were maintained in DMEM supplemented with 10% fetal bovine serum and penicillin/streptomycin. SKMEL-239 cells were cultured in RPMI supplemented with 10% fetal bovine serum and penicillin/streptomycin. Antibodies detecting MEK1/2 (Product number: 4694S) at 45 kDa, ERK1/2 (Product number: 4695S) at 42/44 kDa, phospho-ERK1/2 (T202/Y204; Product number: 9101S) at 42/44 kDa and GAPDH (Product number: 2118S) at 37 kDa were obtained from Cell Signaling Technology. Antibodies detecting BRAF (Product number: sc-5284) at 85 kDa and FLAG (Product number: F1804) were purchased from Santa Cruz Biotechnology and Sigma-Aldrich, respectively. FLAG-tagged BRAF was detected at 85 kDa, and FLAG-tagged KSR was detected at 97 kDa. For antibody detection, blots were incubated at 4 °C overnight in primary antibodies in 5% BSA in Tris-buffered saline 0.1% Tween 20 detergent (TBST) at the following dilutions: MEK1/2 (1:5,000), GAPDH (1:10,000), BRAF (1:200), FLAG (1:5000), ERK1/2 (1:1000), phospho-ERK 1/2 (1:1000). The next day, blots were washed five times with TBS-T and probed for 1 hour with anti-mouse-HRP (Product number: 7076S) or anti-rabbit-HRP (Product number: 7074P2) antibodies from Cell Signaling in 5% BSA TBST at a dilution of 1:5,000. Endogenous MEK1 was immunoprecipitated (IP) with a MEK1 specific antibody from Millipore-Sigma (Product number: 07–641). Normal rabbit IgG (Product number: 12–370) also acquired from Millipore-Sigma was used as an IP control antibody at final concentrations of 1 μg antibody per 50 μg input sample lysate. Precision Plus Protein Dual Color Standard from Bio-Rad (Product number: 1610375) was used as a reference ladder to confirm band sizes as shown in the uncropped blots included in Supplementary Figure 1.
Plasmids and Transfections.
Full-length mouse KSR1-FLAG (Addgene ID: 25970) plasmid was acquired from Addgene, and full-length human BRAF-FLAG plasmid was generously provided by the Poulikos Poulikakos laboratory (Mount Sinai). Mutant KSR1 and BRAF constructs were generated using the QuikChange Site-Directed Mutagenesis Kit from Agilent Technologies. To normalize protein expression levels across KSR1-FLAG and BRAF-FLAG constructs for experiments shown in Figure 3C and D, the following masses of plasmids were transfected into HCT116 cells: KSR1(WT) – 2.3 μg, KSR1 mutant K1 (P775N) - 12 μg, KSR1 mutant K2 (A776R) – 8 μg, KSR1 mutant K3 (P775N/A776R) – 15 μg, KSR1 mutant K4 (-InsN/P775N/A776R) - 15 μg, KSR1(R615H)-12 μg, BRAF(WT) – 10 μg, BRAF mutant B1 (N661A) – 10 μg, BRAF mutant B2 (R662A) – 3.5 μg, BRAF mutant B3 (N661A/R662A) – 5 μg, BRAF mutant B4 (delN/N661A/R662A) – 5 μg. DNA transfections were performed using Lipofectamine 3000 (Invitrogen) according to the manufacturer’s instructions with a ratio of P3000 enhancer reagent: L3000 transfection reagent of 6:3.75.
Immunoprecipitation of MEK1 associated complexes from cancer cell lines.
Immunoprecipitation (IP) experiments (as shown in Figures 3C, 3D, and 4E) were performed by plating 450K HCT-116 cells per well in 6-well plates. Cells were plated for 48 hours so as to reach ~ 70% confluency prior to transfection. Following 24 hours post-transfection, cells were treated with vehicle (0.1 % DMSO) or trametinib (200 nM) for 1 hour. Cells were then washed two times in cold PBS and then transferred to a pre-chilled tube in 0.6 mL of PBS solution. Cells were spun at 1,800 × g in a cold centrifuge for 10 minutes, and supernatant was aspirated. To lyse cells, pellets were resuspended in NP-40 buffer (50 mM Tris pH 7.8, 100 mM NaCl, 0.5% [v/v] NP-40, 10% [v/v] glycerol, 1 mM EDTA) supplemented with Protease and Phosphatase Inhibitor Cocktail (Thermo Fisher, product number 78440) and incubated on ice for 30 minutes. Lysates were centrifuged for 20 minutes at 2,100 × g, and supernatants were collected. Cleared lysates were quantified using BCA reagent (Pierce, 23225), with BSA as a standard. 5 μg of rabbit anti-MEK1 antibody (07–641 from Millipore-Sigma), or rabbit IgG (12–370 from Millipore Sigma), was immobilized on 50 μL of Sepharose Protein A Resin (Thermo Fisher, 53139) and washed three times in 300 μL NP-40 buffer prior to initiating IPs. Following, for MEK1 immunoprecipitation, 250 μg of total cell lysate in a total volume of 0.6 mL was mixed with the pre-immobilized anti-MEK1 antibody pre-conjugated to Protein A Resin. Samples were incubated at 4° C on an end-over-end rotator for 4 hours, followed by three washes in 0.6 ml volume of NP-40 buffer. Following, proteins were denatured and released from resin by the addition of 80 μl volume of 1x SDS sample buffer. Samples were boiled at 90 degrees Celsius for two minutes, spun, and then applied to a 4–12% bis-tris glycine gel (Bio-Rad, 3450125) run in MOPS-SDS buffer (Thermo Fisher, NP0001) for 60 minutes at 150 volts. After, gels were transferred onto nitrocellulose in 20 % methanol in tris-glycine buffer (95 volts, 250 amps). Transfers were confirmed using Ponceau red and then analysed by Western blot. Signals for MEK, FLAG-tagged proteins, BRAF, and GAPDH were detected by enhanced chemiluminescence on a ChemDoc XRS+ imaging system (Biorad).
Cell Proliferation Assays.
A375, A549, HCT116, and SKMEL-239 cells were plated in Corning Costar Ultra-Low Attachment 96-well plates (Reference number 3434). After 24 hours of incubation at 37 °C, cells were treated with inhibitors (0.1% DMSO in final volume). Cells were grown for five days, and resazurin sodium salt was added at a final concentration of 0.01 μg/μL. Fluorescence was measured using a Molecular Devices SpectraMax M5 spectrophotometer after a 4–24-hour incubation with resazurin solution. Technical triplicate values were averaged for each experiment, and biological replicate values are represented as average +/− standard deviation. For each cell line, logEC50 values of inhibitors were statistically compared using the extra sum-of-squares F test in GraphPad Prism 8 (Source Data Extended Data Fig. 10).
Clonogenic Assays.
Cells were plated at a density of 6 thousand cells per well in 6-well plates in 3 mL of culture medium. 24 hours after seeding, compounds dissolved in DMSO or DMSO-only vehicles were added directly to the culture media at a 1:1000 dilution. Following 10 days of culture, cells were washed 2x in PBS, fixed in ice-cold methanol for 10 minutes, stained with crystal-violet at room temperature for 10 minutes, and subsequently washed three times in water. Plates were allowed to dry overnight before imagining with an Epson V600 scanner.
Time Course Experiments to Assess RAS/ERK pathway inhibition by immunoblot.
Cells were plated at a density of 300,000 cells per well in 6-well plates in 2 mL of culture medium. 24 hours after seeding, cells were treated with compounds or DMSO at a 1:1000 dilution (0.1% DMSO in final volume). At harvest, media from cells was first aspirated and washed 2x in ice-cold PBS, and either lysed directly in wells using RIPA buffer or transferred to a pre-chilled tube in 0.5 mL ice-cold PBS, centrifuged for 10 minutes at 1,800 × g, then lysed in 120 μl of Pierce RIPA buffer (PI89901) supplemented with protease and phosphatase inhibitor cocktail (Thermo Fisher, product number 78440). Cleared lysates were quantified using BCA reagent (Pierce, 23225) or DC Protein Assay (Bio-Rad 5000111) with BSA as a standard. Samples were normalized to a protein content of 5 μg/μL in 100 μL total volume, and 20 μL of 6x SDS was added. Samples were boiled at 90 degrees Celsius for two minutes, spun, and then applied to either 4–12% or 4–15% bis-tris glycine gels (Bio-Rad, 3450125) run in MOPS-SDS buffer (Thermo Fisher, NP0001) for 60 minutes at 150 volts. After, gels were transferred onto nitrocellulose in 20 % methanol in tris-glycine buffer (95 volts, 250 amps). Transfers were confirmed using ponceau red, washed, and then blocked for 1 hour with 5% BSA TBS-T, prior to overnight incubation with primary antibodies including phospho-ERK1/2 T202/Y204 and total ERK1/2 (Cell Signaling Technologies (CST) 9101S and 4695S, respectively) in 5% BSA TBS-T. The next day, blots were washed extensively, and incubated in secondary antibody (Anti-Rabbit IgG HRP-Linked CST 7074S). Signals for phospho-ERK1/2, total ERK and/or GAPDH were detected by enhanced chemiluminescence on a ChemDoc XRS+ imaging system (Biorad).
Generation of stable shRNA HCT-116 knockdown lines
Scramble control shRNA (CCTAAGGTTAAGTCGCCCTCGCTCGAGCGAGGGCGACTTAACCTTA GG; TRCN000000622) and KSR1-shRNA (CCGGGCCTCCTTATTGCAGAAAGTTCTCGAGAACTT TCTGCAATAAGGAGGCTTTTT; Addgene:1864) constructs were packaged into lentivirus in HEK293T cells using the Lipofectamine 3000 transfection reagent (Thermofisher L3000001) and 10 μg of vector, 1.5 μg of VSV-G, and 5 μg of delta8.9, and incubated for 48 hours before supernatant collection. Virus-containing supernatant was then concentrated using Lenti-X Concentrator (Takara 631231) and quantified via Lenti-X GoStix Plus (Takara 631280). HCT-116 parental cells were spin-infected with concentrated virus at a MOI of 6 in media supplemented with polybrene (6ug/mL). After 2 days, cells were selected for stable knockdown of KSR1 using puromycin (2ug/mL). After a further 4–6 days, cells were passaged for experimentation.
RNA Preparation, cDNA Preparation, and Quantitative PCR Analysis
Total RNA was extracted with Trizol (Invitrogen 15596026) and purified using the RNeasy Mini Kit (Qiagen). cDNA was generated using the Superscript IV First-Strand Synthesis System (Invitrogen 18091050) according to the manufacturer’s instructions. Quantitative RT-PCR was performed with gene-specific primers, using the Power SYBR-Green Master Mix (Applied Biosystems). For measurement of KSR1 mRNA by RT-qPCR, primers (Forward - AGTTTCTCCAG CATGTCCATC, Reverse - GAATGAAGCGTGTCCTGACT) specific to the KSR1 mRNA were utilized, and 18S rRNA (Forward - ACCCGTTGAACCCCATTCGTGA, Reverse - GCCTCACTAAACCATCCAATCGG) was used as a reference gene.
Intracellular target engagement assays via NanoBRET
In-cell IC50 measurements to determine steady-state binding of MEKi
Measurements of IC50 values for MEKi (ie. trametinib analogs and clinical compounds) were carried out according to the protocol provided by Promega for the in-cell kinase assay, and as previously reported24, with some modifications. Briefly, HEK293T cells were transfected with either human MEK1-Nanoluc (Uniprot Q02750), mouse KSR1-Nanoluc (wild-type Uniprot Q61097), mouse KSR1-NanoLuc (W781D; Uniprot Q61097), Src-NanoLuc (Uniprot P12931), and RET-NanoLuc (Uniprot 07949) constructs at a concentration of 1 μg/mL in combination with 9 μg/mL of carrier DNA (part of the Promega kit) at a density of 200,000 cells/mL and Fugene HD. RET and Src constructs were obtained from Promega. For co-transfections (1:1), each construct was used at a concentration of 1 μg/mL in combination with 8 μg/mL of carrier DNA. Transfected cells were incubated overnight at 37 °C. Cells were then trypsinized and plated into white low adherence 96 well plates (Corning-3990) in Opti-MEM (Gibco-31985–070) at a density of 20,000 cells/well. All compounds (Selleckchem: Trametinib-S2673, Cobimetinib-S8041, Selumetinib-S1008, PD0325901-S1036, CH5126766-S7170 and Trametiglue) were first dissolved in DMSO as concentrated stocks (10 mM), then further diluted in a transfer plate using Opti-MEM to a 10x concentration relative to final dose levels as indicated in each experiment; final concentrations for dose responses ranged from 10 μM down to 1 pM, in 10-fold dilutions. Following the addition of the compounds to cells, a 20x tram-bo solution (final concentration of 1 μM) in a mixture of DMSO/Tracer dilution buffer (Promega) was added to each well and the plate was incubated at 37 °C for 2 hrs. Alternatively, K4 and K5 tracers were used as positive controls for BRET with SRC-Nanoluc and RET-Nanoluc, respectively. The order of addition for all experiments was drug/compound first, followed by tracer, which was very important to produce dose response curves that gave robust BRET ratio separation between the highest and lowest doses tested. To generate dose response curves, a 33.3x solution of NanoLuc inhibitor and Nano-Glo substrate in Opti-MEM was added to each well, and plates were read on a GloMax plate reader using the standard protocol on the GloMax software for BRET assays. All data were analyzed in Prism 8 (GraphPad).
Washout experiments to determine intracellular residence time of MEKi
Given the potency of the analysed MEKi, we could not accurately distinguish residence time on MEK1-luc and KSR1-luc under typical saturating assay conditions (ie. 15x IC50; Supplementary Figure 2, page 8 compares wash versus no-wash pretreatment). Therefore, washout assays were conducted with pre-incubation of MEKi at 50, 25, 12.5 and 6.25 nM, or as otherwise noted, prior to cell washing and addition of tram-bo. Specifically, transfections of MEK1-luc and KSR1-luc, and construction of the drug transfer plates were carried out as mentioned above. For washout experiments, cells were first removed from adherent plates by trypsin treatment. Following, cells were harvested, spun, and resuspended in Opti-MEM (270 μL total) in centrifuge tubes at 450,000 cells/tube. 30 μL of drug solutions were then added to final indicated concentrations to give 300 μL total volume; then tubes were incubated at 37 °C for 2 hours, spun down at 1200 × g for 5 min, aspirated of supernatant, resuspended in Opti-MEM, and plated into white low adherence 96 well plates at a density of 150,000 cells/well. A 20x solution of tram-bo was added to the plate (final concentration of 1 μM), followed immediately by the addition of a 33.3x solution of NanoLuc inhibitor and Nano-Glo substrate in Opti-MEM. Plates were then read on a GloMax plate reader for 175 minutes using 75 reads each with 0.3s/well integration time.
RAF family Tram-bo buildup curves
Human c-terminal NanoLuc fusions versions of ARAF (Uniprot P10398), BRAF (UniProt P15056), CRAF (Uniprot P04049), KSR1 (Uniprot Q8IVT5), and KSR2 (Uniprot Q6VAB6) were transfected as mentioned above at a concentration of 0.1 μg/mL in combination with 9.9 μg/mL of carrier DNA. All RAF constructs from Promega. Following incubation at 37 °C overnight, cells were trypsinized and plated into white low adherence 96 well plates in Opti-MEM at a density of 20,000 cells/well. A 20x tram-bo solution was added to each well to give final concentrations of 4, 1, 0.5, 0.1, 0.05, 0.01, 0.001, 0.0001 μM. The plate was incubated for 2 hrs at 37 °C, and buildup curves were generated using the standard GloMax protocol upon the addition of a 33.3x solution of NanoLuc inhibitor and Nano-Glo substrate in Opti-MEM. All data were analyzed using Prism 8 (GraphPad).
Synthesis of trametiglue, tram-bo, and biotin-linked trametinib.
See Supplementary Information for synthetic schemes, procedures, and characterization data.
Reporting summary:
Further information on research design is available in the Nature Research Reporting Summary.
Extended Data
Extended Data Figure 1: Summary of ligand bound complexes of KSR1:MEK1 and KSR2:MEK1.
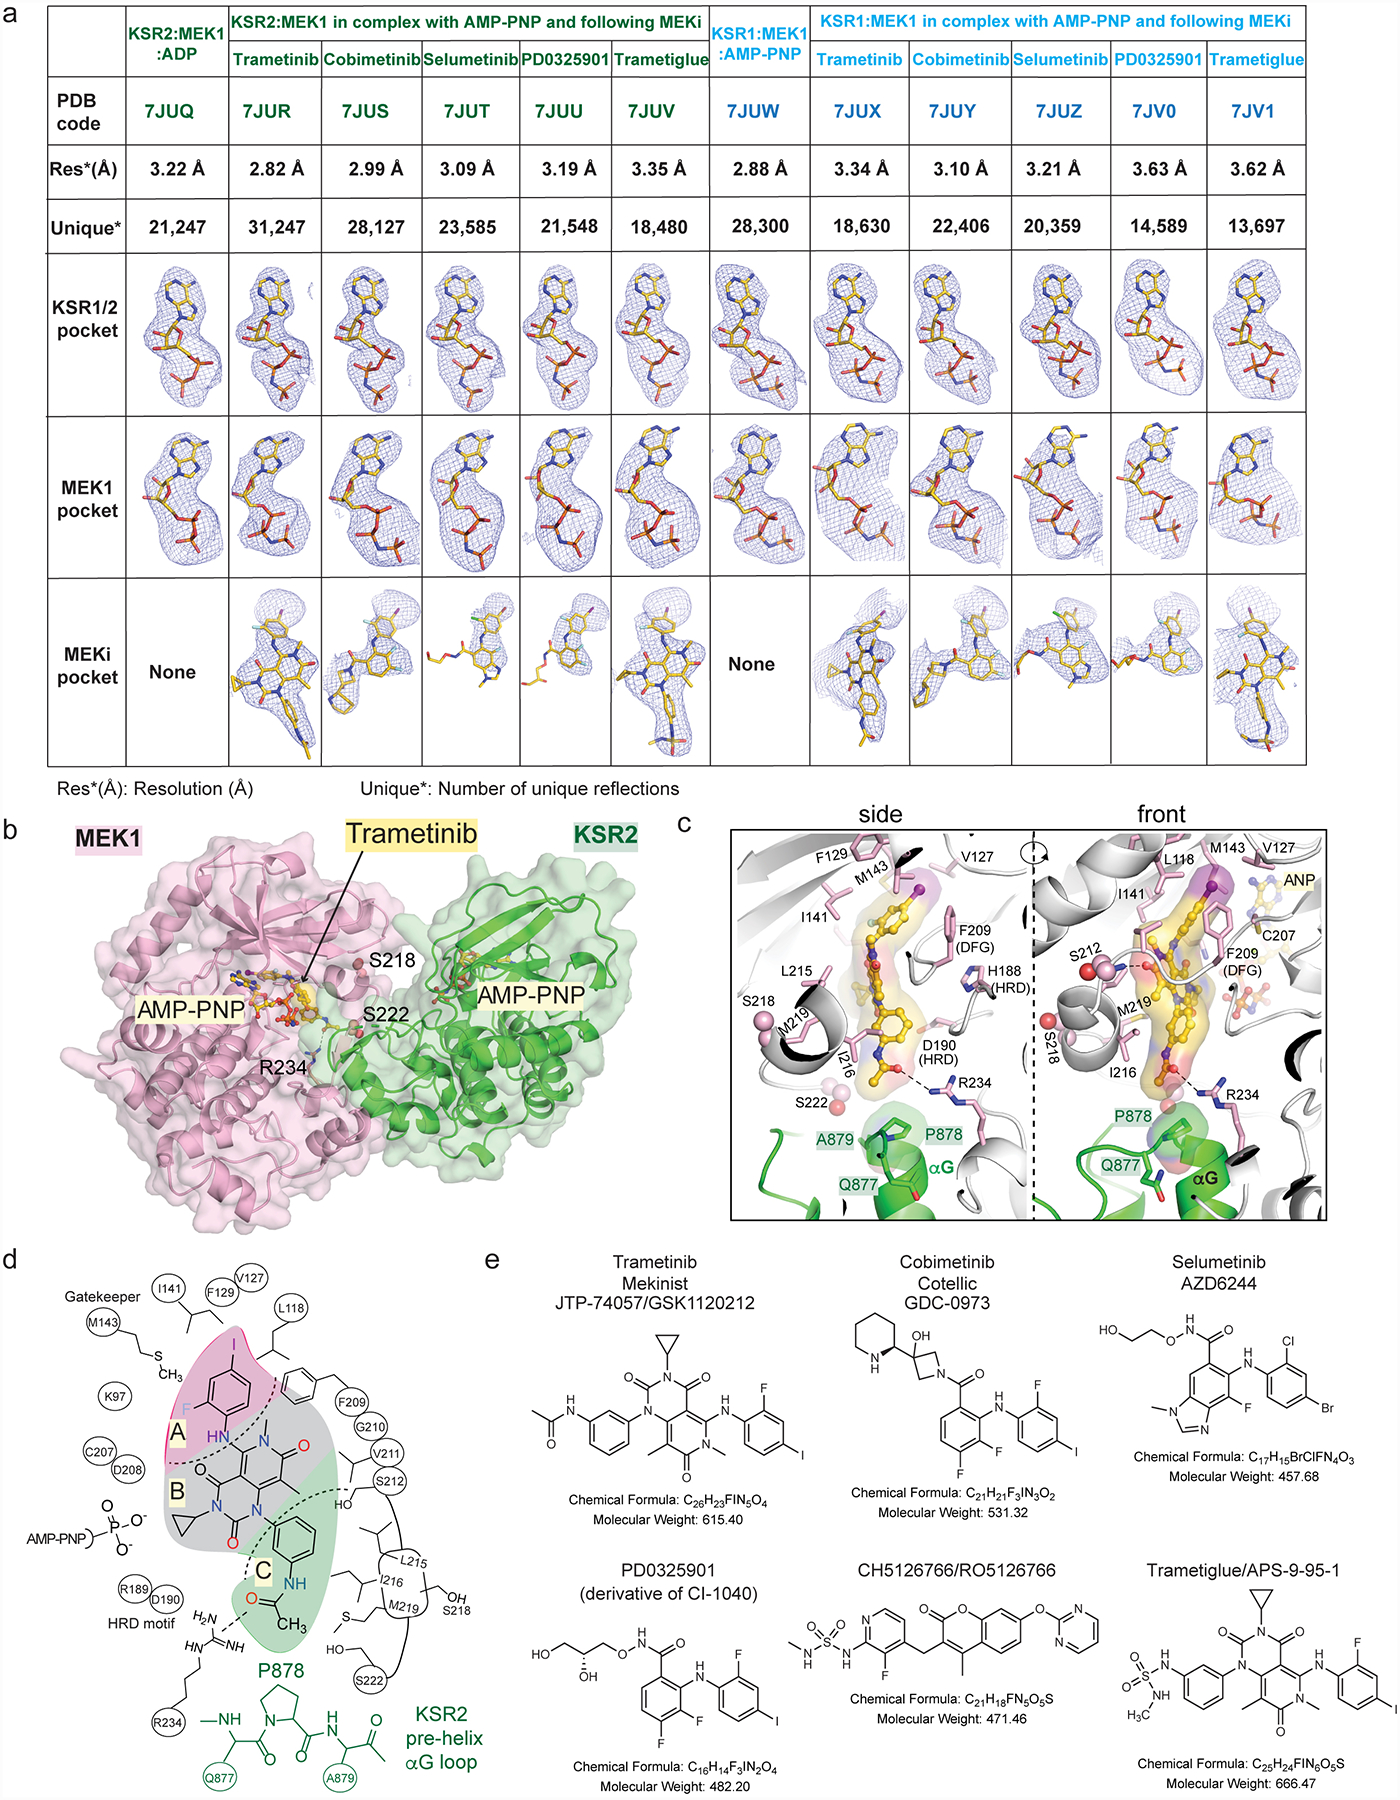
A. Resolution, number of reflections, and ligand omit maps for all described structures. Detailed data collection and refinement statistics are provided in Supplemental Data Table 1. Fo-Fc omit electron density maps are all contoured at 3.0 σ, with a 2.0 Å cutoff, around the ligands and shown as a blue mesh.
B. Trametinib bound to KSR2:MEK1:AMP-PNP.
C. Trametinib contacts include P878 in the pre-helix aG loop of KSR2. Direct contacts of trametinib with MEK1 also highlighted.
D. 2D schematic of the trametinib binding pocket in KSR2:MEK1.
E. 2D structures, formulas, and molecular weights of MEK inhibitors (MEKi) used in this study.
Extended Data Figure 2: Conformational changes in MEK and KSR upon binding to trametinib.
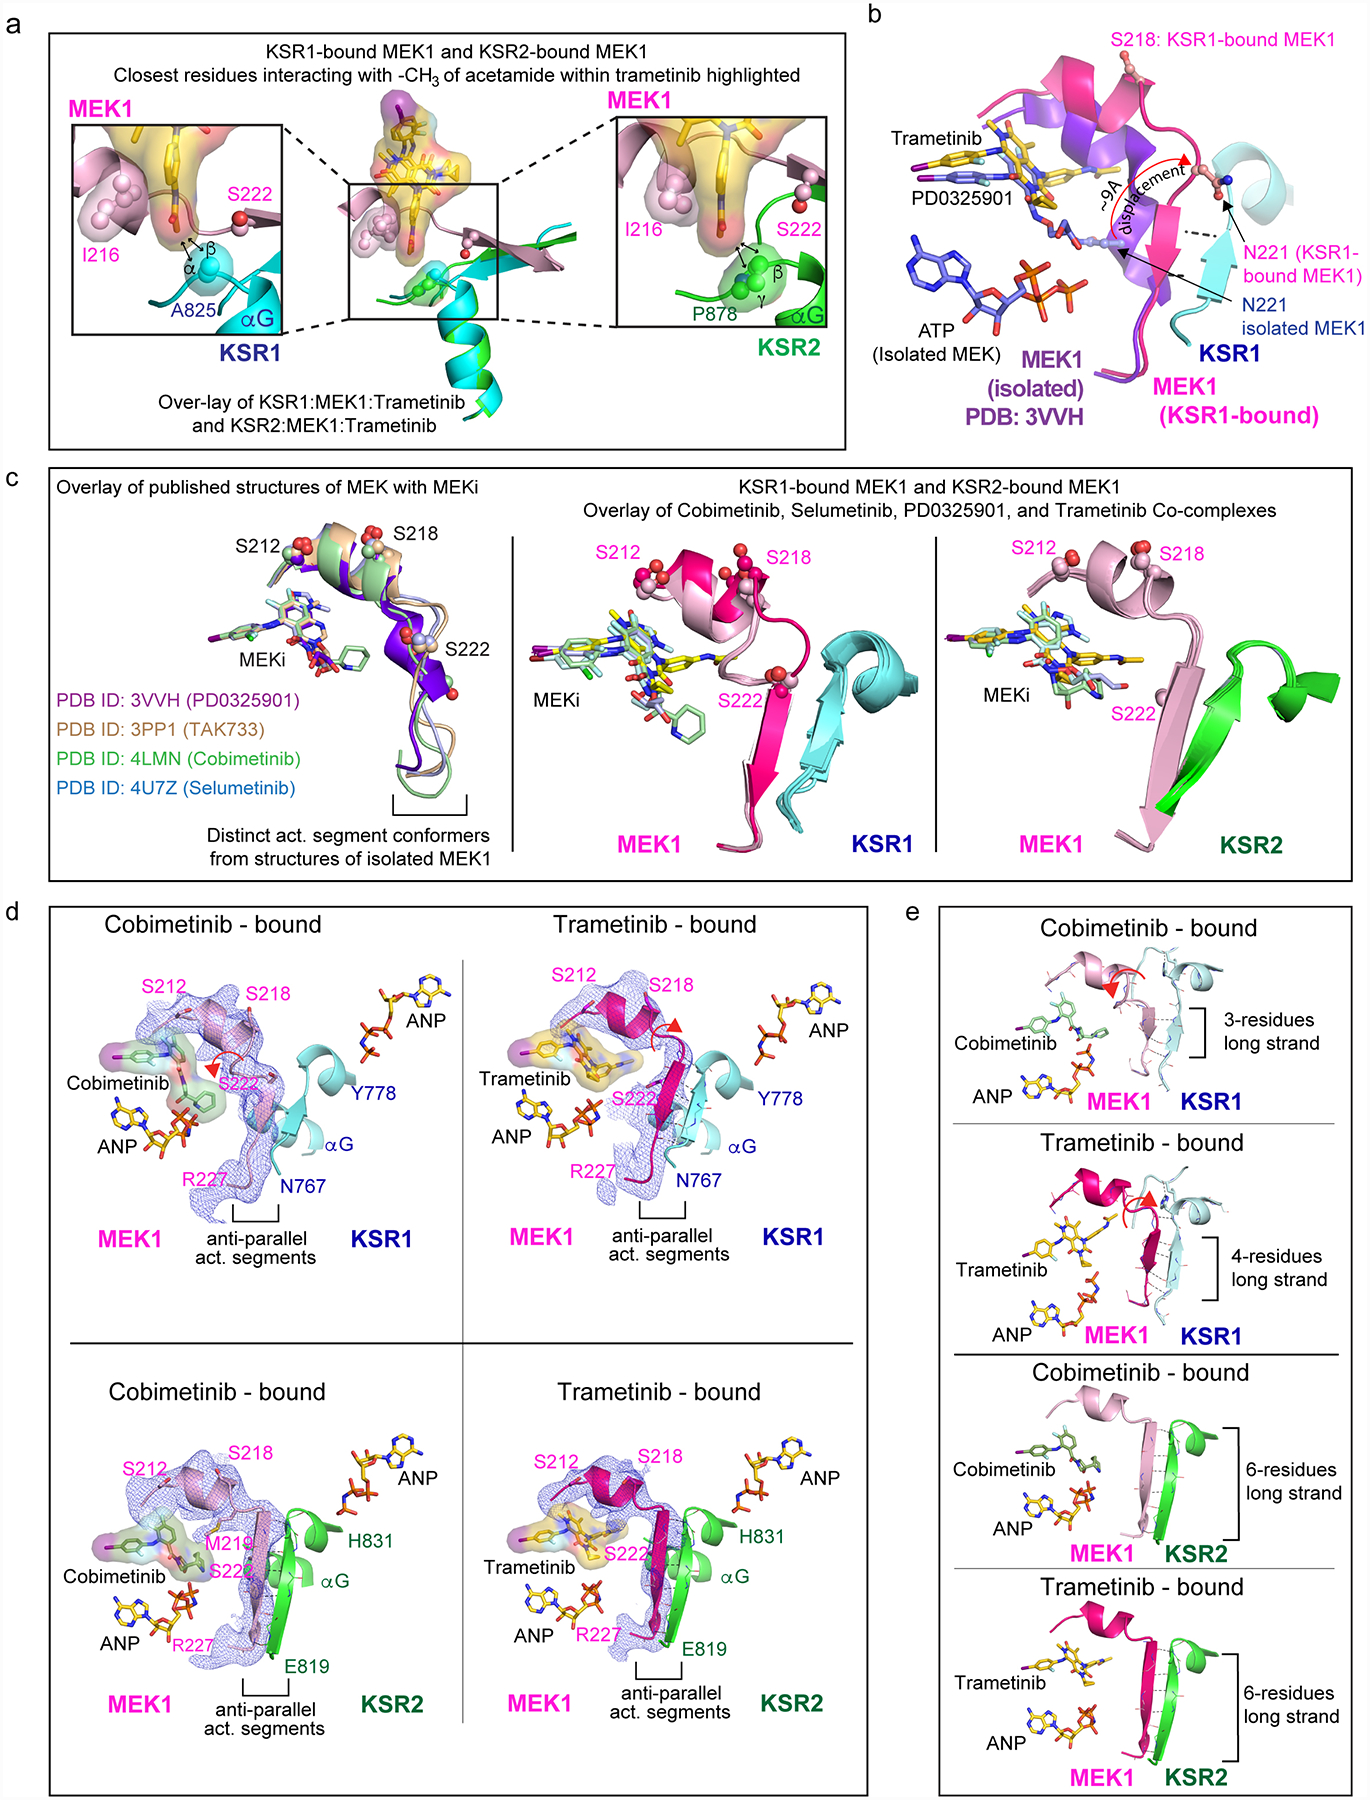
A. Close-up view of the trametinib interactions with KSR1 (left) and KSR2 (right). The terminal acetamide group of trametinib stacks between I216 in MEK1 and A825 in KSR1 or P878 in KSR2. Distances with hydrogens included in the models of trametinib and KSR measure 2.4 Å and 3.5 Å between alpha and beta hydrogens of A825 in KSR1 and the terminal -CH3 of trametinib. In comparison, the terminal -CH3 of trametinib measures 2.2 Å and 3.1 Å from beta and gamma hydrogens of P878. Measurements are marked by black arrows. Ser222 at one end of the anti-parallel activation segments between MEK and KSR is highlighted.
B. The MEKi allosteric pocket, and activation segment displacement, between the isolated state of MEK1 bound to PD0325901 relative to the KSR1:MEK1 complex bound to trametinib. The displacement in the activation segment was measured based on movement of residue Asn221 in the isolated and KSR1-bound state of MEK1.
C. Left: distinct activation loop conformers of isolated MEK1 have been observed in complex with PD0325901 (purple; PDB ID 3VVH), TAK733 (light brown; 3PP1), selumetinib (light blue; 4U7Z), and cobimetinib (light green; 4LMN). Middle and Right: overlay of the KSR1:MEK1 and KSR2:MEK1 structures bound to the indicated MEKi reveal near identical activation segment conformers, with the exception of the trametinib-bound complex of KSR1:MEK1.
D. Comparison of activation loop conformations in cobimetinib-bound (left) and trametinib-bound (right) states of the KSR1:MEK1 (top) and KSR2:MEK1 (bottom) complexes. Fo-Fc omit electron density map, contoured at 2.0 σ, with a 3.0 Å cutoff, around the activation loop is shown as a blue mesh. Movement of the MEK activation loop between the two inhibitor-bound states of KSR1:MEK1 is highlighted by a red arrow. Main chain H-bonds between the anti-parallel beta strands in KSR and MEK are shown as dotted lines.
E. In the trametinib bound KSR1:MEK1 complex, a four-residue anti-parallel beta strand structure is formed between KSR1 and MEK1. In comparison, the same region forms a three-residue stretch in all other KSR1:MEK1 structures that we determined; the cobimetinib-bound complex is shown as an example for comparison. In contrast, a six-residue long anti-parallel beta strand is formed in the KSR2:MEK1 structures, irrespective of bound MEKi. The three- and four- residue long strands in KSR1:MEK1 include residues 769–771/772 for KSR1 and 222/223–225 for MEK1. The six residue long strands in KSR2:MEK1 include residues 820–825 for KSR2 and 221–226 for MEK1.
Extended Data Figure 3: Structural differences between human KSR1 and KSR2.
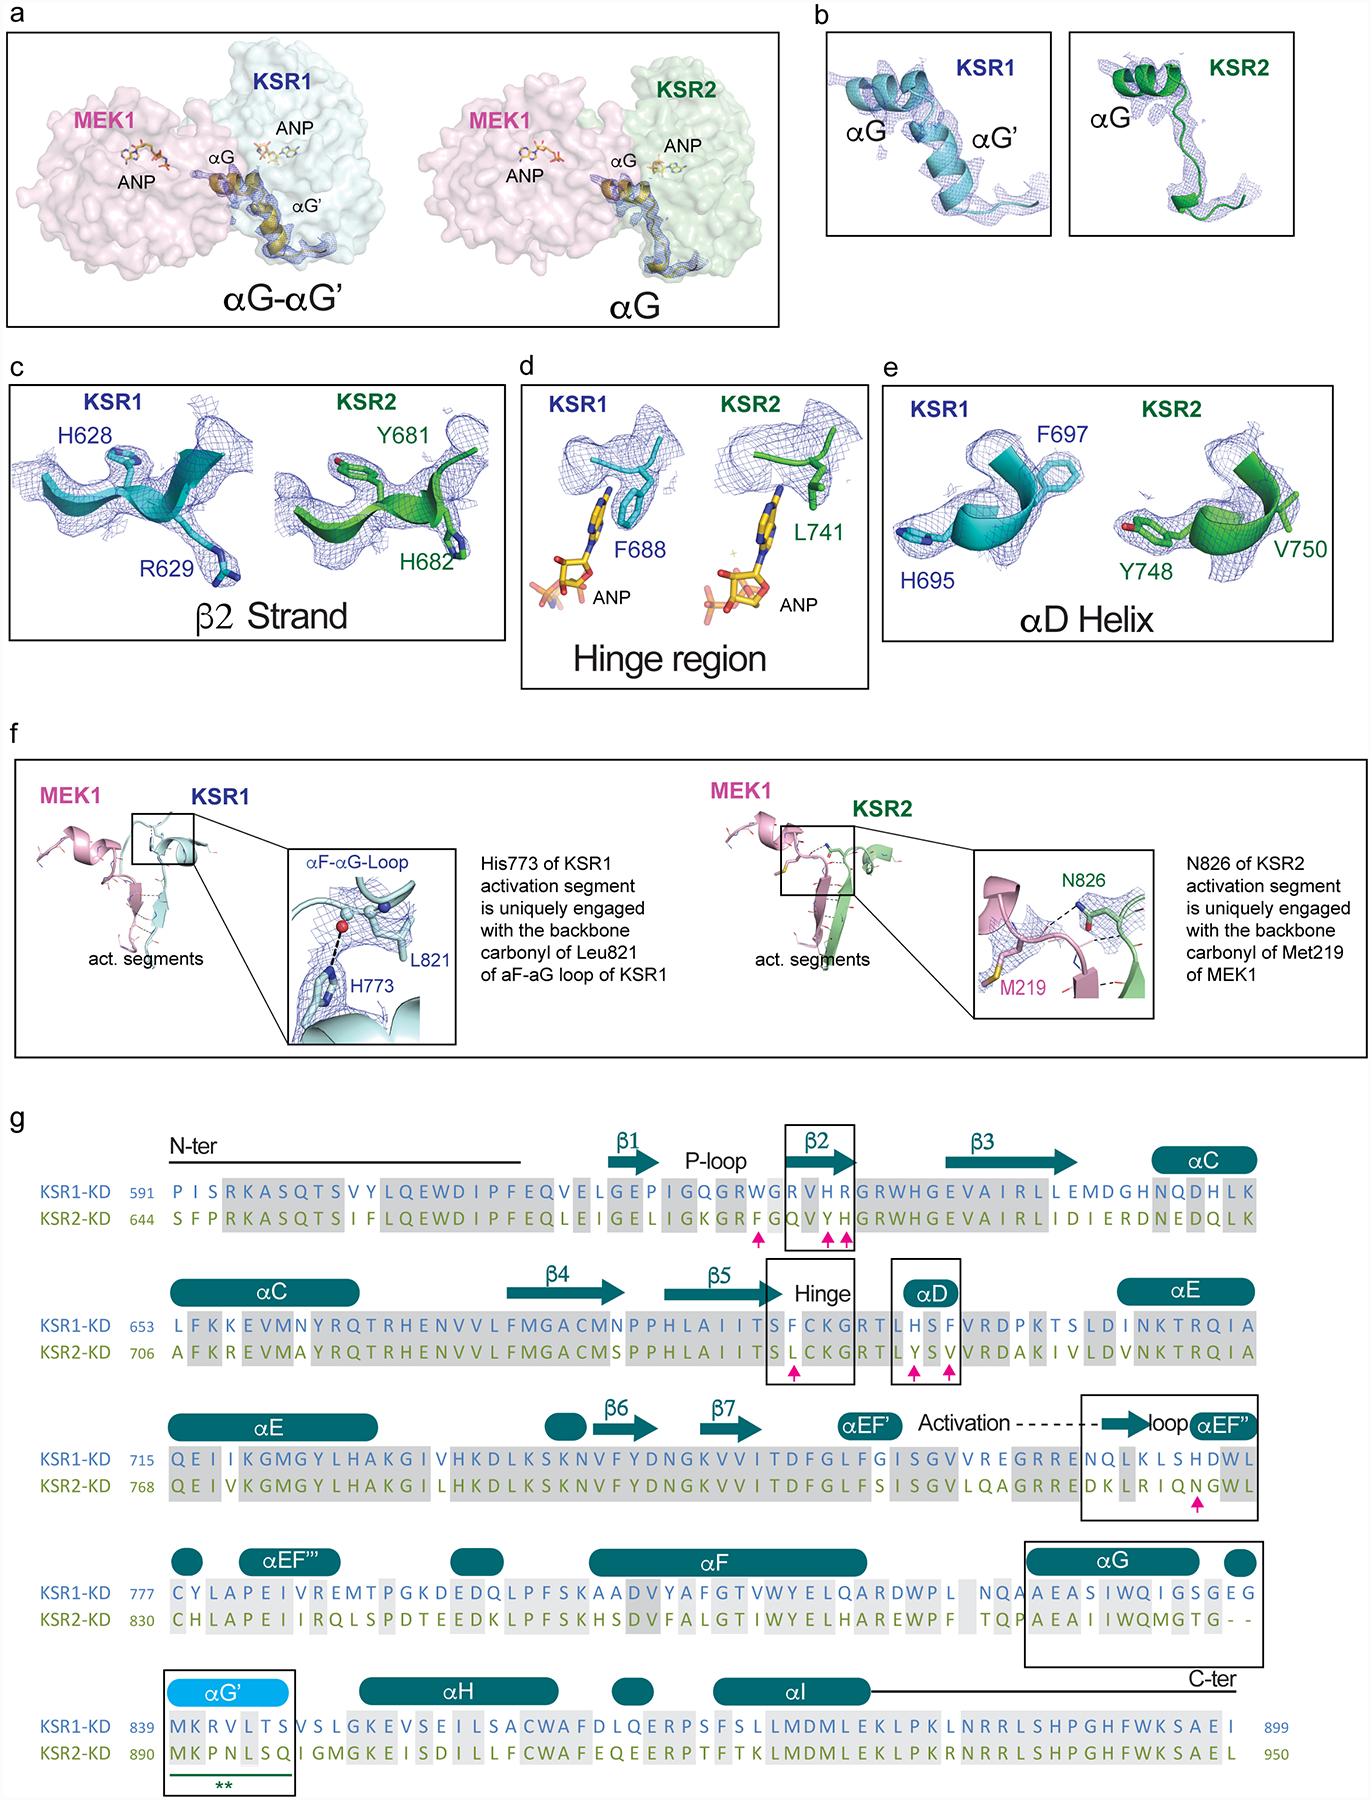
A. Comparison of helices αG-αG’ in the KSR1:MEK1 complex (left) and helix αG in KSR2:MEK1 complex.
B. 2Fo-Fc omit electron density maps contoured at 1.0 σ, with a 2.0 Å cutoff, around helices αG-αG’ in KSR1 (left) and αG in KSR2 (right).
C. 2Fo-Fc omit electron density maps contoured at 1.0 σ, with a 2.0 Å cutoff, around strand β2 in KSR1 (left) and KSR2 (right).
D. 2Fo-Fc omit electron density maps contoured at 1.0 σ, with a 2.0 Å cutoff, around the hinge region in KSR1 (left) and KSR2 (right).
E. 2Fo-Fc omit electron density maps contoured at 1.0 σ, with a 2.0 Å cutoff, around helix αD in KSR1 (left) and KSR2 (right).
F. Positionally equivalent residues H773 in KSR1 and N826 in KSR2 form distinct intra- and inter- molecular contacts, respectively. Specifically, H773 in KSR1 forms a hydrogen bond with the backbone carbonyl of L821 in the αF-αG loop of KSR1 (left). Whereas N826 in KSR2 forms a H-bond across the interfacial region of the KSR2:MEK1 complex via the backbone carbonyl of M219 in MEK1.
G. Structure-based sequence alignment of the pseudokinase domains of KSR1 and KSR2 based on structures solved in this study. Boxed regions are highlighted in the upper panels A-F.
Extended Data Figure 4: Intracellular target engagement on MEK and KSR-bound MEK via bioluminescence resonance energy transfer.
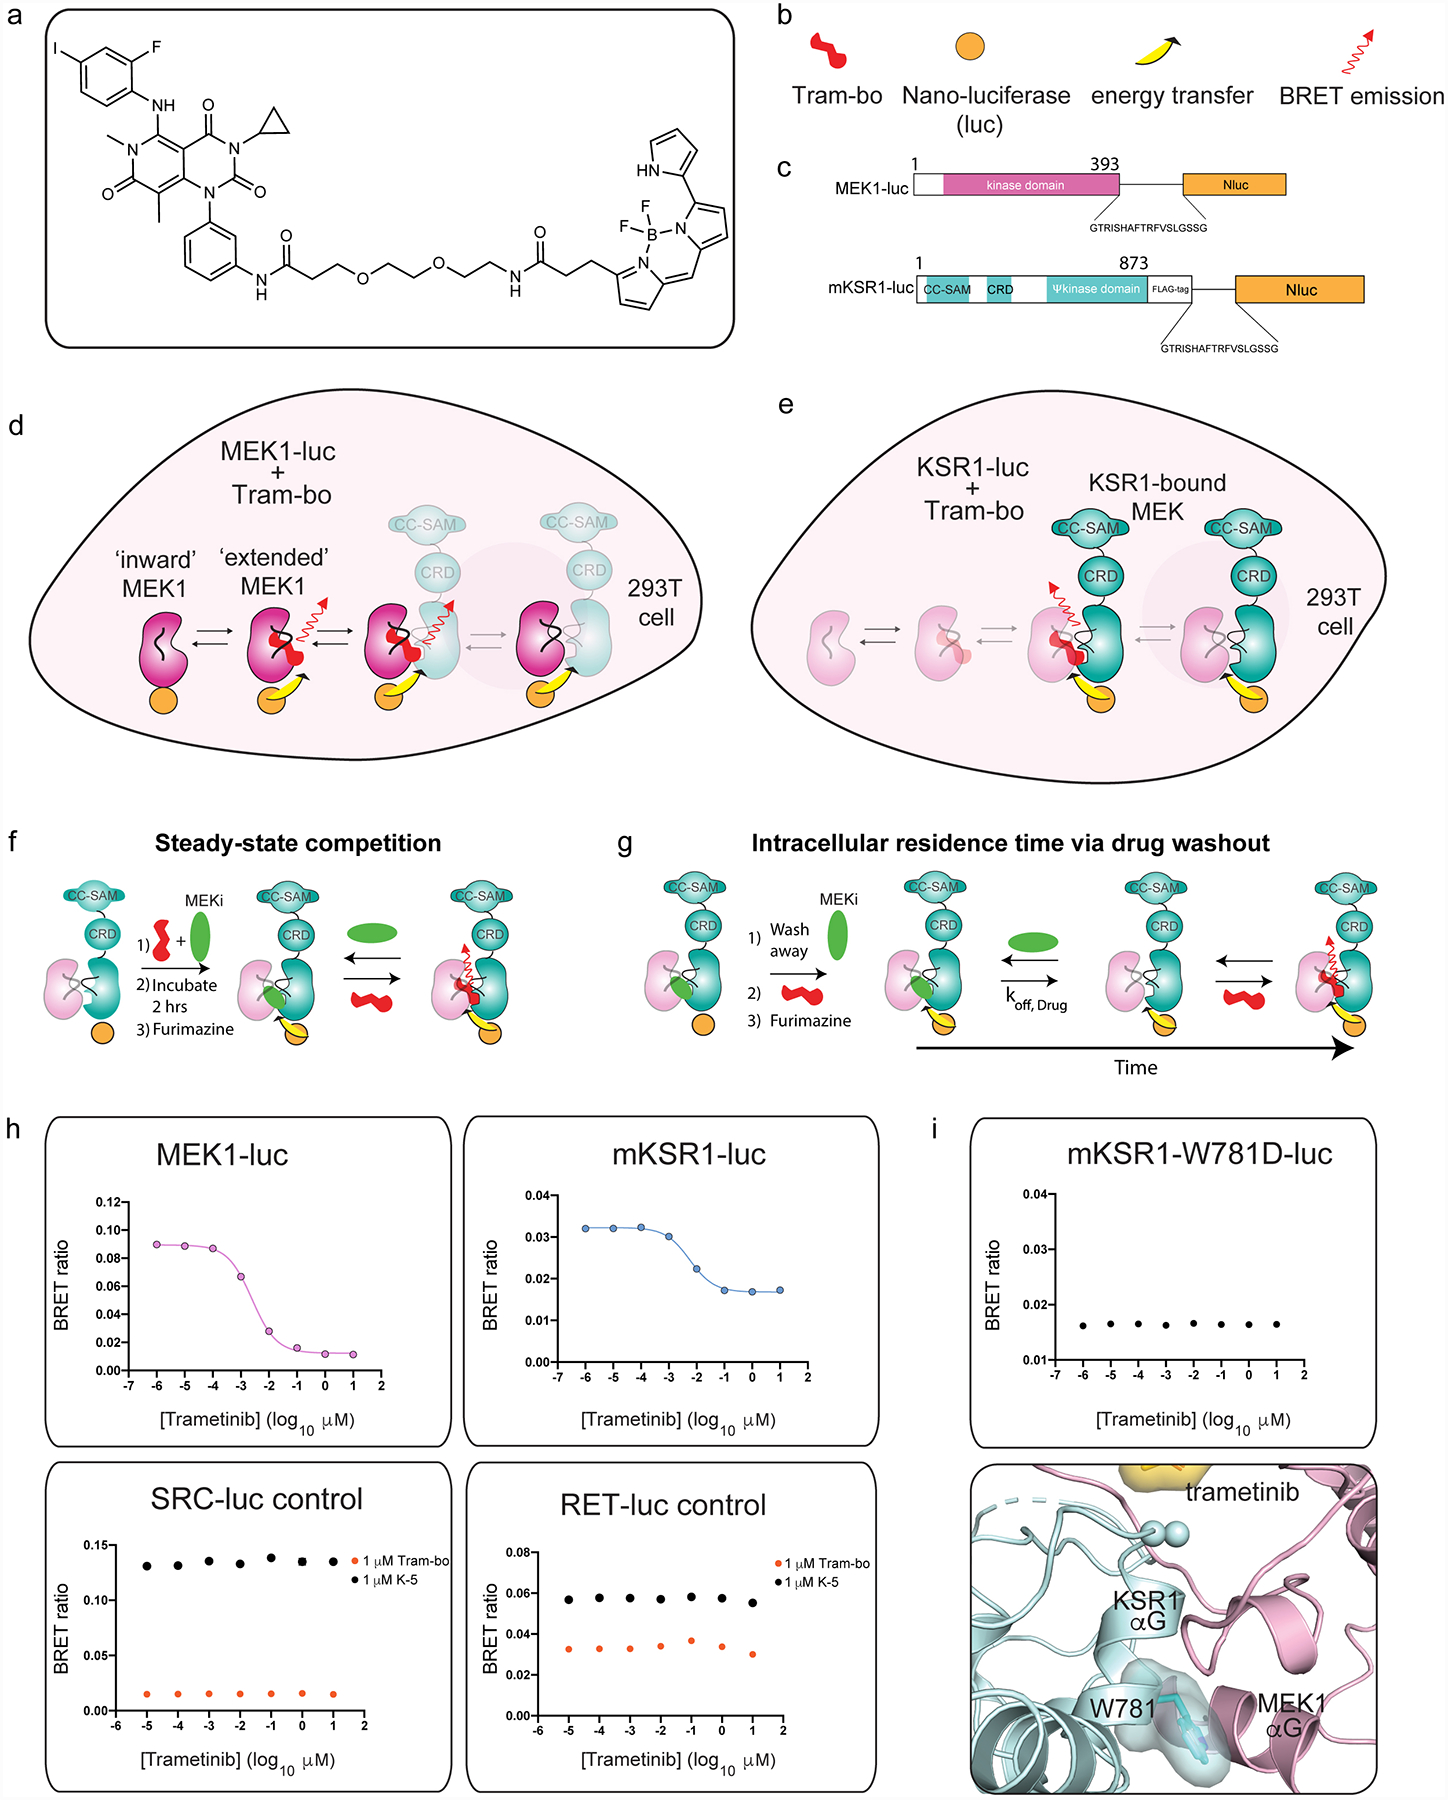
A. Chemical structure of trametinib-bodipy. We refer to this fluorescent probe compound as tram-bo’.
B. Legend for schematics used in the lower panels.
C. Nano-luciferase tagged fusions of MEK (MEK-luc) and mouse KSR1 (KSR-luc).
D. BRET emission signal (red arrow) between MEK-luc and tram-bo is expected to occur within multiple distinct states of MEK, including in the KSR-bound and free states of MEK as depicted.
E. BRET emission (red arrow) between KSR-luc and tram-bo is expected to occur exclusively in the KSR-bound state of MEK as depicted.
F. Assay design for steady-state competition experiments.
G. Assay design for intracellular residence time experiments.
H. BRET signals between 1 μM tram-bo and the indicated luciferase tagged fusion proteins expressed in 293T cells. Increasing concentrations of free trametinib were added to these cells to determine IC50 values. Dose-dependent competition for free trametinib was observed on MEK-luc and mouse KSR-luc. However, no discernible dose response for trametinib was observed on controls including RET-luc and SRC-luc using either tram-bo or previously established active site tracers K5 and K442, respectively.
I. A helix αG mutant, W781D in mouse KSR1, supports that the BRET signal between wild-type KSR1 and tram-bo depends on intact complex formation between KSR and MEK within cells. In particular, the KSR1-W781D mutant does not produce any dose dependent BRET signal (using 1 μM tram-bo) due to a predicted loss of complexation with MEK1; we previously demonstrated that the W781D mutant (W884D in KSR2 numbering) is a strong loss of function in KSR with respect to ERK pathway activation, and the analogous mutation in BRAF (F667E) prevents direct binding with purified MEK29. W781 in mouse KSR1 is equivalent to W831 in human KSR1, W884 in human KSR2, and F667 in human BRAF. Structural depiction of the mouse W781 (ie. W831 in human KSR1) residue at the interface of KSR1:MEK1 complex is shown below.
Extended Data Figure 5: MEKi IC50 measurements and residence time are influenced by protein complex stoichiometry.
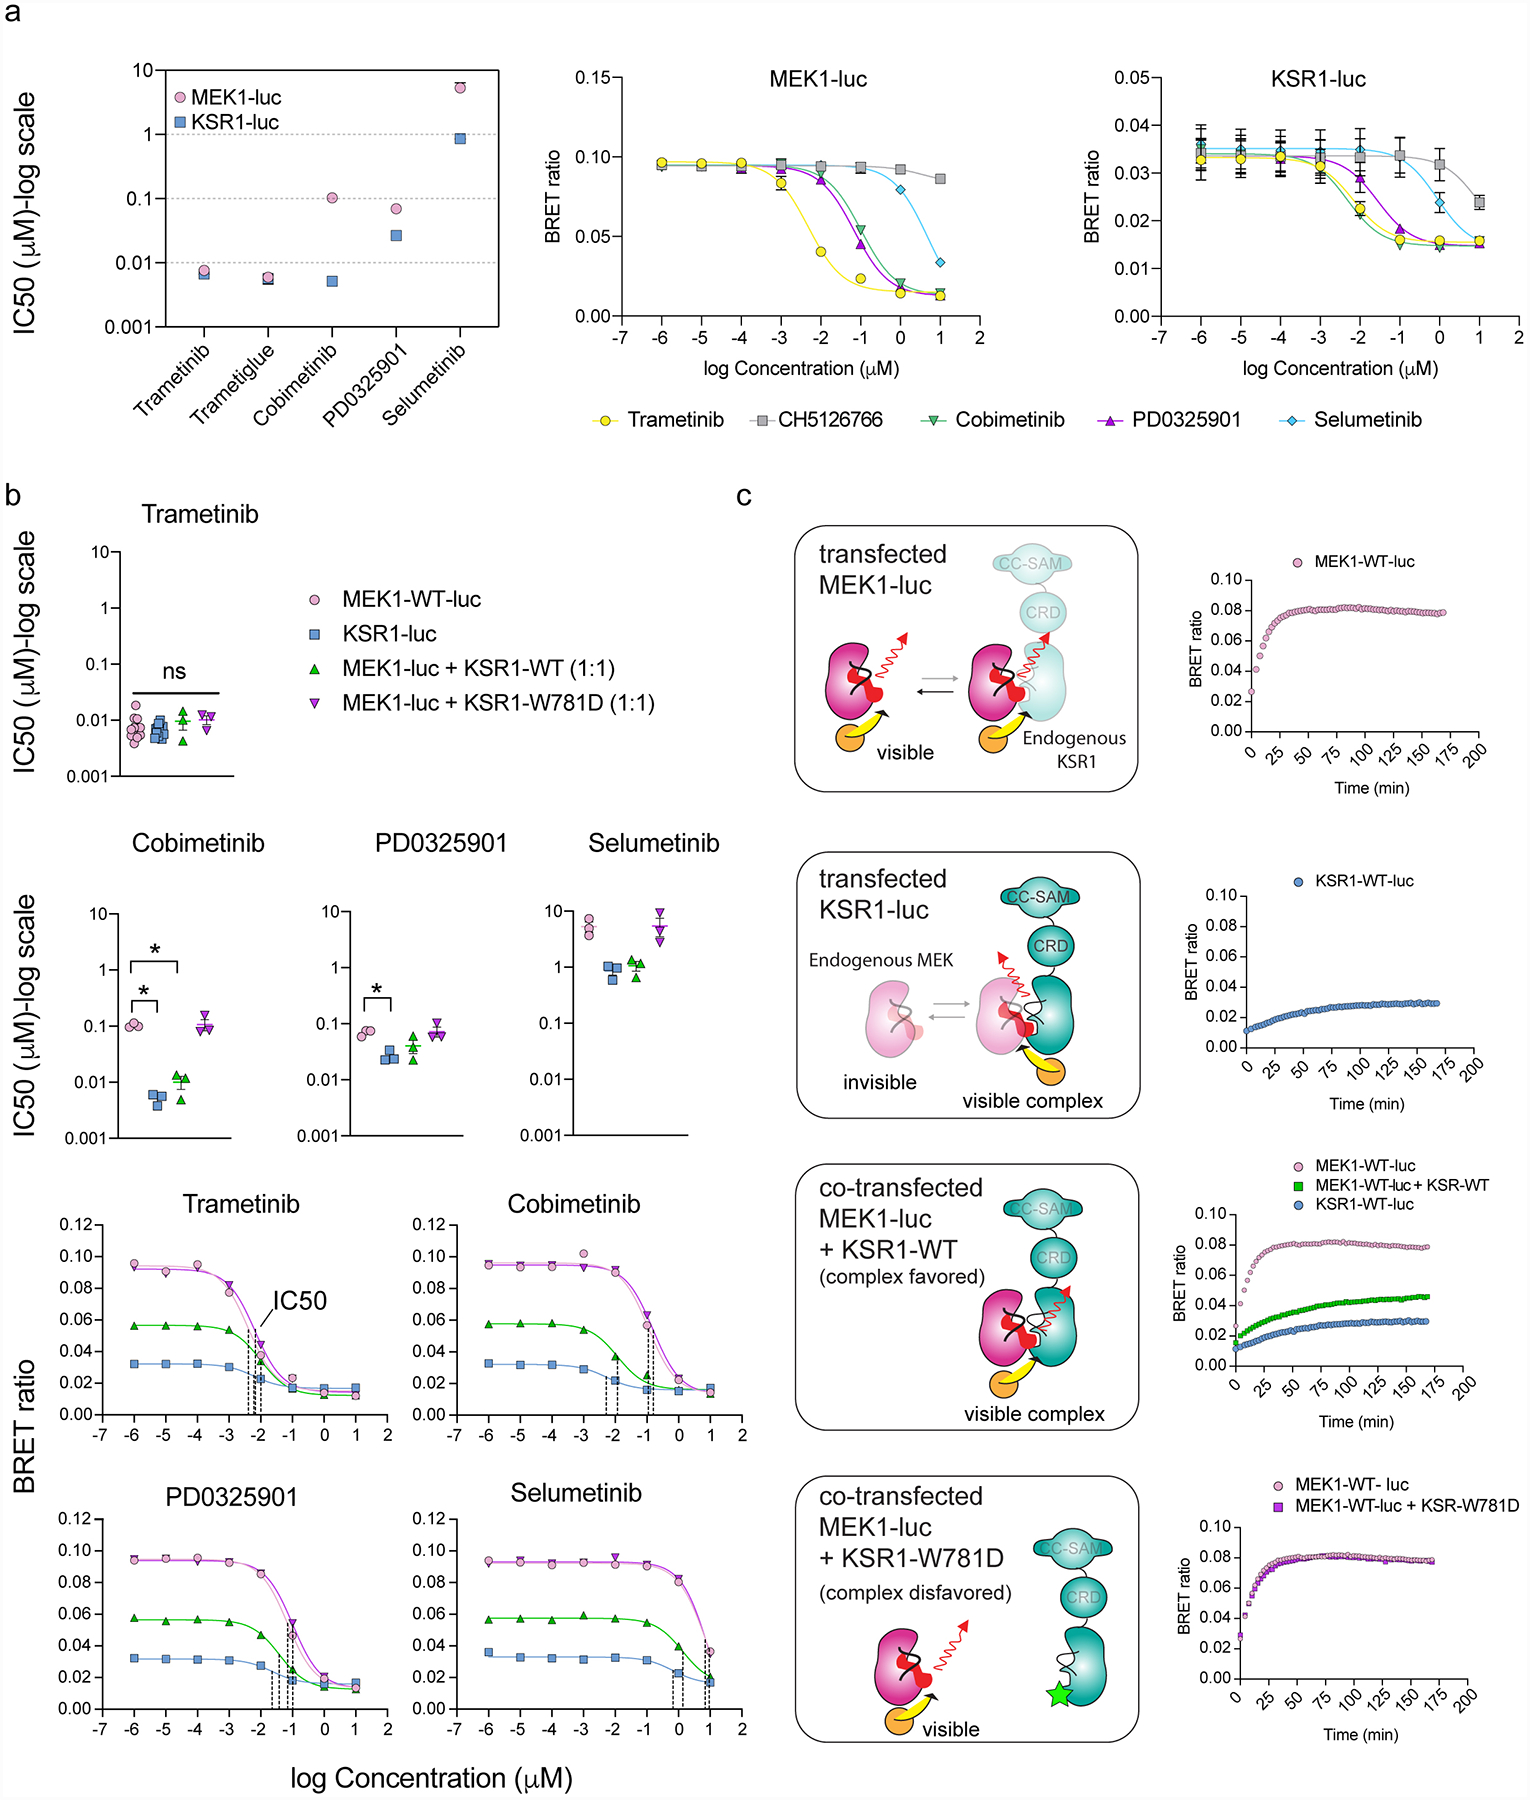
A. IC50 values plotted as a function of MEKi for MEK1-luc and KSR1-luc (left); mean and standard error (SEM) plotted from 3 independent experiments, each conducted in technical triplicate. CH5126766 was not plotted due to poor fit. MEK1-luc (middle) and KSR1-luc (right) dose-response curves for plotted IC50 values using 1 μM Tram-bo; mean and SEM plotted for 3 independent experiments, each conducted in technical triplicates.
B. Comparison of MEKi IC50 measurements and representative dose response curves of MEK1-luc, KSR1-luc, MEK1-luc co-expressed with KSR1-WT, and MEK1-luc co-expressed with KSR1-W781D. Co-expression of KSR1-WT with MEK1-luc gives rise to dose response curves and IC50 values similar to that of KSR1-luc alone. This effect does not occur for the co-expression of MEK1-luc with KSR1-W781D, implying that IC50 differences between MEK1-luc and KSR1-luc depend on the formation of the KSR-MEK complex mediated by helix αG. Mean and standard errors determined from 3 independent experiments, each conducted in technical duplicate. IC50s derived from KSR1-luc, MEK1-luc co-expressed with KSR1-WT or W781D were compared to those of MEK1-luc for each MEKi using an ANOVA where an asterisk represents a P-value less than 0.05. For trametinib, data were subjected to a Kruskal-Wallis test and Dunn’s multiple comparison post-hoc test (MEK1-luc vs KSR1-luc adjusted P>0.9999, MEK1-luc vs MEK1-luc + KSR1-WT adjusted P>0.9999, MEK1-luc vs MEK1-luc + KSR1-W781D adjusted P=0.4298). All other data were subjected to an ordinary one-way ANOVA and Dunnett’s multiple comparison post-hoc test with a single pooled variance (Cobimetinib: MEK1-luc vs KSR1-luc adjusted P=0.0015, MEK1-luc vs MEK1-luc + KSR1-WT P=0.0021, MEK1-luc vs MEK1-luc + KSR1-W781D P=0.9940; PD0325901: MEK1-luc vs KSR1-luc adjusted P=0.0350, MEK1-luc vs MEK1-luc + KSR1-WT P=0.1524, MEK1-luc vs MEK1-luc + KSR1-W781D P=0.9920; Selumetinib: MEK1-luc vs KSR1-luc adjusted P=0.0578, MEK1-luc vs MEK1-luc + KSR1-WT P=0.0693, MEK1-luc vs MEK1-luc + KSR1-W781D P=0.9994. Cobimetinib displayed the largest difference in IC50 value between MEK1-luc and KSR1-luc or MEK1-luc + KSR1-WT.
C. (Left) Schematic for the origin of the BRET signal under co-expression conditions. (Right) Tram-bo build-up curves for MEK1-luc, KSR1-luc, MEK1-luc co-expressed with KSR1-WT, and MEK1-luc co-expressed with KSR1-W781D. Co-expression of MEK1-luc + KSR1-WT resulted in a lower BRET signal and slower tram-bo build-up compared to MEK1-luc alone. Co-expression of MEK1-luc + KSR-W781D gave similar curves to MEK1-luc alone, suggesting that complex formation is disfavored under these conditions.
Extended Data Figure 6: KSR and RAF share complementary regulatory roles as MEK scaffolds and activators.
A. KSR and RAF family members appear to have co-evolved. Phylogenetic tree diagrams for the indicated species were generated from reported kinome sequence data that can be found at http://kinase.com/web/current/kinbase/. All species that we analysed include at least one RAF and one KSR homolog.
B. Structures of MEK1 in complex with KSR1 and KSR2 determined here, and previously determined structures of MEK1:BRAF-active conformation (PDB ID: 4MNE), and MEK1:BRAF-inactive conformation (PDB ID: 6U2G).
C. Structural overlay of MEK1-associated complexes highlights variations in the quaternary arrangements of KSR-bound MEK and RAF-bound MEK. Shown are overlays of MEK1:KSR1 with MEK1:KSR2 (left); MEK1:BRAF (PDB ID: 4MNE) with MEK1:BRAF (PDB ID: 6U2G) (center); and MEK1:KSR1 with MEK1:BRAF (PDB ID: 4MNE). In particular, the N-lobe, including helix αC, in KSR and RAF proteins are significantly displaced between distinct complexes. However, in contrast, the lower C lobe, including helix αG, appears relatively fixed in all sets of complexes.
D. Overlay of all structures, using MEK1 C-lobe as an anchor (center), demonstrates helix αG as a common docking site for reciprocal kinase domain interactions between MEK and BRAF or KSR (left inset). Further, the pre-helix αG loop regions within BRAF and KSR proteins occupy a relatively fixed location relative to MEK (right inset).
Extended Data Figure 7: Variance in the pre-helix αG loops of KSR and RAF proteins determines selectivity for trametinib.
A. The pre-helix αG loop in BRAF (left; N660-N661-R662) includes an insertion and larger amino acid side chains compared to KSR1 (middle; GAP-A825-A826) and KSR2 (right; GAP-P878-A879), creating a clash with trametinib.
B. Sequence alignment highlighting conserved variations between RAF kinases and KSR pseudokinases at the trametinib-binding site. Native sequences and mutants in mouse KSR1 and human BRAF used for functional studies in main Figure 3C,D are listed. Mouse KSR1 mutants include K1 (KSR1_P775N), K2 (KSR1_A776R), K3 (KSR1_P775N/A776R), and K4 (KSR1_insertionN/P775N/A776R). Human BRAF mutants include B1 (BRAF_N661A), B2 (BRAF_R662A), B3 (BRAF_N661A/R662A), and B4 (BRAF_N660deletion/N661A/R662A).
C. IP/WB of endogenous MEK1 from lysates of HCT116 cells transfected with (left) wild-type KSR1 and mutant K1 (P775N, mouse KSR1 numbering); (middle) wild-type BRAF and mutant B2 (R662A); (right) untransfected controls. Cells were treated with DMSO (D), 200 nM trametinib (T), or 200 nM cobimetinib (C) for 1 hour prior to harvesting cells. IgG was used as a control for non-specific binding of proteins during IPs. Transfected KSR1 or BRAF were detected using an anti-FLAG antibody. All other western blot signals were detected using specific antibodies against endogenous proteins. Blots are representative of three independent experiments. We conducted side-by-side analysis of cobimetinib as a control compound that does not generate direct interfacial contacts like trametinib but displays a similar IC50 on the KSR:MEK complex. Note; compare the effects of cobimetinib addition on complex stability to the effects of trametinib in Figure 3C,D. Unlike trametinib, cobimetinib does not impact the KSR1 or BRAF mutants in terms of pulldown through endogenous MEK similar to trametinib. This data supports that the ‘bump-and-hole’ model for trametinib selectivity between KSR-bound MEK and RAF-bound MEK. Further note from Figure 3C,D that all of the tested KSR1 alleles, and also the full swaps of the pre-helix αG loops between RAF and KSR proteins, resulted in partial or complete loss of pulldown via MEK (Figure 3C,D; lanes 2 vs 10 for mutants K4 and B4), which suggests that the length and composition of interfacial residues within both KSR and RAF proteins are critical and unique determinants of binding towards MEK.
D. Overlay of four clinical MEKi highlights the phenyl acetamide group of trametinib as a unique ‘bump’ not found in the other compounds including cobimetinib.
E. BRET buildup curves with increasing concentrations of tram-bo on the indicated luciferase-tagged versions of human KSR1, KSR2, ARAF, BRAF, and CRAF/RAF1. KSR1-luc and KSR2-luc both show higher BRET ratios, and also ~10-fold tighter binding, with tram-bo relative to ARAF-luc, BRAF-luc, and CRAF-luc. Lower inset is a y-axis magnification of the top inset. Data points represent the average of two technical replicates; experiments were conducted at least three independent times with similar results.
Extended Data Figure 8: In vitro binding of purified MEK, KSR:MEK, and RAF:MEK to trametinib.
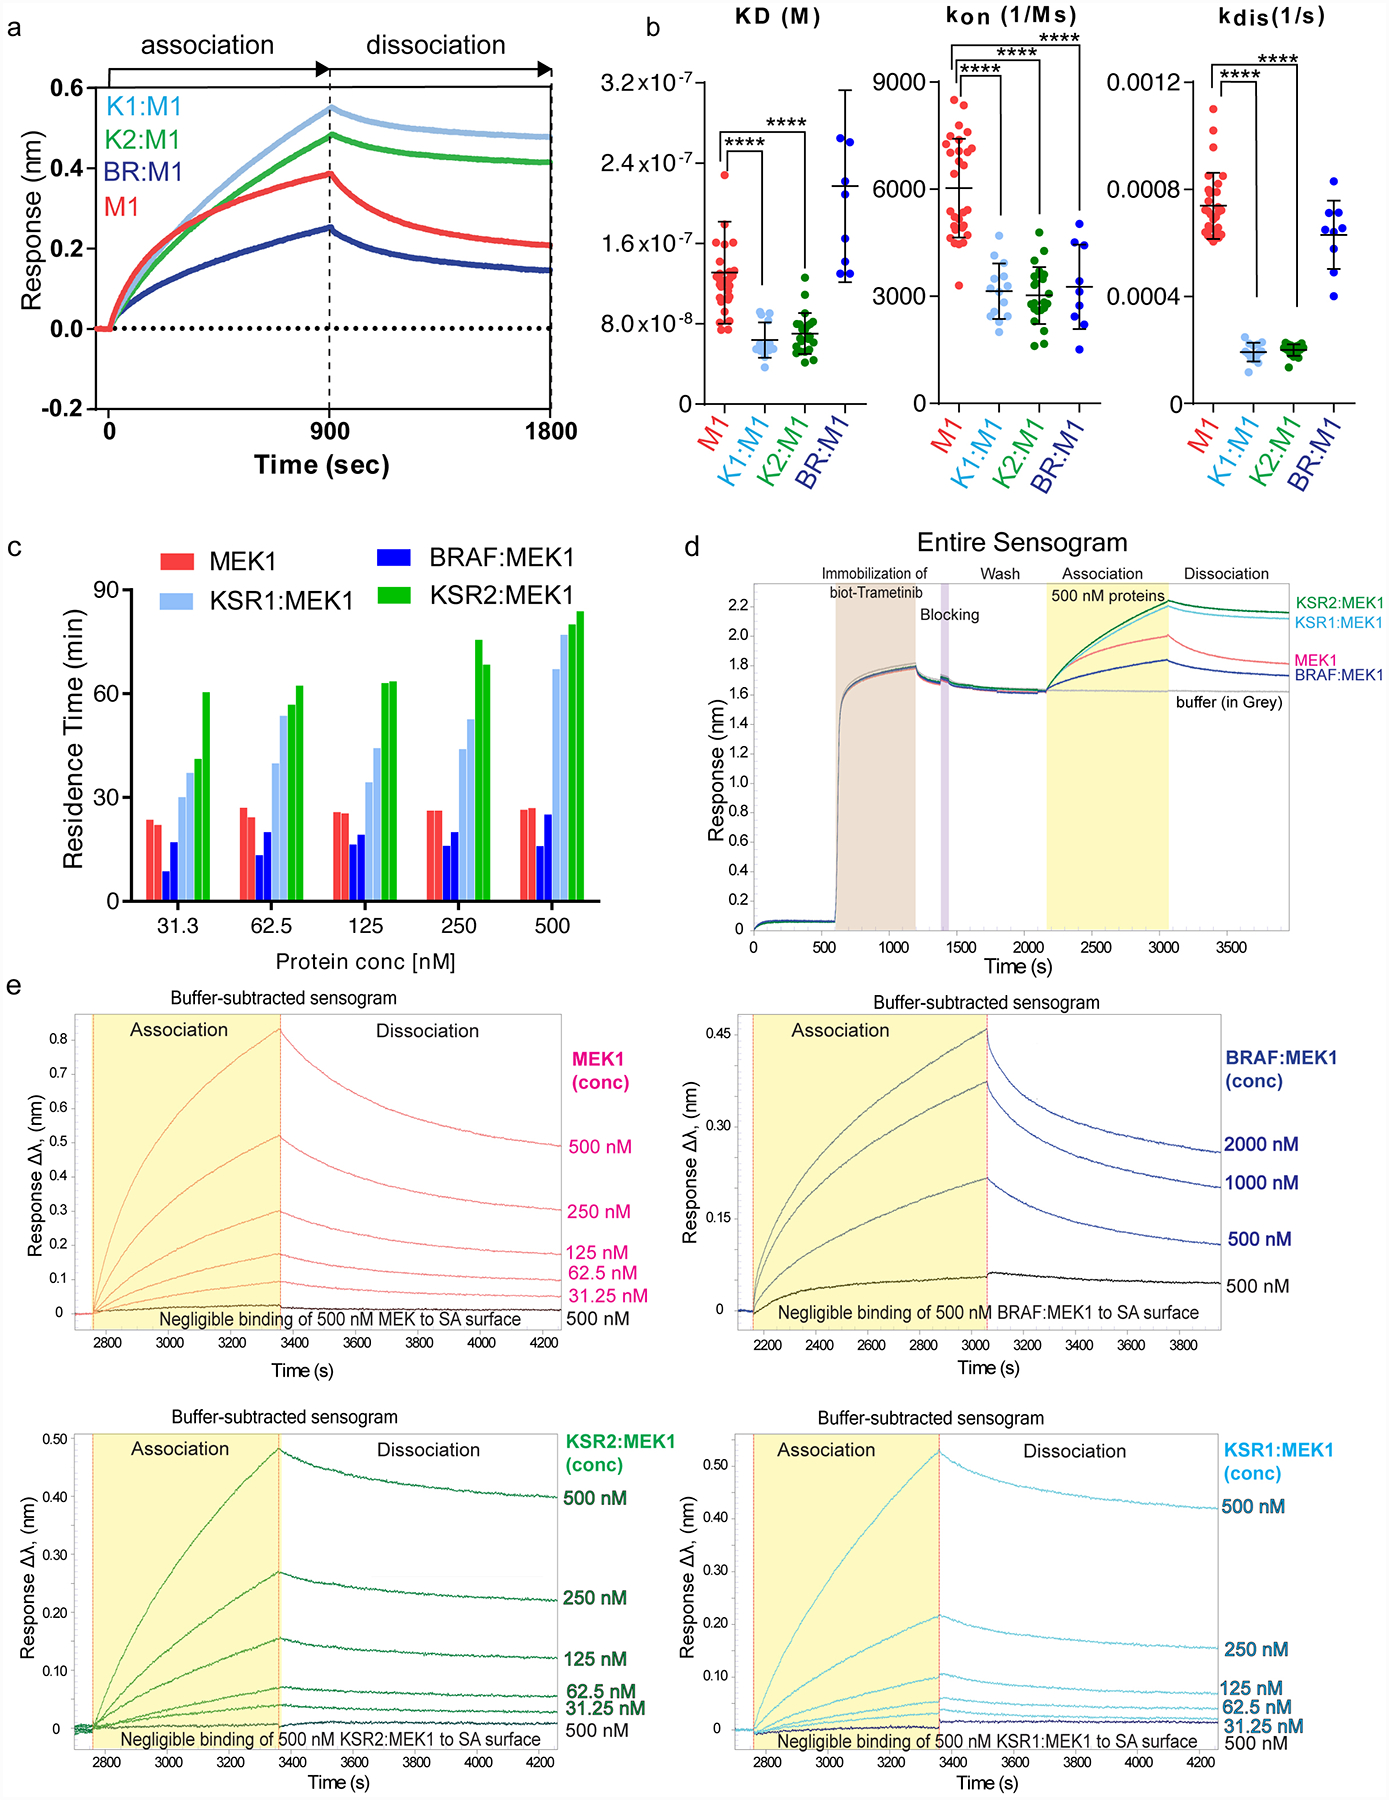
A. Representative binding sensograms for 500 nM each of isolated MEK1 or the indicated KSR:MEK and BRAF:MEK complexes on a biosensor immobilized with biotin-conjugated trametinib. Fitting of association and dissociation phases based on one-to-one binding is provided in Source Data Extended Data Fig. 8.
B. KD (M), kon (1/Ms), and kdis (1/s) values for MEK1 (M), KSR1:MEK1 (K1M1), KSR2:MEK1 (K2M2), BRAF:MEK1 (BRM1) on biotin-linked trametinib. Individual data points from independent binding experiments (n=29, 14, 22, and 9 for MEK1, KSR1:MEK1, KSR2:MEK1, and BRAF:MEK1, respectively) were used for statistical comparisons (**** for p ≤ 0.0001, respectively; Source Data Extended Data Fig. 8). Note, trametinib likely favours dissociation of BRAF from MEK1 for binding. For example, whereas the association and KD data between BRAF:MEK1 and isolated MEK1 markedly differ, the off rate and residence time calculations are similar. This data would be consistent with a model in which the equilibrium of BRAF:MEK1 shifts so as to populate the dissociated state under the conditions of the BLI assays.
C. Residence time values plotted as a function of protein concentration. MEK1 and BRAF:MEK1 display small variations in residence time over the concentrations tested. Whereas KSR2:MEK1 and KSR1:MEK1 demonstrate concentration-dependent changes in residence time. In particular, at low concentrations of KSR-MEK, where the complexes would be expected to more readily dissociate, the kinetic values of purified KSR1:MEK1 and KSR2:MEK1 approached isolated MEK1 and BRAF:MEK1.
D. Full binding curve experiment including loading of biotin-conjugated trametinib for 10 mins, followed by a wash step, and subsequently treating a low-density streptavidin (SA) sensor with a blocking agent, biocytin for 3 min. The sensors were washed extensively to acquire a zero baseline prior to binding analysis. Following, sensors were dipped in wells containing 500 nM of each protein for 15 min, followed by a dissociation in running buffer for 15 min.
E. A biotin conjugated version of trametinib was immobilized on sensor-heads and binding to MEK1, KSR1:MEK1, KSR2:MEK1 or BRAF:MEK1 was monitored using bio-layer interferometry. Increasing concentrations in 2-fold increments of proteins from 31.25 nM to 500 nM for MEK1, KSR1:MEK1, and KSR2:MEK1 and 500 nM to 2000 nM for BRAF:MEK1 were tested. A blank sensor head without immobilized trametinib was used as a control for non-specific binding. KD (M), kon (1/Ms), and kdis (1/s) values were derived from fitting each binding curve.
Extended Data Figure 9: KSR as a co-receptor for binding to trametinib.
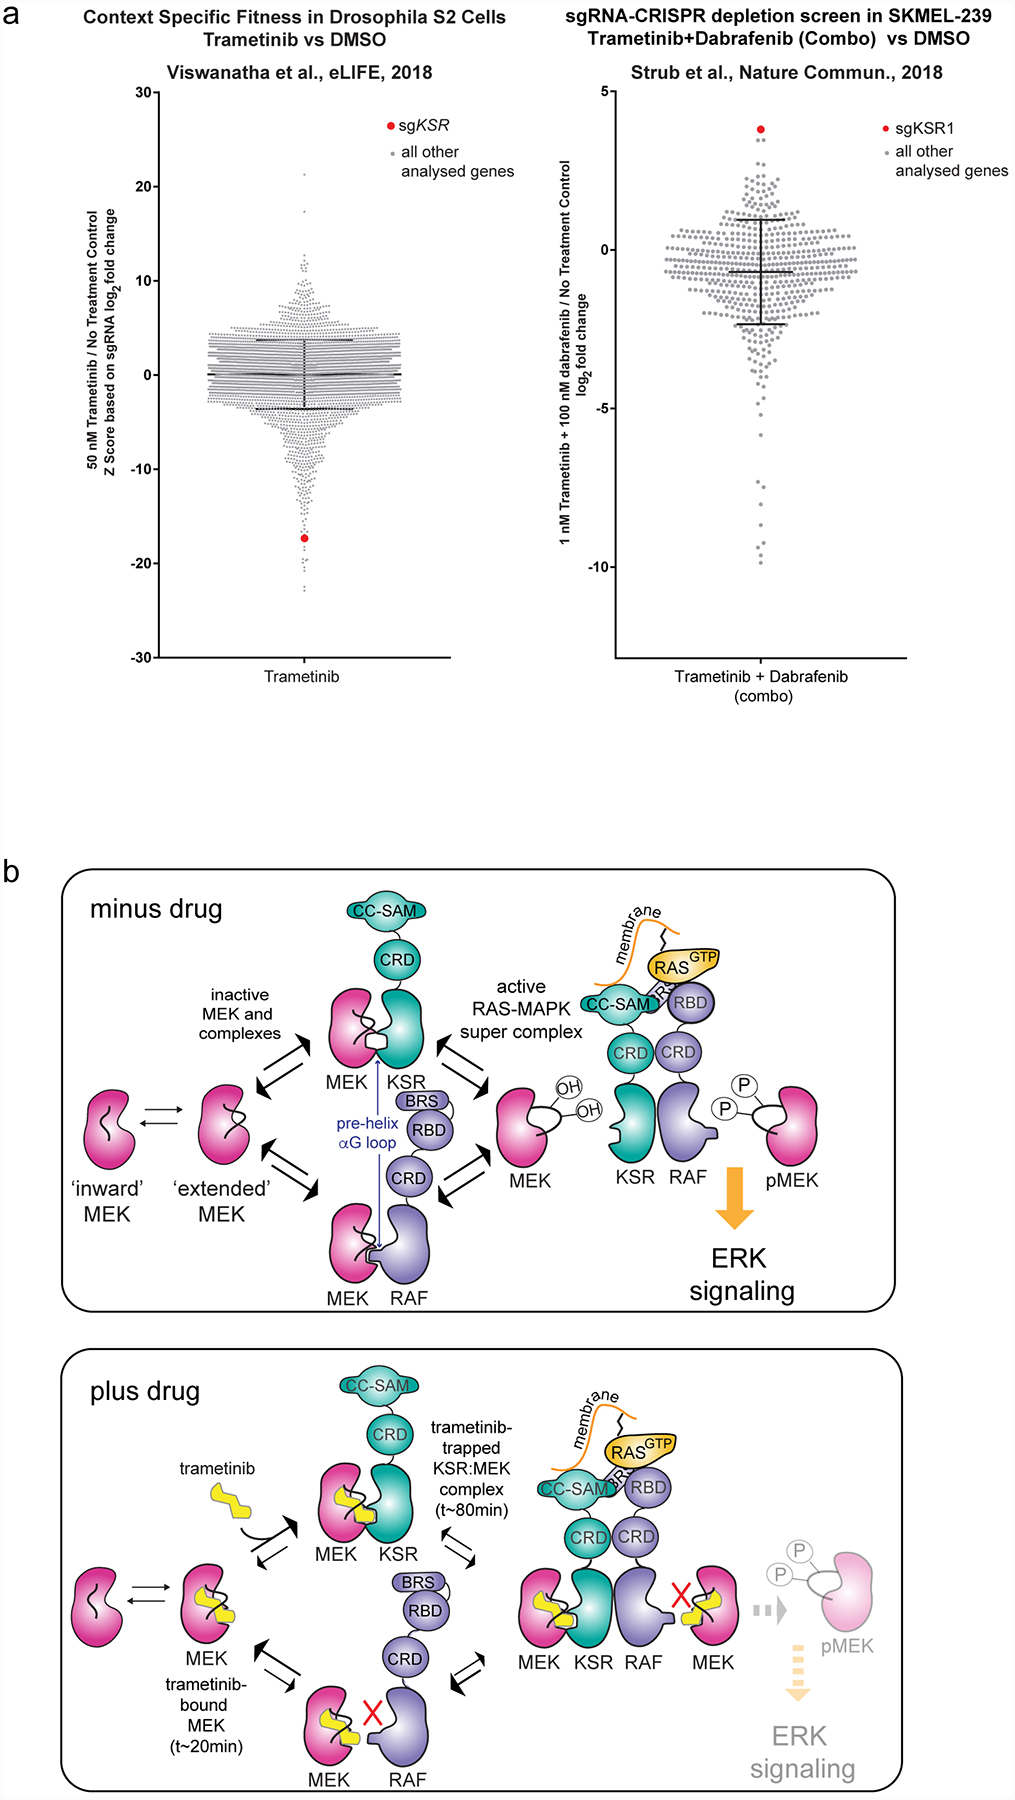
A. Literature data on CRISPR depletion screens highlight strong functional interactions between trametinib and KSR. For example, in a Drosophila cellular fitness model (left43) and a human BRAF V600E mutant cell line (right44), sgRNAs towards KSR generated relative outlier sensitivity or resistance to trametinib or a trametinib+dabrafenib combination, respectively. Raw data from Viswanatha et al. was plotted based on the authors determination of a Z-score for log2-fold change in sgRNA reads for S2 cells treated with trametinib versus a no treatment control (left). Raw data from Strub et al. was plotted based on the authors determination of log2-fold change in sgRNA reads for SKMEL-239 cells treated with a trametinib+dabrafenib combination relative to a no treatment control (right). sgRNAs towards KSR are highlighted as a red dot; all other sgRNAs analysed in the respective studies are shown as grey dots. KSR emerged as a strong outlier beyond the mean plus standard deviation (black cross hairs) of all genes analysed in each respective study. These screens could be re-investigated based on the model that KSR functions as a direct co-receptor for binding to trametinib and MEK.
B. Model for the action of trametinib on KSR:MEK and RAF:MEK complexes. In the absence of drug, MEK activation depends on heterodimerization of both RAF and KSR, with phosphorylation on the sites S218/S222 occurring through active RAF kinases. This model is adapted from structural and biochemical studies in28,29,45,46. Trametinib could down-regulate ERK signaling by impeding direct binding of MEK towards RAF in favor of KSR. In the KSR-bound state of MEK, trametinib would be expected to reside on target for extended periods of time.
Extended Data Figure 10: Trametiglue provides durable inhibition of RAS/ERK signaling in models of mutant KRAS and BRAF.
A. (Left) Immunoblot of stable HCT-116 (KRAS G13D) cancer cells including parental, scramble control (shSCR), and KSR1 knockdown (shKSR1). Cells were treated with 10 nM trametinib for the indicated time points and harvested for analysis on the indicated markers. (Right) Quantitative PCR was used to confirm specific knockdown of KSR1 in the shKSR1 cells. KSR1 knockdown slows the rebound of activated RAS-MAPK signaling in the presence of trametinib as measured by recovered phosphorylated-ERK1/2 over time (lanes 1–5 and 6–10 versus 11–15). This data supports that KSR1 plays a positive role in the adaptive resistance of HCT-116 cells to trametinib, suggesting that knockdown or trapping of the KSR-bound MEK complex could mitigate this intrinsic drug resistance mechanism. Experiment was conducted twice with similar results.
B. EC50 values for cell viability assays for the indicated compounds against a series of human cancer cell lines. Mean and standard deviation determined from three independent experiments, each conducted in technical triplicate. Raw data is included in Source Data Extended Data Fig. 10.
C. X-ray crystal structure of trametinib bound to the KSR2:MEK1:AMP-PNP complex. MEK1 and KSR2 are colored pink and green respectively, with several key residues highlighted. Trametinib is shown in stick representation. A Fo-Fc omit electron density map, contoured at 3.0 σ with a 2.0 Å cutoff around ligand, is shown as a blue mesh. Left panel shows the entire inhibitor binding pocket; right panel highlights contacts around the phenyl acetamide group of trametinib.
D. Bar graph plot of mean EC50 values from B.
E. Clonogenic assay of KRAS-mutant and BRAF-mutant cancer cell lines treated with 10 nM trametinib or 10 nM trametiglue, and 10 nM or 50 nM CH5126766 for 10 days. Experiment was conducted twice with similar results.
F. Immunoblot analysis of the indicated cell lines treated for 1 hour with increasing concentrations of trametiglue and trametinib. This data supports that trametiglue, relative to trametinib, is a higher potency inhibitor of RAS-MAPK signaling as measured by phosphorylated ERK1/2 at residues T202 and Y204 (pERK). Experiment was conducted three times with similar results.
G. Immunoblot of KRAS-mutant and BRAF-mutant cancer cell lines treated with 10 nM trametinib or trametiglue for various times. Experiment was conducted twice with similar results.
Supplementary Material
Acknowledgements:
We thank K. Shokat, R. Parsons, E. Bernstein and lab for helpful comments and suggestions on this work and manuscript, and staff at the Advanced Photon Source (LS-CAT sector 21) and the National Synchrotron Light Source II (Beamlines 17-ID-1 AMX and 17-ID-2 FMX) for help with X-ray diffraction experiments. We thank M. Robers and J. Vasta (Promega) for advice on NanoBRET experiments. The Dar laboratory has been supported by innovation awards from the NIH (1DP2CA186570-01) and Damon Runyan Rachleff Foundation, as well as NIH grants 1RO1CA227636 and 5U54OD020353. The authors are also supported by NCI grant P30 CA196521 to the Tisch Cancer Institute. A.M.R. and W.M.M. are recipients of NIH F30 (CA232454) and F99/K00 (CA212474) awards, respectively. A.C. and M.E.D. are recipients of T32 fellowships 5T32CA078207 and 5T32GM062754, respectively. A.C.D. has been supported as a Pew-Stewart Scholar in Cancer Research and a Young Investigator of the Pershing-Square Sohn Cancer Research Alliance.
Footnotes
Competing interests: A provisional patent application has been filed by Mount Sinai.
Data Availability: Coordinates and structure factors have been deposited in the PDB under accession codes 7JUQ, 7JUR, 7JUS, 7JUT, 7JUU, 7JUV, 7JUW, 7JUX, 7JUY, 7JUZ, 7JV0, 7JV1.
REFERENCES
- 1.Zhao Y & Adjei AA The clinical development of MEK inhibitors. Nat. Rev. Clin. Oncol 11, 385–400 (2014). [DOI] [PubMed] [Google Scholar]
- 2.Ebert PJR et al. MAP Kinase Inhibition Promotes T Cell and Anti-tumor Activity in Combination with PD-L1 Checkpoint Blockade. Immunity 44, 609–621 (2016). [DOI] [PubMed] [Google Scholar]
- 3.Liu L et al. The BRAF and MEK Inhibitors Dabrafenib and Trametinib: Effects on Immune Function and in Combination with Immunomodulatory Antibodies Targeting PD-1, PD-L1, and CTLA-4. Clin. Cancer Res 21, 1639–1651 (2015). [DOI] [PubMed] [Google Scholar]
- 4.Slack C et al. The Ras-Erk-ETS-Signaling Pathway Is a Drug Target for Longevity. Cell 162, 72–83 (2015). [DOI] [PMC free article] [PubMed] [Google Scholar]
- 5.LoRusso PM et al. Phase I pharmacokinetic and pharmacodynamic study of the oral MAPK/ERK kinase inhibitor PD-0325901 in patients with advanced cancers. Clin. Cancer Res 16, 1924–1937 (2010). [DOI] [PubMed] [Google Scholar]
- 6.Huang W et al. PD0325901, a mitogen-activated protein kinase kinase inhibitor, produces ocular toxicity in a rabbit animal model of retinal vein occlusion. J. Ocul. Pharmacol. Ther 25, 519–530 (2009). [DOI] [PubMed] [Google Scholar]
- 7.Infante JR et al. Safety and efficacy results from the first-in-human study of the oral MEK 1/2 inhibitor GSK1120212. J. Clin. Orthod 28, 2503–2503 (2010). [Google Scholar]
- 8.Emery CM et al. MEK1 mutations confer resistance to MEK and B-RAF inhibition. Proc. Natl. Acad. Sci. U. S. A 106, 20411–20416 (2009). [DOI] [PMC free article] [PubMed] [Google Scholar]
- 9.Lito P et al. Disruption of CRAF-mediated MEK activation is required for effective MEK inhibition in KRAS mutant tumors. Cancer Cell 25, 697–710 (2014). [DOI] [PMC free article] [PubMed] [Google Scholar]
- 10.Gao Y et al. V211D Mutation in MEK1 Causes Resistance to MEK Inhibitors in Colon Cancer. Cancer Discov. 9, 1182–1191 (2019). [DOI] [PMC free article] [PubMed] [Google Scholar]
- 11.Simanshu DK, Nissley DV & McCormick F RAS Proteins and Their Regulators in Human Disease. Cell 170, 17–33 (2017). [DOI] [PMC free article] [PubMed] [Google Scholar]
- 12.Moore AR, Rosenberg SC, McCormick F & Malek S RAS-targeted therapies: is the undruggable drugged? Nat. Rev. Drug Discov 19, 533–552 (2020). [DOI] [PMC free article] [PubMed] [Google Scholar]
- 13.Long GV et al. Dabrafenib and trametinib versus dabrafenib and placebo for Val600 BRAF-mutant melanoma: a multicentre, double-blind, phase 3 randomised controlled trial. Lancet 386, 444–451 (2015). [DOI] [PubMed] [Google Scholar]
- 14.Kinsey CG et al. Protective autophagy elicited by RAF→ MEK→ ERK inhibition suggests a treatment strategy for RAS-driven cancers. Nat. Med 1 (2019). [DOI] [PMC free article] [PubMed] [Google Scholar]
- 15.Ribas A et al. Phase I study combining anti-PD-L1 (MEDI4736) with BRAF (dabrafenib) and/or MEK (trametinib) inhibitors in advanced melanoma. J. Clin. Orthod 33, 3003–3003 (2015). [Google Scholar]
- 16.Canon J et al. The clinical KRAS(G12C) inhibitor AMG 510 drives anti-tumour immunity. Nature 575, 217–223 (2019). [DOI] [PubMed] [Google Scholar]
- 17.Yamaguchi T et al. Identification of JTP-70902, a p15(INK4b)-inductive compound, as a novel MEK1/2 inhibitor. Cancer Sci. 98, 1809–1816 (2007). [DOI] [PMC free article] [PubMed] [Google Scholar]
- 18.Westbrook JD & Burley SK How Structural Biologists and the Protein Data Bank Contributed to Recent FDA New Drug Approvals. Structure 27, 211–217 (2019). [DOI] [PMC free article] [PubMed] [Google Scholar]
- 19.Fischmann TO et al. Crystal structures of MEK1 binary and ternary complexes with nucleotides and inhibitors. Biochemistry 48, 2661–2674 (2009). [DOI] [PubMed] [Google Scholar]
- 20.Ohren JF et al. Structures of human MAP kinase kinase 1 (MEK1) and MEK2 describe novel noncompetitive kinase inhibition. Nat. Struct. Mol. Biol 11, 1192–1197 (2004). [DOI] [PubMed] [Google Scholar]
- 21.Yoshida T et al. Identification and characterization of a novel chemotype MEK inhibitor able to alter the phosphorylation state of MEK1/2. Oncotarget 3, 1533–1545 (2012). [DOI] [PMC free article] [PubMed] [Google Scholar]
- 22.Hatzivassiliou G et al. Mechanism of MEK inhibition determines efficacy in mutant KRAS- versus BRAF-driven cancers. Nature 501, 232–236 (2013). [DOI] [PubMed] [Google Scholar]
- 23.Kornfeld K, Hom DB & Horvitz HR The ksr-1 gene encodes a novel protein kinase involved in Ras-mediated signaling in C. elegans. Cell 83, 903–913 (1995). [DOI] [PubMed] [Google Scholar]
- 24.Robers MB et al. Quantitative, Real-Time Measurements of Intracellular Target Engagement Using Energy Transfer. Methods Mol. Biol 1888, 45–71 (2019). [DOI] [PubMed] [Google Scholar]
- 25.Ishii N et al. Enhanced Inhibition of ERK Signaling by a Novel Allosteric MEK Inhibitor, CH5126766, That Suppresses Feedback Reactivation of RAF Activity. Cancer Research vol. 73 4050–4060 (2013). [DOI] [PMC free article] [PubMed] [Google Scholar]
- 26.Vauquelin G & Charlton SJ Long-lasting target binding and rebinding as mechanisms to prolong in vivo drug action. Br. J. Pharmacol 161, 488–508 (2010). [DOI] [PMC free article] [PubMed] [Google Scholar]
- 27.Lavoie H & Therrien M Regulation of RAF protein kinases in ERK signalling. Nat. Rev. Mol. Cell Biol 16, 281–298 (2015). [DOI] [PubMed] [Google Scholar]
- 28.Brennan DF et al. A Raf-induced allosteric transition of KSR stimulates phosphorylation of MEK. Nature 472, 366–369 (2011). [DOI] [PubMed] [Google Scholar]
- 29.Dhawan NS, Scopton AP & Dar AC Small molecule stabilization of the KSR inactive state antagonizes oncogenic Ras signalling. Nature 537, 112–116 (2016). [DOI] [PMC free article] [PubMed] [Google Scholar]
- 30.Haling JR et al. Structure of the BRAF-MEK complex reveals a kinase activity independent role for BRAF in MAPK signaling. Cancer Cell 26, 402–413 (2014). [DOI] [PubMed] [Google Scholar]
- 31.Liau NPD et al. Negative regulation of RAF kinase activity by ATP is overcome by 14-3-3-induced dimerization. Nat. Struct. Mol. Biol 27, 134–141 (2020). [DOI] [PubMed] [Google Scholar]
- 32.Copeland RA The drug–target residence time model: a 10-year retrospective. Nat. Rev. Drug Discov 15, 87 (2015). [DOI] [PubMed] [Google Scholar]
- 33.Gilmartin AG et al. GSK1120212 (JTP-74057) is an inhibitor of MEK activity and activation with favorable pharmacokinetic properties for sustained in vivo pathway inhibition. Clin. Cancer Res 17, 989–1000 (2011). [DOI] [PubMed] [Google Scholar]
- 34.Yaeger R & Corcoran RB Targeting Alterations in the RAF-MEK Pathway. Cancer Discov. 9, 329–341 (2019). [DOI] [PMC free article] [PubMed] [Google Scholar]
- 35.Sos ML et al. Oncogene mimicry as a mechanism of primary resistance to BRAF inhibitors. Cell Rep. 8, 1037–1048 (2014). [DOI] [PMC free article] [PubMed] [Google Scholar]
- 36.Kung JE & Jura N Prospects for pharmacological targeting of pseudokinases. Nat. Rev. Drug Discov (2019) doi: 10.1038/s41573-019-0018-3. [DOI] [PMC free article] [PubMed] [Google Scholar]
- 37.Kabsch W XDS. Acta Crystallogr. D Biol. Crystallogr 66, 125–132 (2010). [DOI] [PMC free article] [PubMed] [Google Scholar]
- 38.McCoy AJ et al. Phaser crystallographic software. J. Appl. Crystallogr 40, 658–674 (2007). [DOI] [PMC free article] [PubMed] [Google Scholar]
- 39.Emsley P, Lohkamp B, Scott WG & Cowtan K Features and development of Coot. Acta Crystallogr. D Biol. Crystallogr 66, 486–501 (2010). [DOI] [PMC free article] [PubMed] [Google Scholar]
- 40.Moriarty NW, Grosse-Kunstleve RW & Adams PD electronic Ligand Builder and Optimization Workbench (eLBOW): a tool for ligand coordinate and restraint generation. Acta Crystallogr. D Biol. Crystallogr 65, 1074–1080 (2009). [DOI] [PMC free article] [PubMed] [Google Scholar]
- 41.Afonine PV et al. Towards automated crystallographic structure refinement with phenix.refine. Acta Crystallogr. D Biol. Crystallogr 68, 352–367 (2012). [DOI] [PMC free article] [PubMed] [Google Scholar]
- 42.Vasta JD et al. Quantitative, Wide-Spectrum Kinase Profiling in Live Cells for Assessing the Effect of Cellular ATP on Target Engagement. Cell Chem Biol 25, 206–214.e11 (2018). [DOI] [PMC free article] [PubMed] [Google Scholar]
- 43.Viswanatha R, Li Z, Hu Y & Perrimon N Pooled genome-wide CRISPR screening for basal and context-specific fitness gene essentiality in Drosophila cells. Elife 7, (2018). [DOI] [PMC free article] [PubMed] [Google Scholar]
- 44.Strub T et al. SIRT6 haploinsufficiency induces BRAFV600E melanoma cell resistance to MAPK inhibitors via IGF signalling. Nature Communications vol. 9 (2018). [DOI] [PMC free article] [PubMed] [Google Scholar]
- 45.Rajakulendran T, Sahmi M, Lefrançois M, Sicheri F & Therrien M A dimerization-dependent mechanism drives RAF catalytic activation. Nature 461, 542–545 (2009). [DOI] [PubMed] [Google Scholar]
- 46.Lavoie H et al. MEK drives BRAF activation through allosteric control of KSR proteins. Nature 554, 549–553 (2018). [DOI] [PMC free article] [PubMed] [Google Scholar]
Associated Data
This section collects any data citations, data availability statements, or supplementary materials included in this article.