Abstract
TRAAK is an ion channel from the two-pore domain potassium (K2P) channel family with roles in maintaining the resting membrane potential and fast action potential conduction. Regulated by a wide range of physical and chemical stimuli, the affinity and selectivity of K2P4.1 towards lipids remains poorly understood. Here we show the two isoforms of K2P4.1 have distinct binding preferences for lipids dependent on acyl chain length and position on the glycerol backbone. Unexpectedly, the channel can also discriminate the fatty acid linkage at the sn-1 position. Of the 33 lipids interrogated using native mass spectrometry, phosphatidic acid (PA) had the lowest equilibrium dissociation constants for both isoforms of K2P4.1. Liposome potassium flux assays with K2P4.1 reconstituted in defined lipid environments show that those containing PA activate the channel in a dose-dependent fashion. Our results begin to define the molecular requirements for the specific binding of lipids to K2P4.1.
Introduction
Two-pore domain potassium (K2P) channels are responsible for maintenance of the resting membrane potential and involved in numerous biological functions. Their function has been linked to a number of physiological processes, such as neuroprotection, vasodilation, brain metabolism, and perception of pain and temperature.1–4 Dysfunction of K2P channels underlies a number of human pathologies and even some cancers.5,6 As a result, they have emerged as attractive therapeutic targets in depression, memory disorders, and pain.5–7
Predominantly expressed throughout the entire nervous system, the TREK (TWIK-RElated K+ channel, where TWIK is Tandem of pore domains in a Weak Inwardly Rectifying K+ channel) subfamily of K2P channels (K2P2.1/TREK-1, K2P10.1/TREK-2, and K2P4.1/TRAAK) are modulated by diverse stimuli including anesthetics and natural effectors such as lipids, temperature, and pressure.5–10 More specifically, electrophysiology studies have demonstrated that the TREK subfamily can be stimulated by the addition of phospholipids, such as phosphatidic acid (PA), phosphatidylethanolamine (PE), phosphatidylinositol (PI), phosphatidylglycerol (PG), and phosphatidylserine (PS).11,12 The signaling lipid, phosphatidylinositol 4,5-bisphosphate (PI(4,5)P2), is more complex but appears to inhibit K2P2.1.9,12,13 Phosphatidylethanol (PEth), an alcohol metabolite generated by phospholipase D, has been shown to compete with PA binding to K2P2.1 and inhibit the channel.14 The TREK subfamily is also reversibly opened by polyunsaturated fatty acids.15 As an example, the K2P4.1 (TRAAK, TWIK-RElated Arachidonic Acid activated K+ channel) is activated by arachidonic acid and to a larger extent by docosahexaenoic acid.15 TREK channels are also stimulated by lysophospholipids, such as lysophosphatidic acid.16–18 Although functional assays demonstrate the regulation of the TREK subfamily by lipids, there is an emerging necessity for novel approaches to directly measure individual lipid binding events to better understand ion channel affinity and selectivity towards lipids.
A number of crystal structures for all members of the TREK subfamily have provided insight into channel gating mechanisms and small molecule binding, including sites for activators and inhibitors.19–22 The structures of the three members have a similar fold with four transmembrane helices (TM1 to TM4), an extracellular helical cap domain, and two pore-forming regions per chain (P1 and P2).19–23 The structures populate two main states referred to as “up” (TM4 from one subunit is packed up against TM2 of the other subunit) and “down” (TM4 traverses the membrane without buckling at the hinge glycine) with the latter representing the non-conductive state.21,23–25 An intramembrane opening between subunits located above TM4 is penetrated by electron density for a lipid-like molecule in structures of K2P4.1 and K2P10.1, both in the “down” state.20,21 For K2P4.1, a model for gating and mechanosensitivity proposes this lipid accesses the central cavity to sterically block ion conduction but absent in the conductive “up” state.20,24 Other lipids bound in different locations have also been resolved in structures of K2P2.1 and K2P10.1.21,22 However, the identity and role of these lipids remains largely unknown.
Native mass spectrometry (MS) is an emerging biophysical technique, especially for investigating membrane proteins and their interactions with small molecules, such as lipids.26 Unlike other biophysical techniques, native MS can interrogate individual ligand-binding events to protein complexes while preserving non-covalent interactions in the mass spectrometer.27–29 Native MS has revealed that protein-lipid interactions can stabilize protein complexes28,30 and the selectivity of phosphoinositide binding to a mammalian G-protein-gated inward rectifying channel.31 The technique has also been employed to determine equilibrium binding constants and thermodynamics for protein-protein and protein-ligand interactions that are in direct agreement with other biophysical techniques, such as isothermal titration calorimetry and surface plasmon resonance.32,33 More recently, native MS has uncovered that specific protein-lipid interactions can allosterically modulate other interactions with protein,33,34 lipid,35 and drug36,37 molecules.
Here, we combine native MS and functional assays to better understand how lipids modulate the structure and function of K2P4.1. We find that the expression and purification of K2P4.1 following methods established for structural studies19,24,38 yields impure material resulting from a heterogenous N-terminus. These results prompted us to optimize the expression and purification of K2P4.1 isoforms. The optimized samples enabled screening of 33 lipids for their ability to bind K2P4.1 isoforms using a high-resolution native mass spectrometer.37,39 Of the lipids screened, equilibrium dissociation constants (KD) were determined for a subset of lipids to the two isoforms of K2P4.1. We identified lipids that bind avidly to K2P4.1 isoforms and reveal an unexpected preference toward the linkage of the lipid and tail chemistry. Functional assays show that phosphatidic acid, which has the highest binding affinity to K2P4.1, activates the channel in a dose-dependent fashion.
Results
Optimization of K2P4.1 for native MS studies.
Our first objective was to obtain pure samples of K2P4.1 such that individual lipid binding events to the channel can be resolved in a native mass spectrum. The truncated channel (K2P4.1b, residues 1–290, Uniprot Q9NYG8–2) expressed as a C-terminal fusion and purified in n-decyl-β-D-maltopyranoside (DM) was subjected to native MS analysis using a Waters Synapt G1 instrument revealing a mass spectrum containing broad mass spectral peaks (Fig. 1A). The measured mass for the dimeric fusion protein complex was 123.3 kDa that is smaller than the calculated mass (123.4 kDa). We next employed a detergent screening approach27 (Extended Data Fig. 1) and found that the channel purified in the pentaethylene glycol monodecyl ether (C10E5) and other detergents resulted in mass spectra with improved qualities (Extended Data Fig. 1). After removal of the fusion protein, K2P4.1b was purified in the C10E5 detergent and subjected to analysis on a higher-resolution Orbitrap mass spectrometer (Thermo Scientific) equipped with a Rear Entry Ion Source (REIS).37,39 The mass spectrum displayed sharp mass spectral peaks and revealed small adducts that were previously unable to resolve in the lower-resolution mass spectrum (Fig. 1B). Deconvolution of the lower- resolution mass spectrum revealed multiple molecular species that were lower than the calculated value (Fig. 1C). The observed subunit heterogeneity is likely the result of truncated forms of K2P4.1b at the N-terminus that would be difficult to ascertain using traditional approaches, such as gel-based electrophoresis.40After optimization of the expression construct (see methods), we found that K2P4.1b and the shorter isoform, K2P4.1a (residues 1–264, Uniprot Q9NYG8–1) encompassing residues 26–264 of K2P4.1b, expressed with affinity tags at both termini resulted in purification of homogenous protein material (Extended Data Fig. 1B).
Figure 1. Optimization of human K2P4.1 isoforms for high-resolution native mass spectrometry studies.
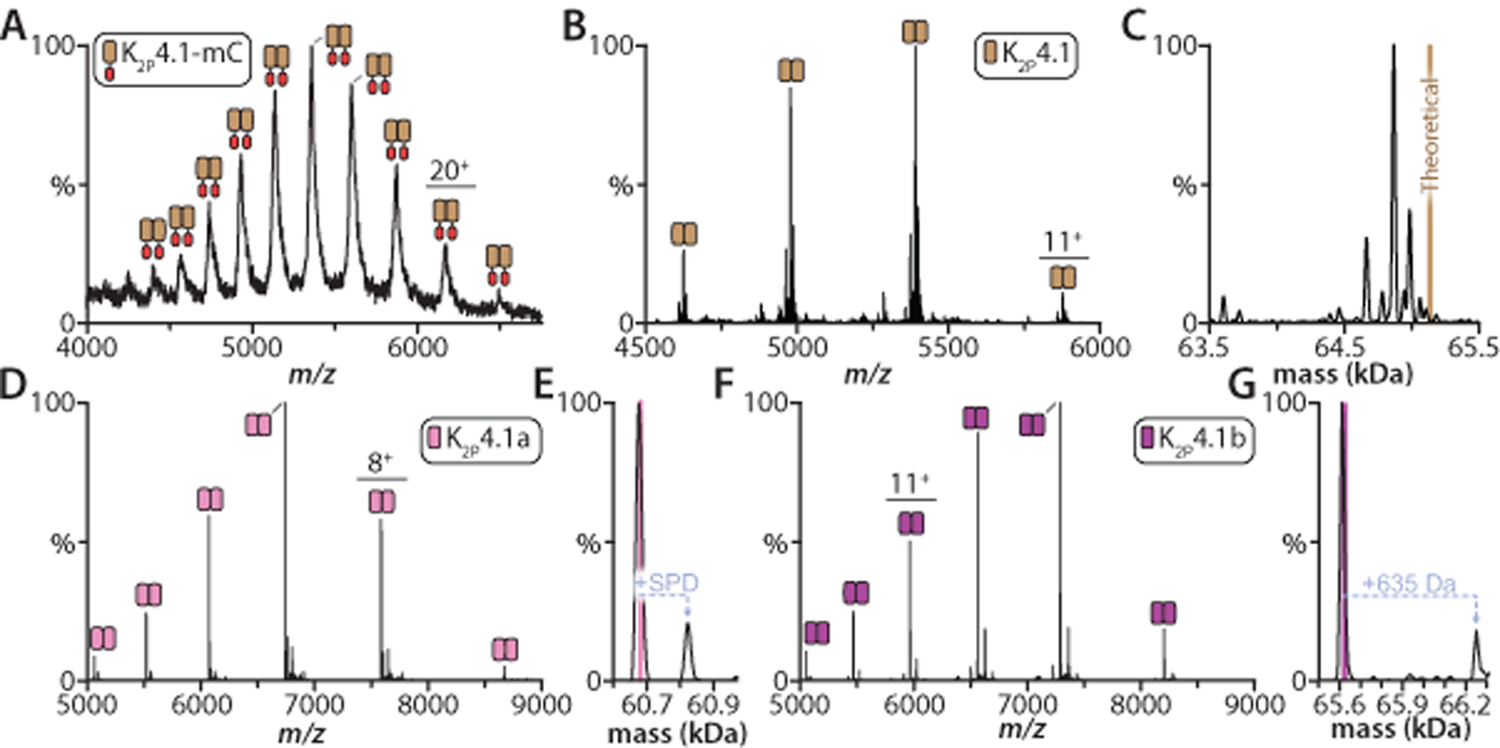
A) Mass spectrum of K2P4.1 as a C-terminal fusion in decyl-β-D-maltopyranoside (DM) recorded under activating, non-native conditions on a Synapt G1 HDMS instrument (see methods). The TEV protease cleavable C-terminal fusion consists of mCherry (mC) followed by affinity tags. B) Mass spectrum of the K2P4.1 with C-terminal fusion protein removed by TEV protease treatment and purification in the pentaethylene glycol monodecyl ether (C10E5) detergent. Data recorded on the extended mass range (EMR) Orbitrap. C) Deconvolution of the mass spectrum shown in panel B. The theoretical mass of the dimer is denoted by a brown line. D) Mass spectrum of K2P4.1a expressed with fusions on the N- and C-terminus in C10E5 and 10 mM spermidine. The sample has been treated to remove fusion tags. E) Deconvolution of the mass spectrum shown in panel D. Pink line denotes the theoretical mass for the dimer (60,684 Da) and the measured mass is 60,678 ± 6 Da. F) K2P4.1b was expressed with affinity tags fused to both termini. Mass spectrum of K2P4.1b with tags removed and solubilized in C10E5 and 10 mM spermidine. G) Deconvolution of the K2P4.1b mass shown as described in C. The measured mass is 65,616 ± 10 Da compared to the theoretical mass of 65,622 Da Mass spectra for panels D and E were acquired on the Rear Entry Ion Source Orbitrap.39
We also optimized buffer conditions to include the addition of spermidine, a charge-reducing molecule that preserves protein structure and integrity of non-covalent protein-lipid interactions within the mass spectrometer.41 Under these conditions, the average charge state of K2P4.1a was reduced (Fig. 1D and Extended Data Fig. 1C), A single spermidine bound to the dimeric K2P4.1a complex is observed, which highlights the gentle conditions of the tuned Rear Entry Ion Source Orbitrap mass spectrometer39 (Fig. 1D–E). Similar results were found for K2P4.1b samples in the presence of spermidine with the exception of a larger adduct peak (Fig. 1F–G), which dissociates from the complex under increased activation conditions on the instrument. The 635 ± 5 Da adduct is most likely composed of one spermidine and one DM (totaling 631 Da); residual detergent post detergent exchange using gel filtration is commonly observed. The optimized samples were also analyzed using ion mobility mass spectrometry (IM-MS), a technique that reports on the rotationally averaged collision cross section (CCS),42 to confirm that K2P4.1 retains a native-like structure. The first measurements, performed on a Synapt G1 instrument, resulted in compact, native-like arrival time distributions (ATDs) for all charge states (Extended Data Fig. 1C). In fact, the significant reduction in charge on K2P4.1 preserved native-like structure as evident by no change in the ATD even with application of the highest collision energy (240V) on the instrument (Extended Data Fig. 1D). We next performed measurements on a custom-built Orbitrap Ultra High Mass Range (UHMR) modified with REIS and a 1.5 meter periodic focusing drift tube operating in the FT-mode.43 The first principles CCS for the K2P4.1a was is in agreement with those calculated for the crystal structure of K2P4.1 (Extended Data Fig. 1E–F). In short, the optimized conditions preserve native-like structure and enable characterization of non-covalent interactions of K2P4.1 with small molecules, such as lipids.
Identifying lipids that bind avidly.
We next screened the ability of K2P4.1a to bind a set of lipids (Supplementary Table 1, 33 in total) that included lipids found in the nervous system44 where K2P4.1 functions.45 As a starting point, we recorded native mass spectra for K2P4.1a solubilized in C10E5 and doped with 10 mM of the charge-reducing molecule spermidine and 20 μM of lipid. Native mass spectra of these protein-lipid mixtures revealed that 11 of the lipids in our set poorly bound the channel (Extended Data Fig. 2). This was evident from weak or no signal observed for lipid bound species of K2P4.1a. The list of non-binders includes sphingomyelin and ceramide phosphoethanolamine that are found in the peripheral and central nervous system. These lipids contain a sphingoid base backbone44 that differs from glycerophospholipids which could account for their poor binding affinity to K2P4.1a.
Figure 2. Determination of equilibrium dissociation constants (KD) for individual lipid binding events to K2P4.1a.
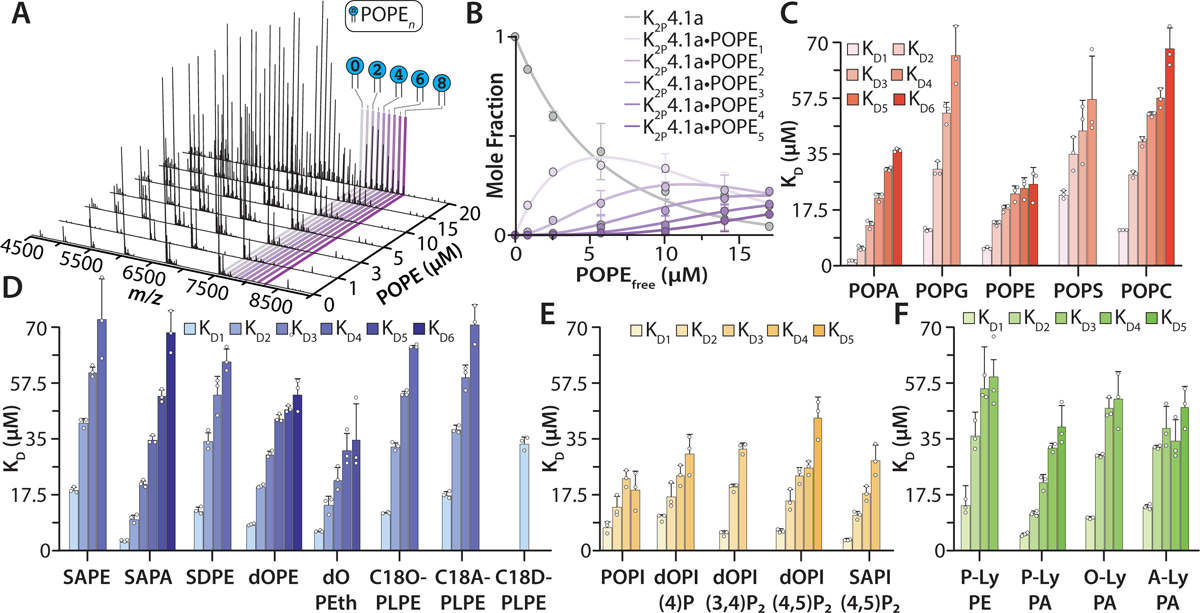
A) Representative mass spectra collected on the Orbitrap of K2P4.1a titrated with phosphatidylethanolamine (PE) having 1-palmitoyl-2-oleoyl (PO, 16:0−18:1) tails collected at room temperature. The protein-lipid mixtures were in C10E5 and 10 mM spermidine. B) Plot of mole fraction data for K2P4.1a and K2P4.1a(POPE)1−5 determined from a titration series of POPE (dots) and resulting fit (R2 = 0.99) from a sequential lipid-binding model (solid lines). C) KD values for phosphatidic acid (PA), PE, phosphatidylglycerol (PG), phosphatidylcholine (PC), and phosphatidylserine (PS) containing PO tails binding to K2P4.1a. D) Binding constants for PA and PE with different acyl chains and phosphatidylethanol (PEth). Ethanolamine plasmalogen (PL) contain a vinyl ether linkage at the sn-1 position. E) KD values for binding phosphatidylinositol (PI) and phosphoinositdes (PIPs) to K2P4.1a. F) KD values for lyso (Ly) PE and PA lipids that contain only one acyl chain at the sn-1 position. Lipid abbreviations are provided in Supplementary Table 1. Data are presented as the mean ± standard deviation (n = 3) for three independent experiments (white dots).
Determining equilibrium dissociation binding constants.
After identifying a subset of lipids that bind avidly to K2P4.1a, we then applied an native MS approach32 to determine the equilibrium dissociation constants (KD) for individual lipid binding events to the channel. The first set of lipids investigated contained 1-palmitoyl-2-oleoyl (16:0–18:1, PO) acyl chains with different headgroups: phosphatidic acid (PA), phosphatidylcholine (PC), phosphatidylethanolamine (PE), phosphatidylglycerol (PG), and phosphatidylserine (PS). Focusing on POPE, up to eight binding events were observed and the mole fraction of apo and lipid bound species were determined from deconvoluted mass spectra data in the titration series (Fig. 2A–B). A sequential lipid binding model was then globally fitted to the mole fraction data to determine KDn for K2P4.1a binding the nth lipid (Fig. 2B). In a similar fashion, the KD values were determined for POPA, POPC, POPG, and POPS (Supplementary Table 2 and Extended Data Fig. 3). Of the three anionic lipids, POPS had the weakest binding affinity (KD1 of 22.3 ± 0.1 μM). In contrast, POPA avidly binds K2P4.1a with a KD1 of 1.3 ± 0.1 μM. Notably, the third anionic lipid POPG has a KD1 that is more than three-fold greater than that for POPA. The KD for all POPC binding events was greater than two-fold compared to POPE implicating specificity of the PE binding site(s). These findings reveal the selectivity of K2P4.1a toward the headgroup of lipids with a strong preference toward PA and PE.
The binding affinity of K2P4.1a for PA and PE lipids prompted us to further investigate the specificity of their binding site(s). First, the impact of acyl chain chemistry on binding affinity for PA and PE was explored (Fig. 2D, Extended Data Fig. 3–4, and Supplementary Table 2). PA harboring 1-stearoyl-2-arachidonoyl (18:0–20:4, SA) acyl chains resulted in KD values that were two-fold higher than POPA. PE with 1,2-oleoyl (18:0–18:0, dO), SA, and 1-stearoyl-2-docosahexaenoyl (18:0–22:6, SD) acyl chains also showed altered binding affinity for K2P4.1a. The most pronounced difference was for SAPE and SDPE with a greater than two-fold increase in KD values compared to POPE. Second, phosphatidylethanol (PEth) - an alcohol metabolite generated by phospholipase D and a known TREK-1 inhibitor14 - differs from PA by two methyl groups and binds K2P4.1a with a KD1 of 5.9 ± 0.5 μM, which is more than four-fold higher compared to POPA (Fig. 2D). Third, plasmalogens are a subclass of glycerophospholipids with vinyl ether bonds at the sn-1 position of the glycerol moiety and play important roles in the mammalian brain.46 The binding constants for ethanolamine C18O-PLPE and C18A-PLPE were statistically indistinguishable and more than two-fold greater compared to POPE. Plasmalogen PE containing 18:0–22:6 tails (C18D-PLPE) had markedly weaker binding affinity (KD1 of 33.6 ± 2.1 μM); a result in contrast with PE where SDPE showed increased affinity compared to SAPE. Taken together, K2P4.1 displays a marked selectivity towards the chemistry of lipids, such as discerning acyl chains and astonishingly the linkage at the sn-1 position.
As signaling lipids have been reported to regulate the TREK subfamily,9,11 we conducted titrations of K2P4.1a with phosphoinositol (PI) and selected phosphoinositides (PIPs) (Fig. 2F, Extended Data Fig. 3–4, and Supplementary Table 2). PI with PO tails did not bind as avidly as POPA. Of the phosphoinositides, PI(4,5)P2 had the highest binding affinities, but was also acyl chain dependent with those harboring SA displaying smaller KDs. PI 4-monophosphate binding with dO acyl chains (dOPI(4)P) was comparable to POPI. The additional phosphates of PI 3,4,5-triphosphate containing SA chains (SAPI(3,4,5)P3) dramatically impeded binding with a KD1 that was almost ten-fold greater than SAPI(4,5)P2. These results show that PIPs, such as dOPI(4,5)P2, bind K2P4.1a with comparable affinities to their parent molecule, PI.
We next interrogated the interaction of K2P4.1a with lysolipids, molecules that are known to stimulate K2P4.1 and other K2P channels16,18 (Fig. 2F, Extended Data Fig. 3–4 and Supplementary Table 2). Lysophosphatidic acid and lysophosphatidylethanolamine containing a palmitoyl acyl chain in the sn-1 position (P-LyPE and P-LyPA, respectively) had KD values that were more than two-fold different from each other. P-LyPA had a KD1 of 4.8 ± 0.4 μM. Interestingly, lengthening of the LyPA acyl chain to either oleoyl and arachidonoyl (O-LyPA and A-LyPA, respectively) resulted in KD1 increasing by greater than two-fold (Fig. 2F). These finding reveal an unexpected selectivity towards the acyl chain at the sn-1 position of PA and binding affinity is enhanced with a fatty acid in the sn-2 position.
We next set out to characterize the lipid binding properties of the longer isoform K2P4.1b (Fig. 3, Extended Data Fig. 5–6, and Supplementary Table 3). Of the PO-type lipids, POPA bound with the highest affinity to K2P4.1b with a KD1 that is two-fold higher compared to K2P4.1a (student’s t-test, p = 0.003). Unlike the shorter isoform, POPS and POPG showed comparable binding to the longer isoform. In general, the trends in binding different acyl chain variants of PA and PE were comparable to the shorter isoform. There was a two-fold reduction in SAPA binding to K2P4.1a compared to POPA, whereas the longer isoform experiences no change in SAPA binding (p = 0.015). Considering plasmalogen PE, no differences were observed for the binding of C18O-PLPE whereas the binding of C18A-PLPE was significantly reduced compared to binding K2P4.1a (p =0.001). In fact, the longer acyl chain variant of plasmalogen PE, C18D-PLPE weakly bound K2P4.1b (no KDs determined) whereas K2P4.1a had a KD1 of 33.6 ± 2.1 μM. In contrast to K2P4.1a, the binding affinity of K2P4.1b towards PI and PIPs were comparable with the exception of SAPI(4,5)P2. Of the LyPA lipids, the highest binding was for O-LyPA (KD1 of 3.50 ± 0.35 μM) followed by P-LyPA and A-LyPA with KD1 of ~9 μM. Although the binding affinity of P-LyPE is similar, the longer isoform adopts an appreciable affinity for P-LyPC, a lysolipid reported to activate K2P4.1,18 whereas no KDs were determined for K2P4.1a. These results demonstrate distinct changes in the lipid binding affinity of K2P4.1b as a result of the additional 26 N-terminal residues.
Figure 3. Biophysical characterization of individual lipid binding events to K2P4.1b.
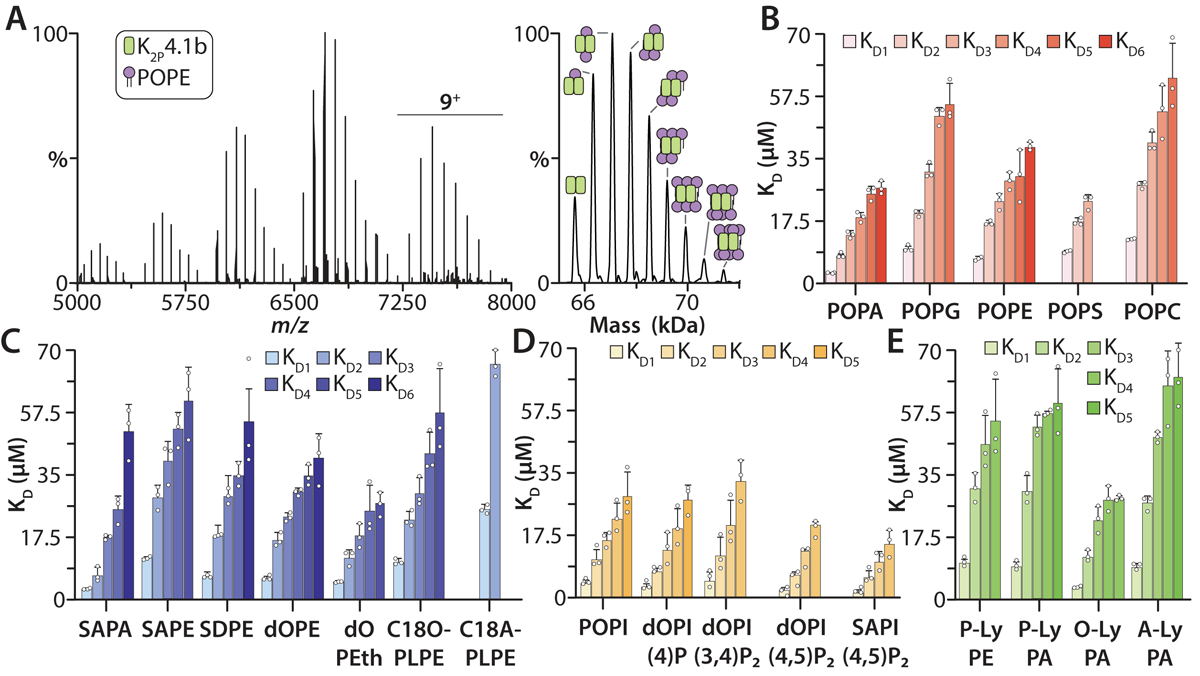
A) Representative mass spectra of K2P4.1b with 20 μM POPE in C10E5 and 10 mM spermidine collected at room temperature. Deconvolution of the mass spectrum is shown to the right. B) Binding constants for PO-type lipids binding to K2P4.1b. C) KD values for K2P4.1b binding PA and PE with different acyl chains and PEth. The different linkage of PL lipids impacts their bind affinity to K2P4.1b. D) Binding constants for binding PI and PIPs to K2P4.1b. E) KD values for LyPE and LyPA lipids binding to K2P4.1b. Lipid abbreviations are listed in Supplementary Table 1. Data are presented as the mean ± standard deviation (n = 3) for three independent experiments (white dots).
Functional assays in defined lipid environments.
To better understand the connection between binding affinity and impact on channel function, liposome flux assays were conducted for K2P4.1a reconstituted in defined lipid environments (Fig. 4 and Extended Data Fig. 7). The channel was initially reconstituted into liposomes composed of POPC containing 15% mole fraction of either POPA, POPE, POPS or POPG. (Fig. 4A–B). The largest potassium flux observed was for the proteoliposomes containing POPG and POPA, one of which was the lipid with the lowest KD values. The next largest efflux observed was for those containing POPS. Most interestingly, the smallest flux observed was POPC only and those containing POPE, a lipid that is the second tightest binder of K2P4.1a. As potassium efflux was the greatest for those containing anionic lipids, we repeated the flux assay using POPC liposomes doped with 5% POPG or POPA. Efflux was greatest for those containing POPA compared to POPG indicating POPA is a more potent channel activator (Fig. 4B). The efflux for the lipid mixtures does not arise from different levels of incorporation of K2P4.1a into proteoliposomes (Extended Data Fig. 7E–F). We next conducted a dose-response study to further characterize the activation of K2P4.1a by POPA. Concomitant with the mole fraction of POPA was an increase in the flux measured for K2P4.1a demonstrating a dose response (Fig. 4C).
Figure 4. Liposome potassium flux assays of K2P4.1a reconstituted in defined lipid environments.
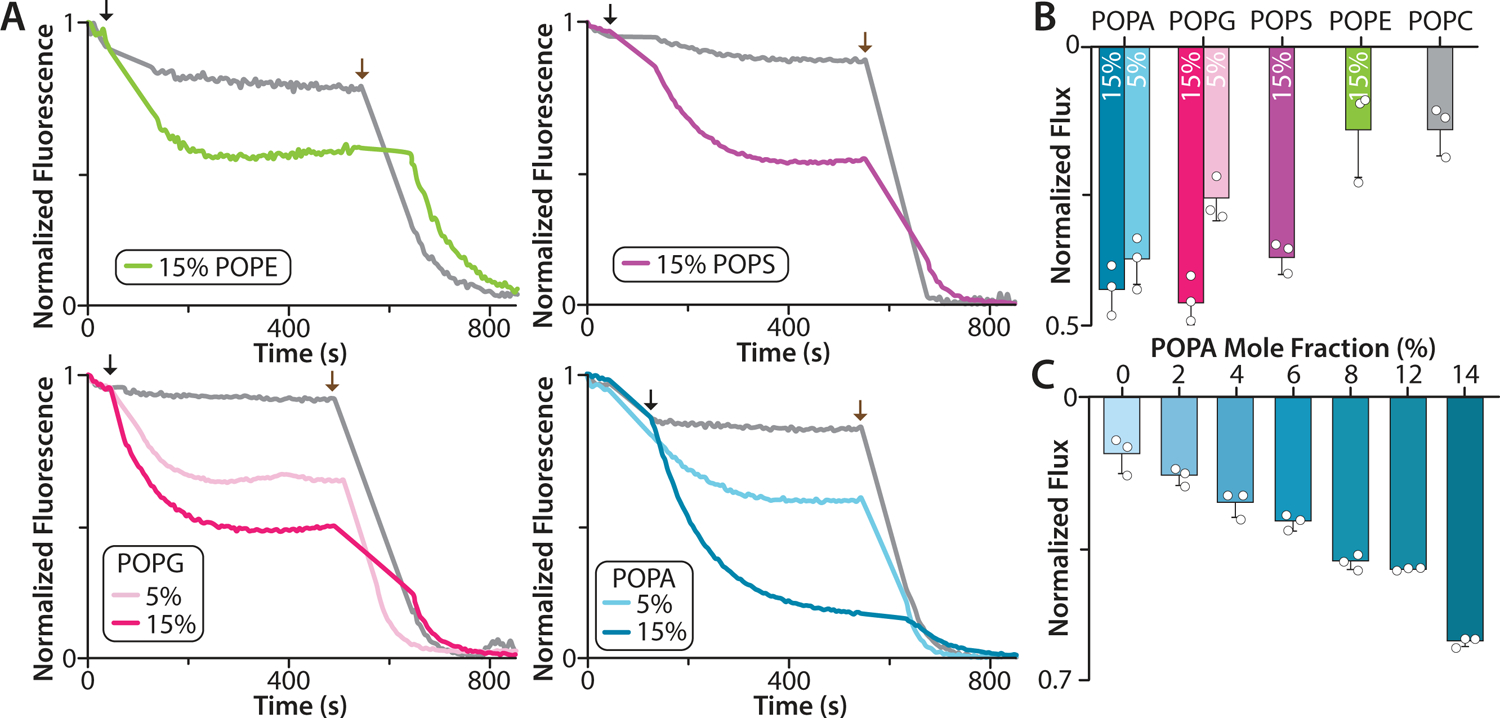
A) Flux assay traces for K2P4.1a reconstituted in POPC doped with POPG, POPS, POPE, or POPA. Empty liposomes of the same lipid composition are shown in grey. The addition of the proton ionophore carbonyl cyanide m-chlorophenylhydrazone and the potassium ionophore valinomycin is denoted by black and brown arrows, respectively. The mole fraction (%) of doped lipid is shown in the inset. B) Normalized K2P4.1a flux in POPC with 15% POPG, POPS, POPS, or POPA. The normalized flux for POPC with 5% POPG or POPA is shown. C) K2P4.1a potassium efflux in POPC containing different mole fractions of POPA. Data are presented as the mean ± standard deviation (n = 3) for three independent experiments (white dots).
Discussion
Biophysical characterization of individual lipid binding events to K2P4.1a and K2P4.1b has illuminated their selectivity toward lipids. We find that K2P4.1a is exquisitely selective for binding of PA and PE lipids. In the case of LyPA, the channel can unexpectedly discriminate acyl chain lengths at the sn-1 position that is isoform dependent. The binding affinity for PA is enhanced with a fatty acid in the sn-2 position. K2P4.1 isoforms display unique preferences for the acyl chains of PE that includes their length and degrees of unsaturation. For example, K2P4.1a binds with less affinity to SAPE and SDPE, longer chain lipids that are abundant in the brain.47 The affinity for PE appears to be reduced when the sn-2 fatty acid is replaced by a hydroxyl i.e. LyPE. Most interestingly, the interaction of PE with both isoforms of K2P4.1 is selective to the sn-1 linkage where binding is reduced when the ester is replaced by a vinyl ether i.e. plasmalogen. These findings demonstrate the remarkable selectivity of K2P4.1 isoforms toward lipid chemistry, such as the type of fatty acid linkage.
A fluorescent lipid binding assay performed has recently been used to characterize lipid interactions with TREK channels in solution.9,14 This assay involves the use of a non-natural PI(4,5)P2 with a fluorescent moiety installed on the sn-1 acyl chain and binding is monitored through fluorescence or bioluminescent resonance energy transfer measurements. Hansen and co-workers have performed fluorescent PI(4,5)P2 competition experiments for K2P4.1 where the bound fluorescent PI(4,5)P2 lipid is competed off with non-fluorescent lipids.9,14 From these competition experiments, they report PA and PI(4,5)P2 with eight carbon acyl chains bind K2P4.1 solubilized in dodecylmaltoside (DDM) with a KD of 8.5 ± 0.6 μM and 1.4 ± 0.3 μM, respectively.9 The same group using the same fluorescent PI(4,5)P2 competition assay later reported that K2P4.1 in DDM binds dOPeth with a KD of 106 ± 30 μM,14 which is nearly 20-fold higher than KD1 determined from native MS. There are a number of underlying issues that thwart the direct comparison of the KD values derived from previous competition assays and those obtained from native MS measurements. First, Hansen and co-workers express and purify K2P4.1b following methods established for structural studies,19,20,38 which we report here is a mixture of proteoforms. This is important as we find the two isoforms of K2P4.1, in some cases, have different binding preferences for lipids. Moreover, it is unclear if samples in DDM contain co-purified lipids, which we have recently shown impedes cooperative binding of PI(4,5)P2 to Kir3.2, an inward rectifying potassium channel.48 Second, the fluorescent lipid binding assay was carried out in a different detergent and detergent can have a marked impact on lipid binding.48 Third, we find that both isoforms K2P4.1 are sensitive to lipid tails making it difficult to compare binding data for short chain forms of PA and PI(4,5)P2 to their physiological counterparts. Fourth, it is difficult to discern in the PI(4,5)P2 competition assays if the lipids directly compete with fluorescent PI(4,5)P2 binding or bind in remote locations that allosterically modulate the binding of fluorescent PI(4,5)P2. Fifth, a prerequisite for the fluorescent lipid binding assay is a high-affinity, specific lipid binding site(s), for example Kir3.2 binding phosphoinositides.48 Lastly, the fluorescent lipid binding assay is an ensemble measurement whereas native MS can resolve individual binding events, which is necessary to accurately measure KDn for binding of the nth lipid.
Results from native MS and liposome flux assays taken together demonstrate a relationship between lipid binding affinity and channel activity. POPA, the lipid with highest binding affinity to both isoforms of K2P4.1, displayed a dose-dependent activation of the channel as determined by potassium efflux assays. Comoglio et al. have reported activation of K2P4.1 in cell assays,12 however the relevance of the activation by PA was unclear as the C-terminus does not recruit phospholipase D2, an enzyme responsible for the hydrolysis of PC to PA. However, the C-terminus of TREK-1 and TREK-2 recruit PLD2 that enables local production of PA,12 which has been estimated to reach more than ~3.5 mM, which is ~2,600 fold greater than KD1 for K2P4.1a.49 As K2P4.1 is known to heterodimerize with TREK-1 and −2,50 the TREK-1 or TREK-2 subunit within the complex can recruit PLD2 leading to local generation of PA followed by activation of the heterodimeric channel. Taken together, the high binding affinity and selectivity reported here for PA, combined with the fact the TREK subfamily members heterodimerize,50 makes the interaction between K2P4.1 and PA of great biological importance.
In summary, our findings begin to define the molecular requirements for specific binding of lipids to K2P4.1 isoforms. Moreover, our results provide compelling evidence for specific PA and PE binding site(s). The differences in lipid binding between K2P4.1 isoforms may indicate different sensitivities to lipids in the bilayer giving rise to distinct biophysical properties. In closing, our findings provide the foundation for future studies characterizing the interaction of K2P channels with lipids and other small molecules.
Online Methods
Construction of expression plasmids.
The plasmid for expression of truncated Human K2P4.1 isoforms in Pichia pastoris was based on methods established for structural studies24 with the following modifications. The KCNK4 (K2P4.1b, residues 1–290, Uniprot Q9NYG8–2) gene with incorporated mutations to remove N-linked glycosylation sites (N104Q/N108Q) was codon-optimized for Pichia pastoris using the Codon Optimization Tool available on the Integrated DNA Technologies (IDT) website and synthesized as a gBlock gene fragment (IDT). The gene was cloned into a modified pPICZ (Thermo Fisher Scientific) expression vector (AddGene #140745) using HiFi DNA Assembly (New England Biolabs, NEB) following the manufacturers protocol. The resulting construct expresses K2P4.1b (pPIC-K2P4.1b-mC-S-H) as a Tobacco Etch Virus (TEV) protease cleavable C-terminal fusion to the monomeric red fluorescent protein (mCherry)51 followed by a Strep-tag II and His6 tag. The shorter isoform of K2P4.1 (K2P4.1a, residues 1–264, Uniprot Q9NYG8–1) was generated by removal of the 26 N-terminal residues in pPIC-K2P4.1b-mC-S-H using primers designed with the online NEBaseChanger tool (NEB) and constructed using the KLD enzyme mix (NEB) following the manufacturers protocol. To improve sample quality, the K2P4.1 isoforms (described above) were cloned using HiFi DNA Assembly (NEB) into a modified pPICZ vector to express the protein with TEV protease cleavable fusions to a N-terminal His6 tag and C-terminal mCherry and Strep-tag II. All expression constructs were verified by DNA sequencing. The double tag expression constructs of K2P4.1a and K2P4.1b have been deposited at Addgene as #158743 and #158744, respectively.
Expression and purification of K2P4.1 isoforms.
Expression plasmids were amplified by polymerase chain reaction with Q5 High-Fidelity PCR (NEB) with primers flanking the PmeI restriction site (pIC_LINEAR_F: 5’-GCTGTCTTGGAACCTA-ATATG-3’; pIC_LINEAR_R: 5’-TGTCAGTTTTGGGCCATTTG-3’). The linearized plasmids were purified by agarose gel electrophoresis and extracted from gel slices using a gel extraction kit (Omega BioTek). The purified plasmids were introduced into Glycoswitch Komagataella phaffii SuperMan5 (och1-Δ1, GAP-mannosidaseHDEL, pep4-Δ1, prb1-Δ1) strain (BioGrammatics Inc) by electroporation (ECM 630, BTX) following manufacturers protocol. Transformants were selected on agar plates containing 1 mg/ml of zeocin. A high-throughput expression screen52 was adapted for selection of high-level expressing transformants. In brief, individual colonies were inoculated into 0.5 mL YPD (1 % yeast extract, 1% peptone, 2% dextrose) in a 96 deep-well block supplemented with 50 μg/ml zeocin. After a 24-hour growth period in a shaking benchtop incubator (30 °C, 900 rpm, VWR), 50μL of each well was transferred to a 96 well block with 800μL of BMGY (buffered complex glycerol medium) in each well. Cells were grown for 24 hours, centrifuged at 2000xg for 5 minutes, and media exchanged with 800μL BMMY (buffered complex methanol medium, 0.5% methanol). After a 48-hour time period, the cells were centrifuged at 2000xg for 5 minutes. The highest expressing clones based on mCherry expression levels (i.e. cell pellets pink in color) were selected for scale-up expression. For large-scale expression, expression strains were inoculated into 50 mL of YPD and grown overnight at 30 °C. The overnight culture was used to inoculate 600 mL of BMGY. After 24 hours of growth at 30 °C, the cells were centrifuged in a sterile 1 L centrifuge bottle at 2000xg for 5 minutes. The supernatant was discarded, and cell pellet was resuspended in 600 mL of BMMY. After 48 hours, cells were harvested by centrifugation (2000xg for 5 minutes). Cell pellets were resuspended in TBS buffer (50 mM Tris, 150 mM NaCl, pH 7.5 at room temperature) followed by centrifugation (2000xg for 5 minutes). Cell pellets were stored at −80 °C or used directly. Cell pellets were resuspended in lysis buffer (50 mM Tris pH 7.4 at room temperature, and 300mM potassium chloride) and lysed by four passages through a M110P Microfluidizer operating at 30,000 psi. The lysate was centrifuged at 20,000xg for 20 minutes at 4 °C to remove insoluble material and the supernatant was centrifuged at 100,000xg for 2 hours at 4 °C to pellet membranes. The purified membranes were resuspended in lysis buffer and homogenized using a glass tissue homogenizer (Wheaton). Unless otherwise stated, affinity purification and gel filtration chromatography were carried out at room temperature. Membrane proteins were extracted by the addition of 1% (w/v) n-Dodecyl-β-D-Maltopyranoside (DDM, Anatrace) and incubated overnight at 4 °C with gentle agitation. The extraction was clarified by centrifugation (20,000xg at 4 ˚C), filtered using a 0.45 μm syringe filter, and loaded onto a column packed with Ni-NTA superflow resin (Qiagen) equilibrated in KHA-DM buffer (200 mM KCl, 50 mM Tris pH 7.8 at room temperature, 10% glycerol, and 0.2% n-decyl-β-D-maltopyranoside (DM)). The column was then washed with KHA-DM supplemented with 20 mM imidazole and eluted with KHB-DM buffer (150 mM KCl, 50 mM Tris pH 7.8 at room temperature, 500 mM Imidazole, 10% glycerol, 0.2% DM). The eluted protein was loaded onto a 5 mL StrepTrap HP column (GE) equilibrated in KHA-DM and eluted with KHA-DM supplemented with 3 mM desthiobiotin. Peak fractions containing the eluted protein were pooled and loaded onto a HiPrep Desalting column equilibrated in KHA buffer. The pooled protein was digested with 10-fold molar excess of TEV protease (prepared in-house as previously described) to protein. After incubation overnight at room temperature, the protein sample was then injected onto a Superdex 200 Increase column (GE) equilibrated in GF Buffer (200 mM KCl, 20 mM HEPES, 10% glycerol) supplemented with 0.06% pentaethylene Glycol Monodecyl Ether (C10E5). Peak fractions containing the tag-less membrane protein were concentrated using a 50,000 MWCO centrifugal concentrator (Millipore). The concentration of the purified protein was determined by a DC Protein Assay Kit (Bio-Rad Laboratories) and this value was also used to determine an absorbance extinction coefficient at 280 nm of 0.18 μM−1cm−1.
Sample preparation for MS analysis.
Following established methods,27 the concentrated protein (~3 μM) was buffer exchanged into an aqueous ammonium acetate solution (200 mM ammonium acetate, 0.06% C10E5) using a centrifugal desalting column (Bio-Spin P-6 Gel Columns, Bio-Rad) for native mass spectrometry studies.
Preparation and titration of lipids.
Lipids were purchased from Avanti Polar Lipid and prepared as previously described.32 In brief, 1 mg of dried lipid films were resuspended in deionized water to a desired concentration (~5 mM) and stored at −80 °C. The concentrations of phospholipid stocks were confirmed by phosphorus analysis.53 Lipid stocks were sonicated for 10 min before dilution. Serial dilutions of lipids in MS buffer (200 mM ammonium acetate, 0.06% C10E5) were prepared to a concentration twice of the desired concentration. For lipid titrations, a final concentration of 500 nM K2P4.1 was mixed with lipid solutions and incubated for 1 min at room temperature prior to analysis. Consistent with previous studies of other membrane proteins,31–33 no difference in the abundance of lipid bound species was observed with longer incubation times.
Native ion mobility mass spectrometry.
Samples were loaded into gold-coated borosilicate glass capillaries prepared in-house and infused into the mass spectrometer using nanoelectrospray ionization with instrument settings tuned to minimize activation.27 K2P4.1 fusion proteins were analyzed on a Synapt G1 HDMS instrument (Waters Corporation) with the capillary voltage set to 2.00 kV, sampling cone voltage at 180 V, extraction cone voltage at 10.0 V and argon flow rate at 7 mL/min. The T-wave settings for trap (300 ms and 2.0 V), IMS (300 ms and 20.0 V) and transfer (100 ms and 10 V). A backing pressure of 5.3 mbar, source temperature of 80 ˚C, trap bias of 32 V, and trap and transfer collision voltage set to 150V and 50 V, respectively. For collision-induced unfolding (CIU) experiments, all instrument settings were constant with the exception that the trap collision voltage varied from 60 to 240 V in 10 V steps. CIU plots were generated using the program Pulsar.54 Impact55 was used to calculate CCS for crystal structures of K2P4.1.
Collision Cross Section Measurements.
Measurements were performed on a homebuilt periodic focusing drift-tube (PF-DT) Fourier-transform IM (FT-IM) orbitrap platform.39 A nano-ESI source was used to generate ions and passed through a heated capillary transfer tube at 155 °C. A RF-ion funnel (~3 Torr) is used to focus the ions before being differentially pumped into a periodic DC only focusing funnel (field strength of 50V/cm). Modified Bradbury-Nelson gates (pre- and post-IM) are pulsed allowing the ions to enter and exit the 1.5-meter PF-DT for implementation of FT-IM. Placed on both ends of the PF-DT are two calibrated MKS manometers to ensure steady-state of of high-purity He (99.999%). A multipole transfers ions from the PF-DT into the HCD cell of the Ultra High Resolution Orbitrap platform (Thermo Scientific). In-house Python (v3.7) scripts utilizing Scipy56 and multiplierz57 are used to process the FT-IM-PF-DT data from arrival time to collision cross section.
Native mass spectrometry.
For all other samples including those doped with lipid samples were analyzed using both the original instrument and a modified reverse entry ion source (REIS) coupled to the HCD cell of an Thermo Scientific Exactive Plus Orbitrap with Extended Mass Range (EMR).39 K2P4.1 samples were infused into the frontend of the commercial instruments with the instrument tuned as follows: source DC offset of 20, injection flatapole DC to8.0V, inter flatapole lens to 8, bent flatapole DC to 6.0, transfer multipole DC to 2 and C trap entrance lens to 3. The trapping gas pressure to 4.0 with the in-source CID to 75 and CE to 75. Native mass spectra of K2P4.1 and lipid mixtures were introduced into the mass spectrometer using the REIS with the following instrument parameters: heated capillary set to 145 ˚C, Ardara RF generator ion funnel and octupole set to 251 and 201, respectively, backing pressure set to 3 Torr. The orbitrap instrument was set to a collision energy (CE) of 10 V, maximum injection time was set to 200 ms, and trapping gas pressure was set to be 5 au. Mass spectra were acquired with settings of 17,400 resolution, microscan of 1 and averaging of 100.
Determination of equilibrium dissociation constants (Kd).
Native MS data files were deconvoluted to separate the interwoven charge and mass dimensions using UniDec software58 with the following settings: no smoothing, m/z range 4000 to 9000, charge range 5 to 15, mass sampling of every 0.5 Da, and a peak FWHM of 0.1. Given the high-resolution of the native MS data, we developed in-house software written in the Python programming language (v3.7) with a graphical user interface constructed using wxPython (v4.0) and matplotlib59 to aid the assignment of species. The in-house software imports the zero-charge mass spectra from a lipid titration series, assigns the deconvoluted peaks (e.g. apo or one lipid bound), and exports the lipid binding data in tab delimited text format for downstream processing with a previously described32 custom python scripts to determine Kd values. In more detail, the free concentration of lipid for a given titrant in a titration series was calculated as follows:
where FPLi represents mole fraction of a particular species, and [L]total and [P]total represent the total protein and lipid concentration, respectively. A sequential lipid binding model was used:
where KAn represents the equilibrium association constant for the nth ligand binding to the protein. To calculate the mole fraction of a particular species:32
This sequential lipid binding model was globally fit to the mole fraction data by minimization of a pseudo-χ2 function.32
Liposome Flux Assay.
The liposome flux assay was performed as previously described9 with minor modification. The preparation of proteoliposomes was adapted from established methods.60 Lipids of interest in chloroform (Avanti) were mixed to a desired molar ratio (e.g. POPC only or 15:85, POPG: POPC) and dried under a stream of nitrogen gas. The lipid film was then washed with pentane and dried under a stream of nitrogen gas to form a lipid film before storing in a vacuum desiccator overnight. The lipid film was rehydrated to a final concentration of 20 mM in rehydration buffer (150 mM KCl, 20 mM HEPES-KOH pH 7.4) for 1 hr at room temperature with occasional agitation. The rehydrated lipid mixture underwent three freeze/thaw cycles followed by incubation in a sonicated water bath for 5–10 min. The liposomes were stored at −80 ˚C prior to use. A portion of the liposome mixture (~100 μL) was diluted three-fold with rehydration buffer and extruded using a mini-extruder (Avanti Polar Lipids) with a 100 nm polycarbonate membrane until the solution became translucent. Extruded liposomes were solubilized with an equal volume of solubilization buffer (150 mM KCl, 20 mM HEPES-KOH pH7.4, 20 mM DM) at room temperature with gentle rotation for 30 min or until the solution became translucent. Solubilized liposome solution was separated into two portions of equal volume: one is for the empty liposome control, and the other is for the reconstitution of protein. Purified K2P4.1a was added to the solubilized liposome solution at a protein to lipid ratio of 1:100 (w/w), respectively. The mixture was equilibrated at room temperature with gentle rotation for 1 hr. To remove detergent, Bio-Beads SM2 (Bio-Rad) was added to reach approximately half the solution volume and incubated overnight at 4 ˚C with gentle rotation. Bio-beads were prepared by washing sequentially using a centrifugal filter (PVDF 0.45 μm) with one column volume (CV) of methanol, five CV of water, and three CV of rehydration buffer. The proteoliposome mixture was then extruded again through a 100 nm polycarbonate membrane until the solution became translucent. The proteoliposome mixtures were stored at 4 ˚C in between functional assays, and at −80 °C for long term storage.
A CLARIOstar (BMG LabTech) microplate reader was used with an excitation wavelength (410 nm with 10 nm window) adjusted for the pH-sensitive fluorescent dye ACMA (9-amino-6-chloro-2-methoxyacridine). Emission at 490 nm with a 10 nm window was recorded. In a 96 well flat optical bottom plate, 10 μL of reconstituted proteoliposome solution was mixed into 190 μL of flux assay buffer (150 mM NaCl, 20 mM HEPES-NaOH pH7.4). After the addition of 5 μL of ACMA solution (65 μM ACMA dissolved in flux assay buffer), the fluorescence was recorded every 5 s for 1 min to establish the starting baseline. Immediately after 10 μL of CCCP solution (1.6 μM CCCP dissolved in flux assay buffer) was added and mixed well to initiate the flux assay. Fluorescence was recorded every five s over seven-minute interval. Valinomycin (1 μL, 9 μM in DMSO), a potassium ionophore, was added to dissipate the potassium gradient. The fluorescence was recorded every 5 s for 5 min after the addition. Data points for each trial were normalized using the following equation:
where F is the recorded value at a certain time, Fmin and Fmax are the lowest and highest value of the trial, respectively. Importantly, control liposomes used for the flux assay had the same lipid composition as that for the reconstituted channel.
To determine the amount of protein incorporated into liposomes of different composition, an aliquot of proteoliposomes was subjected to sodium dodecyl sulfate polyacrylamide gel electrophoresis (SDS-PAGE).40 The prepared proteoliposome samples were loaded on a precast 12% polyacrylamide gel (TGX, 15 well, Cat. #4561046, Bio-Rad). Included on each gel was one well with pre-stained protein ladder (Cat. #1610374., Bio-Rad). Gels were run following the manufacturer’s protocol. The gels were stained with silver at the same time using a silver stain kit (Bio-Rad). The stained gels were scanned. The gel images were processed in Adobe Photoshop (version 20.0.6) by first converting to grayscale, inverted, and the integrated density was recorded from fixed selection box placed over the monomer bands or below to record background. The background measurement was subtracted from the value for the corresponding monomeric band.
Extended Data
Extended Data Figure 1. Optimization of expression and purification of human K2P4.1 for native ion mobility mass spectrometry studies.
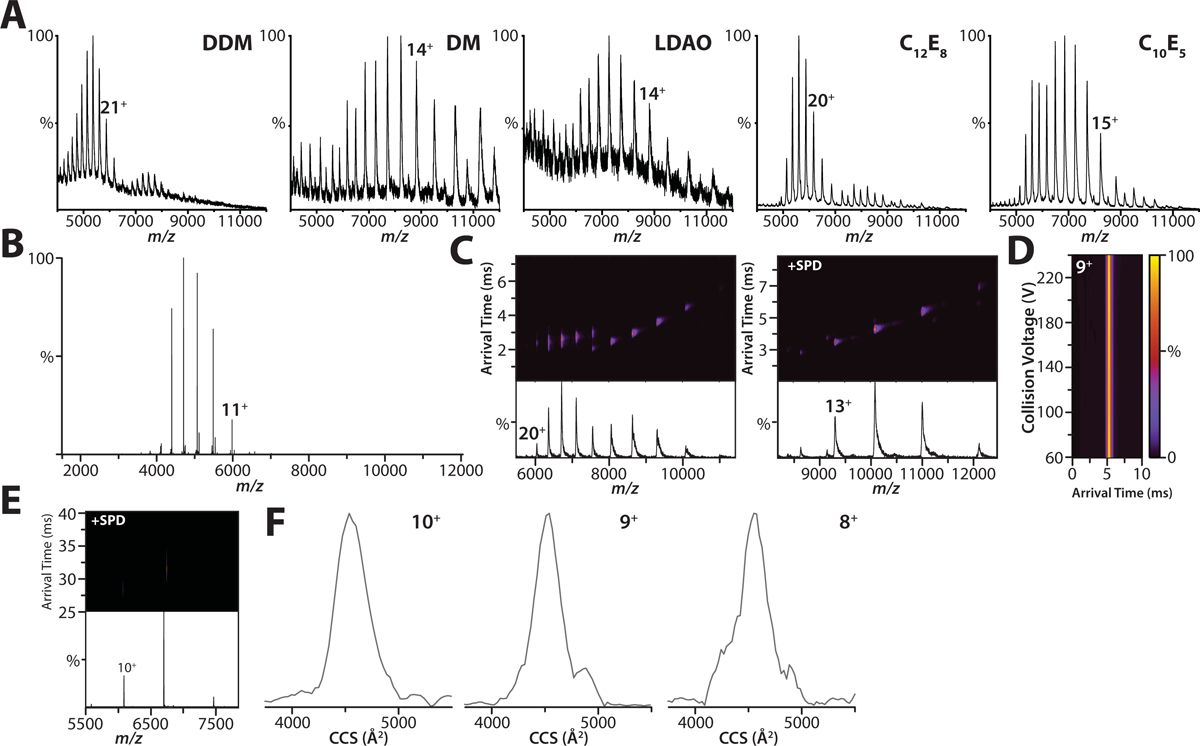
A) Shown are representative mass spectra of the K2P4.1b fusion protein acquired on a Synapt G1 HDMS instrument. Denoted in the inset is the detergent abbreviation: dodecyl maltoside (DDM); decyl maltoside (DM); lauryldimethylamine-N-oxide (LDAO); pentaethylene glycol monodecyl ether (C10E5); and octaethylene glycol monododecyl ether (C12E8). The polyethylene glycol detergents, C10E5 and C12E8, yielded well resolved mass spectra compared to the other detergents screened. B) Membrane proteins were expressed with affinity tags fused to both termini. Shown is the native mass spectrum for K2P4.1b with tags removed by TEV protease in C10E5 acquired on an Orbitrap. C) Native ion mobility mass spectra of the K2P4.1a fusion protein solubilized in (left) 2x CMC C10E5 and with the addition of (right) 50 mM spermidine acquired on Synapt G1. In the absence of charge-reducing molecule, the arrival time distributions are broad for high charge states indicating collisional activation (or partial unfolding) of the protein complex. D) Collision induced unfolding (CIU) plot of arrival time distribution for the 9+ charge state of K2P4.1a with tags removed in C10E5 and spermidine acquired under different collision voltages (10V step size) on a Synapt G1 instrument. The arrival time distribution for the 9+ and other charge states of K2P4.1a remain constant showing that charge reduction aids retention of native-like structure, even at the highest collision voltage (240V). E) Ion mobility mass spectrum for K2P4.1a in C10E5 and spermidine recorded on an Orbitrap UHMR equipped with a REIS and 1.5m drift tube operating in the FT-mode. F) Collision cross section profiles for different charge states of K2P4.1a. The centroid CCS for the 10+, 9+, and 8+ are 4559, 4528, 4547 Å2, respectively. The calculated CCS for PDB 4WFE is 4656 Å2.
Extended Data Figure 2. Native mass spectra for weakly (or no) binding lipids to K2P4.1a.
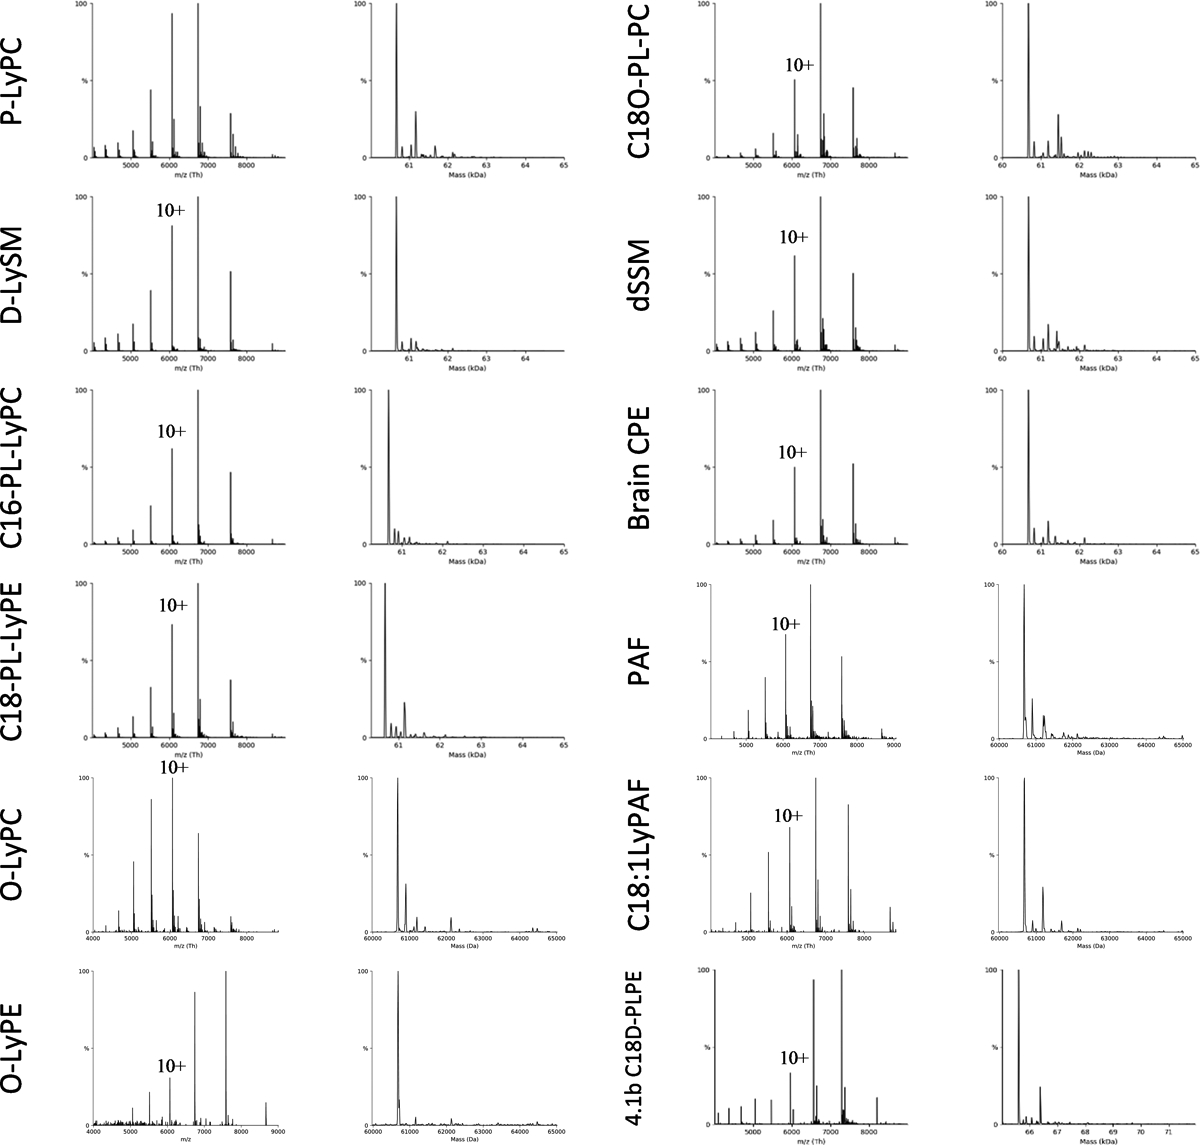
Shown are native mass spectra for K2P4.1a in the presence of 20 μM of lipid. Lipid abbreviations are provided in Supplementary Data Table 1.
Extended Data Figure 3. Determination of equilibrium dissociation constants (KD) for lipids binding K2P4.1a.
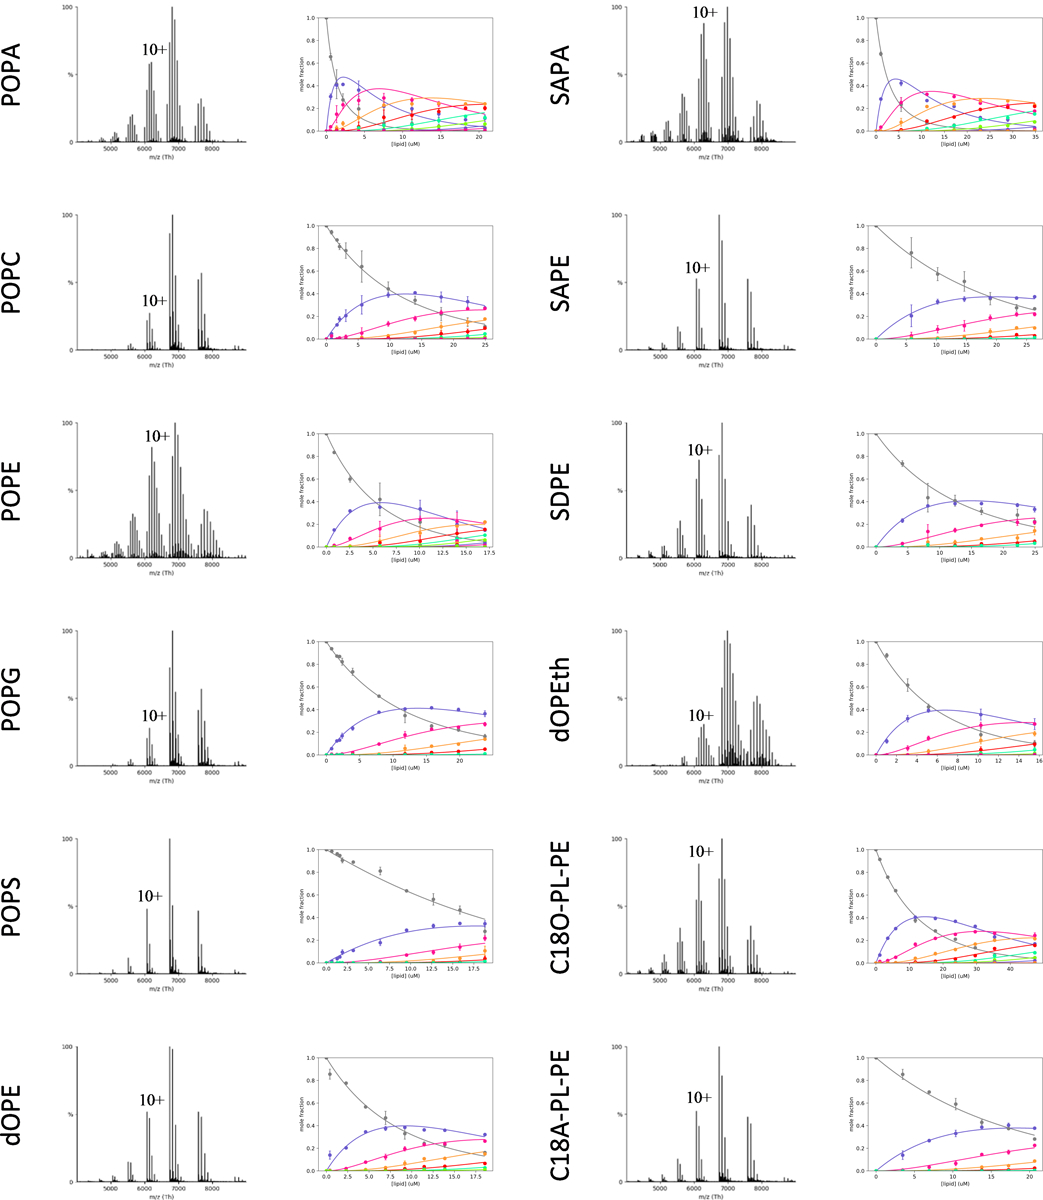
Shown are representative native mass for K2P4.1a in the presence of 20 μM of lipid. Plots of mole fraction (right panel) for apo K2P4.1a and bound to different number of lipids determined from a titration series (dots with error bars to represent the three measurements) and resulting fit from a sequential lipid-binding model (solid lines). Lipid abbreviations are provided in Supplementary Data Table 1.
Extended Data Figure 4. Determination of KD for lysolipids and PIPs binding K2P4.1a.
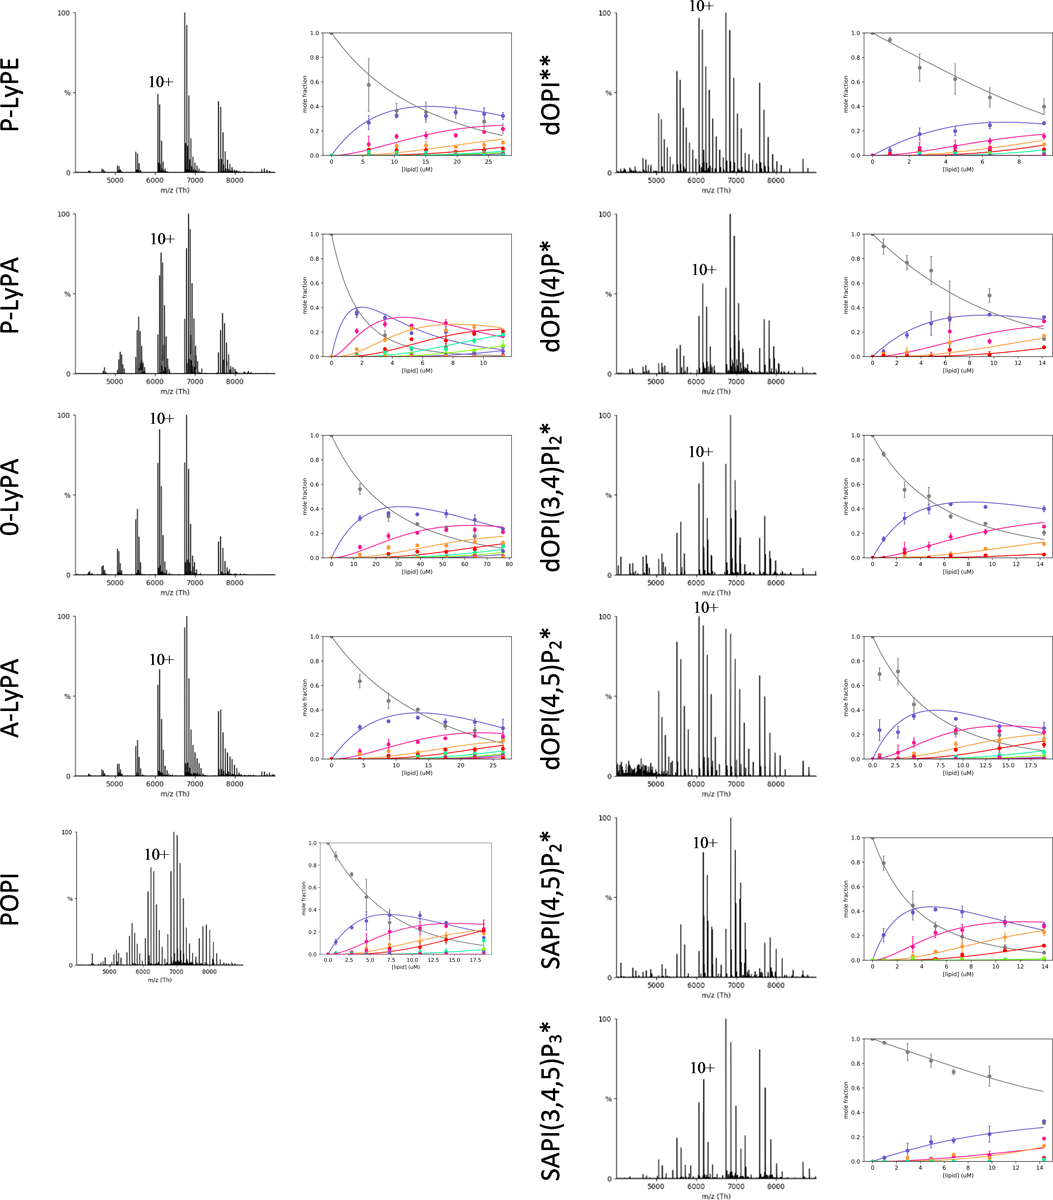
Shown as described in Extended Data Figure 3. * and ** denote lipid concentrations of 15 μM and 10 μM, respectively.
Extended Data Figure 5. Determination of KD for lipids binding K2P4.1b.
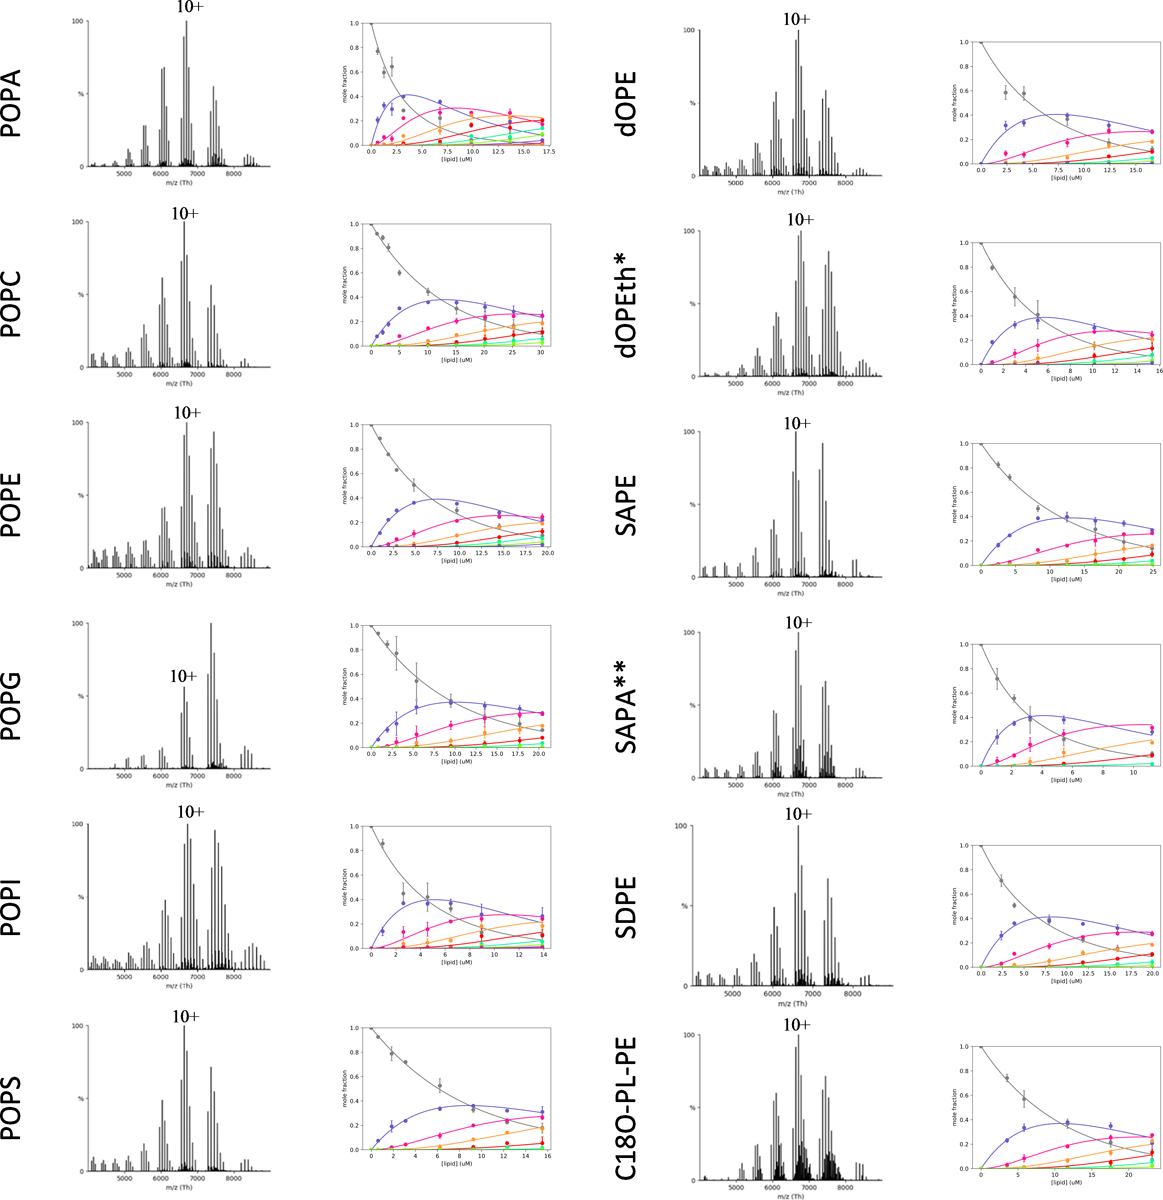
Shown as described for Extended Data Figure 3. * and ** denote lipid concentrations of 15 μM and 10 μM, respectively.
Extended Data Figure 6. Determination of KD for lysolipids, PIPs lipids binding K2P4.1b.
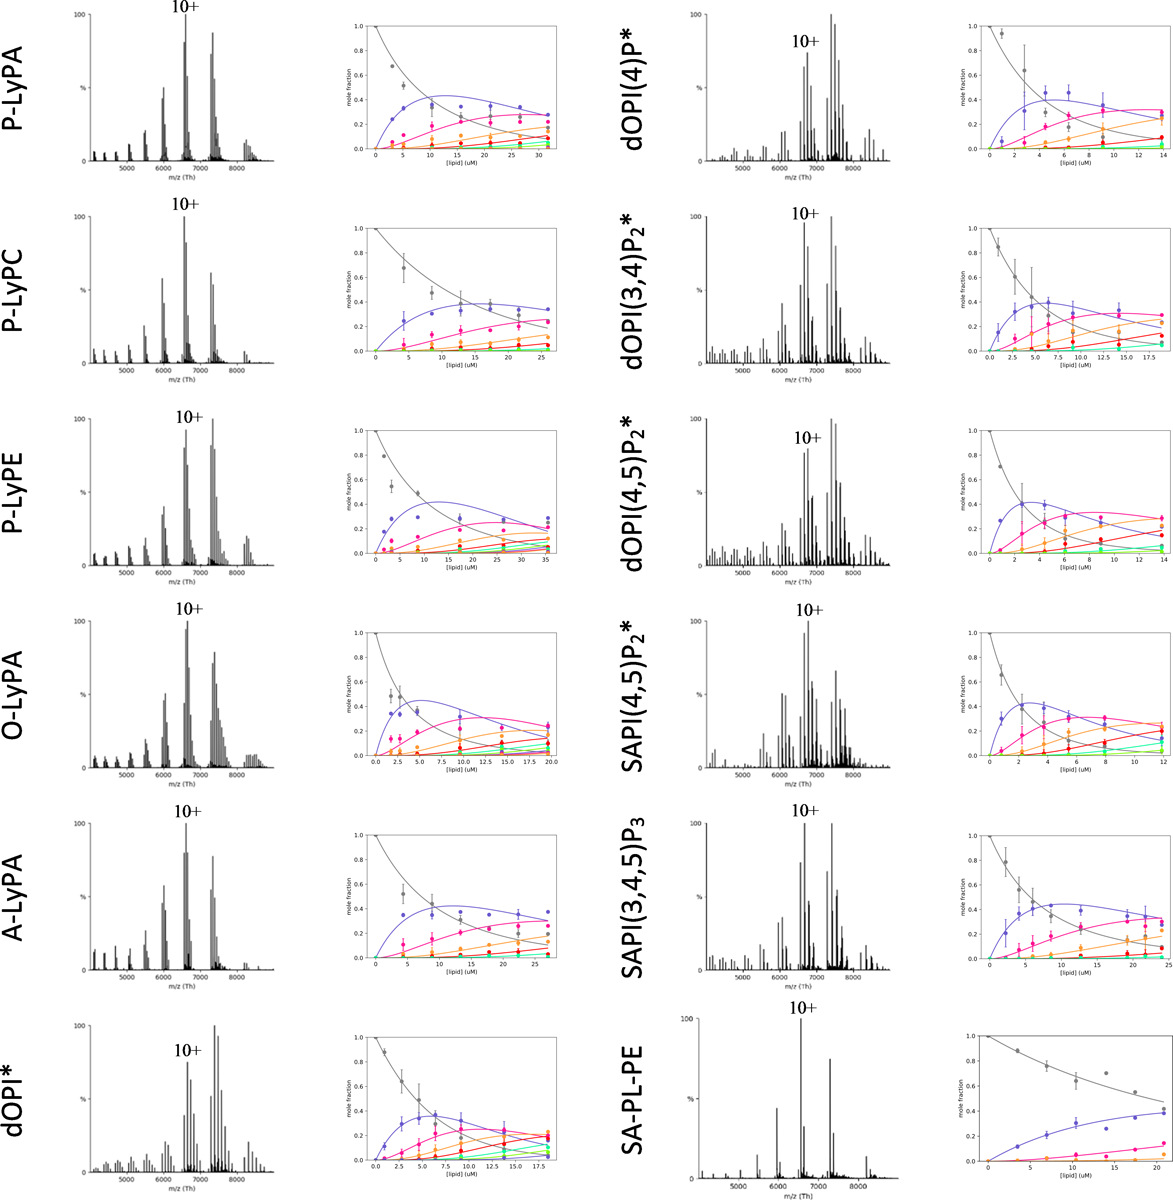
Shown as described for Extended Data Figure 3. * and ** denote lipid concentrations of 15 μM and 10 μM, respectively.
Extended Data Figure 7. Liposome potassium flux assays of K2P4.1a reconstituted in POPC.
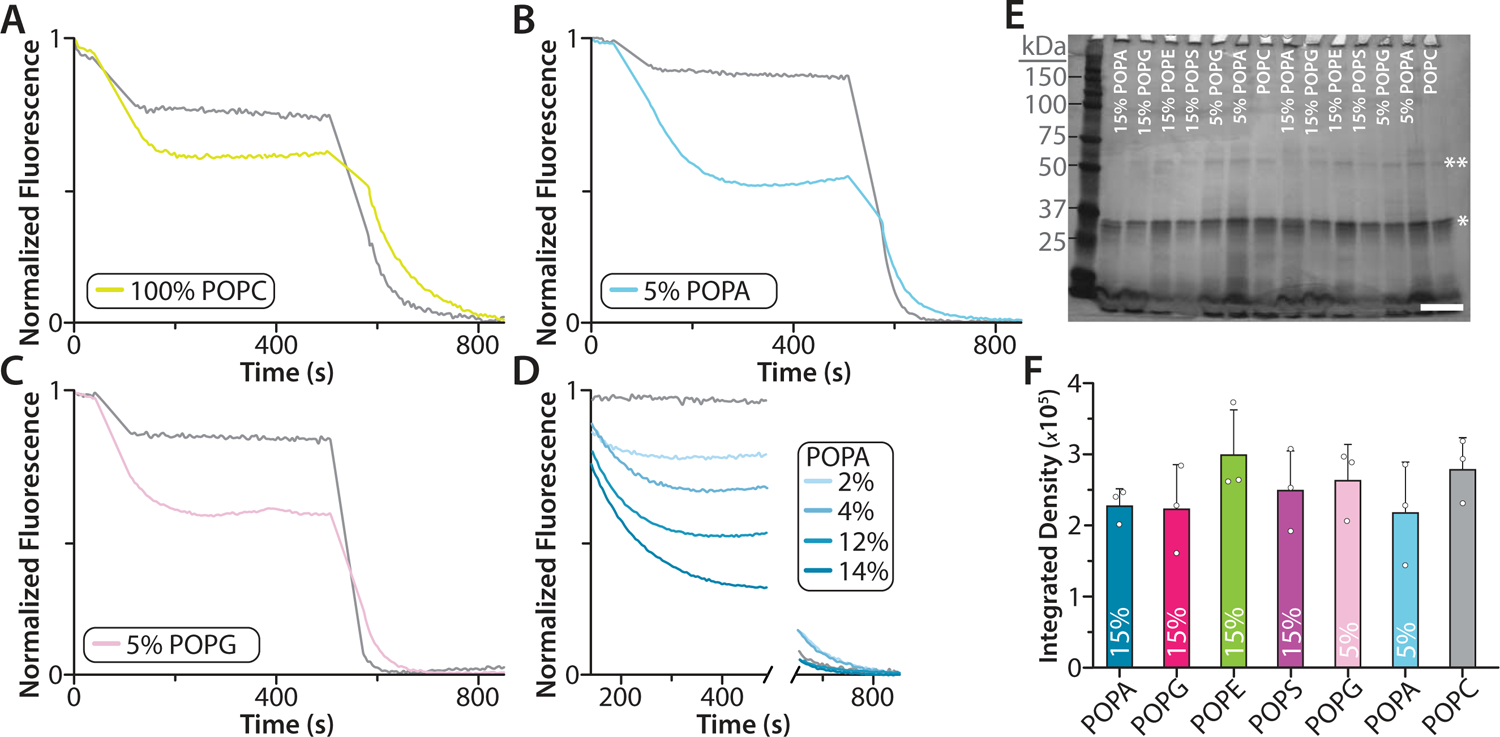
A-D) Flux assay traces for K2P4.1a reconstituted in POPC and POPC doped with POPG or POPA. Empty liposomes of the same lipid composition are shown in grey. The mole fraction (%) of doped lipid is shown in the inset. E) Photograph of a silver stained SDS-PAGE of different proteoliposome mixtures used in the liposome potassium flux assays. Bands corresponding to monomer and dimer K2P4.1a are denoted by a single and double asterisk, respectively. The Precision Plus Protein Dual Color Standard (Bio-Rad) protein ladder was loaded in the first lane and molecular weight in kDa is shown to the left. The white scale bar (lower right corner) represents 1 cm. (F) Densitometry analysis of K2P4.1a monomeric bands. No statistical differences were found between the different samples. Shown are the mean and standard deviation (n = 3) for three independent experiments (white dots).
Supplementary Material
Acknowledgements
This work was supported by the National Institute of General Medical Sciences (NIGMS) of the National Institutes of Health (NIH) awarded to Laganowsky (DP2GM123486, A.L.) and development of custom instrumentation supported by NIH (P41GM128577-01, D.R.).
Footnotes
Data Availability Statement
The native mass spectrometry data are available on Zenodo (DOI 10.5281/zenodo.3993214). Source data are provided with this paper.
Code Availability Statement
Python code is available at GitHub (https://github.com/LaganowskyLab/Laganowsky_Lab_Code.git).
Competing Financial Interests
The authors declare no competing financial interests.
References
- 1.Heurteaux C et al. TREK-1, a K+ channel involved in neuroprotection and general anesthesia. EMBO J 23, 2684–2695, doi: 10.1038/sj.emboj.7600234 (2004). [DOI] [PMC free article] [PubMed] [Google Scholar]
- 2.Alloui A et al. TREK-1, a K+ channel involved in polymodal pain perception. EMBO J 25, 2368–2376, doi: 10.1038/sj.emboj.7601116 (2006). [DOI] [PMC free article] [PubMed] [Google Scholar]
- 3.Blondeau N et al. Polyunsaturated fatty acids are cerebral vasodilators via the TREK-1 potassium channel. Circ Res 101, 176–184, doi: 10.1161/CIRCRESAHA.107.154443 (2007). [DOI] [PubMed] [Google Scholar]
- 4.Noel J et al. The mechano-activated K+ channels TRAAK and TREK-1 control both warm and cold perception. EMBO J 28, 1308–1318, doi: 10.1038/emboj.2009.57 (2009). [DOI] [PMC free article] [PubMed] [Google Scholar]
- 5.Enyedi P & Czirjak G Molecular background of leak K+ currents: two-pore domain potassium channels. Physiol Rev 90, 559–605, doi: 10.1152/physrev.00029.2009 (2010). [DOI] [PubMed] [Google Scholar]
- 6.Feliciangeli S, Chatelain FC, Bichet D & Lesage F The family of K2P channels: salient structural and functional properties. J Physiol 593, 2587–2603, doi: 10.1113/jphysiol.2014.287268 (2015). [DOI] [PMC free article] [PubMed] [Google Scholar]
- 7.Es-Salah-Lamoureux Z, Steele DF & Fedida D Research into the therapeutic roles of two-pore-domain potassium channels. Trends in Pharmacological Sciences 31, 587–595, doi: 10.1016/j.tips.2010.09.001 (2010). [DOI] [PubMed] [Google Scholar]
- 8.Noel J, Sandoz G & Lesage F Molecular regulations governing TREK and TRAAK channel functions. Channels (Austin) 5, 402–409, doi: 10.4161/chan.5.5.16469 (2011). [DOI] [PMC free article] [PubMed] [Google Scholar]
- 9.Cabanos C, Wang M, Han XL & Hansen SB A Soluble Fluorescent Binding Assay Reveals PIP2 Antagonism of TREK-1 Channels. Cell Reports 20, 1287–1294, doi: 10.1016/j.celrep.2017.07.034 (2017). [DOI] [PMC free article] [PubMed] [Google Scholar]
- 10.Vivier D, Bennis K, Lesage F & Ducki S Perspectives on the Two-Pore Domain Potassium Channel TREK-1 (TWIK-Related K(+) Channel 1). A Novel Therapeutic Target? J Med Chem 59, 5149–5157, doi: 10.1021/acs.jmedchem.5b00671 (2016). [DOI] [PubMed] [Google Scholar]
- 11.Chemin J et al. Up- and down-regulation of the mechano-gated K(2P) channel TREK-1 by PIP (2) and other membrane phospholipids. Pflugers Arch 455, 97–103, doi: 10.1007/s00424-007-0250-2 (2007). [DOI] [PubMed] [Google Scholar]
- 12.Comoglio Y et al. Phospholipase D2 specifically regulates TREK potassium channels via direct interaction and local production of phosphatidic acid. Proc Natl Acad Sci U S A 111, 13547–13552, doi: 10.1073/pnas.1407160111 (2014). [DOI] [PMC free article] [PubMed] [Google Scholar]
- 13.Lopes CM et al. PIP2 hydrolysis underlies agonist-induced inhibition and regulates voltage gating of two-pore domain K+ channels. J Physiol 564, 117–129, doi: 10.1113/jphysiol.2004.081935 (2005). [DOI] [PMC free article] [PubMed] [Google Scholar]
- 14.Chung HW et al. A Molecular Target for an Alcohol Chain-Length Cutoff. J Mol Biol 431, 196–209, doi: 10.1016/j.jmb.2018.11.028 (2019). [DOI] [PMC free article] [PubMed] [Google Scholar]
- 15.Fink M et al. A neuronal two P domain K+ channel stimulated by arachidonic acid and polyunsaturated fatty acids. EMBO J 17, 3297–3308, doi: 10.1093/emboj/17.12.3297 (1998). [DOI] [PMC free article] [PubMed] [Google Scholar]
- 16.Chemin J et al. Lysophosphatidic acid-operated K+ channels. J Biol Chem 280, 4415–4421, doi: 10.1074/jbc.M408246200 (2005). [DOI] [PubMed] [Google Scholar]
- 17.Juarez-Contreras R, Rosenbaum T & Morales-Lazaro SL Lysophosphatidic Acid and Ion Channels as Molecular Mediators of Pain. Front Mol Neurosci 11, 462, doi: 10.3389/fnmol.2018.00462 (2018). [DOI] [PMC free article] [PubMed] [Google Scholar]
- 18.Maingret F, Patel AJ, Lesage F, Lazdunski M & Honore E Lysophospholipids open the two-pore domain mechano-gated K(+) channels TREK-1 and TRAAK. J Biol Chem 275, 10128–10133, doi: 10.1074/jbc.275.14.10128 (2000). [DOI] [PubMed] [Google Scholar]
- 19.Brohawn SG, del Marmol J & MacKinnon R Crystal structure of the human K2P TRAAK, a lipid- and mechano-sensitive K+ ion channel. Science 335, 436–441, doi: 10.1126/science.1213808 (2012). [DOI] [PMC free article] [PubMed] [Google Scholar]
- 20.Brohawn SG, Su Z & MacKinnon R Mechanosensitivity is mediated directly by the lipid membrane in TRAAK and TREK1 K+ channels. Proc Natl Acad Sci U S A 111, 3614–3619, doi: 10.1073/pnas.1320768111 (2014). [DOI] [PMC free article] [PubMed] [Google Scholar]
- 21.Dong YY et al. K2P channel gating mechanisms revealed by structures of TREK-2 and a complex with Prozac. Science 347, 1256–1259, doi: 10.1126/science.1261512 (2015). [DOI] [PMC free article] [PubMed] [Google Scholar]
- 22.Lolicato M et al. K2P2.1 (TREK-1)-activator complexes reveal a cryptic selectivity filter binding site. Nature 547, 364–368, doi: 10.1038/nature22988 (2017). [DOI] [PMC free article] [PubMed] [Google Scholar]
- 23.Lolicato M, Riegelhaupt PM, Arrigoni C, Clark KA & Minor DL Jr. Transmembrane helix straightening and buckling underlies activation of mechanosensitive and thermosensitive K(2P) channels. Neuron 84, 1198–1212, doi: 10.1016/j.neuron.2014.11.017 (2014). [DOI] [PMC free article] [PubMed] [Google Scholar]
- 24.Brohawn SG, Campbell EB & MacKinnon R Physical mechanism for gating and mechanosensitivity of the human TRAAK K+ channel. Nature 516, 126–130, doi: 10.1038/nature14013 (2014). [DOI] [PMC free article] [PubMed] [Google Scholar]
- 25.McClenaghan C et al. Polymodal activation of the TREK-2 K2P channel produces structurally distinct open states. J Gen Physiol 147, 497–505, doi: 10.1085/jgp.201611601 (2016). [DOI] [PMC free article] [PubMed] [Google Scholar]
- 26.Bolla JR, Agasid MT, Mehmood S & Robinson CV Membrane Protein-Lipid Interactions Probed Using Mass Spectrometry. Annu Rev Biochem 88, 85–111, doi: 10.1146/annurev-biochem-013118-111508 (2019). [DOI] [PubMed] [Google Scholar]
- 27.Laganowsky A, Reading E, Hopper JT & Robinson CV Mass spectrometry of intact membrane protein complexes. Nat Protoc 8, 639–651, doi: 10.1038/nprot.2013.024 (2013). [DOI] [PMC free article] [PubMed] [Google Scholar]
- 28.Laganowsky A et al. Membrane proteins bind lipids selectively to modulate their structure and function. Nature 510, 172–175, doi: 10.1038/nature13419 (2014). [DOI] [PMC free article] [PubMed] [Google Scholar]
- 29.Hilton GR & Benesch JL Two decades of studying non-covalent biomolecular assemblies by means of electrospray ionization mass spectrometry. J R Soc Interface 9, 801–816, doi: 10.1098/rsif.2011.0823 (2012). [DOI] [PMC free article] [PubMed] [Google Scholar]
- 30.Gupta K et al. The role of interfacial lipids in stabilizing membrane protein oligomers. Nature 541, 421–424, doi: 10.1038/nature20820 (2017). [DOI] [PMC free article] [PubMed] [Google Scholar]
- 31.Liu Y et al. Selective binding of a toxin and phosphatidylinositides to a mammalian potassium channel. Nat Commun 10, 1352, doi: 10.1038/s41467-019-09333-4 (2019). [DOI] [PMC free article] [PubMed] [Google Scholar]
- 32.Cong X et al. Determining Membrane Protein-Lipid Binding Thermodynamics Using Native Mass Spectrometry. J Am Chem Soc 138, 4346–4349, doi: 10.1021/jacs.6b01771 (2016). [DOI] [PubMed] [Google Scholar]
- 33.Cong X, Liu Y, Liu W, Liang X & Laganowsky A Allosteric modulation of protein-protein interactions by individual lipid binding events. Nat Commun 8, 2203, doi: 10.1038/s41467-017-02397-0 (2017). [DOI] [PMC free article] [PubMed] [Google Scholar]
- 34.Yen HY et al. PtdIns(4,5)P2 stabilizes active states of GPCRs and enhances selectivity of G-protein coupling. Nature 559, 423–427, doi: 10.1038/s41586-018-0325-6 (2018). [DOI] [PMC free article] [PubMed] [Google Scholar]
- 35.Patrick JW et al. Allostery revealed within lipid binding events to membrane proteins. Proc Natl Acad Sci U S A 115, 2976–2981, doi: 10.1073/pnas.1719813115 (2018). [DOI] [PMC free article] [PubMed] [Google Scholar]
- 36.Marcoux J et al. Mass spectrometry reveals synergistic effects of nucleotides, lipids, and drugs binding to a multidrug resistance efflux pump. Proc Natl Acad Sci U S A 110, 9704–9709, doi: 10.1073/pnas.1303888110 (2013). [DOI] [PMC free article] [PubMed] [Google Scholar]
- 37.Gault J et al. High-resolution mass spectrometry of small molecules bound to membrane proteins. Nat Methods 13, 333–336, doi: 10.1038/nmeth.3771 (2016). [DOI] [PMC free article] [PubMed] [Google Scholar]
- 38.Brohawn SG, Campbell EB & MacKinnon R Domain-swapped chain connectivity and gated membrane access in a Fab-mediated crystal of the human TRAAK K+ channel. Proc Natl Acad Sci U S A 110, 2129–2134, doi: 10.1073/pnas.1218950110 (2013). [DOI] [PMC free article] [PubMed] [Google Scholar]
- 39.Poltash ML, McCabe JW, Patrick JW, Laganowsky A & Russell DH Development and Evaluation of a Reverse-Entry Ion Source Orbitrap Mass Spectrometer. Journal of The American Society for Mass Spectrometry, doi: 10.1007/s13361-018-1976-0 (2018). [DOI] [PMC free article] [PubMed] [Google Scholar]
- 40.Laemmli UK Cleavage of structural proteins during the assembly of the head of bacteriophage T4. Nature 227, 680–685, doi: 10.1038/227680a0 (1970). [DOI] [PubMed] [Google Scholar]
- 41.Lyu J et al. Discovery of Potent Charge-Reducing Molecules for Native Ion Mobility Mass Spectrometry Studies. Anal Chem 92, 11242–11249, doi: 10.1021/acs.analchem.0c01826 (2020). [DOI] [PMC free article] [PubMed] [Google Scholar]
- 42.Ben-Nissan G & Sharon M The application of ion-mobility mass spectrometry for structure/function investigation of protein complexes. Current opinion in chemical biology 42, 25–33, doi: 10.1016/j.cbpa.2017.10.026 (2018). [DOI] [PMC free article] [PubMed] [Google Scholar]
- 43.Poltash ML et al. Fourier Transform-Ion Mobility-Orbitrap Mass Spectrometer: A Next-Generation Instrument for Native Mass Spectrometry. Anal Chem, doi: 10.1021/acs.analchem.8b02463 (2018). [DOI] [PMC free article] [PubMed] [Google Scholar]
- 44.Harayama T & Riezman H Understanding the diversity of membrane lipid composition. Nat Rev Mol Cell Biol 19, 281–296, doi: 10.1038/nrm.2017.138 (2018). [DOI] [PubMed] [Google Scholar]
- 45.Brohawn SG et al. The mechanosensitive ion channel TRAAK is localized to the mammalian node of Ranvier. Elife 8, doi: 10.7554/eLife.50403 (2019). [DOI] [PMC free article] [PubMed] [Google Scholar]
- 46.in Metabolism and Functions of Bioactive Ether Lipids in the Brain (eds Farooqui Akhlaq A., Farooqui Tahira, & Horrocks Lloyd A.) 85–106 (Springer New York, 2008). [Google Scholar]
- 47.Hargreaves K & Clandinin MT Dietary lipids in relation to postnatal development of the brain. Ups J Med Sci Suppl 48, 79–95 (1990). [PubMed] [Google Scholar]
- 48.Qiao P, Liu Y, Zhang T, Benavides A & Laganowsky A Insight into the selectivity of Kir3.2 toward phosphatidylinositides. Biochemistry, doi: 10.1021/acs.biochem.0c00163 (2020). [DOI] [PubMed] [Google Scholar]
- 49.Robinson CV, Rohacs T & Hansen SB Tools for Understanding Nanoscale Lipid Regulation of Ion Channels. Trends Biochem Sci 44, 795–806, doi: 10.1016/j.tibs.2019.04.001 (2019). [DOI] [PMC free article] [PubMed] [Google Scholar]
- 50.Levitz J et al. Heterodimerization within the TREK channel subfamily produces a diverse family of highly regulated potassium channels. Proc Natl Acad Sci U S A 113, 4194–4199, doi: 10.1073/pnas.1522459113 (2016). [DOI] [PMC free article] [PubMed] [Google Scholar]
- 51.Shaner NC et al. Improved monomeric red, orange and yellow fluorescent proteins derived from Discosoma sp. red fluorescent protein. Nat Biotechnol 22, 1567–1572, doi: 10.1038/nbt1037 (2004). [DOI] [PubMed] [Google Scholar]
- 52.Weis R High-Throughput Screening and Selection of Pichia pastoris Strains. Methods Mol Biol 1923, 169–185, doi: 10.1007/978-1-4939-9024-5_7 (2019). [DOI] [PubMed] [Google Scholar]
- 53.Chen PS, Toribara TY & Warner H Microdetermination of Phosphorus. Analytical Chemistry 28, 1756–1758, doi: 10.1021/ac60119a033 (1956). [DOI] [Google Scholar]
- 54.Allison TM et al. Quantifying the stabilizing effects of protein-ligand interactions in the gas phase. Nat Commun, in press, doi: 10.1038/ncomms9551 (2015). [DOI] [PMC free article] [PubMed] [Google Scholar]
- 55.Marklund EG, Degiacomi MT, Robinson CV, Baldwin AJ & Benesch JL Collision cross sections for structural proteomics. Structure 23, 791–799, doi: 10.1016/j.str.2015.02.010 (2015). [DOI] [PubMed] [Google Scholar]
- 56.Virtanen P et al. SciPy 1.0: fundamental algorithms for scientific computing in Python. Nature Methods 17, 261–272, doi: 10.1038/s41592-019-0686-2 (2020). [DOI] [PMC free article] [PubMed] [Google Scholar]
- 57.Alexander WM, Ficarro SB, Adelmant G & Marto JA multiplierz v2.0: A Python-based ecosystem for shared access and analysis of native mass spectrometry data. PROTEOMICS 17, 1700091, doi: 10.1002/pmic.201700091 (2017). [DOI] [PubMed] [Google Scholar]
- 58.Marty MT et al. Bayesian deconvolution of mass and ion mobility spectra: from binary interactions to polydisperse ensembles. Anal Chem 87, 4370–4376, doi: 10.1021/acs.analchem.5b00140 (2015). [DOI] [PMC free article] [PubMed] [Google Scholar]
- 59.Hunter JD Matplotlib: A 2D Graphics Environment. Computing in Science & Engineering 9, 90–95, doi: 10.1109/mcse.2007.55 (2007). [DOI] [Google Scholar]
- 60.Su ZW, Brown EC, Wang WW & MacKinnon R Novel cell-free high-throughput screening method for pharmacological tools targeting K+ channels. Proceedings of the National Academy of Sciences of the United States of America 113, 5748–5753, doi: 10.1073/pnas.1602815113 (2016). [DOI] [PMC free article] [PubMed] [Google Scholar]
Associated Data
This section collects any data citations, data availability statements, or supplementary materials included in this article.


