Abstract
Voltage-gated potassium (Kv) channels orchestrate electrical signaling and control cell volume by gating in response to either membrane depolarization or hyperpolarization. Yet, while all voltage-sensing domains transduce transmembrane electric field changes by a common mechanism involving the outward or inward translocation of gating charges1–3, the general determinants of channel gating polarity remain poorly understood4. Here, we suggest a molecular mechanism for electromechanical coupling and gating polarity in non-domain-swapped Kv channels based on the cryo-EM structure of KAT1, the hyperpolarization-activated Kv channel from Arabidopsis thaliana. KAT1 displays a depolarized voltage sensor, which interacts with a closed pore domain directly via two interfaces and indirectly via an intercalated phospholipid. Functional evaluation of KAT1 structure-guided mutants at the sensor-pore interfaces suggests a mechanism in which direct interaction between the sensor and C-linker hairpin in the adjacent pore subunit is the primary determinant of gating polarity. We suggest that a ~5–7 Å inward motion of the S4 sensor helix can underlie a direct-coupling mechanism, driving a conformational reorientation of the C-linker and ultimately opening the activation gate formed by the S6 intracellular bundle. This direct-coupling mechanism contrasts with allosteric mechanisms proposed for hyperpolarization-activated cyclic nucleotide-gated (HCN) channels5, and may represent an unexpected link between depolarization and hyperpolarization-activated channels.
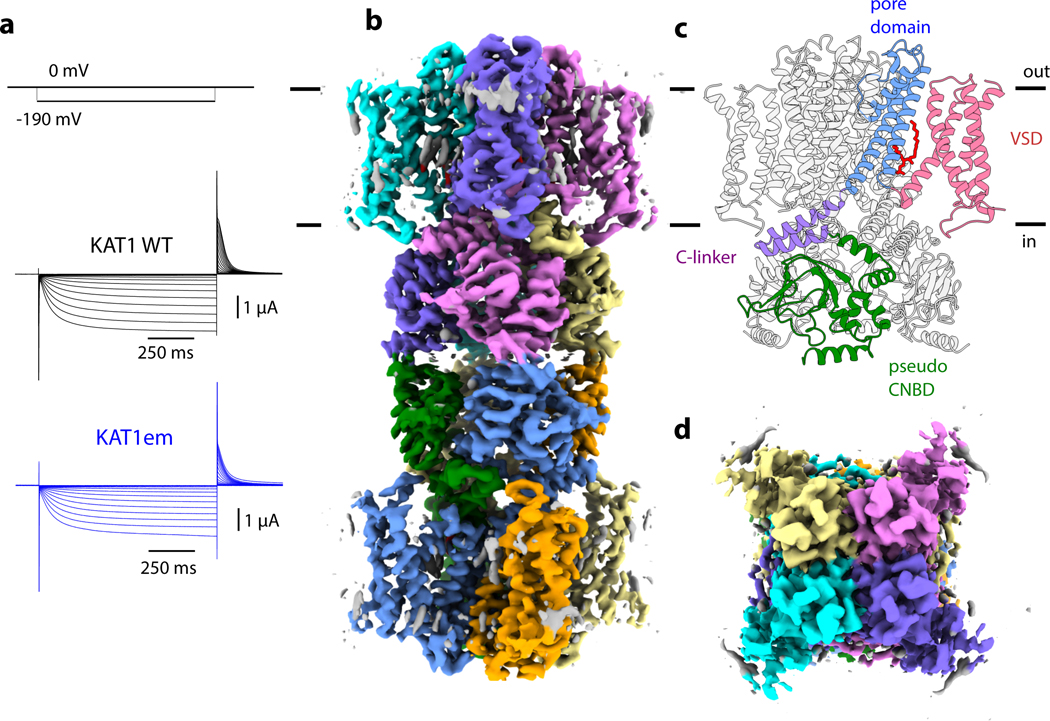
Voltage-gated ion channels couple electric field-driven conformational changes in their voltage-sensing domains (VSDs) to mechanical opening and closing of their pore domains 6–8. This process of electromechanical coupling underlies the function of both depolarization and hyperpolarization activated channels (Extended Data Fig. 1). To better understand the molecular basis of how electromechanical coupling might lead to these two distinct gating polarities, we determined the cryo-electron microscopy (cryo-EM) structure of the hyperpolarization-activated potassium channel (KAT1) from Arabidopsis thaliana, and probed the interactions between its voltage-sensing and pore domains using mutagenesis, electrophysiology, and modeling. KAT1 is a founding member of the plant inwardly-rectifying, potassium-selective ion channel subfamily. Physiologically, these channels tune osmotic potential to hydraulically control stomatal opening in flowering plants 9. A fully-functional construct (KAT1em, Fig. 1a) spanning the transmembrane region and pseudo cyclic nucleotide-binding domain (CNBD) (Extended Data Fig. 2) was purified and imaged in the gentle detergent digitonin. In the cryo-EM images, KAT1em assembles as a dimer of two tetrameric channels stacking via their cytoplasmic domains (Fig. 1b); although the physiological significance, if any, of this stacking is currently unknown. Focused refinement of the tetramer improved map quality (from a nominal resolution of 3.8 Å for the full dimer of tetramers to a nominal 3.5 Å for the tetramer transmembrane region) and facilitated de novo model building (Extended Data Figs. 2,3). KAT1em shares the topology of the CNBD-containing channel family, including a non-domain-swapped subunit arrangement of its voltage-sensing and pore domains, followed by a C-linker and pseudo-CNBD (Fig. 1c,d).
Figure 1: Function and architecture of Arabidopsis thaliana KAT1em.
a, Representative macroscopic currents of full-length KAT1, and KAT1em, recorded in Xenopus oocytes using a family of hyperpolarizing pulses (top). b, Sharpened cryo-EM density map of channel octamer, side view. c, Ribbon model of KAT1em, with domains labeled. Phospholipid is shown in red stick representation. d, Sharpened cryo-EM density map of channel tetramer, top view (view from extracellular side).
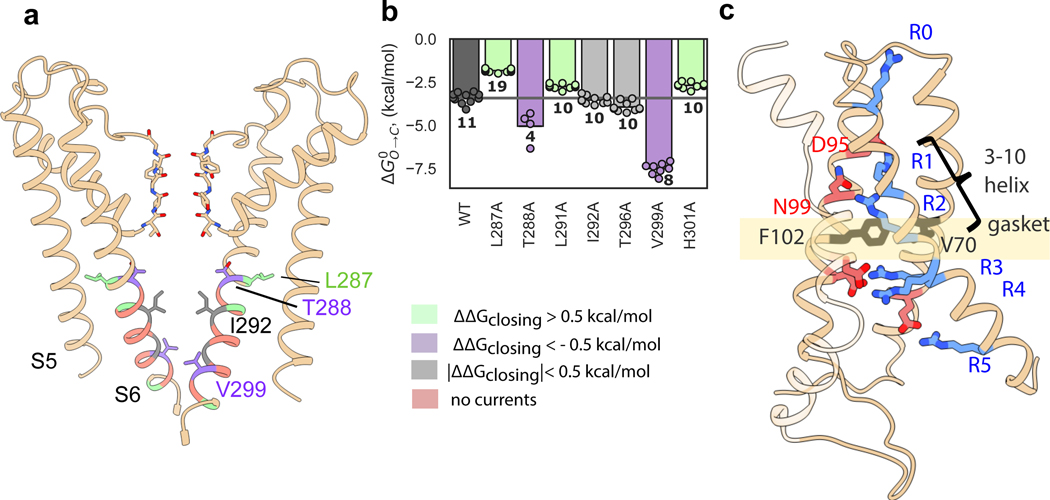
The pore domain of KAT1 displays a closed inner gate, with its narrowest constriction formed by the hydrophobic side chains of I292, while the selectivity filter is in a conductive conformation (Fig. 2a, Extended Data Fig. 4). Functionally, these characteristics correspond to the expected closed state at 0 mV 10–12. To evaluate the energetics of pore opening, we conducted a local alanine scan of the inner gate region. Six mutants failed to give currents, however seven mutants displayed a range of energetic effects (Fig. 2a, b). On one side of the pore-lining helix S6, L287A which packs against the S5 helix promotes channel opening. S5-S6 packing interactions have been proposed to stabilize the closed state of the HCN channel13 and the potential reduction in van der Waals interactions at this position might facilitate gate opening. In contrast, V299A (at the intracellular end of the helical bundle gate, nestled against the neighboring S6) as well as T288A (towards the middle of S6), promote channel closure. Together, these results suggest reorganization of S5-S6 and S6-S6 inter-helical packing upon channel activation-deactivation.
Figure 2: KAT1 pore and voltage-sensing domain structure; alanine scanning of pore inner gate region.
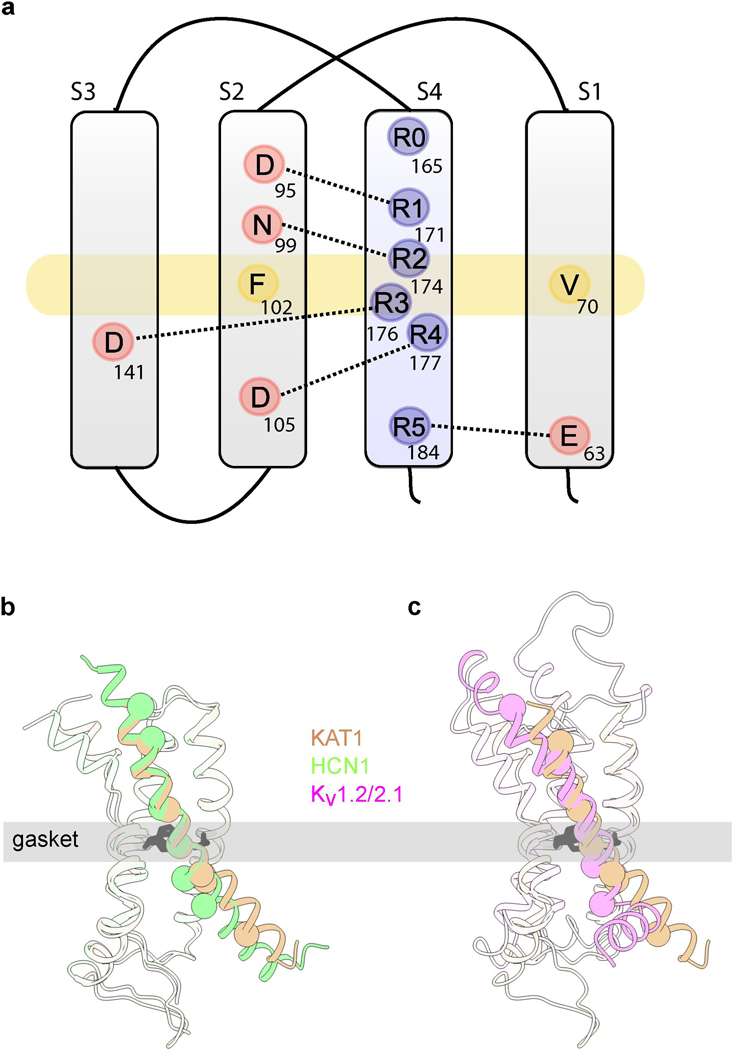
a, View of pore, with only two subunits shown for clarity. Sticks are shown for selectivity filter residues, as well as inner gate-forming residue I292, as well as functionally-important residues L287, T288 and V299. Residues are colored by effect of alanine mutagenesis (see legend inset). b, Deactivation energies of alanine mutants, calculated from G-V relations (Extended Data Fig. 4b). Shown are wild-type (n = 11), L287A (n = 19), T288A (n = 4), L291A (n = 10), I292A (n =10), T296A (n = 10), V299A (n = 8), H301A (n = 10) where n = X biologically independent cells. c, Rotated views of KAT1em VSD. Stick side chains are shown for the hydrophobic gasket: F102 and V70, for key residues on S4: R165 (R0), R171 (R1), R174 (R2), R176 (R3), R177 (R4), R184 (R5), and for counter-charges/dipoles: E63, D95, N99, D105, D141.
KAT1em VSDs are arranged as four-helix bundles, each with a centrally located hydrophobic gasket (or plug) formed by the side chains of F102 and V70 (Fig. 2c). S4 arginines R0 (165), R1 (171) and R2 (174) are positioned above the gasket, while R3 (176), R4 (177), and R5 (184) are located below the gasket (Fig. 2c, Extended Data Fig. 5a). This conformation of the KAT1 VSD corresponds to an ‘up’, or depolarized state, which in the nominal absence of a field (0 mV) is coupled to a closed pore domain. Limiting slope analysis in KAT1 has suggested an effective ze of ~3 e per channel (~0.75 e per sensor)3 consistent with R2, and possibly R1, serving as the main sensing charges. Accordingly, mutants R174Q and R171Q failed to yield currents. As will be detailed later, mutant cycle and metal bridge data also indicate that the VSD structure corresponds to an ‘up’ state, and point to a number of residue-residue pairs whose interactions likely change upon transitioning to the ‘down’ state during membrane hyperpolarization.
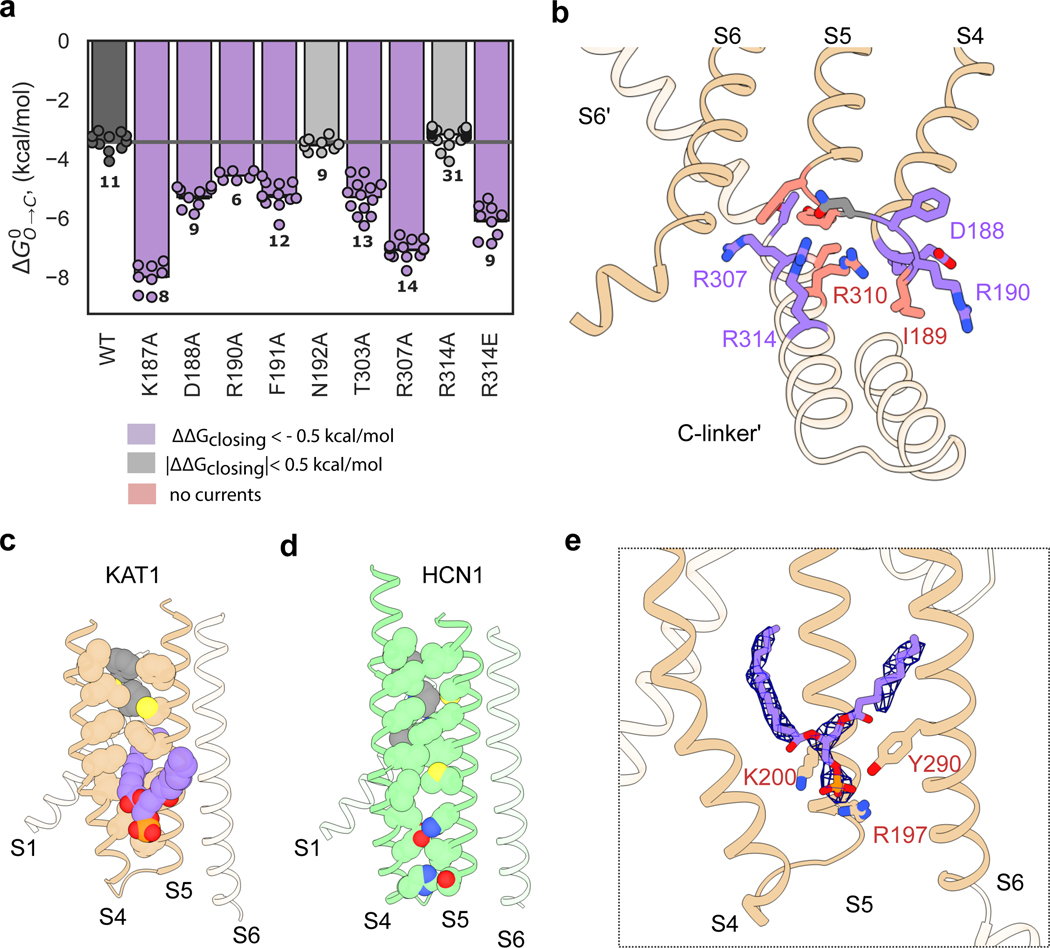
KAT1em voltage-sensing and pore domains interact via two major interfaces: the first near the intracellular face of the channel (Fig. 3a,b) with the participation of S4 and S5 overlaying the C-linker of the adjacent subunit and the second near the extracellular side formed by the intercalation of S1 between S4 and S5 of the same subunit (Fig. 3c). At the first, intracellular interface the extended length of the KAT1em S4 mediates interactions between S4, S5, and the C-linker. The intracellular ends of the S4 and S5 helices come to rest on top of the C-linker, forming a tightly packed interface. Notably, R310 from the C-linker snakes upwards underneath the S4-S5 linker, coming within 4 Å of the backbone carbonyl of the S4 helix (Fig. 3b). Mutations designed to disrupt this charge to helix-dipole interaction, R310K/Q/N/E/A, failed to yield any currents, despite wild-type-like expression for R310K (Extended Data Fig. 6h,i), supporting a critical role of R310 in channel gating. The rest of the S4-S5-C-linker interaction surface appears to be formed by van der Waals contacts, as well as potential hydrogen bonds between Y193 (in S5) and T306 (in C-linker) as well as between R197 (in S5) and T303 (in C-linker).
Figure 3: The KAT1 VSD-pore interface and lipid binding conformation.
a, Deactivation energies of S4-S5-C-linker interfacial mutants calculated from G-V relations (Extended Data Fig. 7a). Shown are wild-type (n = 11), K187A (n = 8), D188A (n = 9), R190A (n = 6), F191A (n = 12), N192A (9), T303A (n = 13), R307A (n = 14), R314A (n = 31), R314E (n = 9) where n = X biologically independent cells. b, Mapping of electrophysiology data from a colored by the effect of mutation as indicated in legend inset. Shown as sticks are key S4-S5 linker residues: K187, D188, I189, R190, N192, Y193, F194, and key neighboring subunit C-linker residues: T306, R307, R310, R314. c, KAT1 upper VSD-pore interface (S1, S4, S5) residue packing shown as spheres. Bound phospholipid in the hydrophobic window is shown in purple. d, Upper interface of HCN1 (PDB ID: 5U6O), shown in analogous view to c. e, Bound phospholipid density with its head group coordinated by R197, K200, and Y290.
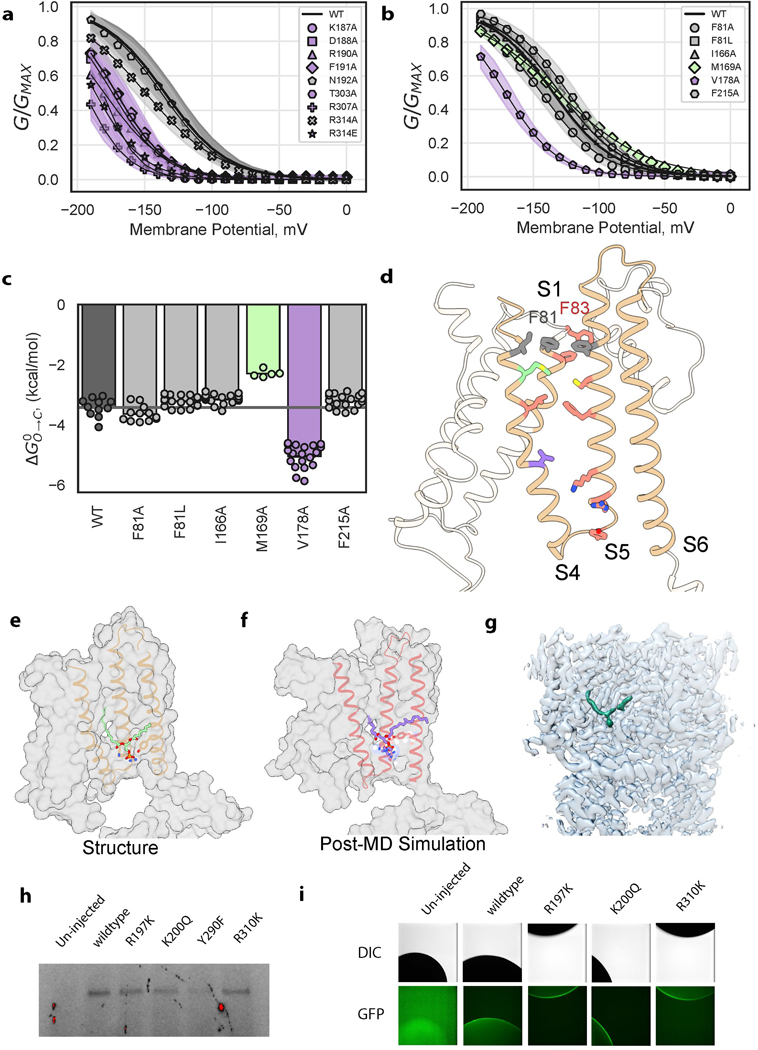
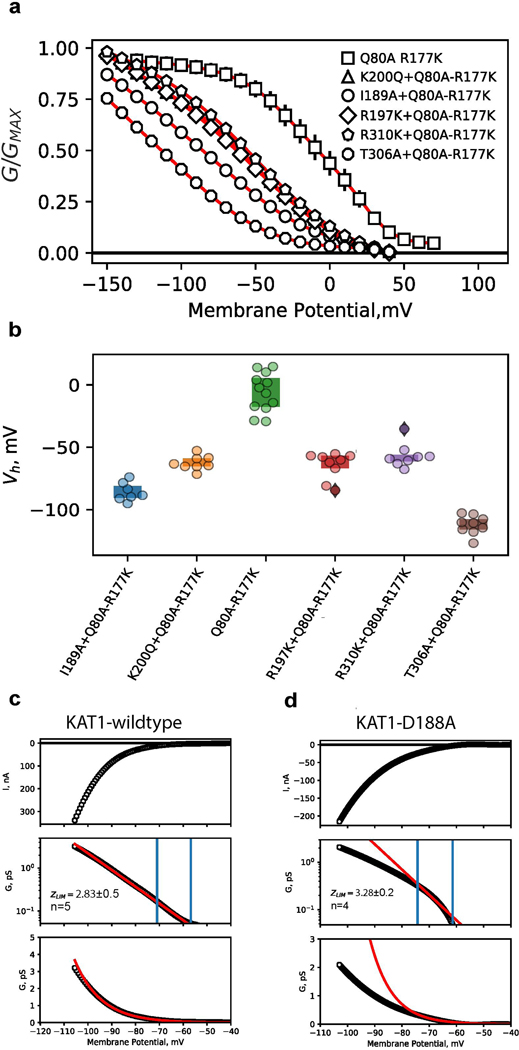
Extensive mutagenesis was carried out on most all residues making productive interactions at the intracellular interface (Fig. 3a,b, residues colored by effect). All mutants that generated measurable currents (K187A, D188A, R190A, F191A, N192A, T303A, R307A, and R314A/E) require more energy for channel opening: the midpoints of activation shift towards more negative potentials (Fig. 3a, Extended Data Fig. 6a). Many mutants (I189A, Y193F/A, F194V/A, R197K/Q/A, K200Q/A, T306A, F309A, R310K/Q/N/E/A) failed to give currents (data not shown). However, when cRNAs encoding various loss-of-function (LOF) mutations (I189A, R197K, K200Q, T306A, R310K) were individually mixed and co-injected with a gain-of-function (GOF) double-mutant (Q80A-R177K) cRNA, currents with left-shifted activation curves were observed. Such a phenotype is intermediate between the LOF and GOF mutants (Extended Data Fig. 7a, b) consistent with formation of heterotetrameric channels. This behavior suggests that when these specific LOF mutations are present in a homotetrameric 4/4 stoichiometry, they severely left-shift the channel activation potential outside of the practical measurement range.
The mutations at the intracellular sensor-pore interface might affect the energetics of the sensor, the pore, the coupling between sensor and pore, or either sensor/pore and coupling. We suspect that at least some of these mutants alter coupling energetics (12 mutants in total, covering the entire S4-S5-C-linker interface, Fig. 3a,b, Extended Data Fig. 6a,b). However, due to the technical challenge of monitoring sensor function in KAT1 mutants (by gating currents or fluorescence) we cannot conclusively determine the contributions of each individual residue to sensor-pore coupling. As a partial and preliminary readout of sensor motion/function, we attempted limiting slope analyses using macroscopic currents for the two VSD residues that are at the intracellular VSD-pore interface (K187A and D188A) as a way to estimate the amount of charge moved upon channel activation. Compared to the wild-type channel, D188A moves a similar amount of charge upon activation, despite its left-shifted ionic current activation, thus it is possible that D188A impairs sensor-pore coupling (Extended Data Fig. 7c,d). Low expression levels of K187A prevented robust limiting slope analyses (data not shown) and it is possible that K187A impairs VSD function rather than coupling. More generally, the result that the majority of KAT1 VSD-pore mutants generate channels with an energetic bias for the closed state over the open state is consistent with the hypothesis that the pore domain of KAT1 is closed by “default” and the VSD performs work to open the pore at negative potentials 4,14–16. Future functional and structural experiments conducted in the isolated pore domain of KAT1 may further test this hypothesis.
Within the plane of the membrane, KAT1’s VSD and pore are separated by a hydrophobic window. This window is absent in the HCN1 structure; S4 and S5 form zipper-like interactions along their length (Fig. 3d) 13. Remarkably, KAT1’s hydrophobic window is filled with a tubular density (Fig. 3e, Extended Data Fig. 6e,f,g), which we have putatively assigned as the alkyl chain of an intercalated phospholipid, and is absent in all other ion channel structures. The phospholipid’s head group is coordinated via charge-charge and hydrogen-bonding interactions by R197 and K200 on S5 and Y290 on S6 (Fig. 3e). All mutations introduced to the lipid-coordinating residues (R197K/Q/A, K200Q/A, Y290F/A) abrogated currents (data not shown), despite wild-type-like membrane expression of R197K and K200Q (Extended Data Fig. 6h,i), suggesting a structural or functional role for the bound lipid. During a ~3.5 μs MD simulation in which a lipid-less KAT1 was initially placed in a POPC bilayer, lipid molecules from the bulk stably occupied similar binding conformations to that seen in the cryo-EM structure (Extended Data Fig. 6e,f). KAT1 and other plasma membrane plant Kv channels are strongly modulated by PIP2 via an unknown mechanism 17 and this bound lipid may indicate a binding site of PIP2 or some other modulatory lipid. Given the placement of this binding site at the functionally critical S4-S5-S6 interface, the bound lipid may well constitute an integral component of the gating machinery. In addition, KAT1 is known to open remarkably slowly: the time constants for gating and ionic currents are separated by approximately three orders of magnitude (gating current and ionic current activation time constants of ~270 μs and ~120 ms, respectively)3. A requirement for lipid binding (Fig. 3e) or reorientation upon gating is a speculative, yet testable hypothesis to explain this kinetic disparity.
In contrast to the intracellular interface, at the extracellular interface formed by S1, S4 and S5, mutagenic perturbations yielded nuanced effects on the channel energetics (Extended Data Fig. 6b,c,d). These mutants led to three distinct phenotypes: nonfunctional channels (F83A/L L172A, F207A, C211A), wild-type-like channels (I166A, F215A), or channels that are slightly harder to open (F81A, V178A). We suggest that the upper S1-S4-S5 interface is likely crucial for channel assembly and stability (due to the several mutants abrogating current), yet might not represent the major pathway of energy transfer from VSD to pore.
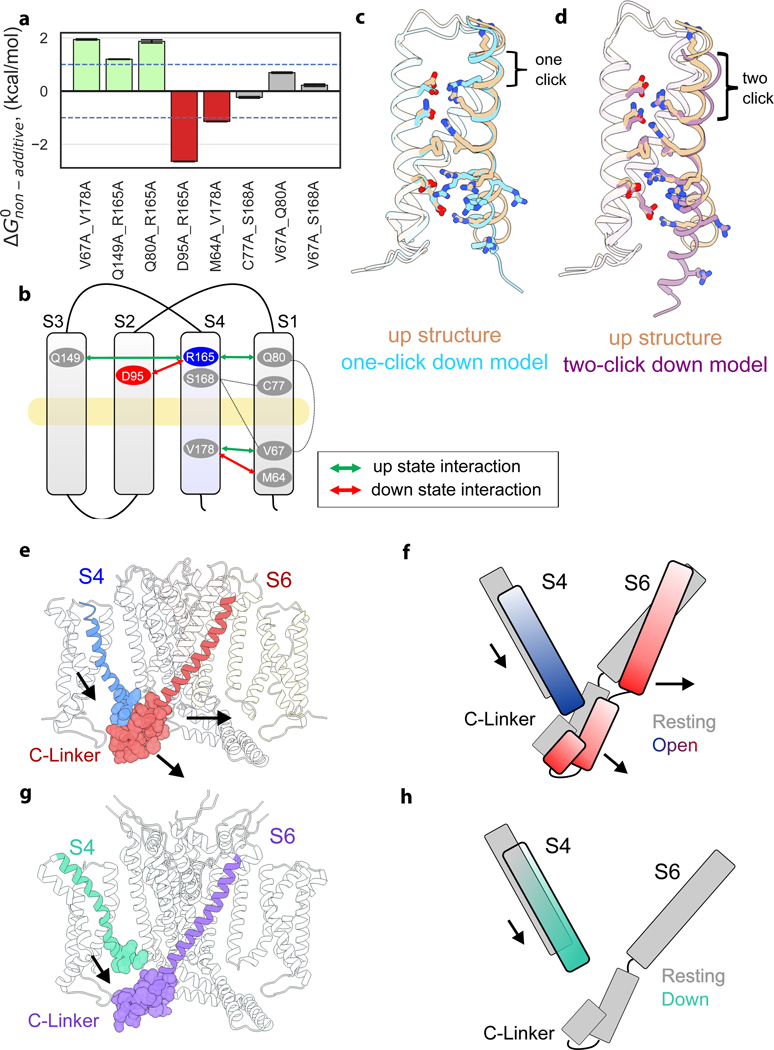
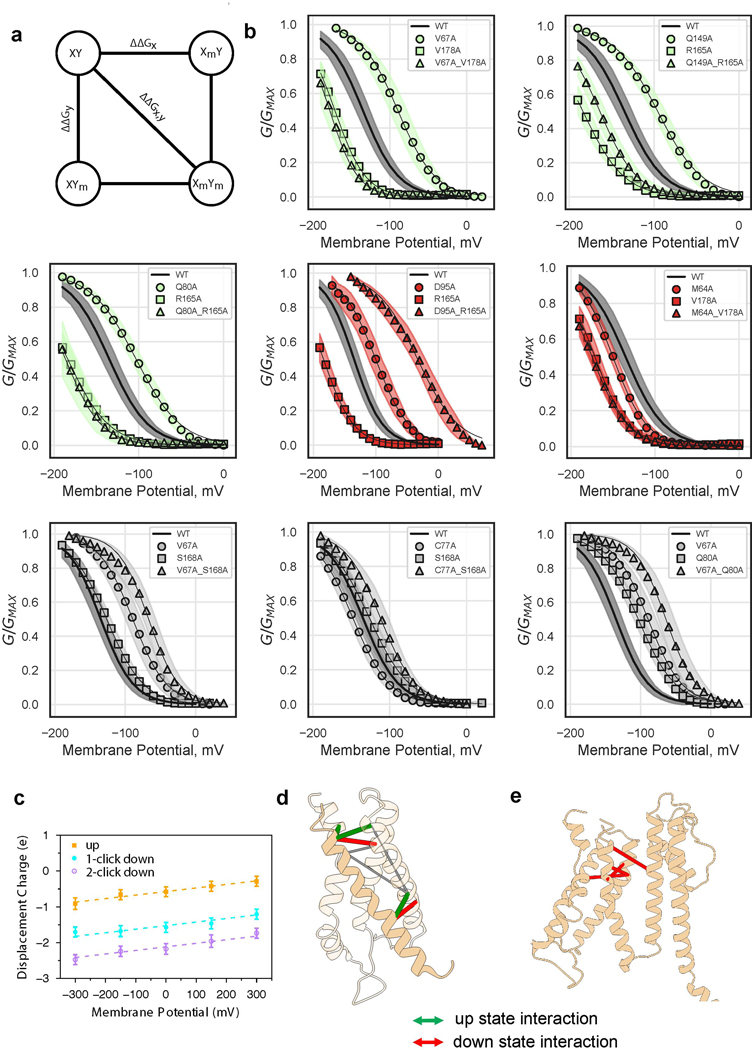
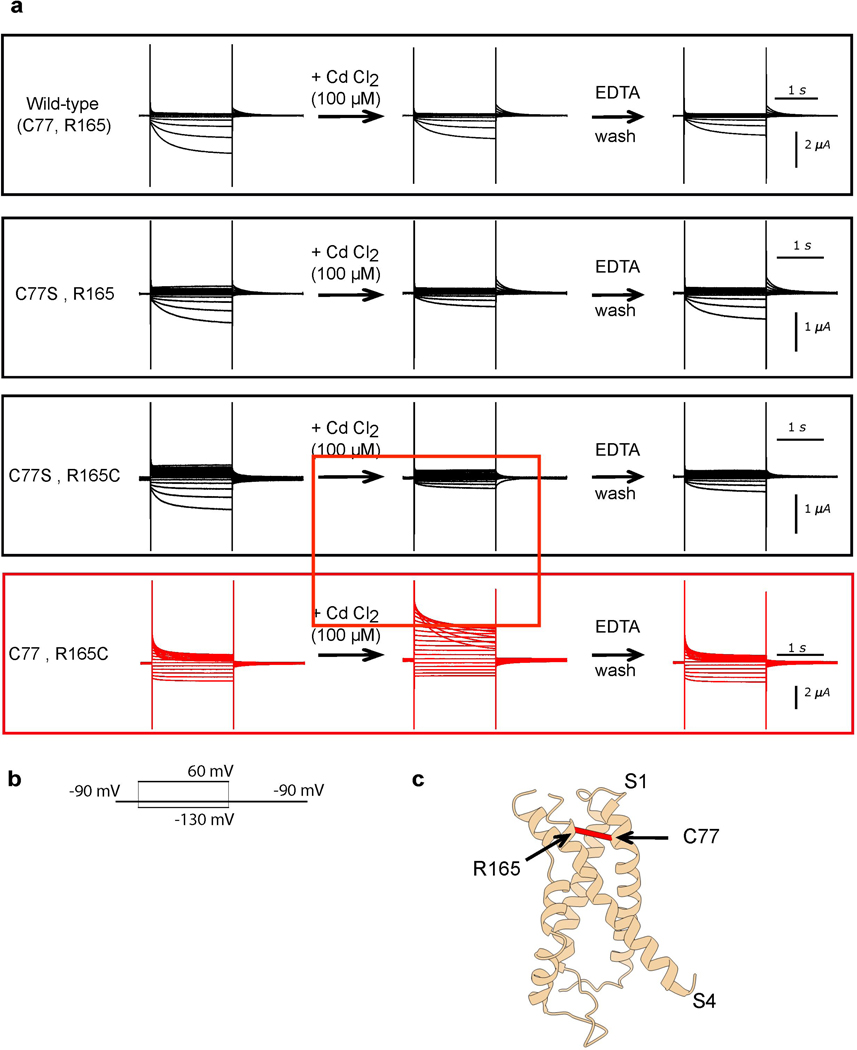
Given the structural and energetic relationship between VSD and pore, in particular the tight packing at the S4-S5-C-linker interface and the severe loss-of-function phenotypes of mutants at this interface, how might KAT1 open upon membrane hyperpolarization? As a first step towards answering this question, we sought to estimate the extent and nature of the VSD conformational change associated with KAT1 opening. We employed double mutant cycle analysis (Fig. 4a-d, Extended Data Fig. 8)18 to interrogate a subset of residue-residue interactions which might change upon hyperpolarization and construct hypothetical ‘down’ state models of the VSD, which correspond to the open channel at hyperpolarized potentials. Calculated |ΔGnonadditive| values greater than 1 kcal/mol 19 are interpreted as a state-dependent interaction between two residues, with negative values of ΔGnonadditive indicating stronger interaction in the ‘down’ state, and vice versa. Based on this mutant cycle analysis we identified two residues on S4, R0 (R165) and V178, each of which exchanges different interaction partners upon VSD activation (Fig. 2b,c, Extended Data Fig. 8). Furthermore, metal bridging experiments point to a cadmium-dependent interaction between R165C (R0 on S4) and C77 (on S1) that promotes channel opening and thus represents an additional ‘down’ state interacting pair (Extended Data Fig. 9).
Figure 4: Hypothetical modeling of the KAT1 VSD down state, and implications for electromechanical coupling and gating polarity.
a-d, Hypothetical modeling of KAT1 VSD activation. a, Plot of nonadditive energies derived from double mutant cycle analysis, with 1 kcal/mol threshold shown as dotted lines. Data shown are the calculated ΔGnonadditive (see methods) using the mean and standard deviation of each data set. Sample sizes are provided in Extended Data Figure 8b (from which the data are derived). b, Schematic of interacting residues, using color scheme of panel a. c, One-click down state model (blue) derived from interacting pairs and equilibrated by MD simulation. d, Two-click down state model (purple) derived from interacting pairs and equilibrated by MD simulation. e-h, Hypothetical models for electromechanical coupling and gating polarity in KAT1. e, Side view of KAT1em, with pseudo CNBDs removed for clarity. Van der Waals sphere representation highlights tight packing between the ‘up’ S4 and closed C-linker, packing which would be disrupted by a one-click downward movement of S4. f, Cartoon of S4-C-linker coupling. g, Side view of depolarization-activated channel rnEag128, highlighting disengagement of S4 and C-linker when the sensor is ‘up’ and the intracellular gate closed. N and C-terminal cytosolic domains removed for clarity. h, cartoon of S4-C-linker coupling in rnEag1, highlighting how the increased distance between S4 and C-linker might preclude hyperpolarization activation.
These ‘down’ state interacting pairs were then used to construct simplified, hypothetical ‘one-click’ and ‘two-click’ down VSD models, in which the S4 helix moves downward by one and two helical turns, respectively, in the context of the isolated KAT1 VSD (Fig. 4c,d). Molecular dynamics (MD) simulations were used to calculate the amount of gating charge displaced during these putative transitions, allowing for comparison to electrophysiological limiting slope estimates which provide a lower bound of ~0.75 e per VSD in KAT1 3. We obtained 1.02 e for the one-click mode and 1.57 e for the two-click model by MD simulation (Extended Data Fig. 8c). Our hypothetical models, particularly the one-click model, are consistent with the literature limiting slope estimate, double mutant cycle and metal-bridge constraints, and previous second-site suppressor studies (Extended Data Fig. 8e) 20,21. Our proposed KAT1 VSD motion would encompass a ~5–7 Å displacement, similar to that proposed for depolarization-activated channels 22 and as has been observed in other VSD structures 23–26. Thus, the major question becomes: how might a “canonical” downward VSD motion lead to pore opening in a hyperpolarization-activated channel 2,3,27?
In our hypothetical model, a downward, hyperpolarization-driven movement of S4 is directly coupled to a subsequent lateral reorientation of the C-linker of the neighboring subunit, ultimately opening the S6 gate (Fig. 4e,f). Though with a similar architecture, the structure of depolarization-activated Eag1 (also captured with an ‘up’ voltage sensor and closed intracellular gate), shows the S4 disengaged from the C-linker (Fig. 4g)28. According to our model, a downward movement of the S4 of Eag1 would be unable to trigger channel opening upon membrane hyperpolarization (Fig. 4h), consistent with the depolarization-activated phenotype of EAG1. It is also worth noting that although KAT1 is nominally non-domain-swapped, the tight interaction between S4 and C-linker in an adjacent subunit at rest (0 mV) ultimately leads to a process of activation gating dominated by direct communication between subunits.
Our proposal for a direct coupling mechanism for KAT1 contrasts with the allosterically coupled nature of voltage-sensitive gating reported for HCN channels 5,29–31, where coupling might not be as strong as suggested for KAT1 3. Supporting this proposal, KAT1, unlike HCN, is not activated by cyclic nucleotides 10 and the structural conformation of the KAT1em pseudo-CNBD is already compatible with an ‘activated’ ligand binding domain conformation even in the absence of ligand (Extended Data Fig. 4c-g)13. Therefore, we suggest that perhaps KAT1 is mechanistically closer to a “reversed” depolarization-activated, non-domain-swapped channel like Eag/hERG, even though KAT1 lacks the cytoplasmic Per-Arnt-Sim (PAS) domain of Eag/hERG 28,32,33. In view of these results, the present proposal is likely to have direct implications to the mechanism of gating and electromechanical coupling in non-domain-swapped channels like Eag and hERG channels, where electric field transduction (and not nucleotide binding) represents the sole driving force for channel gating. We anticipate that the KAT1 structure will serve as a framework for future functional and engineering studies of ion channels. Such efforts in plants might hold promise in improving carbon assimilation and optimal biomass production34.
Online Methods
Molecular Biology and Biochemistry
A DNA construct encoding amino acids M1-S502 was codon optimized for sf9 expression and synthesized by Integrated DNA Technologies. This gene was subcloned into a modified pFastBac vector containing a C-terminal 3C protease site, eGFP, and His8 using restriction sites 5’NotI and 3’XbaI. Baculovirus was generated via the Bac-to-Bac method (Invitrogen). P0 virus was amplified once to yield P1 baculovirus, which was used to infect sf9 cells (ATCC CRL-1711) at a 1:50 v/v ratio. Cells were harvested 36–40hrs post infection, washed in phosphate-buffered saline pH 7.4, dounce homogenized in hypotonic buffer A (20mM HEPES pH7.4, 20mM KCl, 10mM MgCl2) and ultracentrifuged. This hypotonic lysis cycle was repeated four times and was subsequently followed by one cycle in hypertonic buffer (buffer A plus 800mM NaCl). Membranes were resuspended in 50mM HEPES pH7.4, 200mM KCl supplemented with 40% glycerol and flash frozen. For purification all steps were performed at 4°C. Membranes were thawed, diluted with glycerol-free buffer and detergent-extracted in 50mM HEPES pH7.4, 200mM KCl, 1% DDM (anatrace), 0.2% CHS (steraloids), asolectin (Sigma, crude) 0.05mg/ml for 90min. Solubilized supernatant was isolated by ultracentrifugation and diluted with low-detergent buffer to drop DDM/CHS concentration to ~0.5%. Supernatant was batch bound to Cobalt IMAC Talon beads (clontech) for 2–3hrs with 5mM imidazole present. Beads were collected by low speed centrifugation and washed in batch with 50mM HEPES pH7.4, 200mM KCl, 0.05% DDM (anatrace) 0.01% CHS (anatrace), asolectin (avanti) 0.05mg/ml, 15mM imidazole. Beads were transferred to plastic column and further washed exchanging stepwise to buffer containing digitonin 0.05% (millipore) and eluted in 50mM HEPES pH7.4, 200mM KCl, 0.05% digitonin, 250mM imidazole. Protein was cleaved by HRV 3C protease40 for 3hrs, concentrated and subjected to size exclusion chromatography on a superose 6 column (GE) with running buffer: 50mM HEPES pH7.4, 200mM KCl, 0.05% digitonin, 2mM CaCl2. Peak fractions were collected and concentrated to 4–5mg/ml (millipore concentrator unit).
Cryo-EM analysis
Quantifoil 200mesh 1.2/1.3 grids (Quantifoil) were plasma cleaned for 30sec in an air mixture in a Solarus Plasma Cleaner (Gatan). Grids were frozen in liquid nitrogen-cooled liquid ethane in a Vitrobot Mark IV (FEI) using the following parameters: 3.5 ul sample volume, 2.5 sec blot time, blot force 3, 100% humidity, at a temperature of 22 °C and double filter papers on each side of the vitrobot.
Grids were screened on a 200 kV Talos side entry microscope (FEI) equipped with K2 summit direct detector (Gatan) using a Gatan 626 single-tilt holder. Replicate grids from the same preparation were shipped to the National Cryo-Electron Microscopy Facility at the National Cancer Institute. Grids were imaged on a Titan Krios with K2 detector (super-resolution mode) and GIF energy filter (set to 20eV) at a nominal magnification of 130,000 corresponding to a super-res pixel size 0.532 Å/pix. The dose rate was roughly 4.7e-/pix/s and the exposure time was 12 seconds, yielding a total post-GIF dose of 38–43 e-/Å2. 1502 movies were collected using Latitude (Gatan). Data were processed using motioncor2 41, Ctffind4 42, and Relion 2 43. 1,500 particles were manually picked and classified in 2D to generate autopicking templates. Autopicking in Relion2 using a picking threshold of 0.5 gave ~120k Particles, which were subjected to 2D classification. 110k particles were selected from good classes, and 10k of these particles were used to generate an initial model with C4 symmetry imposed. All 110k particles were then subjected to autorefinement, yielding a 4.3 Å nominal resolution map. Inspection of the two tetramers within the octamer indicates that they are nearly indistinguishable, and are related by ~45 degree rotation at the pCNBHD-pCNBHD interface. Classification of all 110k particles in C1-symmetry closely resembled the overall architecture of the C4-symmetry-imposed map, albeit with lower resolution and a slight tilt of the two micelles with respect to one another. The best two classes from the C1-symmetry job were combined, yielding ~90k particles, which were then subjected to autorefinement in C4-symmetry. Refinement of the octamer yielded a map that was used for model building of the cytosolic domains. Focused refinement on the tetramer and subsequently the transmembrane (TM) region of the tetramer gave a reconstruction with improved map quality supporting confident building of the TM regions. Postprocessing of the focused TM map was performed in Relion 2 using the star file of the K2 detector at 300 kV and a masked nominal resolution of 3.5 Å by 0.143 FSC criterion was calculated36,44,45. Local resolution was calculated by ResMap46 and particle orientation distribution calculated by Relion 243. A B-factor of −134 was used for sharpening and visualization.
Model building
Swiss-model 47,48 was used to generate homology models of KAT1em using hsHCN1 and rnEag1 as templates 13,28. The hsHCN1-template model was then stubbed to poly alanine using Chainsaw 49, and all loops were deleted. Secondary structural elements were rigid body fit to the density, and then refined in real space without secondary structure restraints using phenix.real_space_refine 50,51. Subsequent manual building in Coot 52–54 registered secondary structural elements using bulky residues and built loops where appropriate. Residues that did not show side chain density were stubbed at the Cβ. Final refinement of the transmembrane and cytosolic domains were conducted independently, against the TMD-focused map or the full-molecule map, respectively. Strong NCS constraints in phenix.real_space_refine were used to immobilize the domain that was not currently being refined (ie the cytosolic domain during the TMD-focused map refinement).
The tetramer model was generated by applying symmetry operations to the monomer in UCSF Chimera 55. The octamer model was generated by docking two tetramers in Chimera using the fit-in-map tool. Side chains of the “C” helices at the octamer interface could not be assigned definite rotamers likely due to pseudo-symmetry and were stubbed at the Cβ.
Molecular Biology and Electrophysiology
The full-length, native KAT1 cDNA from Arabidopsis Thaliana was obtained from the Arabidopsis Biological Resource Center, and DNA was cloned into the pBSTA vector 56,57. Mutations were introduced via site-directed mutagenesis and confirmed by Sanger sequencing. cRNA was synthesized using the T7 RNA expression Kit (Ambion, Invitrogen). Approximately 24hr post surgical removal from adult frogs, in accordance with animal usage protocol 71475 of the University of Chicago Institutional Animal Care and Use Committee, 50–100ng cRNA in 50nl RNAse-free water was injected into enzymatically-defolliculated oocytes. Oocytes were maintained at 18°C in Standard Oocyte Solution (SOS), a solution containing 10 mM HEPES pH 7.5, 100mM NaCl, 5mM KCl, 2mM CaCl2, 1mM MgCl2, and 50 μg/ml gentamycin.
Macroscopic currents were recorded 36–48hrs post injection on a two electrode voltage clamp (TEVC) setup, comprising a OC-720C (Warner Instruments), Digidata 1322A 16 bit digitizer (Axon Instruments) and a Windows XP PC running Clampex10.3. Oocytes were impaled with two 3M KCl-filled Ag/AgCl electrodes with resistances in the range 0.2–1.0 MΩ, in bath containing SOS. For each mutant, more than 4 recordings were obtained, each from a different oocyte. Non-expression of a mutant was determined by absence of tail currents for more than 10 oocytes, and was confirmed in an independent injection session. KAT1 K+ currents were evoked by voltage steps of 1 s, going from 0 to −190 mV in 10-mV steps. The holding potential was set at 0 mV except for extremely right-shifted mutants, the holding potential was set to +20 mV or +70 mV in order to measure the full activation curve.
The isochronal tail currents were measured in isopotential condition after the decay of the oocyte linear capacitive response. The conductance-voltage relation (G-V) was obtained by constrained fitting the isochronal tail current to:
Where Vh is the half-activation voltage, R is the gas constant, T is the absolute temperature, z is the apparent gating charge, and F is Faraday’s number. The first derivatives of the raw data (ITAIL-V) curve were numerically calculated and normalized. For the majority of the mutants, a clear peak in the first derivative was observed; the mean and variance of the peak were used to constrain the calculation of Vh. In extremely left-shifted mutants in which the peak in the derivative was not experimentally observed, the last (most negative) voltage was set as the maximum value for Vh with the minima set as −300 mV. Initial values for z were set to that of the wild-type channel, and the range of possible values is 0–4. Additional information is provided in the methods supplement.
Individual G-V relations were fitted using Maximum likelihood via Monte-Carlo Markov Chain method in the lmfit package (https://lmfit.github.io/, Python). The G/GMAX curve was obtained from normalizing the G(V) by A1 and A2 values from the fit. A bayesian sampling of the posterior distribution for the parameters Vh and z applied to the normalized data set shows single solutions for all the mutants. Recordings were excluded from analysis if leak or endogenous currents prevented analysis. A record was determined to be an outlier and thus excluded, if the Vh was more than 10 mV (approximately two standard deviations) outside the mean of the normalized ensemble, or if the z was more than two standard deviations outside the mean of the normalized ensemble. In all figures data are presented as mean values, with a surrounding area depicting standard deviation.
For metal bridging experiments, oocytes were recorded in SOS solution supplemented with 100 μM EDTA. After taking an initial recording in SOS + 100 μM EDTA, the solution was exchanged to SOS + 100 μM CdCl2, another recorded taken, and the solution again exchanged to SOS + 100 μM EDTA and a final record taken, the whole process performed on the same oocyte. This process was then biologically-replicated five times (five different oocytes), and representative currents from one oocyte are shown.
Double mutant cycle analysis
Three types of residue-residue pair were selected by visual inspection of the structure: up-state pairs, down-state pairs, and negative control pairs (residues whose interactions are expected to be similar in both states). Data were processed as in the section above, and ΔGo->c values extracted. These ΔGo->c values were then used to calculate ΔGnonadditive, as follows:
Residue-residue pairs for which the magnitude of ΔGnonadditive was greater than 1 kcal/mol were considered to interact, and were used in modeling. The selection of the 1 kcal/mol threshold is based on previous double mutant cycle work 19.
Limiting Slope analysis of KAT1 Channels
The ionic currents were recorded using the cut-open oocyte technique. The extracellular solution contained (in mM) 120 K-MES, 2 CaCl2, 10 HEPES, pH 7.4. The intracellular solution contained (in mM) 120 K-MES, 2 EGTA, 10 HEPES, pH 7.4. The slow hyperpolarization was elicited with a voltage ramp from 0 to −100mV (1 mV/s). The inward current was fitted using cubic spline interpolation, and linear leakage correction was performed offline using a piecewise linear fitting from the beginning of the curve to the first turning point, obtained from the second derivative of the curve. Conductance-voltage relations combinations by dividing the current by the driving force, and the limiting slope (z) obtained by linear regression to the logarithm of G-V curve constrained by first and second turning points from the current second derivative. Additional information is provided in the methods supplement.
Oocyte membrane expression test and confocal imaging
Oocytes for each construct (wildtype, R197K, K200Q, Y290F, and R310K) were injected as described above. After 48hrs, wildtype oocytes were recorded and confirmed to give 1–2 μA of tail current. Then, 10 oocytes for each construct, as well as 10 uninjected oocytes, were washed in SOS, mechanically lysed in hypotonic lysis buffer A via pipette tip aspiration. Lysate was cleared of debris by centrifugation (10min, 1,000g), and the supernatant was isolated and ultracentrifuged (30min, 100,000g). The resulting membrane pellet was resuspended in 40 μl extraction buffer (50mM HEPES pH 7.4, 200mM KCl, 1.5/0.3% DDM/CHS), rotated at 4°C for 90 min and subsequently cleared by centrifugation (30 min, 12,000g). Supernatant was then subjected to SDS-PAGE followed by in-gel GFP imaging using a ChemiDoc Imaging System (BioRad).
For confocal imaging, oocytes were first injected and expression confirmed by recording a subset as above. Oocytes submerged in SOS were placed in a glass bottom dish (MatTek), and imaged in an Olympus DSU spinning disk confocal microscope using a 10X objective. Regions of the animal (dark) pole were imaged to avoid intrinsic autofluorescence of the vegetal (light) pole. Each sample received identical GFP channel exposures (5 sec) and DIC exposures (47 msec). Images were batch normalized in SlideBook6 (3i) to allow for a fair comparison between samples, and GFP images were false-colored in ImageJ58.
System construction and molecular dynamics simulations
The deposited tetramer model was prepared for MD simulations by using Coot to manually build the missing S3-S4 loop, and selecting rotamers for stubbed residues to avoid clashes. This model was then embedded into a 1-palmitoyl-2-oleoyl-sn-glycero-3-phosphocholine (POPC) lipid bilayer solvated with a salt solution of 100 mM KCl. The symmetry axis of the protein was aligned along the z-axis. Three K+ ions were placed at the selectivity filter ion binding sites: ‘S0’, ‘S2’ and ‘S4’ of the selectivity filter, separated by two additional water molecules occupying the binding sites ‘S1’ and ‘S3’. The final system was in an electrically neutral state with orthorhombic periodic box dimensions of ~126 × 126 × 142 Å3, consisting of ~227,000 atoms.
First, the all-atom system of the full channel was energy minimized for 5000 steps, followed by a 100 ns equilibration simulation with gradually decreasing harmonic restraints being applied to the protein and the K+ ions and the oxygen atoms of water in the selectivity filter. Then, a further 400 ns simulation was carried out with all restraints being removed. After this, the equilibrated system was simulated longer, up to 3 μs, to study the spontaneous binding of lipids to the VSD-pore interface using the special-purpose supercomputer ANTON2 59.
An isolated VSD (residues: 50−189) was used to estimate the gating charge, ΔQ, corresponding to the conformational change of the VSD between different states by calculating the average displacement charge, <Qd>, of each system. The one-click down and two-click down homology models of the KAT1 VSD were built using the program MODELLER 60, by shifting the S4 helix 3 and 6 residues downwards, respectively, from the up state VSD in the cryo-EM structure, according to the “click” model of VSD movement proposed from the structural study of Ci-VSD 23, which was consistent with the classic helical-screw or sliding helix model.
The up state VSD was inserted into a pure POPC lipid bilayer and the z-coordinates of the Cα atoms of the two aromatic residues F111 and F155 were used to adjust the position of the VSD along the normal axis of the membrane, which was then solvated in a 100 mM KCl solution. The final neutralized system contained ~31,000 atoms. The one-click down and two-click down systems were constructed by only replacing the up state VSD protein with the one-click down and the two-click down VSD proteins, respectively. Thus, the three VSD systems had exactly the same size and components, with different protein conformations.
Each VSD system was energy minimized for 5000 steps and equilibrated for 20 ns with the restraints applied on the protein been gradually decreased from 5 to 0 kcal/mol/Å2 at 0 mV. The equilibrated systems were then simulated at −300 mV, −150 mV, 0 mV, 150 mV, and 300 mV for 50 ns. Snapshots from the last 40 ns trajectories were used to calculate the average displacement charge of each system at different transmembrane voltages, using the partial charge and unwrapped z coordinate of all the atoms 61. The offset constant between the linearly fitted <Qd> of the systems was the gating charge associated with the conformational change between different states.
All the systems were built using the program VMD 62, and all the MD simulations other than the ANTON2 simulation were performed with the program NAMD 63. The CHARMM36 force field 64,65 was used for proteins, phospholipids and ions, and the TIP3P model 66 for water molecules in both NAMD and ANTON2 simulations. All simulations were carried out in an NPT ensemble (300 K, 1 atm) with periodic boundary conditions and a time step of 2 fs. In the NAMD simulations, the temperature and pressure were constrained using the Langevin dynamics and the Nose-Hoover Langevin piston method 67,68, respectively. The electrostatic force was calculated with the particle-mesh Ewald method 69, and the van der Waals interaction was smoothly switched off at 10−12 Å. An electric field scaled by cell basis vectors was applied along the z-axis to simulate the membrane potential 70. In the ANTON2 simulation, the temperature and pressure were constrained using the Nose-Hoover thermostat and the semi-isotropic MTK barostat 67,71. Long-range electrostatic interactions were calculated using the k-space Gaussian split Ewald method 72.
Figure preparation
Structural figures were prepared with ChimeraX 73 and Chimera 55, with the aid of Segger 74,75, and MOLE 38.
Extended Data
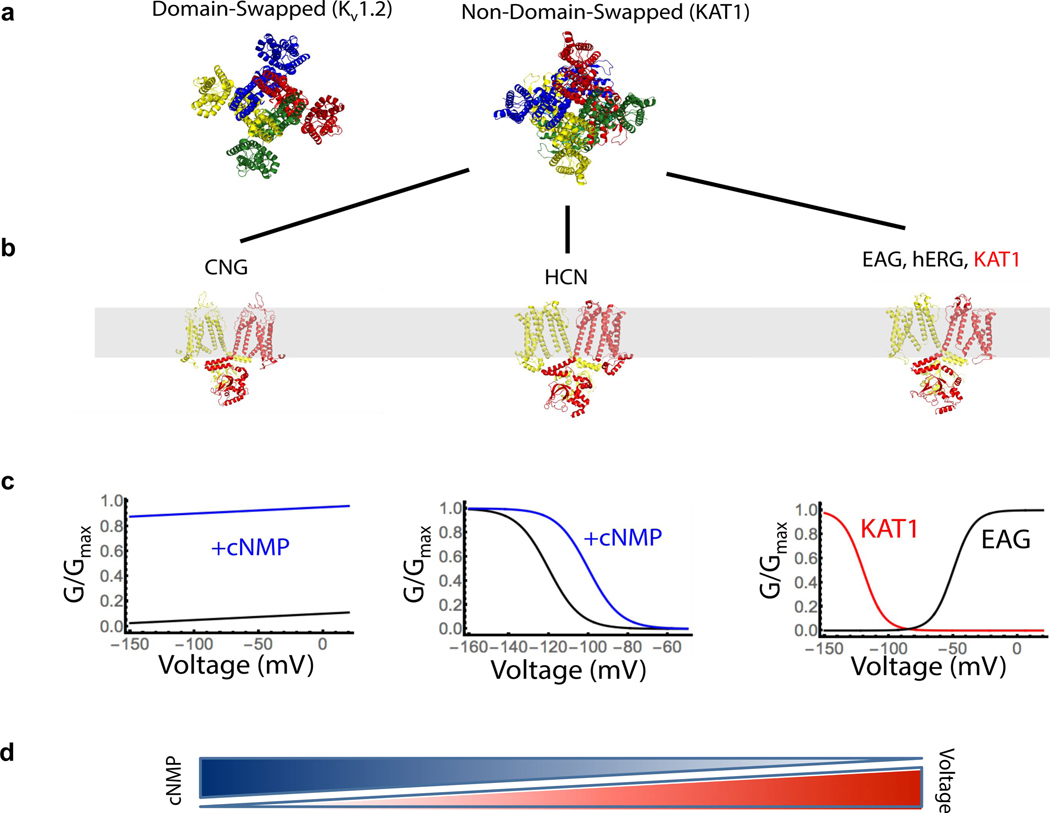
Extended Data Figure 1: Structural and functional diversity of tetrameric ion channels.
a, Two major classes of channels, domain-swapped and non-domain-swapped are distinguished by the relative positions of voltage-sensing and pore domains. b, Solved structures of non-domain-swapped ion channels, two subunits shown for clarity c, G-V relations of each channel subclass d, Gradient depiction of cyclic-nucleotide and voltage sensitivity for subclass members. Figure inspired by James and Zagotta35.
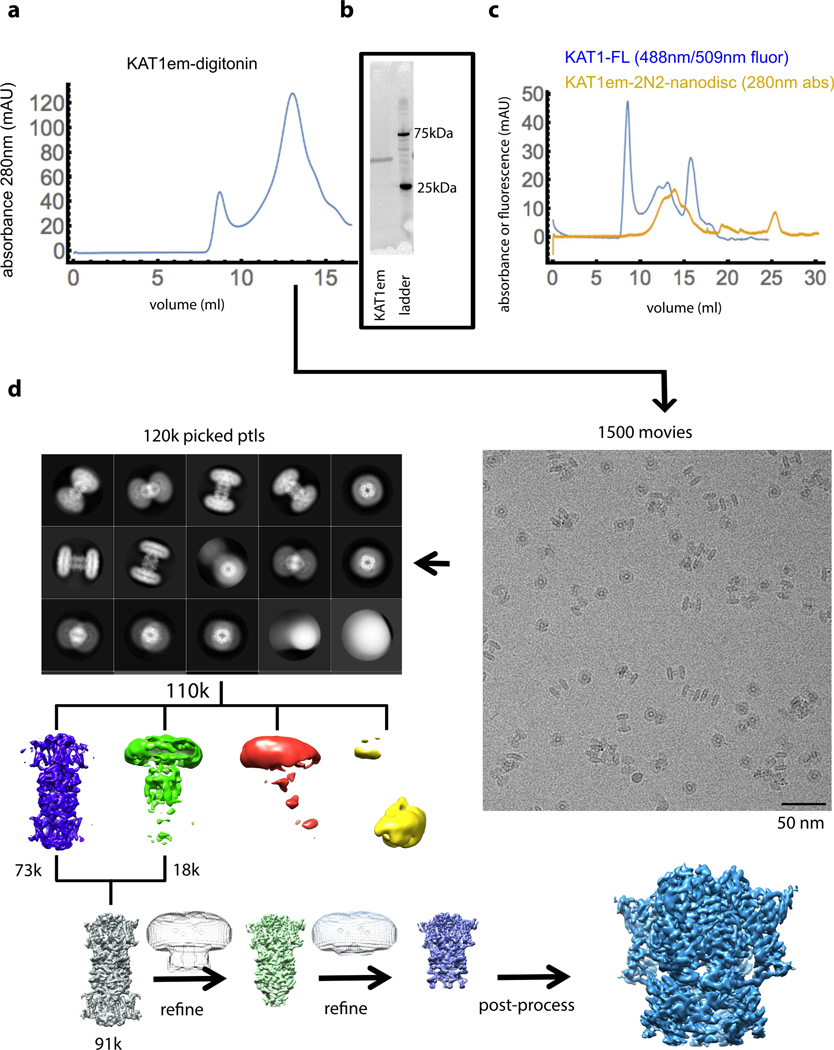
Extended Data Figure 2: KAT1em biochemistry and cryo-EM workflow.
a, Size exclusion chromatograph (SEC) of KAT1em purified in digitonin, run on superose 6 column. b, Stain-free SDS-PAGE of purified KAT1em. SEC and SDS-PAGE results correspond to the preparation used for imaging (d) and are representative of 3 independent purifications. c, SEC of KAT1em in 2N2 nanodiscs (yellow trace), showing putative octamer, tetramer, and empty nanodisc. FSEC of full-length KAT1-Cterminal-GFP (blue trace) showing putative octamer and tetramer. These two samples were not subjected to any cryo-EM experiments, and are included only for the purpose of comparison. d, KAT1em cryo-EM workflow. From 1500 movies, 120k particles were picked and subjected to 2D classification, which then yielded 110k particles, which were classified in 3D without imposing symmetry (4 colored classes). Particles from the best two classes (blue and green classes, 91k total) were subsequently refined, imposing C4 symmetry, and using successive masks to focus on one of the tetramers and finally on the TMD region of one of the tetramers. Additional details are given in methods section.
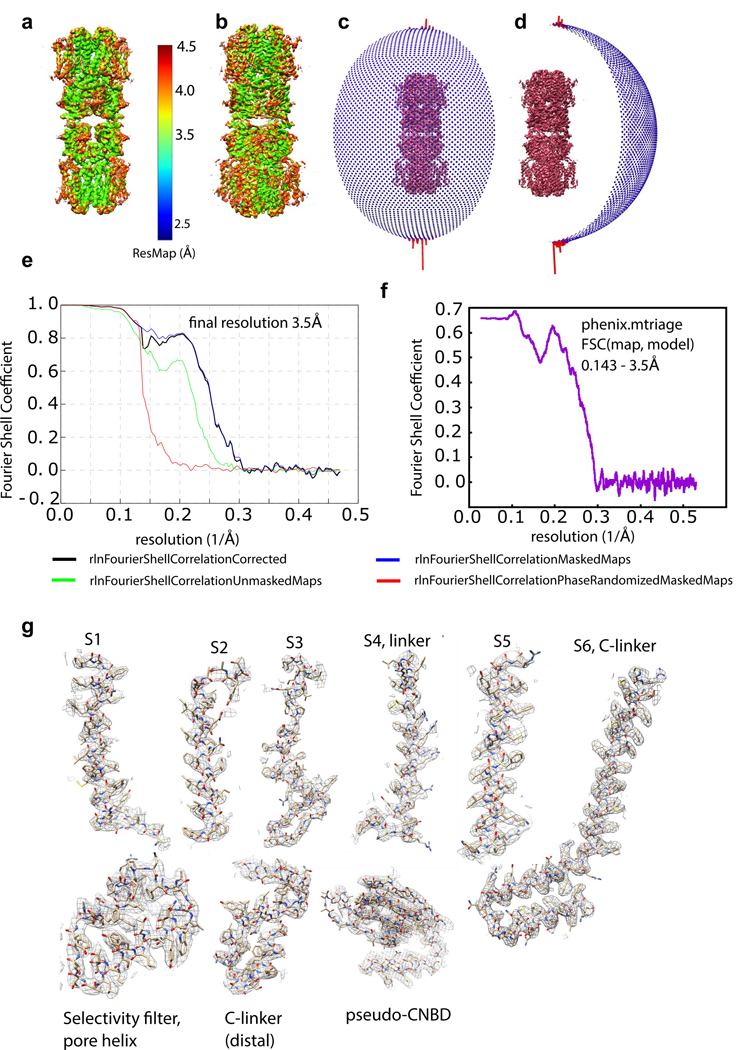
Extended Data Figure 3: Cryo-EM map and model validation.
a, ResMap coloring of unfiltered half map of full molecule b, Same ResMap coloring in a on sharpened full molecule map. c,d, 90° rotated angular distribution plots for refined full molecule. e, FSC plot for transmembrane region focused map. FSC 0.143 criterion is used for resolution determination36. f, FSC(map, model) plot from phenix.mtriage37, indicating correspondence of tetramer atomic model to TMD-focused-refined density map. g, Details of sharpened cryo-EM density map are shown with fitted atomic model.
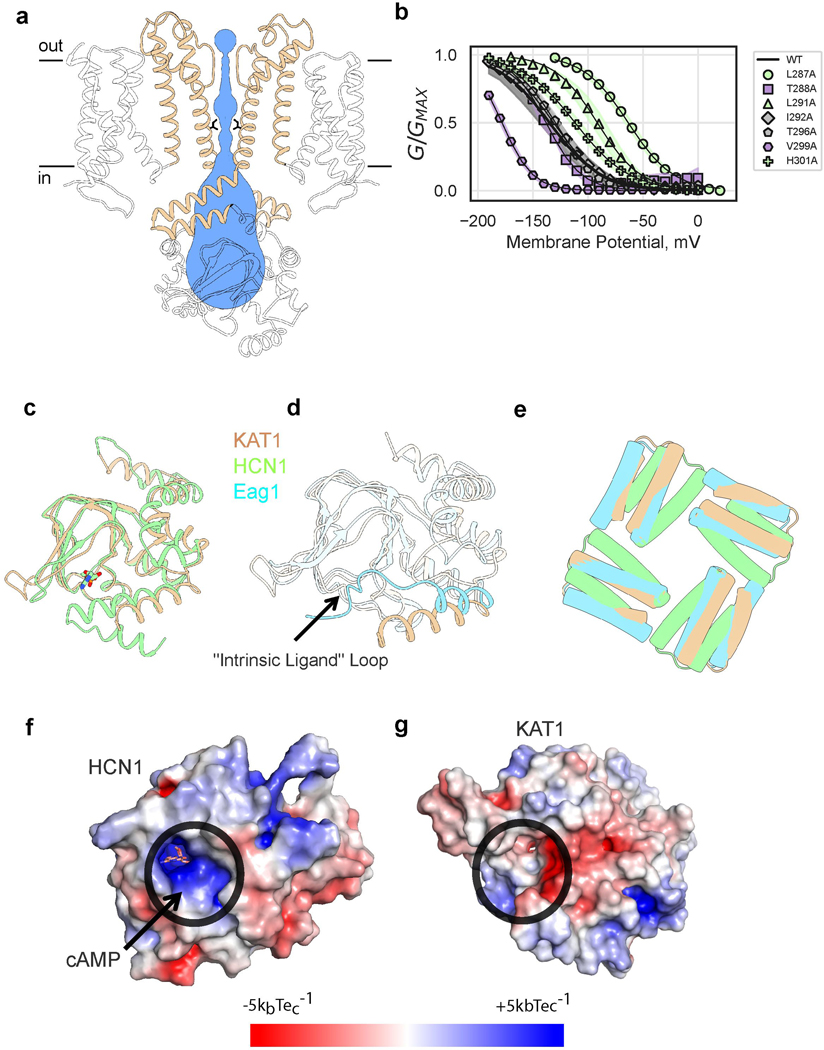
Extended Data Figure 4: KAT1em pore domain and pseudo cyclic nucleotide binding domain.
a, Side view of pore, with only two subunits shown for clarity. Permeation pathway is shown in blue, with inner gate radius calculated by MOLE38 (1.4 Å) or HOLE39 (1 Å), inner gate-forming I292 side chains shown as sticks. b, G-V relations of pore alanine scan. Shaded error regions represent standard deviation, surrounding the symbols which represent the mean. Shown are wild-type (n = 11), L287A (n = 19), T288A (n = 4), L291A (n = 10), I292A (n =10), T296A (n = 10), V299A (n = 8), H301A (n = 10) where n = X biologically independent cells. c, Overlay of KAT1em pseudo-CNBD (tan) and holoHCN1 CNBD (green,PDB ID: 5U6P). The ligand, HCN1-cAMP is shown as sticks in cAMP binding pocket. d, Overlay of KAT1em (tan) and Eag1 (blue, PDB ID: 5K7L). KAT1 lacks “intrinsic ligand” loop of Eag1. e, Top-down view of KAT1em (tan), holoHCN1 (green) overlay, and Eag1 (blue). Structures were aligned/superimposed based on TMD helices. Only C-linker hairpins are shown for clarity to compare relative rotation of the C-linker to TMD, for each structure. The relative rotation of the KAT1 C-linker matches that of Eag1, not HCN1. f,g, Surface electrostatic potential of HCN1 (f) and KAT1 (g), respectively. Ligand binding pockets are circled in black. KAT1 lacks a deep electropositive (blue) pocket as seen in HCN1.
Extended Data Figure 5: The voltage-sensing domain of KAT1em in the ‘up’ conformation.
a, Diagram of key VSD features, showing hydrophobic gasket (F102 and V70, yellow) as well as all S4 charges (blue) and distributed countercharges/counter-dipoles (red). b, c, Overlays of KAT1em (tan) with HCN (green, PDB ID: 5U6O) and Kv1.2/2.1 (pink, PDB ID: 2R9R), respectively, highlighting structural differences between S4 helices. Cα atoms of the positively charged residues of S4 are shown as spheres.
Extended Data Figure 6: Structural and functional characterization of KAT1 VSD-pore interfaces.
a, G-V relations of S4-S5-C-linker interfacial mutants. Shown are wild-type (n = 11), K187A (n = 8), D188A (n = 9), R190A (n = 6), F191A (n = 12), N192A (9), T303A (n = 13), R307A (n = 14), R314A (n = 31), R314E (n = 9) where n = X biologically independent cells. Shaded error regions represent standard deviation, surrounding the symbols which represent the mean. b, G-V relations of upper interface mutants. Shown are wild-type (n = 11), F81A (n = 12), F81L (n = 19), I166A (n = 18), M169A (n = 5), V178A (n = 19), F215A (n = 19) where n = X biologically independent cells. Shaded error regions represent standard deviation, surrounding the symbols which represent the mean. c, Deactivation energies of upper interface mutants calculated from G-V relations in panel b (same sample sizes). d, Mapping of upper interface functional data (shown in panel c). Displayed as sticks are key residues on S1: F80, F81, F83, key S4 residues: I166, M169, L172, V178, and key S5 residues: Y193, R197, K200, F207, C211, F215. e,f Comparison of similar lipid binding conformations observed in the structure, e, and after ~3.5 μs MD simulation, f. g, Cryo-EM density map, with one bound lipid colored green, contoured at the same contour level as the full map. h, SDS-PAGE GFP in-gel imaging result of Xenopus oocyte membrane fractions, extracted in gentle detergent (see methods). Experiment was performed once and each lane is derived from 10 cells. i, Confocal imaging of Xenopus oocyte animal poles expressing various GFP-tagged constructs. Imaging was performed in a single session with normalized exposure times, and each image is representative of 5 independent oocytes.
Extended Data Figure 7: Detailed functional characterization of selected VSD-pore interface mutants.
a, G-V relations for cRNA mixing-coinjection experiments. cRNA encoding loss-of-function (LOF) mutants (I189A, R197K, K200Q, T306A, R310K), for which no currents were observed were selected. These LOF cRNAs were each individually mixed with cRNA encoding a gain-of-function double mutant (Q80A-R177K). Error bars are SEM and symbols represent the mean. Shown are Q80A-R177K (n=12), I189A+Q80A-R177K (n=7), K200Q+Q80A-R177K (n=8), R197K+Q80A-R177K (n=9), R310K+Q80A-R177K (n=8), T306A+Q80A-R177K (n=9) b, Plot of activation midpoints (V1/2) of G-V relations shown in, a. c, d, Limiting slope analyses for KAT1 wildtype, c, and D188A, d. Top panels show raw currents evoked by voltage ramp protocol. Middle panels show conductance-voltage relations, with conductance plotted on a log scale. Data points are black, fits are red. Blue vertical lines mark the first and second inflection points of the curve, the region between which was used to calculate limiting slope (z) values (see methods). For wildtype, z = 2.83±0.5, for D188A z = 3.28±0.2 (values are given as mean ± SD). Bottom panels show data (black) and fits (red) on linear scale. In all panels n = X biologically independent cells.
Extended Data Figure 8: VSD movement during gating.
a, Schematic of double mutant cycle analysis. The difference between ΔΔGx,y and the quantity (ΔΔGx + ΔΔGy) determines the extent of differential interaction between residues x and y, in the up and down states. b, G-V relations for single and double mutants, illustrating residue-residue pairs displaying additivity (Gray) and non-additivity in different directions (Green, up-state-interaction and Red, down-state-interaction). Shaded error regions represent standard deviation, surrounding the symbols which represent the mean. Shown are wild-type (n = 11), M64A (n = 11), V67A (n = 33), C77A (n = 15), Q80A (n = 11), D95A (n = 12), Q149A (n = 21), R165A (n = 21), S168A (n = 17), V178A (n = 19), M64A-V178A (n = 15), V67A-Q80A (n = 13), V67A-S168A (n = 16), V67A-V178A (n = 10), C77A-S168A (n = 14), Q80A-R165A (n = 6), D95A-R165A (n = 5), Q149A-R165A (n = 14) where n = X biologically independent cells. c, Displacement of charge for the isolated VSD in the up, one-click down, and two-click down conformations at different transmembrane potentials. Shown are the mean values and standard deviations calculated using the last 40 ns snapshots (n = 4000) of 50 ns trajectories. Each system was simulated once at each chosen potential. The gating charge is then calculated as the offset constant between the linear fits, resulting in a gating charge of 1.02 e and 0.55 e between the up and one-click down, and one-click down and two-click down states, respectively. d, Mapping of double mutant cycle constraints onto ‘up’ VSD structure. Thick red and green lines connect Cα carbons of interacting pairs. Thin gray lines connect negative control pairs. e, Mapping of literature KAT1 down state interacting pairs21 onto ‘up’ structure. Thick red lines connect Cα carbons of interacting pairs.
Extended Data Figure 9: A cysteine-Cd2+-cysteine bridge in the KAT1 VSD promotes channel opening.
a, Raw current traces for all four combinations of C77(S) and R165(C). Upon washing with 100 uM CdCl2, current increases only in the C77-R165C condition (red box, middle panel), and then decreases again upon EDTA wash. Representative data are shown from the same oocyte, and each experiment was repeated five independent times (five biologically independent oocytes) with similar results. b, Pulse protocol used during experiment c, Mapping of C77 (on S1) and R165 (on S4) onto the ‘up’ VSD structure of KAT1. Alpha carbons are indicated by a red line.
Extended Data Table 1:
Cryo-EM data collection, refinement and validation statistics
| KAT1em TMD (EMDB-21018) (PDB 6V1X) | KAT1em Full (EMDB-21019) (PDB 6V1Y) | |
|---|---|---|
| Data collection and processing | ||
| Magnification | 130,000 | 130,000 |
| Voltage (kV) | 300 | 300 |
| Electron exposure (e-/Å2) | 50 | 50 |
| Defocus range (μm) | −1 to −2.5 | −1 to −2.5 |
| Pixel size (Å) | 0.532 | 0.532 |
| Symmetry imposed | C4 | C4 |
| Initial particle images (no.) | 124,211 | 124,211 |
| Final particle images (no.) | 91689 | 91689 |
| Map resolution (Å) | 3.5 | 3.8 |
| FSC threshold | 0.143 | 0.143 |
| Map resolution range (Å) | Not determined | ~3.5– 4.5 (ResMap) |
| Refinement | ||
| Initial model used (PDB code) | de novo | de novo |
| Model resolution (Å) | 3.5 | 3.71 |
| FSC threshold | 0.143 | 0.143 |
| Model resolution range (Å) | n/a | n/a |
| Map sharpening B factor (Å2) | −134 | −137 |
| Model composition | ||
| Non-hydrogen atoms | 13996 | 27392 |
| Protein residues | 1784 | 3568 |
| Ligands | 8 | 16 |
| B factors (Å2) | ||
| Protein | 49.0 | 49.0 |
| Ligand | 9.2 | 9.2 |
| R.m.s. deviations | ||
| Bond lengths (Å) | 0.0104 | 0.0104 |
| Bond angles (°) | 1.35 | 1.35 |
| Validation | ||
| MolProbity score | 1.70 | 1.70 |
| Clashscore | 3.64 | 3.68 |
| Poor rotamers (%) | 0 | 0 |
| Ramachandran plot | ||
| Favored (%) | 90.27 | 90.27 |
| Allowed (%) | 9.50 | 9.50 |
| Disallowed (%) | 0.23 | 0.23 |
Supplementary Material
Acknowledgements
This research was, in part, supported by the National Cancer Institute’s National Cryo-EM Facility at the Frederick National Laboratory for Cancer Research. We thank Ulrich Baxa and Thomas J Edwards at NCEF for cryo-EM data collection, Pedro Rodriguez, Joe Austin II, and Tera Lavoie at the University of Chicago Advanced Electron Microscopy Facility for microscope maintenance and training. Anton 2 computer time was provided by the Pittsburgh Supercomputing Center (PSC) through Grant R01GM116961 from the National Institutes of Health. The Anton 2 machine at PSC was generously made available by D.E. Shaw Research. We also thank Pancho Bezanilla, Minglei Zhao, Tian Li and Bharat Reddy for advice and discussions at all stages of the project. This work was supported by the Consortium for Membrane Protein Dynamics and by grant R01GM088406 to EP. MDC was supported by F30MH116647 and T32GM007281.
Footnotes
Competing interests
The authors declare no competing interests.
Quantification and Statistical Analysis
See methods for details of statistics used for cryo-EM, electrophysiology and simulation data.
Data and Software Availability
Data Resources
Cryo-EM density maps of KAT1 have been deposited in the Electron Microscopy Data Bank under accession codes EMDB-21019 (full molecule) and EMDB-21018 (transmembrane-focused refinement). The atomic models of the KAT1 tetramer and octamer have been deposited in the Protein Data Bank under accession code 6V1X and 6V1Y, respectively. All other data are available upon reasonable request to the corresponding author.
References
- 1.Bezanilla F How membrane proteins sense voltage. Nat. Rev. Mol. Cell Biol 9, 323–332 (2008). [DOI] [PubMed] [Google Scholar]
- 2.Männikkö R, Elinder F & Larsson HP Voltage-sensing mechanism is conserved among ion channels gated by opposite voltages. Nature 419, 837–841 (2002). [DOI] [PubMed] [Google Scholar]
- 3.Latorre R et al. Molecular Coupling between Voltage Sensor and Pore Opening in the Arabidopsis Inward Rectifier K+ Channel KAT1. J. Gen. Physiol 122, 459–469 (2003). [DOI] [PMC free article] [PubMed] [Google Scholar]
- 4.Blunck R & Batulan Z Mechanism of electromechanical coupling in voltage-gated potassium channels. Front. Pharmacol 3, 1–16 (2012). [DOI] [PMC free article] [PubMed] [Google Scholar]
- 5.Altomare C et al. Integrated Allosteric Model of Voltage Gating of HCN Channels. J. Gen. Physiol 117, 519–532 (2001). [DOI] [PMC free article] [PubMed] [Google Scholar]
- 6.Long SB, Campbell EB & MacKinnon R Voltage sensor of Kv1.2: structural basis of electromechanical coupling. Science 309, 903–908 (2005). [DOI] [PubMed] [Google Scholar]
- 7.Vardanyan V & Pongs O Coupling of voltage-sensors to the channel pore: A comparative view. Front. Pharmacol 3, 1–10 (2012). [DOI] [PMC free article] [PubMed] [Google Scholar]
- 8.Chowdhury S & Chanda B Perspectives on: conformational coupling in ion channels: thermodynamics of electromechanical coupling in voltage-gated ion channels. J. Gen. Physiol 140, 613–623 (2012). [DOI] [PMC free article] [PubMed] [Google Scholar]
- 9.Hedrich R. Ion channels in plants. Physiol. Rev 92, 1777–1811 (2012). [DOI] [PubMed] [Google Scholar]
- 10.Hoshi T. Regulation of Voltage Dependence of the KAT1 Channel by Intracellular Factors. J. Gen. Physiol 105, 309–328 (1995). [DOI] [PMC free article] [PubMed] [Google Scholar]
- 11.Moroni A. et al. Mutation in Pore Domain Uncovers Cation- and Voltage-Sensitive Recovery from Inactivation in KAT1 Channel. Biophys. J 78, 1862–1871 (2000). [DOI] [PMC free article] [PubMed] [Google Scholar]
- 12.Hurst A, Moroni A. & Thiel G. KAT1 inactivates at sub-millimolar concentrations of external potassium. J. Exp. Bot 56, 3103–3110 (2005). [DOI] [PubMed] [Google Scholar]
- 13.Lee C-H & MacKinnon R. Structures of the Human HCN1 Hyperpolarization- Activated Channel. Cell 168, 111–120 (2017). [DOI] [PMC free article] [PubMed] [Google Scholar]
- 14.Yifrach O & MacKinnon R. Energetics of pore opening in a voltage-gated K+ channel. Cell 111, 231–239 (2002). [DOI] [PubMed] [Google Scholar]
- 15.Soler-Llavina GJ, Chang TH & Swartz KJ Functional Interactions at the Interface between Voltage-Sensing and Pore Domains in the Shaker Kv Channel. Neuron 52, 623–634 (2006). [DOI] [PubMed] [Google Scholar]
- 16.Ledwell JL & Aldrich RW Mutations in the S4 Region Isolate the Final Voltage-dependent Cooperative Step in Potassium Channel Activation. J. Gen. Physiol 113, 389–414 (1999). [DOI] [PMC free article] [PubMed] [Google Scholar]
- 17.Liu K, Li L. & Luan S. An essential function of phosphatidylinositol phosphates in activation of plant shaker-type K + channels. The Plant Journal 1, 433–443 (2005). [DOI] [PubMed] [Google Scholar]
- 18.Carter PJ, Winter G, Wilkinson AJ & Fersht AR The Use of Double Mutants to Detect Structural Changes in the Active Site of the Tyrosyl-tRNA Synthetase ( Bacillus stearothermophilus ). Cell 38, 835–840 (1984). [DOI] [PubMed] [Google Scholar]
- 19.Yarov-Yarovoy V. et al. Structural basis for gating charge movement in the voltage sensor of a sodium channel. Proc. Natl. Acad. Sci. U.S.A 109, 93–102 (2012). [DOI] [PMC free article] [PubMed] [Google Scholar]
- 20.Lai HC, Grabe M, Yuh NJ & Lily YJ The S4 voltage sensor packs against the pore domain in the KAT1 voltage-gated potassium channel. Neuron 47, 395–406 (2005). [DOI] [PubMed] [Google Scholar]
- 21.Grabe M, Lai HC, Jain M, Jan YN & Jan LY Structure prediction for the down state of a potassium channel voltage sensor. Nature 445, 550–553 (2007). [DOI] [PubMed] [Google Scholar]
- 22.Vargas E. et al. An emerging consensus on voltage-dependent gating from computational modeling and molecular dynamics simulations. J. Gen. Physiol 140, 587–594 (2012). [DOI] [PMC free article] [PubMed] [Google Scholar]
- 23.Li Q. et al. Structural mechanism of voltage-dependent gating in an isolated voltage-sensing domain. Nat. Struct. Mol. Biol 21, 244–252 (2014). [DOI] [PMC free article] [PubMed] [Google Scholar]
- 24.Guo J. et al. Structure of the voltage-gated two-pore channel TPC1 from Arabidopsis thaliana. Nature 531, 196–201 (2016). [DOI] [PMC free article] [PubMed] [Google Scholar]
- 25.Yan Z. et al. Structure of the Nav 1.4-β1 Complex from Electric Eel. Cell 170, 470–482 (2017). [DOI] [PubMed] [Google Scholar]
- 26.Xu H. et al. Structural Basis of Nav1.7 Inhibition by a Gating-Modifier Spider Toxin. Cell 176, 702–715 (2019). [DOI] [PubMed] [Google Scholar]
- 27.Sesti F, Rajan S, Gonzalez-Colaso R, Nikolaeva N. & Goldstein SAN Hyperpolarization moves S4 sensors inward to open MVP, a methanococcal voltage-gated potassium channel. Nat. Neurosci 6, 353–361 (2003). [DOI] [PubMed] [Google Scholar]
- 28.Whicher JR & MacKinnon R. Structure of the voltage-gated K+ channel Eag1 reveals an alternative voltage sensing mechanism. Science 353, 664–669 (2016). [DOI] [PMC free article] [PubMed] [Google Scholar]
- 29.Chen S, Wang J, Zhou L, George MS & Siegelbaum SA Voltage Sensor Movement and cAMP Binding Allosterically Regulate an Inherently Voltage-independent Closed − Open Transition in HCN Channels. J. Gen. Physiol 129, 175–188 (2007). [DOI] [PMC free article] [PubMed] [Google Scholar]
- 30.Kusch J. et al. Interdependence of Receptor Activation and Ligand Binding in HCN2 Pacemaker Channels. Neuron 67, 75–85 (2010). [DOI] [PubMed] [Google Scholar]
- 31.Alvarez-Baron CP, Klenchin VA & Chanda B. Minimal molecular determinants of isoform-specific differences in efficacy in the HCN channel family. J. Gen. Physiol 150, 1203–1213 (2018). [DOI] [PMC free article] [PubMed] [Google Scholar]
- 32.Wang W. & MacKinnon R. Cryo-EM Structure of the Open Human Ether-à-go-go-Related K+ Channel hERG. Cell 169, 422–430 (2017). [DOI] [PMC free article] [PubMed] [Google Scholar]
- 33.Perissinotti LL et al. Determinants of Isoform-Specific Gating Kinetics of hERG1 Channel: Combined Experimental and Simulation Study. Front. Physiol 9, e59265–20 (2018). [DOI] [PMC free article] [PubMed] [Google Scholar]
- 34.Papanatsiou M. et al. Optogenetic manipulation of stomatal kinetics improves carbon assimilation, water use, and growth. Science 363, 1456–1459 (2019). [DOI] [PubMed] [Google Scholar]
Methods References
- 35.James ZM & Zagotta WN Structural insights into the mechanisms of CNBD channel function. J. Gen. Physiol 150, 225–244 (2018). [DOI] [PMC free article] [PubMed] [Google Scholar]
- 36.Rosenthal PB & Henderson R. Optimal Determination of Particle Orientation, Absolute Hand, and Contrast Loss in Single-particle Electron Cryomicroscopy. J. Mol. Biol 333, 721–745 (2003). [DOI] [PubMed] [Google Scholar]
- 37.Afonine PV et al. New tools for the analysis and validation of cryo-EM maps and atomic models. Acta Crystallogr. D Biol. Crystallogr 74, 814–840 (2018). [DOI] [PMC free article] [PubMed] [Google Scholar]
- 38.Pravda L. et al. MOLEonline : a web-based tool for analyzing channels, tunnels and pores ( 2018 update ). Nucleic Acids Res. 46, 368–373 (2018). [DOI] [PMC free article] [PubMed] [Google Scholar]
- 39.Smart OS, Neduvelil JG, Wang X, Wallace BA & Sansom MSP HOLE : A program for the analysis of the pore dimensions of ion channel structural models. J. Mol. Graph 14, 354–360 (1996). [DOI] [PubMed] [Google Scholar]
- 40.Shaya D. et al. Voltage-gated sodium channel (NaV) protein dissection creates a set of functional pore-only proteins. Proc. Natl. Acad. Sci. U.S.A 108, 12313–12318 (2011). [DOI] [PMC free article] [PubMed] [Google Scholar]
- 41.Zheng SQ et al. MotionCor2: anisotropic correction of beam-induced motion for improved cryo-electron microscopy. Nat. Methods 14, 331–332 (2017). [DOI] [PMC free article] [PubMed] [Google Scholar]
- 42.Rohou A. & Grigorieff N. CTFFIND4: Fast and accurate defocus estimation from electron micrographs. J. Struc. Biol 192, 216–221 (2015). [DOI] [PMC free article] [PubMed] [Google Scholar]
- 43.Kimanius D, Forsberg O, Scheres SHW & Lindahl E. Accelerated cryo-EM structure determination with parallelisation using GPUs in RELION-2. eLife 1–21 (2016). doi: 10.7554/eLife.18722 [DOI] [PMC free article] [PubMed] [Google Scholar]
- 44.Chen S. et al. High-resolution noise substitution to measure overfitting and validate resolution in 3D structure determination by single particle electron cryomicroscopy. Ultramicroscopy 135, 24–35 (2013). [DOI] [PMC free article] [PubMed] [Google Scholar]
- 45.Scheres SHW & Chen S. Prevention of overfitting in cryo-EM structure determination. Nat. Methods 9, 853–854 (2012). [DOI] [PMC free article] [PubMed] [Google Scholar]
- 46.Kucukelbir A, Sigworth FJ & Tagare HD Quantifying the local resolution of cryo-EM density maps. Nat. Methods 11, 63–65 (2013). [DOI] [PMC free article] [PubMed] [Google Scholar]
- 47.Biasini M. et al. SWISS-MODEL: modelling protein tertiary and quaternary structure using evolutionary information. Nucleic Acids Res. 42, W252–W258 (2014). [DOI] [PMC free article] [PubMed] [Google Scholar]
- 48.Arnold K, Bordoli L, Kopp J. & Schwede T. The SWISS-MODEL workspace: a web-based environment for protein structure homology modelling. Bioinformatics 22, 195–201 (2006). [DOI] [PubMed] [Google Scholar]
- 49.Stein N. CHAINSAW: a program for mutating pdb files used as templates in molecular replacement. J. Appl. Crystallogr 41, 641–643 (2008). [Google Scholar]
- 50.Adams PD et al. PHENIX: a comprehensive Python-based system for macromolecular structure solution. Acta Crystallogr. D Biol. Crystallogr 66, 213–221 (2010). [DOI] [PMC free article] [PubMed] [Google Scholar]
- 51.Afonine PV et al. Real-space refinement in PHENIX for cryo-EM and crystallography. Acta Crystallogr. D Biol. Crystallogr 74, 531–544 (2018). [DOI] [PMC free article] [PubMed] [Google Scholar]
- 52.Emsley P. & Cowtan K. Coot: model-building tools for molecular graphics. Acta Crystallogr. D Biol. Crystallogr 60, 2126–2132 (2004). [DOI] [PubMed] [Google Scholar]
- 53.Emsley P, Lohkamp B, Scott WG & Cowtan K. Features and development of Coot. Acta Crystallogr. D Biol. Crystallogr 66, 486–501 (2010). [DOI] [PMC free article] [PubMed] [Google Scholar]
- 54.Brown A. et al. Tools for macromolecular model building and refinement into electron cryo-microscopy reconstructions. Acta Crystallogr. D Biol. Crystallogr 71, 136–153 (2015). [DOI] [PMC free article] [PubMed] [Google Scholar]
- 55.Pettersen EF et al. UCSF Chimera A visualization system for exploratory research and analysis. J. Comput. Chem 25, 1605–1612 (2004). [DOI] [PubMed] [Google Scholar]
- 56.Shih TM, Smith RD, Toro L. & Goldin AL High-Level Expression and Detection of Ion Channels in Xenopus Oocytes. Meth. Enzymol 293, 529–556 (1998). [DOI] [PubMed] [Google Scholar]
- 57.Carvalho-de-Souza JL & Bezanilla F. Nonsensing residues in S3–S4 linker’s C terminus affect the voltage sensor set point in K+ channels. J. Gen. Physiol 150, 307–321 (2018). [DOI] [PMC free article] [PubMed] [Google Scholar]
- 58.Schneider CA, Rasband WS & Eliceiri KW NIH Image to ImageJ: 25 years of image analysis. Nat. Methods 9, 671–675 (2012). [DOI] [PMC free article] [PubMed] [Google Scholar]
- 59.Shaw DE et al. Anton, a special-purpose machine for molecular dynamics simulation. Commun. ACM 51, 91–7 (2008). [Google Scholar]
- 60.Šali A. & Blundell TL Comparative Protein Modelling by Satisfaction of Spatial Restraints. J. Mol. Biol 234, 779–815 (1993). [DOI] [PubMed] [Google Scholar]
- 61.Khalili-Araghi F. et al. Calculation of the Gating Charge for the Kv1.2 Voltage-Activated Potassium Channel. Biophys. J 98, 2189–2198 (2010). [DOI] [PMC free article] [PubMed] [Google Scholar]
- 62.Humphrey W, Dalke A. & Schulten K. VMD: Visual Molecular Dynamics. J. Mol. Graph 14, 33–38 (1996). [DOI] [PubMed] [Google Scholar]
- 63.Phillips JC et al. Scalable molecular dynamics with NAMD. J. Comput. Chem 26, 1781–1802 (2005). [DOI] [PMC free article] [PubMed] [Google Scholar]
- 64.Best RB et al. Optimization of the Additive CHARMM All-Atom Protein Force Field Targeting Improved Sampling of the Backbone ϕ, ψ and Side-Chain χ 1and χ 2Dihedral Angles. J. Chem. Theory. Comput 8, 3257–3273 (2012). [DOI] [PMC free article] [PubMed] [Google Scholar]
- 65.Klauda JB et al. Update of the CHARMM All-Atom Additive Force Field for Lipids: Validation on Six Lipid Types. J. Phys. Chem. B 114, 7830–7843 (2010). [DOI] [PMC free article] [PubMed] [Google Scholar]
- 66.Jorgensen WL, Chandrasekhar J, Madura JD, Impey RW & Klein ML Comparison of simple potential functions for simulating liquid water. J. Chem. Phys 79, 926–935 (1983). [Google Scholar]
- 67.Martyna GJ, Tobias DJ & Klein ML Constant pressure molecular dynamics algorithms. J. Chem. Phys 101, 4177–4189 (1994). [Google Scholar]
- 68.Feller SE, Zhang Y, Pastor RW & Brooks BR Constant pressure molecular dynamics simulation: The Langevin piston method. J. Chem. Phys 103, 4613–4621 (1995). [Google Scholar]
- 69.Essmann U. et al. A smooth particle mesh Ewald method. J. Chem. Phys 103, 8577–8593 (1995). [Google Scholar]
- 70.Roux B. The Membrane Potential and its Representation by a Constant Electric Field in Computer Simulations. Biophys. J 95, 4205–4216 (2008). [DOI] [PMC free article] [PubMed] [Google Scholar]
- 71.Martyna GJ, Klein ML & Tuckerman M. Nosé–Hoover chains: The canonical ensemble via continuous dynamics. J. Chem. Phys 97, 2635–2643 (1992). [Google Scholar]
- 72.Shan Y, Klepeis JL, Eastwood MP, Dror RO & Shaw DE Gaussian split Ewald: A fast Ewald mesh method for molecular simulation. J. Chem. Phys 122, 054101–14 (2005). [DOI] [PubMed] [Google Scholar]
- 73.Goddard TD et al. UCSF ChimeraX: Meeting modern challenges in visualization and analysis. Protein Sci. 27, 14–25 (2017). [DOI] [PMC free article] [PubMed] [Google Scholar]
- 74.Pintilie GD, Zhang J, Goddard TD, Chiu W. & Gossard DC Quantitative analysis of cryo-EM density map segmentation by watershed and scale-space filtering, and fitting of structures by alignment to regions. J. Struc. Biol 170, 427–438 (2010). [DOI] [PMC free article] [PubMed] [Google Scholar]
- 75.Pintilie G, Chen D-H, Haase-Pettingell CA, King JA & Chiu W. Resolution and Probabilistic Models of Components in CryoEM Maps of Mature P22 Bacteriophage. Biophys. J 110, 827–839 (2016). [DOI] [PMC free article] [PubMed] [Google Scholar]
Associated Data
This section collects any data citations, data availability statements, or supplementary materials included in this article.


