

Abstract
Objective
Despite the increasing disease burden, there is a dearth of context-specific evidence on the risk factors for COVID-19 positivity and subsequent death in Nigeria. Thus, the study objective was to identify context-specific factors associated with testing positive for COVID-19 and fatality in Nigeria.
Design
Retrospective cohort study.
Setting
COVID-19 surveillance and laboratory centres in 36 states and the Federal Capital Territory reporting data to the Nigeria Centre for Disease Control.
Participants
Individuals who were investigated for SARS-CoV-2 using real-time PCR testing during the study period 27 February–8 June 2020.
Methods
COVID-19 positivity and subsequent mortality. Multivariable logistic regression analyses were performed to identify factors independently associated with both outcome variables, and findings are presented as adjusted ORs (aORs) and 95% CIs.
Results
A total of 36 496 patients were tested for COVID-19, with 10 517 confirmed cases. Of 3215 confirmed cases with available clinical outcomes, 295 died. Factors independently associated with COVID-19 positivity were older age (p value for trend<0.0001), male sex (aOR 1.11, 95% CI 1.04 to 1.18) and the following presenting symptoms: cough (aOR 1.23, 95% CI 1.13 to 1.32), fever (aOR 1.45, 95% CI 1.45 to 1.71), loss of smell (aOR 7.78, 95% CI 5.19 to 11.66) and loss of taste (aOR 2.50, 95% CI 1.60 to 3.90). An increased risk of mortality following COVID-19 was observed in those aged ≥51 years, patients in farming occupation (aOR 7.56, 95% CI 1.70 to 33.53) and those presenting with cough (aOR 2.06, 95% CI 1.41 to 3.01), breathing difficulties (aOR 5.68, 95% CI 3.77 to 8.58) and vomiting (aOR 2.54, 95% CI 1.33 to 4.84).
Conclusion
The significant risk factors associated with COVID-19 positivity and subsequent mortality in the Nigerian population are similar to those reported in studies from other countries and should guide clinical decisions for COVID-19 testing and specialist care referrals.
Keywords: respiratory infections, public health, epidemiology
Strengths and limitations of this study.
This is the first study to identify contextual sociodemographic and clinical factors associated with COVID-19 positivity and subsequent death in Nigeria.
The use of the Surveillance, Outbreak Response Management and Analysis System platform as data source suggests our findings are relatively representative of COVID-19 epidemiology in Nigeria.
The study might be susceptible to selection bias considering the high proportion of missing data and use of complete case analysis to handle missing data.
The use of either nasopharyngeal or nasal swab, plus oropharyngeal swab for COVID-19 test could bias our estimates if it had resulted in a systematic difference in case classifications.
Introduction
Since the outbreak was declared a pandemic by the WHO on 11 March 2020,1 COVID-19 has spread rapidly to all continents. As of 2 August 2020, the WHO has recorded 17 660 523 laboratory-confirmed cases of COVID-19 and 680 894 deaths,2 resulting in a global case fatality ratio of 3.9%. On the same date, the Nigeria Centre for Disease Control (NCDC) reported that Nigeria had 43 841 confirmed COVID-19 cases and 888 deaths.3 Although understanding of COVID-19 clinical and epidemiological features is still evolving worldwide, evidence suggests that being male, older, obese and a smoker are significant risk factors for contracting SARS-CoV-2 infection.4–6 Clinical features shown to be associated with increased severity and mortality include expectoration, muscle pain and decreased serum albumin level.4 Furthermore, comorbidities, including hypertension, diabetes, cardiovascular disease, chronic lung disease and cancer, have been found to be associated with poor patient clinical outcome and COVID-19 death.7 8
Describing the contextual factors associated with COVID-19 and its associated clinical outcomes will help frontline healthcare workers to facilitate effective and prompt diagnosis and care of infected patients.9 A study on the clinical presentation, case management and outcomes for the first 32 patients with COVID-19 in Nigeria found that patients were predominantly male with a mean age of 38 years.10 COVID-19 epidemiology in Nigeria between 28 February and 6 June 2020 noted a total of 12 289 confirmed cases; 3467 of these had known clinical outcome (recovered and discharged or died), 342 of whom died.11 The highest proportion of COVID-19 cases and deaths were recorded in persons aged 31–40 years and 61–70 years, respectively; and men accounted for a higher proportion of confirmed cases and deaths. Amid limited testing capacity, triaging based on clinical case definition or presumptive diagnosis would be useful to frontline healthcare workers for flagging potential COVID-19 cases.12 However, there appears to be a paucity of evidence on how commonly recorded clinical and sociodemographic characteristics are associated with COVID-19 infection and subsequent death in Nigeria, as well as how they compared with what might be obtainable elsewhere. This is even more imperative, considering the increasing number of confirmed COVID-19 cases and deaths recorded in Nigeria on a daily basis. Therefore, this study aimed to fill this research gap by identifying sociodemographic and clinical characteristics associated with testing positive for COVID-19 and subsequent mortality.
Methods
Study design, period and settings
This is a retrospective cohort study (ie, a retrospective analysis of individuals in the Nigeria surveillance and laboratory data with some follow-up data on who died/survived) from 27 February to 8 June 2020. Nigeria is administratively divided into 36 states and the Federal Capital Territory (FCT), which are further organised into six geopolitical zones: South-South, South-West, South-East, North-East, North-West and North-Central.
Data source
The Surveillance, Outbreak Response Management and Analysis System (SORMAS)—an open-source real-time electronic health surveillance database maintained by NCDC13—provided the data for this study. In 2017, NCDC adopted SORMAS as its primary digital surveillance platform for implementing the Integrated Disease Surveillance and Response system14 and customised it for the surveillance of priority diseases of public health importance in Nigeria. As part of the country’s preparedness activities, a COVID-19 module was developed and added to SORMAS in January 2020.
Study population and data collection
The study population comprised individuals who were investigated for SARS-CoV-2 using real-time PCR (RT-PCR) testing and captured on SORMAS during the study period. Eligibility for a RT-PCR test is, however, dependent on meeting the NCDC COVID-19 suspect case definition.15 Sample collection, transportation and analysis were performed according to the NCDC guidelines for identifying and reporting suspect COVID-19 cases.16 Trained health workers completed a detailed case investigation form and collected at least one nasopharyngeal or nasal swab and one oropharyngeal swab from suspected COVID-19 cases using synthetic fibre swabs. Triple-packed specimens were transported aseptically in viral transport media to the nearest NCDC-certified laboratory for COVID-19 while maintaining a temperature range of 2°C–4°C. In line with the WHO guidelines,17 RT-PCR was used for the laboratory diagnosis of COVID-19. Laboratory results and sociodemographic and clinical data (signs and symptoms) were inputted into SORMAS by designated state public health officials and health workers.
Handling missing data
A definitive diagnosis of COVID-19 was defined as a positive RT-PCR test. For clinical variables, we assumed missing symptom data (ie, not marked as present or absent) to be negative. This was considered a reasonable assumption, given data recording by busy healthcare workers was pragmatic in nature and is in line with common practice in epidemiological research.18 19 Moreover, individuals with no recorded clinical symptoms (ie, yes or no) were excluded from the analysis. For sociodemographic variables, the complete-case approach to handling missing data was used. In exploring the association between study participants’ characteristics and outcome variables, we excluded sociodemographic variables (eg, type of residential setting, education completed and health facility type) with over 30% missing data to minimise potential selection bias. A flowchart showing the processes for selecting the final dataset for this study is shown in figure 1.
Figure 1.
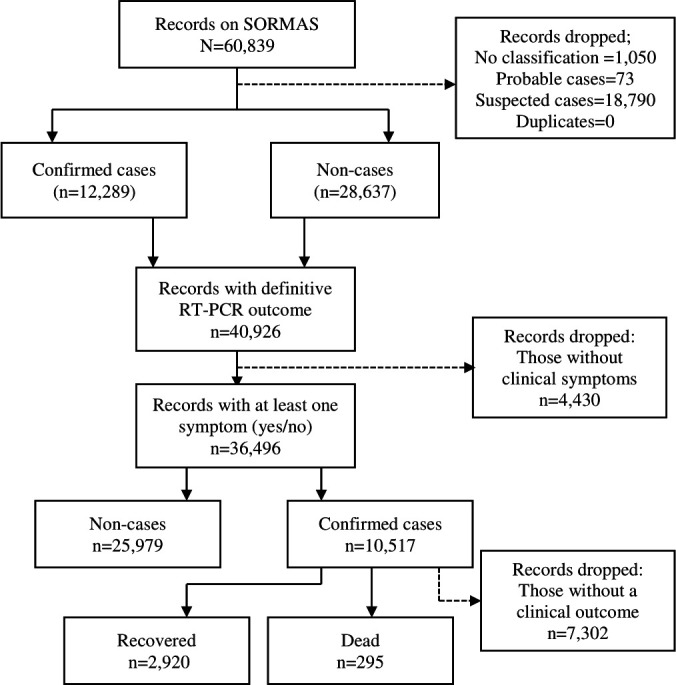
Description of the selection processes for data used in this study. RT-PCR, real-time PCR; SORMAS, Surveillance, Outbreak Response Management and Analysis System.
Definition of key study variables
Covariates presumed to be potentially associated with either outcome variable were identified based on research evidence4–6 8 and biological plausibility of available data. Definitions of both outcome and covariates are presented in table 1.
Table 1.
Definition of study outcome variables and covariates
| Variable | Definition |
| Outcome variables | |
| COVID-19 positivity | COVID-19 positivity was defined as either presence or absence of SARS-CoV-2 by RT-PCR confirmation (yes/no). |
| Death | Death (coded 1) was defined as an individual diagnosed with RT-PCR-confirmed COVID-19 who died during the study period. A survivor (coded 0) was defined as a COVID-19 case who recovered and was discharged based on the NCDC discharge criteria in use at the date of discharge.16 |
| Covariates | |
| Age group | Age (in years) was based on self-reports by an individual or a relative and was treated as a categorical variable as opposed to a continuous variable due to the p value (p<0.05) obtained from the LRT. Its classification was informed by local clinical and public health relevance in the study context (eg, under-five mortality and immunisation programme): 0–4, 5–13, 14–20, 21–30, 31–40, 41–50, 51–60, 61–70, 71–80, >80. For the analysis of clinical outcome which had a smaller sample size, however, the number of age categories was reduced to 0–20, 21–30, 31–40, 41–50, 51–60, 61–70 and ≥71. |
| Current occupation | Based on available data on SORMAS, occupation was classified as follows: pupil/student, child; housewife; trader/business; healthcare worker (eg, nurse, clinician and laboratorian); animal-related work (eg, butcher and hunter); farmer; religious/traditional leader; transporter; and other. The choice of student (who were out of school for most part of this study period) as the reference group was based on ease of interpretation of findings. |
| Travel history | Travel history was classified as none, local and international travel in the 14 days before the RT-PCR test. |
| Clinical variables | These were assessed using a combination of self-reports by COVID-19 suspects and/or their relatives and clinical assessment by a healthcare worker and were defined relative to 14 days before sample collection and diagnosis. Clinical signs and symptoms (coded yes/no) include abdominal pain, chest pain, chills/sweat, confusion, cough, diarrhoea, difficulty breathing, fatigue, fever (an axillary temperature of ≥37.5°C), headache, joint pain, malaise, muscle pain, nausea, pharyngeal exudate, rapid breathing, runny nose, sore throat, vomiting, loss of smell and loss of taste. |
| Geopolitical zone of residence | To minimise unstable estimates of effect from small samples (which was the case for some states such as Kogi and Cross-River states), individual states were merged into their respective geopolitical zones as follows: South-West (Ekiti, Lagos, Ogun, Ondo, Osun and Oyo states); South-South (Akwa-Ibom, Bayelsa, Cross-River, Rivers, Delta and Edo states); South-East (Abia, Anambra, Ebonyi, Enugu and Imo states); North-Central (Benue, Kogi, Kwara, Nasarawa, Niger, and plateau states, as well as the FCT); North-West (Jigawa, Kaduna, Kano, Katsina, Kebbi, Sokoto and Zamfara states); and North-East (Adamawa, Bauchi, Borno, Gombe, Taraba and Yobe states). Given its large size (ie, number of records in relation to both outcome variables), the South-West was chosen as the reference region. |
FCT, Federal Capital Territory; LRT, Likelihood Ratio Test; NCDC, Nigeria Centre for Disease Control; RT-PCR, real-time PCR; SORMAS, Surveillance, Outbreak Response Management and Analysis System.
Statistical analyses
All analyses were conducted using STATA V.13. A p value of <0.05 was considered statistically significant. Sociodemographic and clinical characteristics in relation to both outcome variables were described using frequencies and percentages (%) for binary/categorical variables, with mean and SD for normally distributed continuous variables. To assess the association between individual covariate and the outcome variables, unadjusted logistic regression analyses were performed in turn for each outcome variable, presenting the findings as unadjusted ORs and 95% confidence intervals (CIs). This was followed by multivariable analyses using a stepwise multiple logistic regression to assess the association between an outcome variable and each statistically significant covariate from the unadjusted analyses. In summary, all statistically significant covariates following the unadjusted analyses were included in the multivariable model and removed one at a time from the model based on statistical significance (p values from the LRT for categorical variables and Wald’s test for binary variables) until all the covariates left in the model were statistically significant. Findings from the multivariable model were presented as adjusted ORs (aORs) and 95% CIs. The report of this study is structured as per the Strengthening the Reporting of Observational Studies in Epidemiology statement.
Patient and public involvement
Being an analysis of a secondary dataset, it was not possible to involve patients or the public in the design, conduct, reporting or dissemination plans of this study.
Results
Patient characteristics associated with COVID-19 positivity
Characteristics of the study participants in relation to COVID-19
There were 36 496 individuals with a definitive RT-PCR test result (positive or negative) during the study period, 28.8% (10 517/36 496) of whom were positive for SARS-CoV-2 (table 2). The mean age of the study participants and persons with RT-PCR-confirmed COVID-19 was 35.6 (SD 15.0) and 37.2 (SD 15.7) years, respectively. Individuals aged 31–40 years accounted for the highest proportion of the study participants (28.9% (10 270/35 567)) as well as confirmed COVID-19 cases (27.3% (2762/10 107)). A higher proportion of the study participants (65%, 23 653/36 287) and confirmed COVID-19 cases (67.7%, 7070/10 438) were men. Of the 19 711 study participants with information on education, 17.2% and 66.5% had completed secondary and tertiary education, respectively; similar trends were recorded in confirmed COVID-19 cases. Sixteen per cent (4490/27 658) of the study participants and about 14% (1075/7499) of confirmed COVID-19 cases were healthcare workers. Regarding clinical variables, 19.6% and 17.2% of 36 496 study participants presented at diagnosis with fever and cough, respectively.
Table 2.
Description of patient characteristics with suspected and confirmed COVID-19
| Factor | Positive RT-PCR test (n (%)) |
Negative RT-PCR test (n (%)) |
Total‡ (N (%)) |
P value (Wald’s test) |
| Sociodemographic and other epidemiological factors | ||||
| Age group (years)§ | n=10 107 | n=25 460 | N=35 567 | |
| 0–4 | 174 (1.7) | 546 (2.1) | 720 (2.0) | <0.001 |
| 5–13 | 431 (4.3) | 1125 (4.4) | 1556 (4.4) | |
| 14–20 | 663 (6.6) | 1745 (6.9) | 2408 (6.8) | |
| 21–30 | 2282 (22.6) | 6863 (27.0) | 9145 (25.7) | |
| 31–40 | 2762 (27.3) | 7508 (29.5) | 10 270 (28.9) | |
| 41–50 | 1843 (18.2) | 4041 (15.9) | 5884 (16.5) | |
| 51–60 | 1169 (11.6) | 2378 (9.3) | 3547 (10.0) | |
| 61–70 | 539 (5.3) | 873 (3.4) | 1412 (4.0) | |
| 71–80 | 180 (1.8) | 278 (1.1) | 458 (1.3) | |
| >80 | 64 (0.6) | 103 (0.4) | 167 (0.5) | |
| Sex | n=10 438 | n=25 849 | N=36 287 | <0.001 |
| Female | 3368 (32.3) | 9266 (35.9) | 12 634 (34.8) | |
| Male | 7070 (67.7) | 16 583 (64.2) | 23 653 (65.2) | |
| Residential setting | n=5131 | n=13 808 | N=18 939 | <0.001 |
| Rural | 698 (13.6) | 2579 (18.7) | 3277 (17.3) | |
| Urban | 4433 (86.4) | 11 229 (81.3) | 15 662 (82.7) | |
| Geopolitical zone | n=10 517 | n=25 979 | N=36 496 | <0.001 |
| South-West | 5252 (49.9) | 11 453 (44.1) | 16 705 (45.8) | |
| South-South | 875 (8.3) | 4033 (15.5) | 4908 (13.5) | |
| South-East | 204 (1.9) | 570 (2.2) | 774 (2.1) | |
| North-Central | 1210 (11.5) | 4882 (18.8) | 6092 (16.7) | |
| North-West | 2196 (20.9) | 2996 (11.5) | 5192 (14.2) | |
| North-East | 780 (7.4) | 2045 (7.9) | 2825 (7.7) | |
| Education completed | n=5573 | n=14 138 | N=19 711 | <0.001 |
| No formal education | 187 (3.4) | 545 (3.9) | 732 (3.7) | |
| Nursery/primary | 265 (4.8) | 897 (6.3) | 1162 (5.9) | |
| Secondary | 1029 (18.5) | 2504 (17.7) | 3533 (17.2) | |
| Tertiary | 3638 (65.3) | 9472 (67.0) | 13 110 (66.5) | |
| Alternative education | 454 (8.2) | 720 (5.1) | 1172 (6.0) | |
| Occupation | n=7499 | n=20 159 | N=27 658 | <0.001 |
| Pupil/student | 653 (8.7) | 2016 (10.0) | 2669 (9.7) | |
| Child | 116 (1.6) | 283 (1.4) | 399 (1.4) | |
| Housewife | 147 (2.0) | 374 (1.9) | 521 (1.9) | |
| Trader/business | 679 (9.1) | 1762 (8.7) | 2441 (8.8) | |
| Healthcare worker | 1075 (14.3) | 3415 (16.9) | 4490 (16.2) | |
| Animal-related work | 22 (0.3) | 56 (0.3) | 78 (0.3) | |
| Farmer | 109 (1.5) | 455 (2.3) | 564 (2.0) | |
| Religious/traditional leader | 32 (0.4) | 64 (0.3) | 96 (0.4) | |
| Transporter | 41 (0.6) | 154 (0.8) | 195 (0.7) | |
| Other | 4625 (61.7) | 11 580 (57.4) | 16 205 (58.6) | |
| Travel history | n=10 451 | n=25 827 | N=36 278 | <0.001 |
| No | 9747 (93.3) | 23 266 (90.1) | 33 013 (91.0) | |
| Local | 517 (5.0) | 1515 (5.9) | 2032 (5.6) | |
| International | 187 (1.8) | 1046 (4.1) | 1233 (3.4) | |
| Clinical factors (only the figures for symptoms presented/yes are presented) | ||||
| Mean (SD) temperature (oC)* | 37.0 (1.0) | 36.7 (1.0) | 36.8 (1.0) | |
| n=10 517† | n=25 979† | N=36 496† | ||
| Abdominal pain | 31 (0.3) | 103 (0.4) | 134 (0.4) | 0.146 |
| Chest pain | 160 (1.5) | 309 (1.2) | 469 (1.3) | 0.011 |
| Chills/sweat | 63 (0.6) | 104 (0.4) | 63 (0.6) | 0.011 |
| Confusion | 14 (0.1) | 29 (0.1) | 43 (0.1) | 0.588 |
| Cough | 2298 (21.8) | 4865 (18.7) | 7163 (19.6) | <0.001 |
| Diarrhoea | 327 (3.1) | 815 (3.1) | 1142 (3.1) | 0.890 |
| Breathing difficulty | 768 (7.3) | 1892 (7.3) | 2660 (7.3) | 0.948 |
| Fatigue | 216 (2.0) | 294 (1.1) | 510 (1.4) | <0.001 |
| Fever | 2334 (22.2) | 3941 (15.2) | 6275 (17.2) | <0.001 |
| Headache | 583 (5.5) | 808 (3.1) | 1391 (3.8) | <0.001 |
| Joint pain | 54 (0.5) | 104 (0.4) | 158 (0.4) | 0.136 |
| Malaise | 92 (0.9) | 100 (0.4) | 192 (0.5) | <0.001 |
| Muscle pain | 96 (0.9) | 231 (0.9) | 327 (0.9) | 0.828 |
| Nausea | 311 (3.0) | 729 (2.8) | 1040 (2.8) | 0.432 |
| Pharyngeal exudate | 3 (0.0) | 9 (0.0) | 12 (0.0) | 0.770 |
| Rapid breathing | 61 (0.6) | 115 (0.4) | 176 (0.5) | 0.086 |
| Runny nose | 986 (9.4) | 2377 (9.2) | 3363 (9.2) | 0.500 |
| Sore throat | 818 (7.8) | 2590 (10.0) | 3408 (9.3) | <0.001 |
| Vomiting | 228 (2.2) | 577 (2.2) | 805 (2.2) | 0.754 |
| Loss of smell | 170 (1.6) | 43 (0.2) | 213 (0.6) | <0.001 |
| Loss of taste | 130 (1.2) | 49 (0.2) | 179 (0.5) | <0.001 |
*Based on 11 151 records.
†Applicable to all clinical signs and symptoms (10 517 confirmed COVID-19 cases and 36 496 total cases (ie, confirmed COVID-19 and non-cases)).
‡Based on 36 496 total records (25 979 (71.2%) negative RT-PCR and 10 517 (28.8%) positive RT-PCR).
§Mean (SD) age of persons who tested positive was 37.2 (15.7) years, 34.9 (14.7) years for non-cases and 35.6 (15.0) years for total study participants.
N, total cases comprising both confirmed COVID-19 and non-cases; n, confirmed COVID-19 cases only.
Association between patient characteristics and COVID-19 positivity
In the unadjusted model, older age was significantly associated with higher odds of COVID-19 positivity compared with children under the age of 5 years old, especially in those aged 71–80 years (OR 2.03, 95% CI 1.58 to 2.62) (table 3). The odds of COVID-19 positivity was 17% higher in men than in women (OR 1.17, 95% CI 1.12% to 1.23%). For occupation, the odds of testing positive was 26% lower in farmers (OR 0.74, 95% CI 0.59% to 0.93%) than in students. Individuals who presented at diagnosis with cough (OR 1.21, 95% CI 1.15 to 1.28), fever (OR 1.59, 95% CI 1.51 to 1.69), loss of smell (OR 9.91, 95% CI 7.09 to 13.86) and loss of taste (OR 6.62, 95% CI 4.76 to 9.21) had higher ORs for testing positive for SARS-CoV-2 than those without these symptoms. In contrast, the odds of testing positive was 24% (OR 0.76, 95% CI 0.70% to 0.83%) lower in those who presented at diagnosis with a sore throat than those who did not.
Table 3.
Unadjusted and aORs and 95% CIs for COVID-19 positivity
| Factor | Unadjusted OR (95% CI) | P value (LRT) | aOR (95% CI)‡ | P value (LRT) |
| Sociodemographic factors | ||||
| Age group (year) (n=35 567) | <0.0001 | <0.0001* | ||
| 0–4 | 1 | 1 | ||
| 5–13 | 1.20 (0.98 to 1.47) | 1.29 (0.99 to 1.68) | ||
| 14–20 | 1.19 (0.98 to 1.45) | 1.36 (1.05 to 1.78) | ||
| 21–30 | 1.04 (0.87 to 1.25) | 1.16 (0.90 to 1.50) | ||
| 31–40 | 1.15 (0.97 to 1.38) | 1.31 (1.01 to 1.69) | ||
| 41–50 | 1.43 (1.20 (1.71) | 1.63 (1.26 to 2.11) | ||
| 51–60 | 1.54 (1.28 to 1.85) | 1.71 (1.31 to 2.23) | ||
| 61–70 | 1.94 (1.58 to 2.37) | 1.88 (1.41 to 2.50) | ||
| 71–80 | 2.03 (1.58 to 2.62) | 2.04 (1.45 to 2.88) | ||
| >80 | 1.95 (1.37 to 2.78) | 1.74 (1.07 to 2.83) | ||
| Sex (n=36 287) | <0.001† | 0.001† | ||
| Female | 1 | 1 | ||
| Male | 1.17 (1.12 to 1.23) | 1.11 (1.04 to 1.18) | ||
| Geopolitical zone of residence (n=36 496) | <0.0001 | <0.0001 | ||
| South-West | 1 | 1 | ||
| South-South | 0.47 (0.44 to 0.51) | 0.49 (0.44 to 0.54) | ||
| South-East | 0.78 (0.66 to 0.92) | 1.01 (0.84 to 1.21) | ||
| North-Central | 0.54 (0.50 to 0.58) | 0.63 (0.58 to 0.69) | ||
| North-West | 1.60 (1.50 to 1.70) | 1.41 (1.28 to 1.54) | ||
| North-East | 0.83 (0.76 to 0.91) | 1.46 (1.26 to 1.69) | ||
| Occupation (n=27 658) | <0.0001 | <0.0001 | ||
| Pupil/student | 1 | 1 | ||
| Child | 1.27 (1.00 to 1.60) | 1.29 (0.98 to 1.68) | ||
| Housewife | 1.21 (0.98 to 1.50) | 0.93 (0.73 to 1.17) | ||
| Trader/business | 1.19 (1.05 to 1.35) | 1.09 (0.93 to 1.27) | ||
| Health worker | 0.97 (0.87 to 1.09) | 0.90 (0.78 to 1.03) | ||
| Animal-related work | 1.21 (0.73 to 2.00) | 0.93 (0.53 to 1.63) | ||
| Farmer | 0.74 (0.59 to 0.93) | 0.59 (0.46 to 0.76) | ||
| Religious/traditional leader | 1.54 (1.00 to 2.38) | 1.13 (0.71 to 1.82) | ||
| Transporter | 0.82 (0.58 to 1.17) | 0.83 (0.56 to 1.21) | ||
| Other | 1.23 (1.12 to 1.36) | 1.11 (0.98 to 1.26) | ||
| Travel history (n=36 278) | <0.0001 | <0.0001 | ||
| No | 1 | 1 | ||
| Local | 0.81 (0.74 to 0.90) | 0.75 (0.66 to 0.85) | ||
| International | 0.43 (0.36 to 0.50) | 0.52 (0.44 to 0.61) | ||
| Clinical factors‡ (no, coded 0, is the reference group with an OR of 1.00) | ||||
| Abdominal pain (n=36 496) | 0.147† | |||
| Yes | 0.74 (0.50 to 1.11) | |||
| Chest pain (n=36 496) | 0.011† | 0.235† | ||
| Yes | 1.28 (1.06 to 1.56) | 0.86 (0.66 to 1.11) | ||
| Chills/sweat (n=36 496) | 0.011† | 0.639† | ||
| Yes | 1.50 (1.10 to 2.05) | 1.10 (0.74 to 1.62) | ||
| Confusion (n=36 496) | 0.588† | |||
| Yes | 1.19 (0.63 to 2.26) | |||
| Cough (n=36 496) | <0.001† | <0.001† | ||
| Yes | 1.21 (1.15 to 1.28) | 1.23 (1.13 to 1.32) | ||
| Diarrhoea (n=36 496) | 0.890† | |||
| Yes | 0.99 (0.87 to 1.13) | |||
| Breathing difficulty (n=36 496) | 0.948† | |||
| Yes | 1.00 (0.92 to 1.09) | |||
| Fatigue (n=36 496) | <0.001† | |||
| Yes | 1.83 (1.53 to 2.19) | 1.06 (0.83 to 1.35) | 0.635† | |
| Fever (n=36 496) | <0.001† | <0.001† | ||
| Yes | 1.59 (1.51 to 1.69) | 1.58 (1.45 to 1.71) | ||
| Headache (n=36 496) | <0.001† | 0.050† | ||
| Yes | 1.83 (1.64 to 2.04) | 1.18 (1.00 to 1.40) | ||
| Joint pain (n=36 496) | 0.137† | |||
| Yes | 1.28 (0.92 to 1.79) | |||
| Malaise (n=36 496) | <0.001† | 0.149† | ||
| Yes | 2.28 (1.72 to 3.03) | 0.73 (0.48 to 1.12) | ||
| Muscle pain (n=36 496) | 0.828† | |||
| Yes | 1.03 (0.81 to 1.30) | |||
| Nausea (n=36 496) | 0.432† | |||
| Yes | 1.06 (0.92 to 1.21) | |||
| Pharyngeal exudate (n=36 496) | 0.771† | |||
| Yes | 0.82 (0.22 to 3.04) | |||
| Rapid breathing (n=36 496) | 0.087† | |||
| Yes | 1.31 (0.96 to 1.79) | |||
| Runny nose (n=36 496) | 0.500† | |||
| Yes | 1.03 (0.95 to 1.11) | |||
| Sore throat (n=36 496) | <0.001† | <0.001† | ||
| Yes | 0.76 (0.70 to 0.83) | 0.70 (0.64 to 0.78) | ||
| Vomiting (n=36 496) | 0.754† | |||
| Yes | 0.98 (0.84 to 1.14) | |||
| Loss of smell (n=36 496) | <0.001† | <0.001† | ||
| Yes | 9.91 (7.09 to 13.86) | 7.78 (5.19 to 11.66) | ||
| Loss of taste (n=36 496) | <0.001† | <0.001† | ||
| Yes | 6.62 (4.76 to 9.21) | 2.50 (1.60 to 3.90) | ||
Significant results are in bold fonts.
*P value for trend.
†Wald’s p value.
‡27 038 records were available for the first (both statistically and non-statistically significant variables) and the final (only statistically significant variables) multivariable logistic regression models.
aOR, adjusted OR; LRT, Likelihood Ratio Test.
The adjusted model contained age group, sex, geopolitical zone of residence, occupation, travel history, chest pain, chills/sweat, cough, fatigue, fever, headache, malaise, sore throat, loss of smell, and loss of taste. The odds of testing positive for COVID-19 remained significantly (p value for trend <0.0001) higher for older age groups, notably for those aged 31 years and above, when compared with children under 5 years. The odds of COVID-19 positivity was 11% higher in men than in women (aOR 1.11, 95% CI 1.04% to 1.18%). Residing in the North-West (aOR 1.41, 95% CI 1.28 to 1.54) and North-East (aOR 1.46, 95% CI 1.26 to 1.69) was associated with higher odds of testing positive. In contrast, residing in the South-South (aOR 0.49, 95% CI 0.44 to 0.54) and North-Central (aOR 0.63, 95 CI 0.58 to 0.69) remained significantly associated with lower odds of testing positive for COVID-19 than in the South-West. The observed association in farmers remained significant (aOR 0.59, 95% CI 0.46 to 0.76) in the fully adjusted model. Conversely, a history of local travel (aOR 0.75, 95% CI 0.66 to 0.85) and international travel (aOR 0.52, 95% CI 0.44 to 0.61) before diagnosis was associated with lower odds compared with those without a travel history. For clinical signs and symptoms, cough (aOR 1.23, 95% CI 1.13 to 1.32), fever (aOR 1.45, 95% CI 1.45 to 1.71), loss of smell (aOR 7.78, 95% CI 5.19 to 11.66) and loss of taste (aOR 2.50, 95% CI 1.60 to 3.90) at diagnosis remained significantly associated with a positive test result. Whereas presentation at diagnosis with a sore throat remained negatively associated with a positive test for COVID-19 (aOR 0.70, 95% CI 0.64 to 0.78).
Patient characteristics associated with COVID-19 death
Characteristics of the study participants in relation to COVID-19 death
We had data on clinical outcome (recovery vs death) for 3215 patients with RT-PCR-confirmed COVID-19 during this study period (table 4). There were 295 (9.2%) deaths with a median time to death of 3 (IQR 1–7) days. The mean age at death was 55.9 (SD 16.2) years, while the mean age for the survivors was 35.6 (SD 15.3) years. Individuals aged 31–40 years accounted for the highest proportion of records of clinical outcome at 25.2% (789/3134); however, those 61–70 years accounted for the highest proportion of COVID-19 deaths at 28.7% (83/289). A higher proportion of deaths was observed in men (81.0%, 239/295). Of the 3215 study participants, 30.9%, 28.2% and 10.8% presented at diagnosis with fever, cough and breathing difficulty, respectively, while 46.4%, 52.2% and 36.9% of 295 persons who died presented at diagnosis with cough, fever and breathing difficulty, respectively.
Table 4.
Description of patient characteristics in relation to clinical outcome (dead vs recovered)
| Factor | COVID-19 clinical outcome‡ | P value (Wald’s test) | ||
| Dead (n (%)) |
Recovered (n (%)) |
Total (n (%)) |
||
| Sociodemographic and other epidemiological factors | ||||
| Median (IQR) time to death (days) | 3 (1–7)* | |||
| Age group (years)§ | n=289 | n=2845 | N=3134 | <0.001¶ |
| 0–20 | 7 (2.4) | 477 (16.8) | 484 (15.4) | |
| 21–30 | 20 (6.9) | 616 (21.7) | 636 (20.3) | |
| 31–40 | 25 (8.7) | 764 (26.9) | 789 (25.2) | |
| 41–50 | 39 (13.5) | 497 (17.5) | 536 (17.1) | |
| 51–60 | 74 (25.6) | 332 (11.7) | 406 (13.0) | |
| 61–70 | 83 (28.7) | 112 (3.9) | 195 (6.2) | |
| ≥71 | 41 (14.2) | 47 (1.7) | 88 (2.8) | |
| Sex | n=295 | n=2912 | N=3207 | <0.001 |
| Female | 56 (19.0) | 858 (29.5) | 914 (28.5) | |
| Male | 239 (81.0) | 2054 (70.5) | 2293 (71.5) | |
| Residential setting | n=171 | n=1555 | N=1726 | 0.363 |
| Rural | 22 (12.9) | 241 (15.5) | 263 (15.2) | |
| Urban | 149 (87.1) | 1314 (84.5) | 1463 (84.8) | |
| Geopolitical zone | n=295 | n=2920 | N=3215 | <0.001 |
| South-West | 83 (28.1) | 1138 (39.0) | 1221 (38.0) | |
| South-South | 47 (15.9) | 206 (7.1) | 253 (7.9) | |
| South-East | 3 (1.0) | 34 (1.2) | 37 (1.2) | |
| North-Central | 28 (9.5) | 308 (10.6) | 336 (10.5) | |
| North-West | 103 (34.9) | 1047 (35.9) | 1150 (35.8) | |
| North-East | 31 (10.5) | 187 (6.4) | 218 (6.8) | |
| Health facility type | n=57 | n=685 | N=742 | <0.001 |
| Primary | 4 (7.0) | 261 (38.1) | 265 (35.7) | |
| Secondary | 21 (36.8) | 178 (26.0) | 199 (26.8) | |
| Tertiary | 32 (56.1) | 246 (35.9) | 278 (37.5) | |
| Education completed | n=153 | n=1656 | N=1809 | 0.766 |
| No formal education | 8 (5.2) | 121 (7.3) | 129 (7.1) | |
| Nursery/primary | 6 (3.9) | 87 (5.3) | 93 (5.1) | |
| Secondary | 29 (19.0) | 300 (18.1) | 329 (18.2) | |
| Tertiary | 99 (64.7) | 1051 (63.5) | 1150 (63.6) | |
| Alternative (eg, Almajiri) | 11 (7.2) | 97 (5.9) | 108 (6.0) | |
| Current occupation | n=196 | n=2074 | N=2270 | <0.001 |
| Pupil/student | 3 (1.5) | 203 (9.8) | 206 (9.1) | |
| Child | 0 (0.0) | 38 (1.8) | 38 (1.7) | |
| Housewife | 7 (3.6) | 57 (2.8) | 64 (2.8) | |
| Trader/business | 22 (11.2) | 208 (10.0) | 230 (10.1) | |
| Healthcare worker | 12 (6.1) | 330 (15.9) | 342 (15.1) | |
| Animal-related work | 0 (0.0) | 6 (0.3) | 6 (0.3) | |
| Farmer | 14 (7.1) | 38 (1.8) | 52 (2.3) | |
| Religious/traditional leader | 4 (2.0) | 12 (0.6) | 16 (0.7) | |
| Transporter | 2 (1.0) | 12 (0.6) | 14 (0.6) | |
| Other | 132 (67.4) | 1170 (56.4) | 1302 (57.4) | |
| Travel history | n=290 | n=2883 | N=3173 | 0.005 |
| No | 270 (93.1) | 2495 (86.5) | 2765 (87.1) | |
| Local | 16 (5.5) | 282 (9.8) | 298 (9.4) | |
| International | 4 (1.4) | 106 (3.7) | 110 (3.5) | |
| Clinical factors (only the figures for symptoms presented/yes are presented) | ||||
| Mean (SD) temperature (oC)† | 37.3 (1.3) | 37.1 (1.0) | 37.1 (1.0) | |
| n=295** | n=2920** | N=3215** | ||
| Abdominal pain | 6 (2.0) | 14 (0.5) | 20 (0.6) | 0.001 |
| Chest pain | 14 (4.8) | 53 (1.8) | 67 (2.1) | 0.001 |
| Chills/sweat | 3 (1.0) | 26 (0.9) | 29 (0.9) | 0.827 |
| Confusion | 4 (1.4) | 4 (0.1) | 8 (0.3) | <0.001 |
| Cough | 154 (52.2) | 751 (25.7) | 905 (28.2) | <0.001 |
| Diarrhoea | 20 (6.8) | 112 (3.8) | 132 (4.1) | 0.015 |
| Breathing difficulty | 109 (36.9) | 237 (8.1) | 346 (10.8) | <0.001 |
| Fatigue | 24 (8.1) | 93 (3.2) | 117 (3.6) | <0.001 |
| Fever | 137 (46.4) | 855 (29.3) | 992 (30.9) | <0.001 |
| Headache | 20 (6.8) | 251 (8.6) | 271 (8.4) | 0.285 |
| Joint pain | 6 (2.0) | 22 (0.7) | 28 (0.9) | 0.024 |
| Malaise | 13 (4.4) | 60 (2.0) | 73 (2.3) | 0.010 |
| Muscle pain | 6 (2.0) | 49 (1.7) | 55 (1.7) | 0.653 |
| Nausea | 16 (5.4) | 87 (3.0) | 103 (3.2) | 0.023 |
| Rapid breathing | 11 (3.7) | 21 (0.7) | 32 (1.0) | <0.001 |
| Runny nose | 32 (10.8) | 297 (10.2) | 329 (10.2) | 0.715 |
| Sore throat | 35 (11.9) | 296 (10.1) | 331 (10.3) | 0.352 |
| Vomiting | 26 (8.8) | 59 (2.0) | 85 (2.6) | <0.001 |
| Loss of smell | 1 (0.3) | 22 (0.8) | 23 (0.7) | 0.421 |
| Loss of taste | 5 (1.7) | 25 (0.9) | 30 (0.9) | 0.153 |
*Based on 167 available records with death and sample collection dates.
†Based on 1157 records.
‡Based on a total record of 3215; 7302 persons diagnosed with COVID-19 did not yet have a clinical outcome during the study period.
§Mean (SD) age at death was 55.9 (16.2) years, 35.6 (15.3) years for survivors and 37.5 (16.5) years for total study participants.
¶P value for trend.
**Applicable to all clinical signs and symptoms (295 deaths from COVID-19 infection and 3215 total cases (death and survivor from COVID-19 infection)); clinical factors had no missing data.
N, total cases of clinical outcome (death and survivor from COVID-19 infection); n, death from COVID-19 infection only.
Association between patient characteristics and COVID-19 death
In the unadjusted model, the odds of COVID-19 death increased progressively with increasing age group, reaching about 51-fold increase (OR 50.50, 95% CI 22.73 to 112.21) in persons aged 61–70 years when compared with those aged 0–20 years (table 5). The odds of COVID-19 death was 78% higher in men than in women (OR 1.78, 95% CI 1.32 to 2.41). The odds of COVID-19 death was about 25 times higher (OR 24.93, 95% CI 6.83 to 90.94) in farmers than in students. Presentation at diagnosis with abdominal pain, chest pain, cough, confusion, difficulty breathing, diarrhoea, fatigue, fever, joint pain, malaise, nausea, rapid breathing and vomiting was positively associated with increased odds of COVID-19 death.
Table 5.
Unadjusted and aORs and 95% CIs for COVID-19 death in Nigeria
| Factor | Unadjusted OR (95% CI) | P value (LRT) | aOR (95% CI)‡ | P value (LRT) |
| Sociodemographic factors | ||||
| Age groups, year (n=3134) | <0.0001 | <0.0001* | ||
| 0–20 | 1 | 1 | ||
| 21–30 | 2.21 (0.93 to 5.28) | 0.57 (0.19 to 1.68) | ||
| 31–40 | 2.23 (0.96 to 5.20) | 0.64 (0.22 to 1.80) | ||
| 41–50 | 5.35 (2.37 to 12.07) | 1.39 (0.51 to 3.75) | ||
| 51–60 | 15.19 (6.91 to 33.39) | 2.93 (1.10 to 7.81) | ||
| 61–70 | 50.50 (22.73 to 112.21) | 14.53 (5.35 to 39.43) | ||
| ≥71 | 59.44 (25.26 to 139.88) | 10.81 (3.70 to 31.60) | ||
| Sex (n=3207) | <0.001† | 0.393† | ||
| Female | 1 | 1 | ||
| Male | 1.78 (1.32 to 2.41) | 1.23 (0.76 to 2.00) | ||
| Geopolitical zone (n=3215) | <0.0001 | 0.1915 | ||
| South-West | 1 | 1 | ||
| South-South | 3.13 (2.12 to 4.61) | 1.49 (0.83 to 2.67) | ||
| South-East | 1.21 (0.36 to 4.02) | 1.50 (0.33 to 6.94) | ||
| North-Central | 1.25 (0.80 to 1.95) | 1.69 (0.93 to 3.07) | ||
| North-West | 1.35 (1.00 to 1.82) | 1.68 (1.06 to 2.69) | ||
| North-East | 2.27 (1.46 to 3.53) | 2.10 (0.96 to 4.62) | ||
| Occupation (n=2226) | <0.0001 | 0.0042 | ||
| Pupil/student | 1 | 1 | ||
| Child | Omitted | Omitted | ||
| Housewife | 8.31 (2.08 to 33.17) | 2.68 (0.54 to 13.23) | ||
| Trader/business | 7.16 (2.11 to 24.28) | 2.13 (0.54 to 8.50) | ||
| Health worker | 2.46 (0.69 to 8.82) | 1.57 (0.38 to 6.54) | ||
| Animal-related work | Omitted | Omitted | ||
| Farmer | 24.93 (6.83 to 90.94) | 7.56 (1.70 to 33.53) | ||
| Religious/traditional leader | 22.56 (4.53 to 112.41) | 1.24 (0.17 to 8.95) | ||
| Transporter | 11.28 (1.72 to 74.02) | 5.46 (0.58 to 51.36) | ||
| Other | 7.63 (2.41 to 24.21) | 3.74 (1.03 to 13.56) | ||
| Travel history (n=3173) | 0.0022 | 0.0004 | ||
| No travel | 1 | 1 | ||
| Local | 0.52 (0.31 to 0.88) | 0.69 (0.35 to 1.34) | ||
| International | 0.35 (0.13 to 0.95) | 0.14 (0.04 to 0.47) | ||
| Clinical signs and symptoms (no, coded 0, is the reference group with an OR of 1.00) | ||||
| Abdominal pain (n=3215) | 0.003† | 0.733† | ||
| Yes | 4.31 (1.64 to 11.30) | 0.73 (0.12 to 4.52) | ||
| Chest pain (n=3215) | 0.001† | 0.866† | ||
| Yes | 2.70 (1.48 to 4.92) | 1.10 (0.36 to 3.35) | ||
| Chills/sweat (n=3215) | 0.827† | |||
| Yes | 1.14 (0.34 to 3.80) | |||
| Confusion (n=3215) | 0.001† | 0.089† | ||
| Yes | 10.02 (2.50 to 40.28) | 6.02 (0.76 to 47.53) | ||
| Cough (n=3215) | <0.001† | <0.001† | ||
| Yes | 3.15 (2.47 to 4.02) | 2.06 (1.41 to 3.01) | ||
| Diarrhoea (n=3215) | 0.017† | 0.610† | ||
| Yes | 1.82 (1.12 to 2.98) | 1.18 (0.62 to 2.28) | ||
| Breathing difficulty (n=3215) | <0.001† | <0.001† | ||
| Yes | 6.63 (5.06 to 8.70) | 5.68 (3.77 to 8.58) | ||
| Fatigue (n=3215) | <0.001† | 0.752† | ||
| Yes | 2.70 (1.69 to 4.29) | 1.15 (0.48 to 2.80) | ||
| Fever (n=3215) | <0.001† | 0.060† | ||
| Yes | 2.10 (1.64 to 2.67) | 1.49 (0.98 to 2.26) | ||
| Headache (n=3215) | 0.286† | |||
| Yes | 0.77 (0.48 to 1.24) | |||
| Joint pain (n=3215) | 0.030† | 0.737† | ||
| Yes | 2.73 (1.10 to 6.80) | 1.30 (0.28 to 6.10) | ||
| Malaise (n=3215) | 0.012† | 0.926† | ||
| Yes | 2.20 (1.19 to 4.05) | 1.06 (0.29 to 3.91) | ||
| Muscle pain (n=3215) | 0.654† | |||
| Yes | 1.22 (0.52 to 2.86) | |||
| Nausea (n=3215) | 0.025† | 0.730† | ||
| Yes | 1.87 (1.08 to 3.23) | 0.88 (0.42 to 1.85) | ||
| Rapid breathing (n=3215) | <0.001† | 0.936† | ||
| Yes | 5.35 (2.55 to 11.20) | 1.05 (0.32 to 3.45) | ||
| Runny nose (n=3215) | 0.715† | |||
| Yes | 1.07 (0.73 to 1.58) | |||
| Sore throat (n=3215) | 0.353† | |||
| Yes | 1.19 (0.82 to 1.73) | |||
| Vomiting (n=3215) | <0.001† | |||
| Yes | 4.69 (2.91 to 7.56) | 2.54 (1.33 to 4.84) | 0.005† | |
| Loss of smell (n=3215) | 0.433† | |||
| Yes | 0.45 (0.06 to 3.34) | |||
| Loss of taste (n=3215) | 0.161† | |||
| Yes | 2.00 (0.76 to 5.25) | |||
Significant results are in bold fonts.
*P value for trend<0.0001.
†Wald’s p value.
‡2179 records were available for the first multivariable logistic regression model and 2185 records for the final adjusted multivariable logistic regression model (ie, excluding the variables with p>0.05).
aOR, adjusted OR; LRT, Likelihood Ratio Test.
The adjusted model comprised age group, sex, geopolitical zone of residence, occupation, travel history, abdominal pain, chest pain, confusion, cough, diarrhoea, breathing difficulty, fatigue, fever, joint pain, malaise, nausea, rapid breathing and vomiting. Persons aged 51–60 years (OR 2.93, 95% CI 1.10 to 7.81), 61–70 years (OR 14.53, 95% CI 5.35 to 39.43) and ≥71 years (OR 10.81, 95% CI 3.70 to 31.60) remained significantly more at risk of COVID-19 death compared with those aged 0–20 years. The odds of death was about eight times higher in farmers (OR 7.56, 95% CI 1.70 to 33.53) than in students. Conversely, the adjusted odds of COVID-19 death was 86% lower in individuals with a record of international travel 14 days before diagnosis (OR 0.14, 95% CI 0.04 to 0.47) than in those without a travel history. Regarding clinical variables that remained significant in the adjusted model, the odds of COVID-19 death was higher among persons who presented at diagnosis with cough (OR 2.06, 95% CI 1.41 to 3.01), breathing difficulty (OR 5.68, 95% CI 3.77 to 8.58) and vomiting (OR 2.54, 95% CI 1.33 to 4.84).
Discussion
Principal findings
This study has identified sociodemographic and clinical characteristics associated with COVID-19 positivity and subsequent death in Nigeria between 27 February and 8 June 2020. Overall, older age, male sex, residing in the North-West and North-East regions, and presenting at diagnosis with cough, fever, loss of smell or taste were positively associated with COVID-19 positivity. Conversely, residing in the South-South and North-Central regions, farming occupation, a travel history and presenting at diagnosis with a sore throat were negatively associated with COVID-19 positivity. For COVID-19 death, older age, farming occupation and presenting at diagnosis with cough, breathing difficulty or vomiting were positively associated with COVID-19 death, whereas a history of international travel showed a negative association with COVID-19 death.
Strengths and weaknesses of the study
To our knowledge, this is the first national investigation of both sociodemographic and clinical factors associated with COVID-19 infection and death in Nigeria, with our evidence helping to fill a significant research gap. Though COVID-19 diagnosis was ascertained using RT-PCR testing (the gold standard for SARS-CoV-2 diagnosis), it is possible for RT-PCR sensitivity to differ across states possibly due to variations in swab technique (especially in individuals with lower viral loads). In such a scenario, our findings could be biased if any of the identified sociodemographic and clinical factors had an association with differences in viral load, rather than actual SARS-CoV-2 infection.20 The use of SORMAS data suggests our findings are relatively representative of COVID-19 epidemiology in the country, as health facilities in the 36 states and the FCT are mandatorily required to report surveillance data to the NCDC. Additionally, activation of an emergency operation centre in response to the outbreak is often characterised by active case finding both within and beyond health facilities, suggesting the inclusion of COVID-19 cases at the community level. Nevertheless, it is worth noting that the suboptimal testing capacity for COVID-19 testing in the country—especially in states other than the FCT and Lagos—within the study period could potentially affect the representativeness of our findings.
Our study is however subject to a number of limitations. A prominent challenge with using surveillance data for research is missing data—this was the case for some sociodemographic variables in our study. Using complete case analysis to handle missing data and dropping individuals without at least a positive clinical record further decreased the sample size available for analysis and subsequently, the statistical power. Moreover, our estimated ORs may be biased if the data are not missing completely at random. However, our approach to handling missing data yields unbiased estimates for most regression models when the chance of being a complete case does not depend on the outcome after accounting for covariates.21 The lack of data on comorbidities, known risk factors for COVID-19 death,22 is also a limitation of this study. Lastly, the use of either nasopharyngeal or nasal swab, alongside oropharyngeal swab, for COVID-19 diagnosis in our context has the potential to bias our estimates if there was a systematic difference in case classification based on case definition. COVID-19 diagnosis using mid-turbinate nasal swab may be less reliable compared with nasopharyngeal sample, particularly in individuals with lower viral loads in the upper respiratory tract.23
Interpretation and potential implications of findings
Factors associated with COVID-19 positivity
The higher odds of COVID-19 positivity in adults in the current study could be attributable, in part, to socioeconomic or work activities. The higher odds of COVID-19 positivity in men compared with women could be attributable to a combination of genetic, physiological and sociocultural factors. For example, the broader distribution of SARS-CoV-2 cellular receptor, ACE-2, in men as compared with women has been postulated as a possible explanation.24 Additionally, in a patriarchal system such as Nigeria’s, men are more likely to engage in economic activities outside of the household, hence the possible increase in exposure to SARS-CoV-2. In recent times, however, women are increasingly partaking in the workforce, such that traditional patterns of ‘male breadwinner and female family support’ are quickly shifting.25 A higher proportion of men testing positive for SARS-CoV-2 has also been reported in the UK.20
Identification of clinical factors associated with increased risk of COVID-19 is of paramount relevance for clinical case management of patients, especially in Nigeria with consistently increasing COVID-19 cases and limited molecular testing capacity. Presenting at diagnosis with cough, fever, loss of smell and taste was positively associated with COVID-19 positivity in Nigeria. Although the predictive capacity of these clinical factors was not covered in this study, our findings are congruent with those from a recent review of the predictors of COVID-19 positivity in patients with suspected infection.26 Given the endemicity of infectious diseases in Nigeria which often present with fever (eg, malaria, Lassa fever and yellow fever), clinical utility of fever alone for predicting COVID-19 positivity could be limited in the absence of a confirmatory diagnosis by RT-PCR. Despite the late documentation of loss of smell (anosmia) and taste (ageusia) (documentation commenced after the first 6 weeks of COVID-19 epidemic in Nigeria), presenting at diagnosis with any of these symptoms was significantly and positively associated with COVID-19 positivity than the other variables which showed a similar association. These symptoms have been identified as part of COVID-19 neurological manifestations globally.27 Sore throat was negatively associated with COVID-19 positivity in the current study, similar to evidence in the USA with study participants comprising entirely of healthcare workers.28 Generally, it is difficult to ascertain the specific causes of sore throat without a differential diagnostic test as it can be caused by infections with viruses or with bacteria29 or by a violent cough or chemical irritation.30
There were variations regarding the odds of COVID-19 positivity among the residents of other geopolitical zones relative to the South-West. Compared with the South-West, negative association with COVID-19 positivity by virtue of residency in the South-South and North-Central could be attributable to relatively low testing capacity and minimal contribution of data on confirmed COVID-19 cases. Cross-River State in the South-South accounted for zero confirmed COVID-19 cases while Kogi State in the North-Central accounted for two confirmed cases during the study period. The higher odds of COVID-19 positivity among North-East residents as compared with those of South-West is in conformity with a previous projection by the United Nations Development Programme in April 2020.31 Despite the absence of reports of confirmed COVID-19 cases in the North-East then, there was a projection of a high COVID-19 burden in the region, especially in internally displaced persons camps and host communities in Borno, Adamawa and Yobe states, where many of the prescribed preventive measures (eg, restriction on mass gathering) will be challenging to implement. The higher odds of COVID-19 positivity among North-West residents as compared with those of the South-West do not have obvious explanations; however, testing availability and uptake could potentially explain the observed differences. In the early phase of the outbreak, Kano state (with a 2020 projected population of over 14 million people and with the highest number of confirmed COVID-19 cases in the North-West during this study period) delayed in testing for COVID-19 partly due to (1) limited capacity for molecular testing and (2) contextual challenges associated with testing uptake by residents.32 An example of a contextual challenge in Kano state was a widespread misconception about COVID-19 transmission and associated deaths in the state. This is evidenced by the use of verbal autopsy to confirm COVID-19-related deaths in the state.33 Nevertheless, it is worth noting that use of aggregated data by region means it is difficult to generalise these findings to individual states, given the likelihood of an ecological fallacy.34 Compared with students, farmers had lower odds of COVID-19 positivity in the current study, which could be partly attributable to lesser agricultural activities (including transportation via shared vehicles) and consequent decrease in SARS-CoV-2 exposure.
A history of international travel was found to be negatively associated with COVID-19 positivity and subsequent death in the current study. This is contrary to the rationale for closing international airports (essential travels including the delivery of health commodities and repatriation of stranded Nigerian citizens did occur occasionally) from 23 March 2020 to the time of writing. It is logical to presume that international travellers after the formal closure of airports would be less likely to be exposed to SARS-CoV-2 infection on the basis on their travel arrangements and not representative of the general population in Nigeria. This is because such flights would be less full and adhere to physical distance measures, along with special infection prevention and control measures instituted by NCDC. Furthermore, the international airports themselves would be less crowded, and mandatory screening for COVID-19 at least based on fever was a routine practice at Nigerian airports. Thus, the international travel in itself, under these circumstances, may not present an increased risk of exposure to SARS-CoV-2 infection. It is also worth noting that the observed association between international travel and COVID-19 positivity and clinical outcome cannot be interpreted as a causal association. A history of local travel (either by local flight or by road) was also negatively associated with COVID-19 positivity. While the explanations for international travels may not be totally applicable to that of local travel, there was an enforcement of physical distancing (eg, spacing of passengers) in the course of local travel by multiple agencies (eg, road safety commission and local transportation union) across the country. Implementation of such measures, however, resulted in increased cost and shortage of transportation.35
Factors associated with COVID-19 death
Similar to available evidence,36 older adults were more likely to develop adverse clinical outcome, such as death, in the current study. In China, for example, adults, especially those aged 65 years or over, had about fourfold increase in risk of COVID-19 death compared with children.37 The higher odds of COVID-19 death in older adults than those aged 0–20 years in our study could be explained by a greater burden of immunosenescence in the former than in the latter. Thymic atrophy increases with increasing age, which decreases the production of T cells and immunological responses to pathogens and increases the potential for adverse clinical outcome38 from persistent inflammation or multiorgan failure and death in elderly people.39 Unlike the risk of COVID-19 positivity, we found the odds of COVID-19 death to be higher in farmers than in students. This could be partially attributable to poor health-seeking behaviours by farmers, many of whom practice subsistence agriculture and are based in rural areas with poor road networks in Nigeria, which is an important barrier to accessing healthcare.40 Thus, our finding underlines the need to engage diverse health stakeholders, including patent medicine vendors that are often the preferred choice of healthcare in rural areas,41 to effectively address contextual barriers to health service use by farmers.
We found breathing difficulty (dyspnoea) to be positively associated with COVID-19 death. This is in tandem with existing evidence from systematic review and meta-analysis.9 42 Also found to be positively associated with COVID-19 death was vomiting at diagnosis. Gastrointestinal symptoms, including vomiting, have been linked with a poor disease course in patients with COVID-19, possibly due to either viral replication in the gastrointestinal tract, causing more severe disease or non-presentation of common respiratory symptoms in the early stage of illness.43 This finding could have an important implication for management and prognosis for patients with COVID-19 with pre-existing digestive comorbidities. Unlike COVID-19 positivity, fever was not significantly associated with COVID-19 death in this study. While this is in agreement with an existing evidence,42 it appears that the relative ease of assessment and prompt detection of fever triggers the initiation of appropriate healthcare and consequently protect against adverse clinical outcome.9 The negative association between international travel and COVID-19 death could be reflective of targeted public health measures instituted by the Nigerian government. For instance, international travellers were offered customised COVID-19 information and NCDC contact details at airports and, depending on COVID-19 epidemiology in the country of departure, were followed up by NCDC ad hoc staff using mobile numbers or emails. Thus, presentation for SARS-CoV-2 testing and adoption of preventive measures (eg, use of face masks and routine hand hygiene) by international travellers may be more likely than in non-travellers.
Conclusion
The significant risk factors associated with COVID-19 positivity and subsequent death in the Nigerian population are similar to those reported in studies from other countries and should guide clinical decisions for COVID-19 testing and specialist care referrals.
Supplementary Material
Acknowledgments
We acknowledge and thank all healthcare workers at COVID-19 treatment centres, local and state surveillance officers and Nigeria Centre for Disease Control staff who contributed to the collection of the analysed data. Importantly, we thank the patient whose deidentified data formed the basis for this study.
Footnotes
Twitter: @KElimian, @chinwe_ochu, @Ehimario
Contributors: KOE contributed to the conceptualisation, literature search, data management, data analysis, writing (original draft, review and editing) and formatting of the document. CLO contributed to the conceptualisation, writing (review and editing), formatting of the manuscript and funding acquisition. PM contributed to the writing (original draft, review and editing), literature search and formatting of the manuscript. BE, EEC, EI, WU, AO, OAr and SV contributed to the writing (review and editing) and formatting of the manuscript. CD-N, OAO, OO, RA, WN and OAd contributed to data acquisition, writing (review and editing) and formatting of the manuscript. CO, SN, KS, MU, HAY, IN, AAM and RU contributed to data acquisition and curation, and writing (review) of the manuscript. NM, EI and JO contributed to supervision, writing (review), funding acquisition, project administration and resources. IA contributed to the writing (original draft, review and editing), literature search and formatting of the manuscript. CI contributed to conceptualisation, supervision, writing (review and editing), funding acquisition, project administration and resources. All authors invested significant contributions and approved the final draft.
Funding: The authors have not declared a specific grant for this research from any funding agency in the public, commercial or not-for-profit sectors.
Competing interests: None declared.
Patient and public involvement: Patients and/or the public were not involved in the design, conduct, reporting or dissemination plans of this research.
Patient consent for publication: Not required.
Ethics approval: The study protocol was approved by the Nigeria National Health Research Ethics Committee (NHREC/01/01/2007-22/06/2020).
Provenance and peer review: Not commissioned; externally peer reviewed.
Data availability statement: Data are available upon reasonable request. Data are available via email (chinwe.ochu@ncdc.ng.gov).
References
- 1.Beeching NJ, Fletcher TE, Fowler R. Bmj best practice: COVID-19. BMJ 2020. [Google Scholar]
- 2.World Health Organization Coronavirus disease (COVID-19) sitation report-195. Geneva, 2020. Available: https://www.who.int/docs/default-source/coronaviruse/situation-reports/20200802-covid-19-sitrep-195.pdf?sfvrsn=5e5da0c5_2 [Accessed 4 Aug 2020].
- 3.Nigeria Centre for Disease Control COVID-19 situation Report-156. Abuja, 2020. Available: https://ncdc.gov.ng/diseases/sitreps/?cat=14&name=AnupdateofCOVID-19outbreakinNigeria
- 4.Zhang J, Wang X, Jia X, et al. Risk factors for disease severity, unimprovement, and mortality in COVID-19 patients in Wuhan, China. Clin Microbiol Infect 2020;26:767–72. 10.1016/j.cmi.2020.04.012 [DOI] [PMC free article] [PubMed] [Google Scholar]
- 5.Wang D, Hu B, Hu C, et al. Clinical characteristics of 138 hospitalized patients with 2019 novel coronavirus-infected pneumonia in Wuhan, China. JAMA 2020;323:1061–9. 10.1001/jama.2020.1585 [DOI] [PMC free article] [PubMed] [Google Scholar]
- 6.Livingston E, Bucher K. Coronavirus disease 2019 (COVID-19) in Italy. JAMA 2020;323:1335. 10.1001/jama.2020.4344 [DOI] [PubMed] [Google Scholar]
- 7.Yang J, Zheng Y, Gou X, et al. Prevalence of comorbidities and its effects in coronavirus disease 2019 patients: a systematic review and meta-analysis. Int J Infect Dis 2020;94:91–5. 10.1016/j.ijid.2020.03.017 [DOI] [PMC free article] [PubMed] [Google Scholar]
- 8.Chen T, Wu D, Chen H, et al. Clinical characteristics of 113 deceased patients with coronavirus disease 2019: retrospective study. BMJ 2020;368:m1091. 10.1136/bmj.m1091 [DOI] [PMC free article] [PubMed] [Google Scholar]
- 9.Zheng Z, Peng F, Xu B, et al. Risk factors of critical & mortal COVID-19 cases: A systematic literature review and meta-analysis. J Infect 2020;81:e16–25. 10.1016/j.jinf.2020.04.021 [DOI] [PMC free article] [PubMed] [Google Scholar]
- 10.Bowale A, Abayomi A, Idris J, et al. Clinical presentation, case management and outcomes for the first 32 COVID-19 patients in Nigeria. Pan Afr Med J;35 10.11604/pamj.supp.2020.35.2.23262 [DOI] [PMC free article] [PubMed] [Google Scholar]
- 11.Elimian KO, Ochu CL, Ilori E, et al. Descriptive epidemiology of coronavirus disease 2019 in Nigeria, 27 February-6 June 2020. Epidemiol Infect 2020;148:e208. 10.1017/S095026882000206X [DOI] [PMC free article] [PubMed] [Google Scholar]
- 12.Hopman J, Allegranzi B, Mehtar S. Managing COVID-19 in low- and middle-income countries. JAMA 2020;323:1549–50. 10.1001/jama.2020.4169 [DOI] [PubMed] [Google Scholar]
- 13.Helmholtz Centre for Infection Research SORMAS: the real-time software for outbreak and epidemic surveillance, 2019. Available: https://sormasorg.helmholtz-hzi.de/About_SORMAS.html [Accessed 27 Jul 2020].
- 14.Fall IS, Rajatonirina S, Yahaya AA, et al. Integrated disease surveillance and response (IDSR) strategy: current status, challenges and perspectives for the future in Africa. BMJ Glob Health 2019;4:e001427. 10.1136/bmjgh-2019-001427 [DOI] [PMC free article] [PubMed] [Google Scholar]
- 15.Nigeria Centre for Disease Control Case definitions for coronavirus disease. Abuja, 2020. Available: https://covid19.ncdc.gov.ng/media/files/Case_Definition.pdf [Accessed 22 Jul 2020].
- 16.Nigeria Centre for Disease Control National interim guidelines for clinical management of COVID-19, version 2, may 2020. Abuja. Available: https://ncdc.gov.ng/themes/common/docs/protocols/177_1584210847.pdf [Accessed 26 May 2020].
- 17.World Health Organization Laboratory testing for coronavirus disease (COVID-19) in suspected human cases: interim guidance, 19 March 2020. who. Available: https://www.who.int/publications-detail/laboratory-testing-for-2019-novel-coronavirus-in-suspected-human-cases-20200117 [Accessed 1 Jun 2020].
- 18.Semple MG, Myles PR, Nicholson KG, et al. An evaluation of community assessment tools (CATs) in predicting use of clinical interventions and severe outcomes during the A(H1N1)pdm09 pandemic. PLoS One 2013;8:e75384. 10.1371/journal.pone.0075384 [DOI] [PMC free article] [PubMed] [Google Scholar]
- 19.Fitzgerald F, Wing K, Naveed A, et al. Development of a pediatric Ebola predictive Score, Sierra Leone1. Emerg Infect Dis 2018;24:311–9. 10.3201/eid2402.171018 [DOI] [PMC free article] [PubMed] [Google Scholar]
- 20.de Lusignan S, Dorward J, Correa A, et al. Risk factors for SARS-CoV-2 among patients in the Oxford Royal College of general practitioners research and surveillance centre primary care network: a cross-sectional study. Lancet Infect Dis 2020;20:1034–42. 10.1016/S1473-3099(20)30371-6 [DOI] [PMC free article] [PubMed] [Google Scholar]
- 21.Hughes RA, Heron J, Sterne JAC, et al. Accounting for missing data in statistical analyses: multiple imputation is not always the answer. Int J Epidemiol 2019;48:1294–304. 10.1093/ije/dyz032 [DOI] [PMC free article] [PubMed] [Google Scholar]
- 22.Asfahan S, Deokar K, Dutt N, et al. Extrapolation of mortality in COVID-19: exploring the role of age, sex, co-morbidities and health-care related occupation. Monaldi Arch Chest Dis 2020;90. 10.4081/monaldi.2020.1325. [Epub ahead of print: 21 May 2020]. [DOI] [PubMed] [Google Scholar]
- 23.Pinninti S, Trieu C, Pati SK, et al. Comparing nasopharyngeal and Mid-Turbinate nasal swab testing for the identification of SARS-CoV-2. Clin Infect Dis 2020. 10.1093/cid/ciaa882. [Epub ahead of print: 29 Jun 2020]. [DOI] [PMC free article] [PubMed] [Google Scholar]
- 24.Patel SK, Velkoska E, Burrell LM. Emerging markers in cardiovascular disease: where does angiotensin-converting enzyme 2 fit in? Clin Exp Pharmacol Physiol 2013;40:551–9. 10.1111/1440-1681.12069 [DOI] [PubMed] [Google Scholar]
- 25.Akanle O, Adesina JO, Nwaobiala UR. Turbulent but I must endure in silence: female breadwinners and survival in southwestern Nigeria. J Asian Afr Stud 2018;53:98–114. 10.1177/0021909616658913 [DOI] [Google Scholar]
- 26.Wynants L, Van Calster B, Collins GS, et al. Prediction models for diagnosis and prognosis of covid-19 infection: systematic review and critical appraisal. BMJ 2020;369:m1328. 10.1136/bmj.m1328 [DOI] [PMC free article] [PubMed] [Google Scholar]
- 27.Jasti M, Nalleballe K, Dandu V, et al. A review of pathophysiology and neuropsychiatric manifestations of COVID-19. J Neurol 2020;382. 10.1007/s00415-020-09950-w. [Epub ahead of print: 03 Jun 2020]. [DOI] [PMC free article] [PubMed] [Google Scholar]
- 28.Lan F-Y, Filler R, Mathew S, et al. COVID-19 symptoms predictive of healthcare workers' SARS-CoV-2 PCR results. PLoS One 2020;15:e0235460. 10.1371/journal.pone.0235460 [DOI] [PMC free article] [PubMed] [Google Scholar]
- 29.Shiel WC. Definition of sore throat. RxList, 2018. Available: https://www.rxlist.com/script/main/art.asp?articlekey=40399 [Accessed 6 Jul 2020].
- 30.Sun P, Ren J, Li K, et al. Response to: Sore throat in COVID-19: comment on "Clinical characteristics of hospitalized patients with SARS-CoV-2 infection: A single arm meta-analysis". J Med Virol 2020;92:716–8. 10.1002/jmv.25818 [DOI] [PMC free article] [PubMed] [Google Scholar]
- 31.United Nations Development Programme The COVID-19 pandemic in Nigeria: potential impact on the north-east. Abuja, 2020. Available: https://www.ng.undp.org/content/nigeria/en/home/library/the-covid-19-pandemic-in-nigeria-potential-impact-on-the-north-.html
- 32.Centre for Democracy & Development Unpacking falsehoods: COVID-19 and responses in Kano state, 2020. Available: https://cddelibrary.org/wp-content/uploads/2020/05/Unpacking-Falsehoods-COVID-19-and-responses-in-Kano-State.pdf
- 33.Onyedika-Ugoeze N. Verbal autopsy on strange deaths in Kano links 60 percent of the deaths to COVID-19. The guardian. Available: https://guardian.ng/news/verbal-autopsy-on-strange-deaths-in-kano-links-60-percent-of-the-deaths-to-covid-19/ [Accessed 24 Jul 2020].
- 34.Salkeld DJ, Antolin MF, Fallacy E. Ecological fallacy and aggregated data: a case study of fried chicken restaurants, obesity and Lyme disease. Ecohealth 2020;17:4–12. 10.1007/s10393-020-01472-1 [DOI] [PubMed] [Google Scholar]
- 35.Mogaji E. Impact of COVID-19 on transportation in Lagos, Nigeria. Transp Res 2020;6:100154 10.1016/j.trip.2020.100154 [DOI] [PMC free article] [PubMed] [Google Scholar]
- 36.McIntosh K. Coronavirus disease 2019 (COVID-19): clinical features. UpToDate. Available: https://www.uptodate.com/contents/coronavirus-disease-2019-covid-19-clinical-features [Accessed 7 Jul 2020].
- 37.Du R-H, Liang L-R, Yang C-Q, et al. Predictors of mortality for patients with COVID-19 pneumonia caused by SARS-CoV-2: a prospective cohort study. Eur Respir J 2020;55:2000524. 10.1183/13993003.00524-2020 [DOI] [PMC free article] [PubMed] [Google Scholar]
- 38.Trzonkowski P. Effect of Anti-influenza Vaccination on Immune System in the Elderly : Handbook on Immunosenescence. Springer Netherlands, 2009: 1455–86. [Google Scholar]
- 39.Trzonkowski P, Dębska-Ślizień A, Jankowska M, et al. Immunosenescence increases the rate of acceptance of kidney allotransplants in elderly recipients through exhaustion of CD4+ T-cells. Mech Ageing Dev 2010;131:96–104. 10.1016/j.mad.2009.12.006 [DOI] [PubMed] [Google Scholar]
- 40.Rees CP, Hawkesworth S, Moore SE, et al. Factors affecting access to healthcare: an observational study of children under 5 years of age presenting to a rural Gambian primary healthcare centre. PLoS One 2016;11:e0157790. 10.1371/journal.pone.0157790 [DOI] [PMC free article] [PubMed] [Google Scholar]
- 41.Onyeonoro UU, Ogah OS, Ukegbu AU, et al. Urban–rural differences in Health-Care-Seeking pattern of residents of Abia state, Nigeria, and the implication in the control of NCDS. Health Serv Insights 2016;9:HSI.S31865. 10.4137/HSI.S31865 [DOI] [PMC free article] [PubMed] [Google Scholar]
- 42.Shi L, Wang Y, Wang Y, et al. Dyspnea rather than fever is a risk factor for predicting mortality in patients with COVID-19. J Infect 2020;81:647–79. 10.1016/j.jinf.2020.05.013 [DOI] [PMC free article] [PubMed] [Google Scholar]
- 43.Pan L, Mu M, Yang P, et al. Clinical characteristics of COVID-19 patients with digestive symptoms in Hubei, China. Am J Gastroenterol 2020;115:766–73. 10.14309/ajg.0000000000000620 [DOI] [PMC free article] [PubMed] [Google Scholar]
Associated Data
This section collects any data citations, data availability statements, or supplementary materials included in this article.