

Abstract
The metabolon hypothesis predicts that cytosolic carbonic anhydrase (CA) binds to NBCe1-A, promotes replenishment/consumption, and enhances transport. Using a short step-duration current-voltage (I–V) protocol with Xenopus oocytes expressing eGFP-tagged NBCe1-A, our group reported that neither injecting human CA II (hCA II) nor fusing hCA II to the NBCe1-A carboxy-terminus affects background-subtracted NBCe1 slope conductance (GNBC), which is a direct measure of NBCe1-A activity. Others—using bovine CA (bCA), untagged NBCe1-A, and protocols keeping holding potential (Vh) far from NBCe1-A’s reversal potential (Erev) for prolonged periods—found that bCA increases total membrane current (ΔIm), which apparently supports the metabolon hypothesis. We systematically investigated differences in the two protocols. In oocytes expressing untagged NBCe1-A, injected with bCA, and clamped to –40 mV, CO2/ exposures markedly decrease Erev, producing large transient outward currents persisting for >10 min and rapid increases in [Na+]i. Although the CA inhibitor ethoxzolamide (EZA) reduces both ΔIm and d[Na+]i/dt, it does not reduce GNBC. In oocytes not expressing NBCe1-A, CO2/ triggers rapid increases in [Na+]i that both hCA II and bCA enhance in concentration-dependent manners. These d[Na+]i/dt increases are inhibited by EZA and blocked by EIPA, a Na-H exchanger (NHE) inhibitor. In oocytes expressing untagged NBCe1-A and injected with bCA, EIPA abolishes the EZA-dependent decreases in ΔIm and d[Na+]i/dt. Thus, CAs/EZA produce their ΔIm and d[Na+]i/dt effects not through NBCe1-A, but endogenous NHEs. Theoretical considerations argue against a CA stimulation of transport, supporting the conclusion that an NBCe1-A– metabolon does not exist in oocytes.
Keywords: bicarbonate, carbonic anhydrase, metabolon, NHE, SLC4A4, NBCe1-A.
Introduction
The electrogenic Na+/ cotransporter NBCe1 (Boron & Boulpaep, 1983a; Romero et al., 1997), or SLC4A4, is widely expressed throughout the body, where it regulates intracellular pH (pHi) and blood pH, and supports transepithelial anion and fluid movement (Park et al., 2002; Skelton et al., 2010). NBCe1-A predominantly resides in the basolateral membrane of the renal proximal tubule (PT), where its major function is in the reabsorption of and the creation of new (Boron & Boulpaep, 1983a; Schmitt et al., 1999; Skelton et al., 2010). In the case of the human NBCe1 gene (Burnham et al., 1997), mutations can have devastating effects, including severe proximal renal tubular acidosis, eye defects, cognitive impairment, short stature, and migraine (Igarashi et al., 1999, 2001, 2002; Romero et al., 2004 p.200; Inatomi et al., 2004; Dinour et al., 2004; Horita et al., 2005; Demirci et al., 2006; Suzuki et al., 2008, 2010) and decreased SLC4A4 mRNA may be a leading predictor of suicidal ideation (Kim et al., 2007; Perlis et al., 2010; Niculescu et al., 2015).
The α-carbonic anhydrase II (CA II) is nearly ubiquitously expressed throughout the nephron and accounts for the vast majority of carbonic anhydrase (CA) activity in the kidney (Purkerson & Schwartz, 2007). In the PT cytoplasm, CA II contributes to reabsorption and creation of new by catalyzing the hydration of CO2 to form: (a) H+, which is secreted across the apical membrane into the tubule lumen via Na-H exchangers (Wang et al., 1999; Vallon et al., 2000), and (b) , which is exported across the basolateral membrane into the interstitial space via NBCe1-A (Boron & Boulpaep, 1983a). To mediate the net efflux of , NBCe1-A transports Na+ and with an apparent stoichiometry of 1:3 (Soleimani et al., 1987). However, in many other systems—including heterologous expression in Xenopus oocytes—NBCe1-A mediates net influx and operates with a 1:2 stoichiometry (Heyer et al., 1999; Sciortino & Romero, 1999).
It has been suggested that the positively charged amino terminus (Nt) of CA II can bind to the negatively charged ‘LDADD’ motif on the cytoplasmic carboxy terminus (Ct) of AE1, SLC4A1 (Vince & Reithmeier, 1998, 2000; Vince et al., 2000). The resulting transport “metabolon” would directly enhance transporter activity by increasing [] at the intracellular surface of the membrane ([]is) during efflux, and by decreasing []is during influx. Moreover, on the basis of indirect assessments of transporter activity (i.e., rates of pHi change), it was reported that blocking CA II does indeed reduce anion exchanger 1 (AE1) activity by ~70% (Sterling et al., 2001). Piermarini et al. (2007) could reproduce the binding of the soluble glutathione S-transferase-AE1-Ct (GST-AE1-Ct) fusion protein to immobilized CA II, but could detect no binding when the GST-AE1-Ct was immobilized or when the GST was omitted. They made similar observations with Ct constructs of NBCe1-A and the Na+-driven Cl-HCO3 exchanger NDCBE, SLC4A8. Moreover, when Lu et al. directly measured human NBCe1-A activity by two-electrode voltage clamp (TEVC) in Xenopus oocytes, using 60-ms voltage steps, they detected no effect of CA II on NBCe1-A-dependent slope conductance (GNBC), whether recombinant CA II was injected into the oocyte or CA II was fused to the Ct of the NBCe1-A (Lu et al., 2006). More recently, Al-Samir et al. (2013) were neither able to measure Förster resonance energy transfer (FRET) between fluorescently-tagged AE1 and CA II expressed in tsA201 cells, nor co-immunoprecipitate exogenous or endogenous CA II with a N-terminally FLAG-tagged AE1. To summarize, the above papers concluded that CA II neither directly binds to the Ct of SLC4 proteins, nor enhances transport by NBCe1-A.
A paper from another research group also examined the metabolon hypothesis in oocytes expressing NBCe1-A (Becker & Deitmer, 2007). One approach was to voltage clamp (Vclamp) the cell membrane potential (Vm) to −40 mV for many minutes while applying extracellular CO2/, and monitoring the peak change in -induced total membrane current (ΔIm). They reported that blocking CA II reduces ΔIm by ~36%. They also obtained current-voltage (I–V) relationships using 10-s voltage steps in the presence of CO2/, reporting that CA II blockade reduces total membrane slope conductance (Gm) by ~10% (Becker & Deitmer, 2007). Moreover, they observed that CA II blockade reduces the maximum rate of change of [Na+]i ((d[Na+]i/dt)max), attributed to NBCe1-A. They then extended their work to CA I and CA III, measuring ΔIm and d[Na+]i/dt)max as indices of NBCe1-A activity (Schueler et al., 2011). The authors concluded that the modest CA II-dependent increases in ΔIm and Gm are due to stimulation of NBCe1-A by CA II in a metabolon effect, prompting us to re-examine our group’s electrophysiological approach used in Lu et al.(2006).
We hypothesize that the long voltage steps in the Becker & Deitmer (2007) protocol, which held Vm far from the reversal potential (Erev) for NBCe1-A for long periods, generated large spatial gradients for Na+, -related species (e.g. ), and pHi (Becker & Deitmer, 2007). We reason that, under such conditions, CA II in the bulk cytoplasm—though not CA II in the immediate vicinity of the plasma membrane—could help dissipate long-distance gradients for -related species and pHi, perhaps enough to enhance NBCe1-A activity. If this hypothesis is true, then we predict that CA II fused to the Ct of NBCe1-A should have little effect on NBCe1-A currents. On the other hand, injecting into the cytoplasm either recombinant human CA II (hCA II) or purified bovine erythrocyte CA (bCA) should increase GNBC, the effect being greater the more we increase the duration of the voltage steps beyond the 60 ms employed in Lu et al., (2006).
In fact, in the present study we find that CA, whether tethered or injected, has no significant effect on GNBC in I–V protocols with voltage-step durations of 60 ms to 30 s. However, compared to the Becker & Deitmer (2007) experiments, ours have substantially larger NBCe1-A currents, more CA II, and minimal time in clamp. In the process of attempting to replicate the conditions of the other group, we unexpectedly found that CA II stimulates a native Na-H exchanger (Burckhardt et al., 1992)—and thereby increases (d[Na+]i/dt)max—but has no effect on the activity of heterologous NBCe1-A. The present study therefore confirms our previous findings that the catalytic activity of CA does not enhance the function of NBCe1-A, whether it is in the immediate vicinity of the transporter or in the bulk cytoplasm of the oocyte (Lu et al., 2006). Furthermore, we highlight the existence of possible functional partnership between exogenous CA and the Xenopus oocyte Na-H exchanger.
Methods
Ethical approval and animal procedures
The protocols for housing and handling of Xenopus laevis were approved by the Institutional Animal Care and Use Committee at Case Western Reserve University (approval number 2013–0154). To minimize stress, we housed a maximum of six frogs per static aquarium tank (20-gallon) The dechlorinated water was circulated within the tank through a charcoal Bio-Bag aquarium power pump (Tetra, Blacksburg, VA). The water in the tank was partially changed out as needed, and every 90 days the frogs were moved into a freshly cleaned tank, half-filled with water from the previous tank and half-filled with new de-chlorinated water. Each tank was supplied with a PVC elbow pipe as environmental enrichment. The frogs were fed 3 times per week with adult Xenopus diet (Zeigler Bros. Inc., Gardners, PA). The food was sprinkled (10 pellets/frog) into the tank and the Xenopus were allowed to feed. Excess food was removed after a few hours with a net.
Xenopus were anesthetized by immersion in a solution of 0.2% Tricaine. When the animal became unresponsive to touch, it was removed from the solution and the ovaries were surgically extracted. The animal was killed prior to recovery from anesthesia by cardiac excision. Some experiments in this study were performed using oocytes isolated from pre-extracted Xenopus ovaries (NASCO Inc., Fort Atkinson, WI, USA).
Xenopus oocyte expression clones and cRNA synthesis
Construction of the cDNAs encoding e1, eGFP-e1 and eGFP-e1-CAII was previously described (Choi et al., 1999; Lu et al., 2006). The open reading frames for the constructs were subcloned into the pGH19 vector (Trudeau et al., 1995) flanked by the 5′- and 3′-UTR of the Xenopus β-globin gene (Toye et al., 2006). Capped mRNA was synthesized in vitro with the T7 message Machine kit (Ambion, Austin, TX) from cDNA linearized at the Not I restriction site. The cRNA was purified using the QIAquick PCR purification kit (Qiagen, Valencia, CA, USA), and the concentration was determined by ultraviolet absorbance. The activity of eGFP-e1 when expressed in Xenopus oocytes was previously determined to be not significantly different from e1 (Lu et al., 2006; Chen et al., 2011, 2012).
Expression and purification of recombinant human CA II protein
hCA II used in this study was expressed and purified as previously described (Lu et al., 2006; Piermarini et al., 2007). The pET31F1 vector containing the open reading frame for hCA II (generously provided by Dr. David N. Silverman, Dept. Pharmacology and Biochemistry, University of Florida) was transformed into BL21 Star (DE3) E. coli (Invitrogen, Carlsbad, CA), expressed as previously described (Tanhauser et al., 1992) and purified by affinity chromatography (Whitney, 1974) using a p-aminomethylbenzenesulfonamide-linked agarose resin (Sigma, St. Louis, MO). hCA II was eluted from the resin with 0.1 M Tris/0.4 M NaN3/pH 6.8 and collected in 0.5-ml fractions. Fractions that exhibited ultraviolet absorbance > 0.1 at the 280 nm wavelength were pooled and injected into a 10-kDa molecular weight cut-off Slide-A-Lyzer cassette (Pierce, Rockford, IL) to dialyze out NaN3. Dialysis was performed overnight at 4 °C against 50 mM Tris (pH 8). The sample was then spin purified and concentrated in a 10-kDa molecular weight cut-off centrifuge filtration device (Millipore, Billerica, MA) for 10 min at 4000 × g. The purity of the concentrated hCA II was assessed by SDS-PAGE electrophoresis and Coomassie staining (Elder et al., 2004). 50 ng to 2.5 μg of total protein was loaded per lane and only a single 29-kDa band corresponding to hCA II could be detected in all lanes. The hCA II concentration was determined by ultraviolet absorbance at 280 nm, assuming a molar absorptivity of 5.5 × 10⁴ M−1 cm−1 (Elder et al., 2004).
Injection of Xenopus oocytes with cRNA or hCA II protein
Stage V-VI oocytes from Xenopus laevis were isolated as described previously (Parker et al., 2012). The next day, oocytes were injected with 9.2 nl of cRNA encoding e1, eGFP-e1 or eGFP-e1-CAII or 9.2 nl of deionized water (Ambion) as a control. For the experiments described in Fig. 1, 2, 3, 4, 5, 6, 7, 8, Fig. 9, 10, 11, 12,13, and Fig. 17 we injected 1.5 ng of cRNA/oocyte. For the experiments described by Fig. 7 and Fig. 8 we injected 150 pg cRNA/oocyte. Expression of eGFP-tagged NBCe1-A constructs in oocytes was confirmed three days after cRNA injection by detecting eGFP fluorescence as previously described (Musa-Aziz et al., 2010) on a Typhoon Trio+ Variable Mode Imager (GE Healthcare, Piscataway, NJ). Three days after cRNA injection, we injected oocytes 50 mM Tris (pH 8) buffer or the same volume of recombinant hCA II dissolved in the same buffer. The injection volume for the purified hCA II or Tris buffer controls was 46 nl for all experiments. In experiments in which the data were compared to previously published results from our laboratory (Lu et al., 2006), we injected 300 ng hCA II per oocyte. This resulted in a final hCA II concentration of ~24 μM in the oocyte, which is approximately 20% greater than in a red blood cell (assuming the water content of an oocyte is 37%; see Horowitz & Fenichel (1970)). 50 ng hCA II per oocyte was injected in experiments in which the data were compared to published results from Becker & Deitmer (2007) and Schueler et al (2011), which based their protocol on an earlier paper from our group, in which the Xenopus oocytes did not express SLC4 transporters (Nakhoul et al., 1998). Sterile pipettes used for injecting water, cRNA, or purified hCA II had tip diameters of 20–30 μm, and were backfilled with paraffin oil and connected to a Nanoject II positive-displacement injector (Drummond Scientific, Broomall, PA).
Figure 1: Functional expression of wild-type and tagged NBCe1-A constructs does not differ.

A, INBC–Vm relationships acquired from oocytes expressing e1, eGFP-e1, or eGFP-e1-CAII (injected with cRNA 4 days before recording). With the oocyte first exposed to ND96, we voltage-clamp to Vh = spontaneous Vm, and then step to Vm = −160 mV for 60 ms, return to Vh for 60 ms, step to Vm = –140 mV, return to Vh, and so on, increasing Vm during the step by 20 mV with each cycle, peaking at step to +20 mV (see inset to panel A for a depiction of the protocol waveform). After turning off the clamp, we switch to 5% CO2/33 mM and, within 6 s, Vm reaches a nadir between −120 mV and −140 mV. At this point, we voltage clamp to Vh ≅ Erev and then repeat the I–V protocol. For each oocyte, INBC vs. Vm is the difference I vs. Vm in CO2/ and I vs. Vm in ND96. The main plot shows mean INBC (± SD) vs. Vm for 36 oocytes expressing each of the three NBCe1 constructs. The fitted slopes represent their mean NBCe1-A-dependent slope conductance, GNBC. B, Representative western blot of biotinylated (surface) protein (equivalent to 0.7 oocytes per lane) from the same oocytes from which we previously acquired the INBC–Vm relationships, with no-biotin control samples on the same blot (left panel). The right panel displays a representative western blot of the total protein expression (equivalent to 0.24 oocytes per lane). C, Surface expression, quantified by densitometry and normalized to the values for oocytes injected in parallel with e1. Legend for column color applies to panels C–D. D, Total protein expression, quantified by densitometry and normalized to the values for e1 expressing oocytes. E, Surface expression for each group of 12 oocytes analyzed in panel C, normalized to the mean slope conductance. We assess statistical significance for panels C–E by unpaired-samples t-tests with Welch’s correction and the Holm-Bonferroni (Holm, 1979) method (α = 0.05). Number of comparisons for each test group is m = 3. Statistics Table 1 reports the unadjusted p-values and corrected α values for all analyses in Fig. 1. The numbers in parentheses at the bottom of each bar in panels C–E indicate the number of groups of 12 oocytes analyzed for each type of cRNA injected. The bars in panels C–D report mean ± SD, with each data point used to calculate the mean represented by open square symbols. Vh, holding potential.
Figure 2: Tethering hCA II to the Ct of NBCe1-A does not increase GNBC.

A, Im–Vm relationships acquired in ND96 and 5% CO2/33 mM from oocytes expressing eGFP-e1-CAII (injected with cRNA 4 days before recording). We first obtain I–V relationships in ND96 and 5% CO2/33 mM . We use the I–V protocol described in the Fig. 1 legend, except that the duration of Vm steps and return to Vh was 1 s in the middle panel, and 30 s in the right panel. Regardless of step duration, we incubate oocytes for 3 h in 400 μM EZA to inhibit CA II activity, and then repeat the I–V protocols. Data for each of the three step-duration protocols come from separate groups of oocytes. Im values are mean ± SD. B, Bars represent the mean GNBC (± SD) values derived from I–V relationships like those in panel A with each data point used to calculate the mean represented by open symbols. Unpaired-samples t-tests with Welch’s correction generate unadjusted p-values for comparisons of I–V step duration for Pre-EZA data (black bars). Paired-samples t-tests generate unadjusted p-values for comparisons of Pre-EZA (black bars) vs. post-EZA (gray bars). For both the unpaired and paired analyses, we used the Holm-Bonferroni method (α = 0.05, m = 3) to judge significance. For analysis of pre-EZA data, † denotes significance vs. 60-ms protocol, and ‡ denotes significance vs. 1-s protocol. Analyses of pre- vs. post-EZA data reveal no differences. C, CO2-induced acidification in a representative oocyte expressing eGFP-e1-CAII, pre- (black trace) and post-inhibition (gray trace) with 400 μM EZA. D, Comparison of maximal rates of CO2-induced acidification from cells expressing eGFP-e1 (white bar) or expressing eGFP-e1-CAII, pre- (black bar) and post-400 μM EZA (gray bar). An unpaired-samples t-test with Welch’s correction generates unadjusted p-values to assess differences between eGFP-e1 versus eGFP-e1-CAII († denotes significance). A paired-samples t-test generates unadjusted p-values to assess pre- vs. post EZA (* denotes significance). α = 0.05 is not adjusted because we perform a single unpaired or paired test. Statistics Table 2 reports unadjusted p-values and α values for panels B and D. The numbers in parentheses in panels B–D indicate the number of oocytes for each group. Bars represent the mean ± SD in panels B and D with each data point used to calculate the mean represented by open symbols.
Figure 3: hCA II injected into the oocyte does not increase GNBC.

A, Im–Vm relationships from oocytes injected 4 days before recording with 1.5 ng cRNA encoding eGFP-e1 and then injected again 1 day before recording with 50 mM Tris (Top) or 300 ng recombinant hCA II (Bottom). I–V relationships are acquired as described in Fig. 2A, using a separate group of oocytes for each of the three step duration protocols (60 ms, left; 1 s, center; or 30 s, right). Im values are mean ± SD. B, Mean GNBC values (± SD) derived from Im–Vm relationships like those in panel A, before and after the oocytes were incubated for 3 h in 400 μM EZA to inhibit the activity of the injected hCA II. Unpaired-samples t-tests with Welch’s correction generate unadjusted p-values for comparisons of I–V step duration for Pre-EZA data (black bars). Because not all oocytes survived the 3-h EZA incubations, we also used unpaired-samples (rather than paired-samples) t-tests for comparisons of Pre-EZA (black bars) vs. post-EZA (gray bars). The Holm-Bonferroni method (α = 0.05, m = 3) was used to judge significance. For analysis of pre-EZA data, † denotes significance vs. 60-ms protocol, and ‡ denotes significance vs. 1-s protocol. Analyses of pre- vs. post-EZA data reveal no differences. C, CO2-induced acidification of a representative oocyte expressing eGFP-e1 and injected 24 h earlier with 300 ng hCA II. The black pre-EZA and the gray post-3h EZA record are obtained from the same oocyte. D, Comparison of the mean maximal rates of CO2-induced acidification (± SD) from cells expressing eGFP-e1 and injected with 50 mM Tris (white bar), or expressing eGFP-e1 but injected with 300 ng recombinant hCA II, pre- (black bar) and post-400 μM EZA (gray bar). An unpaired-samples t-test with Welch’s correction generates unadjusted p-values to assess differences between eGFP-e1+Tris vs. eGFP-e1+hCAII injected oocytes († denotes significance). A paired-samples t-test generates unadjusted p-values to assesses pre- vs. post EZA incubation (* denotes significance). α = 0.05 is not adjusted because we perform a single unpaired or paired test. For panels B and D, unadjusted p-values and α values are presented in Statistics Table 3. The numbers in at the bottom of each bar in panels B & D indicate the number of oocytes for each group with each data point used to calculate the mean represented by open symbols.
Figure 4: hCA II injected into the oocyte does not increase the HCO3−-dependent rate of pHi increase, even when NBCe1-A operates at high rates for long periods.

A, Representative recordings of pHi, Vm, and Im from oocytes injected 4 days before recording with 1.5 ng cRNA encoding eGFP-e1 and then injected again 1 day before recording with 50 mM Tris or B, 300 ng recombinant hCA II. Switching from ND96 to 5% CO2/33 mM solution (gray shading and “CO2/” label) initiates a CO2-induced acidification. Once pHi reaches its acidic nadir, we voltage-clamp oocyte Vm at −120 mV then switch to 0 mV to promote high NBCe1-A activity. The symbol key above panels C–H is applicable to each of these panels. C, Mean (±SD) values derived from maximal rates of CO2-induced acidification. D, Using the I–V protocol depicted in the inset, we record INBC–Vm relationship at the Vm nadir (IV#1 in panels A & B). E, INBC–Vm relationship at the pHi nadir (IV#2 in panels A & B). F, changes in Im at the instant of the switch of Vh to 0 mV. G, INBC–Vm relationship the switch of Vh to 0 mV. (IV#3 in panels A & B). H, maximal rates of alkalinization, from experiments like those in panels A & B. The numbers in parentheses at the bottom of each bar in panels C, F and H indicate the number of oocytes tested for each group with each data point used to calculate the mean represented by symbols (see key at top of the figure). For panels C, F and H, unpaired-samples t-tests with Welch’s correction generate unadjusted p-values for comparisons of Tris vs. hCA II. The Holm-Bonferroni method determines significance (α = 0.05, m = 2, † denotes significance).
For panel D, E and G, unadjusted p-values from comparisons of mean GNBC from eGFP-e1+Tris vs. eGFP-e1+hCA II oocytes recorded by IV#1, IV#2 or IV#3 are all > 0.05 and therefore not significant whether α is naive, or adjusted for three tests of the null hypothesis (one for each I–V; m=3). Statistics Table 4 reports the unadjusted p-values and corrected α values. Values are mean ± SD in panels F–H.
Figure 5: Tethering hCA II to the Ct of NBCe1-A does not increase GNBC in a B&D-like protocol.

A, Representative recordings of pHi, Vm, and Im from oocytes injected 4 days before recording with 1.5 ng cRNA encoding eGFP-e1 or B, 1.5 ng cRNA encoding the eGFP-e1-CAII fusion protein (described in Fig. 2A; Lu et al., 2006). Vh is set at −40 mV in ND96 and the oocyte remains in voltage-clamp during all bath solution switches for the entire protocol. Periods during which the oocyte is perfused with ND96 are not shaded or labeled. Periods during which the oocyte is perfused with 5% CO2/33 mM buffer are shaded gray and labeled “CO2/ ”. 10 µM EZA in ND96 is perfused for 10 min before a second exposure to 5% CO2/33 mM (plus 10 µM EZA). This period is labeled “10 μM EZA” and shaded cyan. I–V relationships are acquired by stepping Vh in 20 mV increments from −120 mV to +20 mV for 10 s each. The double-staircase Vh step sequence deduced from B&D is −40, −60, −80, −100, −120, −20, 0, and then 20 mV without an inter-step period when Vh is returned to −40 mV and can be seen in the Vm traces in panels A & B. A magnified example of the Vh command during the I–V acquisitions is also displayed as an inset to panel G. C, Mean initial pHi values at points a1 (Pre-EZA) and a2 (+10 μM EZA) are reported for either eGFP-e1 or eGFP-e1-CAII oocytes. D, 10 µM EZA inhibits the CA II-catalyzed rate of CO2-induced acidification for the eGFP-e1-CAII fusion protein but not eGFP-e1 expressing oocytes. E, We observe no significant changes in ΔIm or GNBC following inhibition of the CA II fused to NBCe1-A (E–H). Paired t-tests are performed to compare the difference between a1 vs. a2, or Pre EZA vs. +10 µM EZA on the same groups of oocytes in panel C–E and H (significance denoted by *). Unpaired t-tests with Welch’s correction compare eGFP-e1 vs. eGFP-e1-CAII at points a1 or a2 (for Panel C), or during Pre EZA or +10 µM EZA periods in panels D, E and H (significance denoted by †). The Holm-Bonferroni method determines significance for panels C–E (α = 0.05, m=2). For panel H, unadjusted p-values are all > 0.05, so differences in the mean GNBC are not significant even if α is naïve or adjusted for four tests of the null hypothesis (m = 4). Statistics Table 5C-E & 5H presents the unadjusted p-values and adjusted α values. The numbers in parentheses in panels C–E and H indicate the number of oocytes for each group with the individual data points used to calculate each mean overlaid as symbols on the bars. Values are mean ± SD in panels C–H.
Figure 6: hCA II injected into NBCe1-A expressing oocytes does not increase GNBC when data is acquired using a reference B&D-like protocol.

Representative recordings from oocytes injected 4 days prior to recording with 1.5 ng/oocyte cRNA for eGFP-e1. 1 day before recording, half of the eGFP-e1 expressing oocytes are injected with A, Tris buffer and the other half injected with B, 50 ng hCA II dissolved in Tris. Experiments were performed as in Fig. 5. C, Mean pHi values at points a1 (pre-EZA) and a2 (10 μM EZA) are not significantly different but D, 10 µM EZA inhibited the hCA II-catalyzed rate of CO2-induced acidification. However, as is observed for CA II tethered to the NBCe1-A Ct in Fig. 5, we do not observe concomitant changes in E, ΔIm and H, GNBC. Panels F and G present mean INBC–Vm relationships used to calculate GNBC data in panel H. Statistical significance is determined as described for Fig. 5 and Statistics Table 6C–H reports unadjusted p-values and adjusted α values. The numbers in parentheses in panels C–E and H indicate the number of oocytes for each group with the individual data points used to calculate each mean overlaid as symbols on the bars. Values are mean ± SD in panels C–H.
Figure 7: Are CA II-dependent changes seen when NBCe1-A is expressed at low levels?

0.15 ng/oocyte of injected eGFP-e1 cRNA yields NBCe1-A currents of equivalent magnitude to B&D, although this ~100 fold less cRNA mass injected per oocyte than in that study. 24 h prior to recording, we inject eGFP-e1 expressing oocytes with either A, 50 nl Tris buffer or B, 50 ng hCA II dissolved in 50 nl Tris buffer. We clamp Vh at –40 mV and expose oocytes to three periods in 5% CO2/33 mM buffer (gray shading and “CO2/” label). Prior to the 3rd CO2/ delivery, the oocyte is perfused for 10 min with 10 μM EZA to inhibit hCA II activity (EZA perfusion periods denoted with “10 μM EZA” label and shaded cyan). We record I–V relationships when the pHi reaches its acidified nadir during each CO2/ delivery (IV#1, IV#2, and IVEZA), each voltage step being 20 mV and 10 s duration according to the B&D protocol. The difference between the maximal pHi after CO2 removal and the initial pHi (b1 – a1) is minimized by a CO2/ pre-pulse so that the comparable difference for the second CO2/ pulse (b2 – a2) is substantially smaller than the first. Note that mean initial pHi values corresponding to a1 and a2 for eGFP-e1+ Tris oocytes and eGFP-e1+ hCAII oocytes are substantially different (> 0.1 pH units) and in the case of eGFP-e1+ hCAII the difference is significant. C, Mean initial pHi values for a2 and a3 (in 10 μM EZA) are not substantially or significantly different for either eGFP-e1+Tris oocytes or eGFP-e1+ hCAII oocytes. D, (dpHi/dt)max is significantly faster in hCA II injected vs. Tris injected oocytes and the activity of the injected hCA II significantly inhibited by EZA. E, The mean initial [Na+]i before each CO2/ exposure. For both eGFP-e1+ Tris oocytes and eGFP-e1+hCAII oocytes, the differences between initial [Na+]i at a1 vs. a2 are significant, but at a2 vs. a3 are smaller and not significant. There are no significant differences in mean initial [Na+]i when comparing points a1, a2 or a3 between eGFP-e1+ Tris oocytes vs. eGFP-e1+hCAII oocytes. F, We record no significant hCA II-mediated differences in d[Na+]i/dt, or G, ΔIm. In panels C–G, * denotes the measured mean is significantly different from a2 or period #2, determined by a paired t-test with the Holm-Bonferroni method applied (α = 0.05, m = 2). † indicates that the measured a2 or period #2 means are significantly different between eGFP-e1+Tris oocytes and eGFP-e1+ hCAII oocytes, as determined by an unpaired t-test with Welch’s correction. α = 0.05 is not adjusted because we perform one unpaired t-test to evaluate the null hypothesis in each case. Statistics Table 7C–I presents the unadjusted p-values and adjusted or unadjusted α values. The numbers in parentheses in panels C–G indicate the number of oocytes for each group with the individual data points used to calculate each mean overlaid as symbols on the bars. Values are mean ± SD in panels C–G.
Figure 8: Are CA II-dependent changes in Gm or GNBC seen when NBCe1-A is expressed at low levels?

Mean (±SD) Im–Vm relationships from eGFP-e1 expressing oocytes injected with either A, 50 nl Tris buffer or B, 50 ng hCA II dissolved in 50 nl Tris buffer, acquired in 10 s steps from the IV#1 (at the pHi nadir during the CO2/ pre-pulse), IV#2 (at the pHi nadir during the 2nd CO2/ exposure) and IVEZA (at the pHi nadir during the CO2/ + 10 μM EZA exposure) time-points in Fig. 7. Legend keys in panels A and B indicate the symbols used to plot the data from IV#1, IV#2 and IVEZA (Fig. 7). We calculate C, Gm and D, GNBC from the Im–Vm relationships in panels A & B. We record no significant differences in Gm or GNBC pre- and post-hCA II inhibition by the EZA (C & D). Statistics Table 8C & D presents the unadjusted p-values and adjusted or unadjusted α values for all statistical comparisons. The numbers in parentheses in panels C & D indicate the number of oocytes for each group with the individual data points used to calculate each mean overlaid as symbols on the bars. Bar values represent the mean ± SD.
Figure 9: Does CA purified from bovine erythrocytes and injected into oocytes expressing eGFP-e1 influence function differently from the recombinant hCA II?

eGFP-e1 expressing oocytes are injected with 50 ng bCA and data acquired according to the protocol described in the legend for Fig. 7. A, Representative pHi, [Na+]i, Vm and Im traces from a single oocyte. B, Steady state pHi recovers to a significantly more alkaline pH after a CO2/ pre-pulse (a1 vs. a2) prior to the initiation of the 2nd CO2/ exposure and falls to a significantly more acidic pHi immediately prior to the initiation of the 3rd CO2/ exposure (a3), following 10 min in 10 μM EZA. C, Perfusion with 10 μM EZA also significantly inhibits the activity of the injected bCA as reported by the mean CO2-induced (dpHi/dt)max, but no significant bCA-mediated differences in D, initial [Na+]i, (d[Na+]i/dt)max, E, or F, ΔIm, before each CO2/ exposure are recorded. G, The mean (±SD) Im–Vm relationship from eGFP-e1 expressing oocytes injected with 50 ng bCA. We record no significant differences in H, Gm or I, GNBC pre- and post-bCA inhibition by the EZA. Paired-samples t-tests compare the differences between each successive CO2/ exposure in panels B–F and H and I and the Holm-Bonferroni analyses determine significance (α = 0.05, m = 2). Statistics Table 9B–F and 9H and 9I present the unadjusted p-values and adjusted α’s. The numbers in parentheses in panels B–F and H and I indicate the number of oocytes for each group with the individual data points used to calculate each mean overlaid as symbols on the bars. Values are mean ± SD in panels B–F and H and I.
Figure 10: Are bCA-dependent changes seen when injected in oocytes expressing non eGFP-tagged NBCe1-A?

A, e1 expressing oocytes injected with 23 nl H2O or B, 50 ng bCA dissolved in H2O as described in by B&D are voltage-clamped to Vh = –40 mV and exposed to three periods of 5% CO2/33 mM using the same protocol as in Fig. 7. C, Mean steady-state initial pHi before each of the three periods in CO2/ buffer. In e1+H2O oocytes, initial pHi before the second period in CO2/ buffer (a2) is elevated by ~0.1 pH unit, when compared to the pHi before the first CO2/ exposure (a1), but not significantly so, and the pHi before the final CO2/ exposure in 10 μM EZA (a3) is not significantly different from the pHi before the second CO2/ exposure (a2). In e1+bCA injected oocytes, initial pHi before the second period in CO2/ buffer (a2) is elevated by ~0.3 pH units and the difference is statistically significant (Statistics Table 10C). After the second CO2/ exposure and a 10 min incubation in 10 μM EZA (a3), the pHi in e1+bCA oocytes return to a value 0.16 pH units lower than measured at a2 and 0.1 pH units higher measured at a1. D, 10 μM EZA significantly inhibits the activity of the injected bCA as reported by the mean rate of CO2-induced acidification, which prior to EZA incubation is significantly faster in bCA injected oocytes than H2O injected controls (Statistics Table 10D). E, The initial [Na+]i before each CO2/ exposure reported increases incrementally in e1+H2O oocytes, but none of the increases are significant, nor is the difference in mean initial [Na+]i at time point a2 when comparing e1+H2O with e1+bCA injected oocytes (Statistics Table 10E). The incremental increase in initial steady-state [Na+]i before each CO2/ exposure in e1+bCA oocytes was significant (Statistics Table 10E). F, d[Na+]i/dt in e1+H2O oocytes is significantly slower during the first CO2/ buffer exposure (#1) than the second (#2) or third (EZA) which are almost identical (Statistics Table 10F). bCA injected e1 expressing oocytes exhibit d[Na+]i/dt that is incrementally slower during each CO2/ period, the difference between period #2 and during the EZA incubated CO2/ exposure being significant (Statistics Table 10F). G, Peak ΔIm magnitude does not significantly change for all three periods in CO2/ buffer in e1+H2O oocytes, but a delta ΔIm peak magnitude following 10 min perfusion with 10 μM EZA is significantly less than that the previous #2 CO2/ exposure (Statistics Table 10G). In panels C–G, paired-samples t-tests compare the differences between the means for each parameter measured during each successive CO2/ exposure on either e1+ H2O injected or e1+bCA injected oocytes (significance determined by the Holm-Bonferroni method and indicated by *, α = 0.05, m = 2). Unpaired t-tests with Welch’s correction compare the means for each measured parameter from e1+ H2O vs. e1+bCA oocytes (significance indicated by † symbol, α = 0.05 is not adjusted because we perform one unpaired t-test to evaluate the null hypothesis in each case). The numbers in parentheses in panels C–G indicate the number of oocytes for each group with the individual data points used to calculate each mean overlaid as symbols on the bars. Bar values represent the mean ± SD.
Figure 11: Are bCA-dependent changes in Gm or GNBC seen when injected in oocytes expressing non eGFP-tagged NBCe1-A?

Mean (±SD) Im–Vm relationships from e1 expressing oocytes injected with either A, 23 nl H2O buffer or B, 50 ng bCA dissolved in 23 nl H2O. As in Fig. 8, Im–Vm relationships for e1+H2O and e1+bCA injected oocytes are acquired at 3 time-points; IV#1, IV#2, and IVEZA (see panels Fig. 10A & B). The differences in C, Gm or D, GNBC calculated from IV#1 or IV#2 from e1+H2O vs. e1+bCA oocytes are not significant. The differences pre- and post-EZA incubation from e1+H2O or e1+bCA oocytes (#2 vs. EZA) are also not significant. This indicates that neither the presence of bCA nor inhibition of its activity by EZA directly influences GNBC. Statistics Table 11C & D presents the unadjusted p-values and adjusted or unadjusted α values for all statistical comparisons. The numbers in parentheses in panels C & D indicate the number of oocytes for each group with the individual data points used to calculate each mean overlaid as symbols on the bars. Bar values, represent the mean ± SD.
Figure 12: bCA injected in to the cytoplasm does not enhance NBCe1-A slope conductance (GNBC).
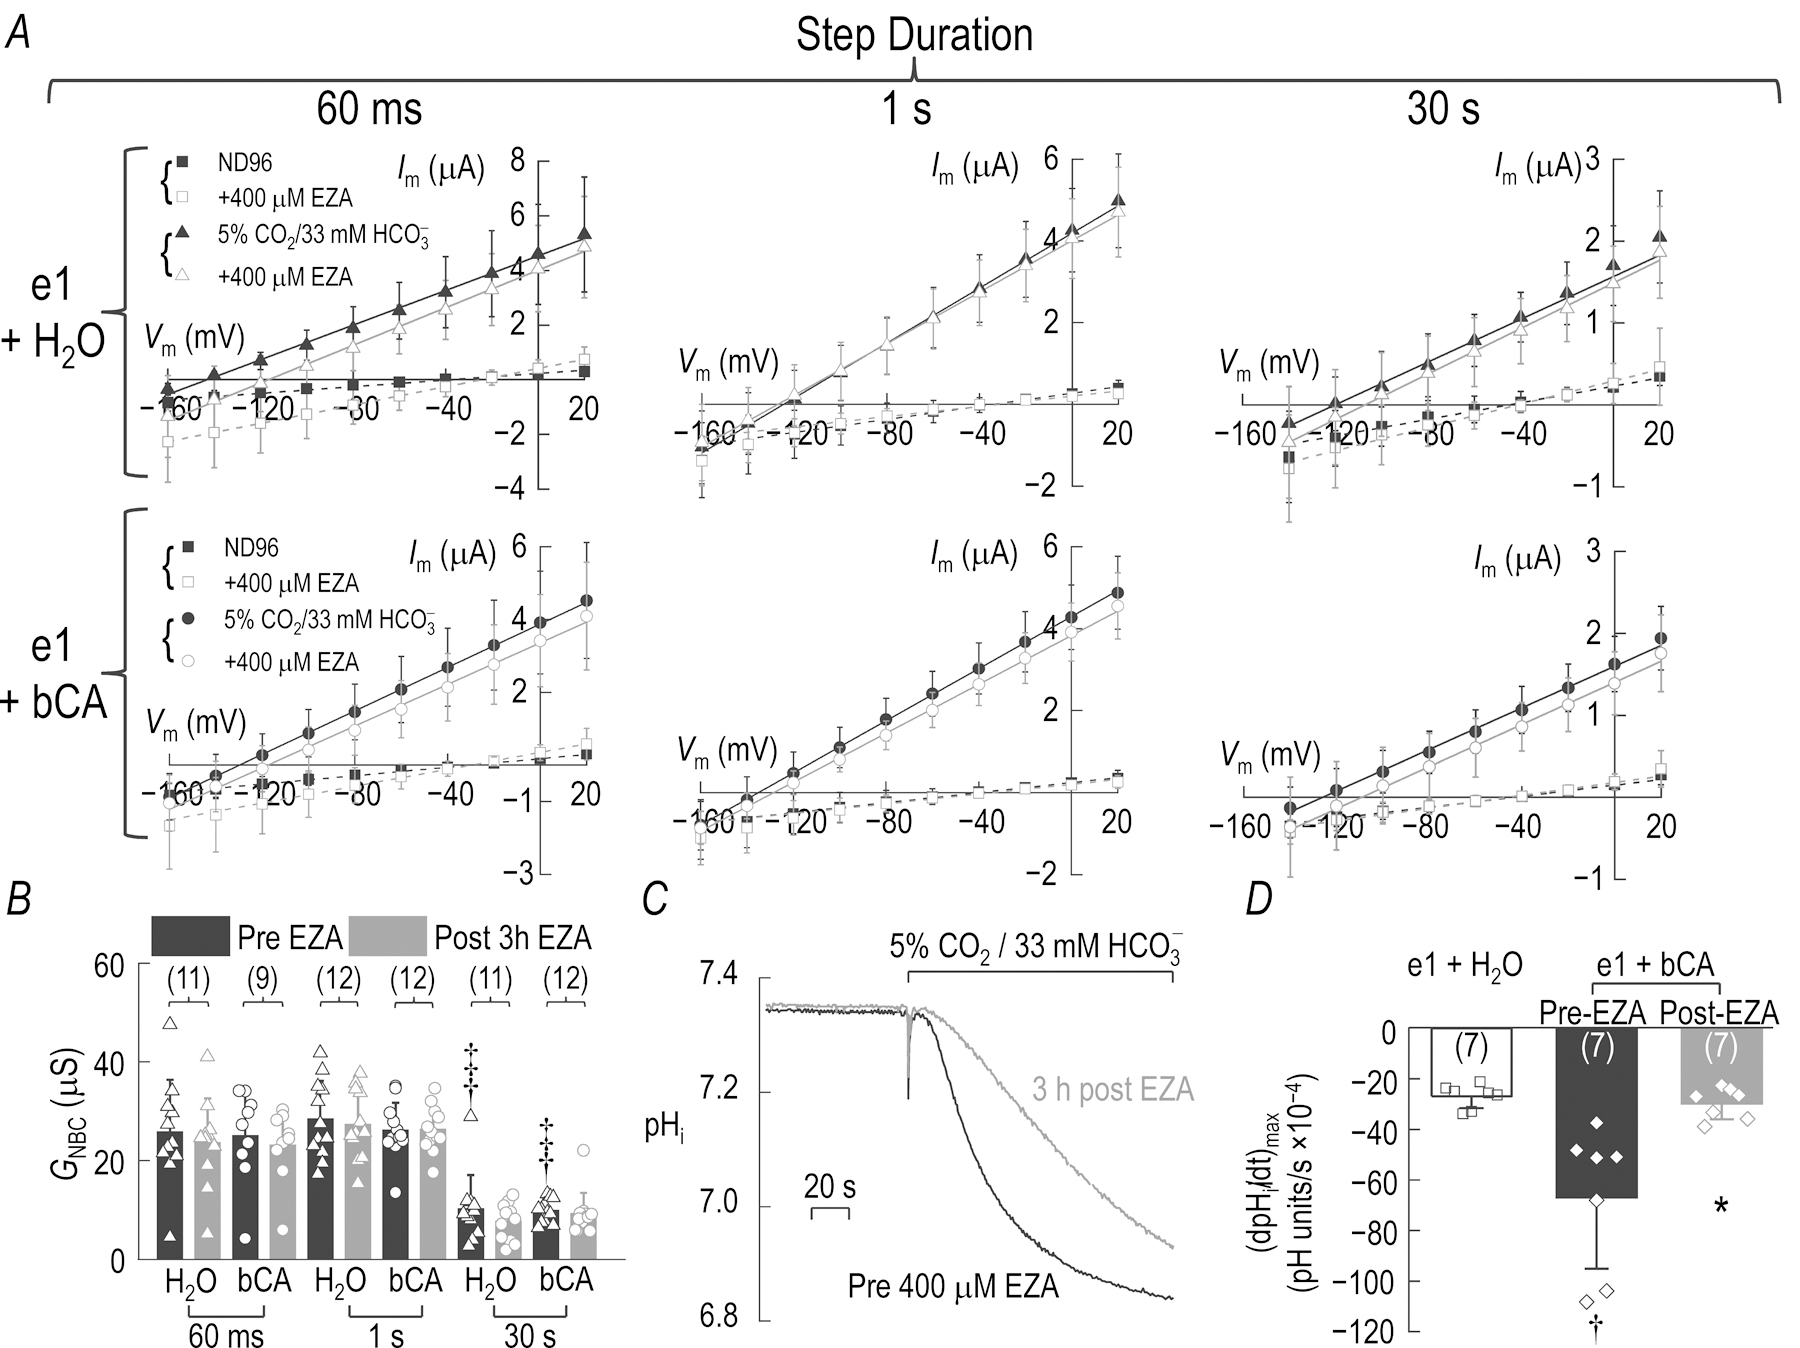
A, Im–Vm relationships from oocytes injected 4 days before recording with 1.5 ng cRNA for e1 and then injected again 1 day before recording with 23 nl H2O (Top) or 50 ng bCA in 23 nl H2O (Bottom). I–V relationships are acquired as described in Fig. 2A, using a separate group of oocytes for each of the three step duration protocols (60 ms, left; 1 s, center; or 30 s, right). B, GNBC calculated from the Im–Vm relationships in panel A, before and after the oocytes are incubated for 3 h in 400 μM EZA to inhibit the activity of the injected bCA. The number of replicates for each group is indicated at the base of each bar. Unpaired-samples t-tests with Welch’s correction are performed to compare the effect of increasing the I–V step duration from 60 ms to 1 s, and 1 s to 30 s († denotes significance vs. 60 ms protocol, ‡ denotes significance vs. 1 s protocol). We perform paired-samples t-tests to compare the differences in GNBC pre- and post-EZA incubation. Although we observe significant differences in GNBC as a factor of I–V protocol step duration, the 3 h EZA incubation did not result in significantly different GNBC in H2O or bCA injected e1 expressing oocytes for any of the I–V step durations employed. The Holm-Bonferroni method is applied to determine significance in all tests (α = 0.05, m=3). Statistics Table 12 reports the unadjusted p-values and corrected α values. C, CO2-induced acidification of a representative oocyte expressing e1 and injected 24 h earlier with 50 ng bCA. We obtain the black pre-EZA and the gray post-3h EZA record from the same oocyte. D, Mean (dpHi/dt)max for oocytes expressing e1 and injected with 23 nl H2O (white bar), or oocytes expressing e1 and injected with 50 ng bCA pre-EZA incubation (black bar) then post-EZA incubation (gray bar). Unpaired-samples t-test with Welch’s correction assess the significance of the differences between e1+H2O versus e1+bCA injected oocytes († denotes significance). A paired-samples t-test assesses the significance of the reduction in (dpHi/dt)max for e1+bCA injected oocytes pre- and post EZA incubation (* denotes significance). α = 0.05 is not adjusted because we perform one unpaired or one paired t-test to evaluate the null hypothesis in each case. Statistics Table 12 reports the unadjusted p-values. The numbers in parentheses in panels B and D indicate the number of oocytes for each group. Values are mean ± SD in panels A, B and D, with the individual data points used to calculate each mean represented by open symbols in panels B and D.
Figure 13: Does the N-terminal eGFP tag inhibit functional upregulation of NBCe1-A by hCA II?

We inject e1 expressing oocytes with 50 ng hCA II and data is acquired according to the protocol described in the legend for Fig. 7 to assess whether in the hCA II preparation can upregulate NBCe1-A function if the transporter lacks the eGFP tag on the N-terminus. A, Representative pHi, Vm, Im, and [Na+]i traces from a single oocyte. B, Steady-state initial pHi at a2 is significantly more alkaline than at a1 and at point a3, following 10 min in 10 μM EZA. C, Perfusion with 10 μM EZA also significantly inhibits the activity of the injected hCA II as reported by the mean rate of CO2-induced acidification (#2 vs. 10 μM EZA), but we record no significant CA-mediated differences in initial D, [Na+]i, E, d[Na+]i/dt, or F, ΔIm. G, I–V relationships (legend key indicates symbols used to plot data from IV#1, IV#2 and IVEZA recorded in each bath solution) determine that H, Gm or I, GNBC are not significantly different pre- and post-hCA II inhibition by the EZA. Paired-samples t-tests compare the differences between each successive CO2/ exposure in panels B–F, H and I. Holm-Bonferroni analyses determine significance (α = 0.05, m = 2). Unadjusted p-values and adjusted α are presented in Statistics Table 13B–F, H and I. * denotes significance compared to point a2 in panels B and D or compared to period #2 in panels C, E–F and H–I. The numbers in parentheses in panels B–F, H and I indicate the number of oocytes for each group. Values are mean ± SD in panels B–I, with the individual points used to calculate each mean shown by each bar in panels B–F and panels H and I represented by open symbols.
Figure 17: Inhibition of the Xenopus oocyte Na-H exchanger (XL-NHE) eliminates bCA dependent changes in NBCe1-A current.
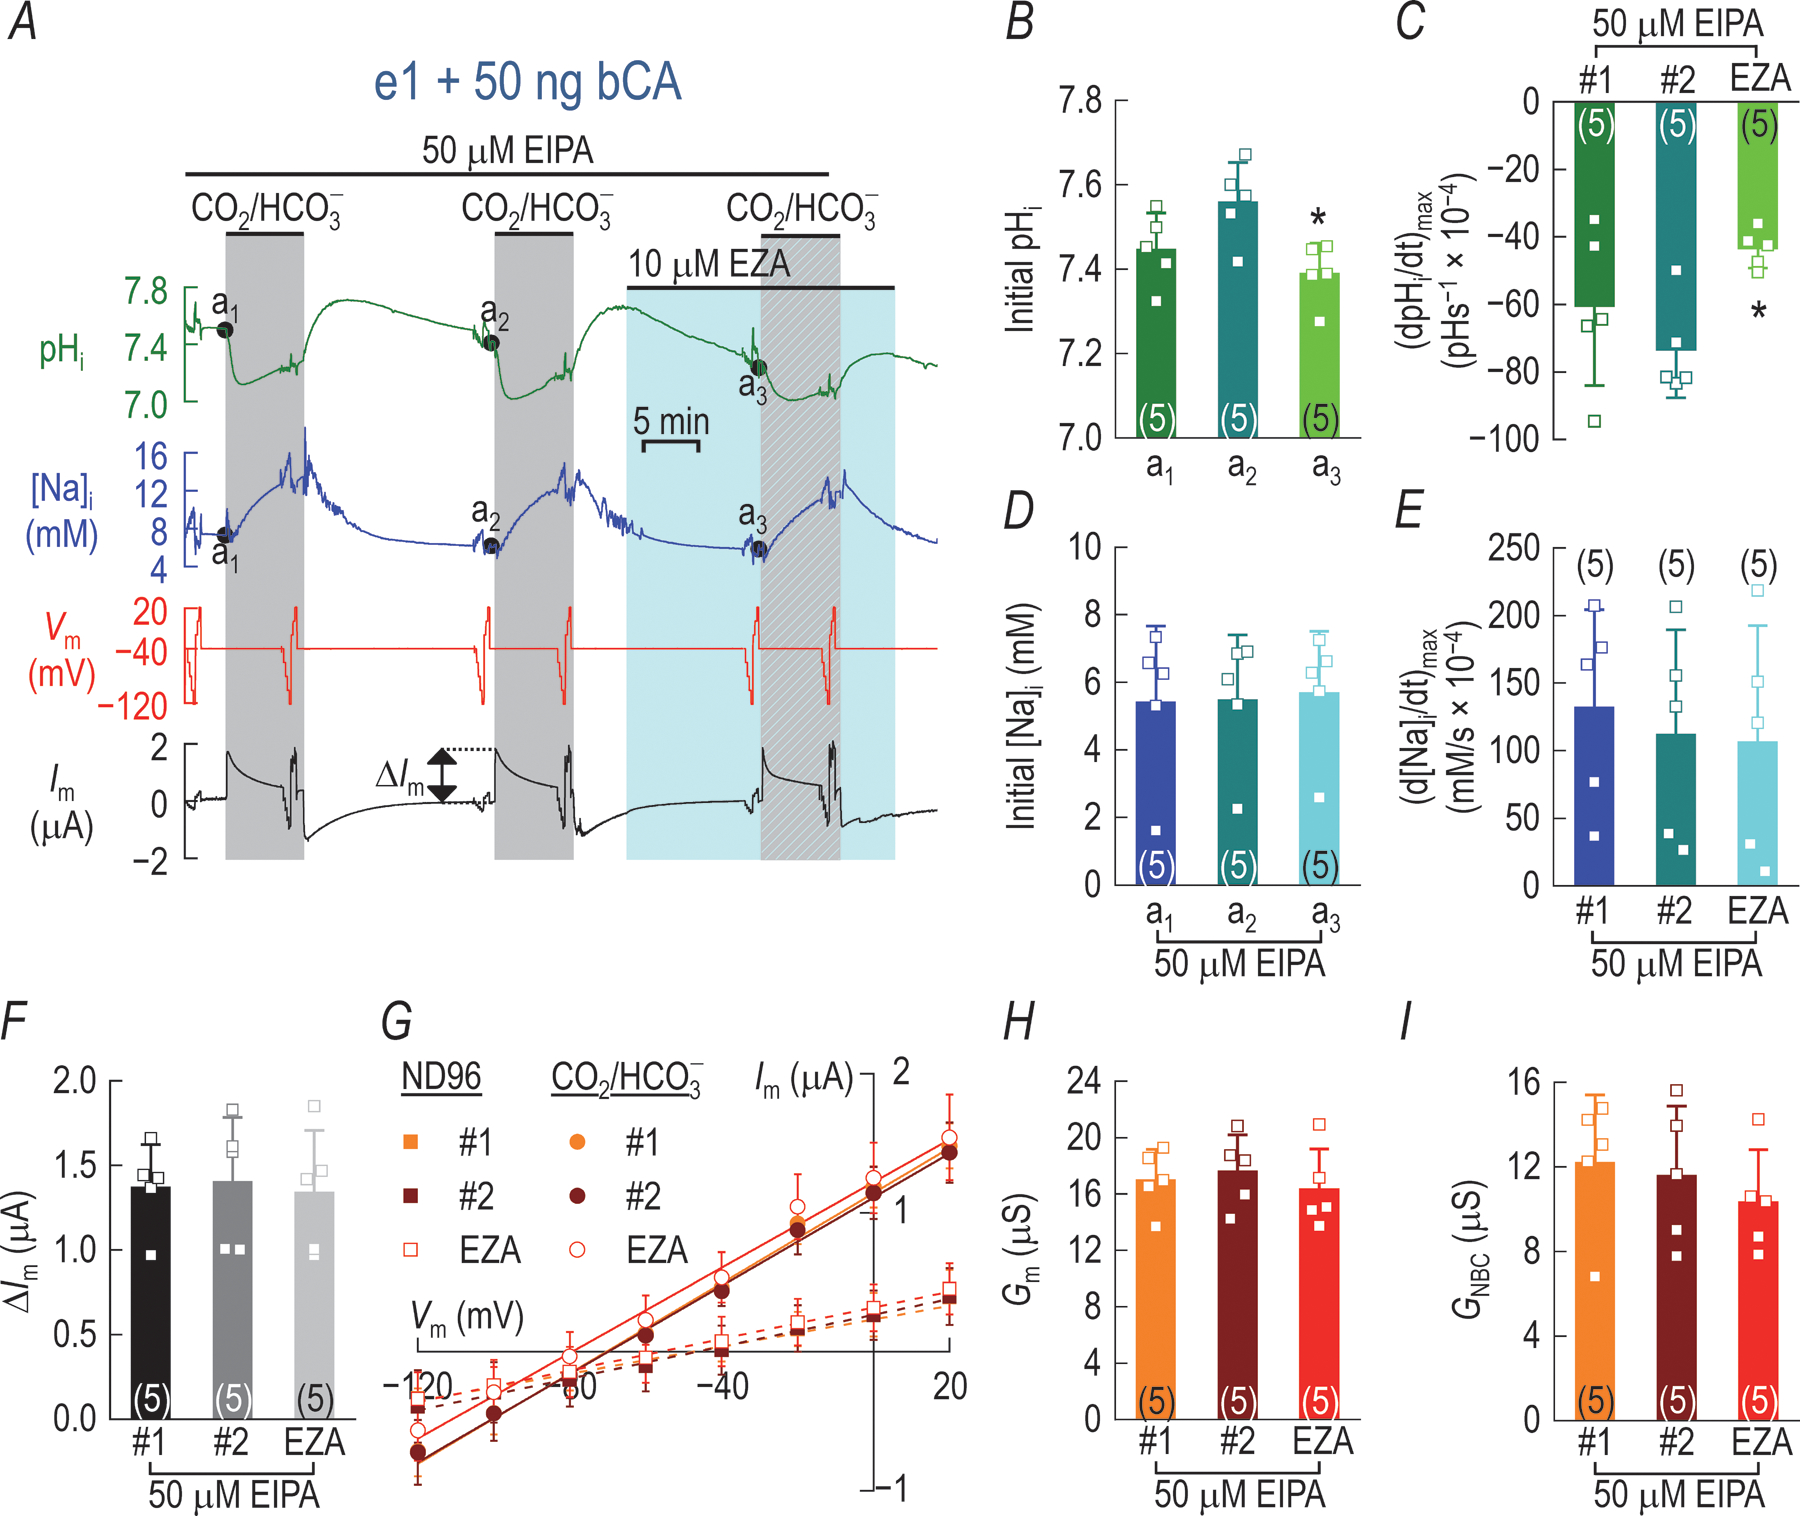
e1 oocytes are injected with 50 ng bCA and data acquired according to the protocol described in the legend for Fig. 7 and in addition, 50 μM EIPA is continuously perfused to inhibit endogenous XL-NHE activity during data acquisition. A, Representative pHi, Vm, Im, and [Na+]i traces from a single oocyte. B, Steady-state initial pHi returns to a significantly more alkaline pH prior to the initiation of the 2nd CO2/ exposure (a1 vs. a2). After the second CO2/ exposure and a 10 min incubation in 10 μM EZA, the steady-state initial pHi in e1+bCA oocytes settles at value significantly lower than prior to the second CO2/ exposure (a2 vs. a3). C, Perfusion with 10 μM EZA also significantly inhibits the activity of the injected bCA as reported by the mean rate of CO2-induced acidification, but no significant bCA-mediated differences in initial D, [Na+]i E, d[Na+]i/dt or F, ΔIm are recorded. G, Im−Vm relationships (legend key indicates symbols used to plot data from IV#1, IV#2 and IVEZA recorded in each bath solution) determined that no significant differences in H, Gm or I, GNBC are recorded pre- and post-bCA inhibition by the EZA. Paired-samples t-tests compare the differences between each successive CO2/ exposure in panels B–F, H and I. * denotes a significant difference from point a2 or period #2. Holm-Bonferroni analyses determine significance (α = 0.05, m = 2). Statistics Table 17B–F, H & I present the unadjusted p-values and adjusted α values for all analyses. The numbers in parentheses in panels B–F, H and I indicate the number of oocytes for each group. Values are mean ± SD in panels B–I.
Injection of Xenopus oocytes with purified bovine carbonic anhydrase protein
Three days after cRNA injection, we injected oocytes with 23 nl nuclease-free H2O or 50 ng of commercially purchased CA (C3934, Sigma, derived from bovine erythrocytes) dissolved in 23 nl nuclease-free H2O. Injection volume and bCA quantity replicate the parameters used by the Deitmer laboratory (Becker & Deitmer, 2007; Schueler et al., 2011).
Biotinylation of plasma-membrane proteins
Biotinylation was performed as previously described (Lee et al., 2012), using the Pierce Cell Surface Protein Isolation Kit (ThermoFisher, Grand Island, NY), according to the manufacturer’s instructions. Groups of 12 oocytes (in triplicate for each cRNA type injected) were incubated for 1 h at 4°C in PBS (diluted to 200 mosmol/kg H2O) that contained 0.24 mg/ml of the biotinylation reagent Sulfo-NHS-SS-biotin. Subsequently, nonreacted biotinylation reagent was quenched, and cells were disrupted by trituration in 500 μl “lysis buffer” that contained Tris-buffered saline, 1% Triton X-100 and protease inhibitors (Roche Applied Biosciences, Indianapolis, IN). The insoluble fraction was pelleted by centrifugation (735 × g for 10 min at 4°C) and the supernatant was then passed through a 0.45 μM Spin-X centrifuge tube filter (Thomas Scientific, Swedesboro, NJ) to clear the oocyte yolk. A 25 μl aliquot of “total oocyte protein” was set aside for analysis by western blot. The remaining homogenate was incubated in the kit-provided mini-column for 1 h with neutravidin agarose. Nonbound protein (i.e., nonbiotinylated protein) was then cleared from the column with 3 × 500 μl washes with lysis buffer. Finally, bound, biotinylated protein was eluted from the column with 500 μl SDS sample buffer that contained 50 mM DTT. Protein was resolved by SDS-PAGE on Novex 3–8% Tris-acetate gels (Invitrogen), transferred onto polyvinylidene difluoride membranes using the iBlot dry blotting system (Invitrogen), and immunoblotted using NBC-3 anti-NBCe1-A rabbit polyclonal antibody diluted 1:1000 (Schmitt et al., 1999), followed by a horseradish peroxidase-conjugated goat-anti-rabbit polyclonal antibody diluted 1:2000 (MP Biochemicals, Solon, OH). Western blots were developed using Pierce ECL Plus reagents (ThermoFisher), and the signals were detected and imaged using a Fluorchem E imager (Protein Simple, Santa Clara, CA). Before processing in the surface biotinylation assay, the GNBC for every oocyte was determined by acquiring I–V relationships in both ND96 and CO2/-containing solutions (see below). The I–V protocol stepped for 60 ms from Erev to Vm’s between –160 mV and +20 mV. e1, eGFP-e1 and eGFP-e1-CAII functional expression was determined by dividing the mean GNBC for each group of 12 oocytes by its surface expression that had been normalized to the surface expression from parallel injections of e1A in oocytes from the same batch.
Solutions
For electrophysiology studies, the nominally CO2/-free saline solution “ND96” contained (in mM): 93.5 NaCl, 5 HEPES (including ∼2.5 Na-HEPES after adjustment of solution pH to 7.5 using NaOH), 2 KCl, 1 MgCl2 and 1.8 CaCl2. ND96 solution equilibrated in air should contain only ∼150 μM produced by equilibration of atmospheric (0.03%) CO2 at pH 7.5. This value is 40-fold less than the apparent Km of oocyte-expressed NBCe1-A for (6.5 mM) determined under voltage-clamped conditions (Grichtchenko et al., 2000). CO2/-containing solutions were prepared by replacing 33 mM NaCl with 33 mM NaHCO3 in ND96 and equilibrating the solution with 5% CO2-balanced oxygen. All solutions were adjusted to ∼200 mosmol kg−1 using either H2O or mannitol as appropriate.
For experiments in which CA II activity was inhibited using the protocol of Lu et al. (2006), a stock of the CA II inhibitor ethoxyzolamide (EZA) was dissolved in 0.05 N NaOH to a concentration of 50 mM. This stock was diluted for experiments in ND96 to a working concentration of 400 μM (pH adjusted to 7.5 with 5N HCl). In these experiments, we withdrew the electrodes from the oocyte, removed it from the chamber, placed the oocyte in the EZA solution for 3 h, and then returned the oocyte to the chamber for a second round of electrophysiological recordings.
For experiments in which CA II activity was inhibited using the Becker & Deitmer (2007) protocol, a 10 mM EZA stock dissolved in ethanol was diluted in ND96 or freshly equilibrated 5% CO2/33 mM buffer to a working concentration of 10 μM (0.1% v/v ethanol). In these experiments, we superfused the oocyte—still in the chamber and impaled with microelectrodes—with the EZA solution, beginning 10 min before the application of CO2/.
We prepared a 50-mM stock of the Na-H exchanger inhibitor, ethyl-isopropyl amiloride (EIPA) in 35 mM HCl. For electrophysiology experiments, the stock was diluted in equilibrated 5% CO2/33 mM buffer to a working concentration of 50 μM.
Electrophysiological recordings
Measurements of membrane conductance (using voltage-clamp circuitry), pHi and Na+ activity (using ion-selective microelectrodes) were performed as previously detailed (Toye et al., 2006; Musa-Aziz et al., 2010; Parker et al., 2012) and as summarized below.
Whole-cell Voltage Clamp.
Whole-cell ionic currents were recorded by TEVC of oocytes using an OC-725C oocyte clamp amplifier (Warner Instruments, Hamden, CT) and digitized using a 1322A Digidata controlled by pCLAMP 10.2 software (version 10, Molecular Devices, Sunnyvale, CA). Microelectrodes were fabricated on a P-97 Flaming/Brown micropipette puller (Sutter, Novato, CA) from borosilicate glass (GC200TF-10; Warner Instruments, Hamden, CT, USA) and the tips were filled with 3M KCl. The resistance of the filled electrodes was 0.5–1.5 MΩ. A third 3 M KCl electrode with negligible tip resistance was used as the reference in the bath (ISENSE connection of the OC-725C). The different acquisition protocols employed for each group of experiments are described in the relevant Results section. We set the gain of the OC-725C to 1V/μA for all recordings, and we verify accurate telegraphing of this gain to the computer via pClamp’s “Lab Bench” and by performing voltage clamp experiments using the OC-725C’s model cell.
Measurement of Intracellular pH and [Na+].
Ion-sensitive electrodes were pulled using a similar program and the same glass as for the Vclamp electrodes, and baked overnight in an oven at 200°C to remove moisture. The microelectrodes, still in the 200°C oven were then silanized by exposing them for 45 min to 90 μl of bis-di-(methylamino)-dimethylsilane (Sigma-Aldrich, cat. no. 14755) deposited in an enclosed container. The silanized electrodes were removed from the container and allowed cure in the same oven until ready for use. The tips of pH sensitive microelectrodes (pHSM) were filled with liquid, H+ ionophore I, mixture B, (Sigma-Aldrich, cat. no. 95293) and backfilled with a solution (containing, in mM, 40 KH2PO4, 23 NaOH, 15 NaCl, adjusted to pH 7.0). The tips of Na+-sensitive microelectrodes (NaSM) were filled with Na+-ionophore I–cocktail A (Sigma-Aldrich, cat. no. 71176) and backfilled with a 10-mM NaCl solution (Steiner et al., 1979; Musa-Aziz et al., 2010). An FD223 electrometer (World Precision Instruments, Sarasota, FL, USA) acquired the measured electrochemical potential difference across the cell membrane from the pHSM and NaSM, due to H+ and Na+, respectively. From these signals, a custom-made subtraction amplifier subtracted the electrical potential difference (measured by the voltage-sensing electrode described above). In-house software converted the subtracted pHSM and NaSM signals to pHi and [Na+]i. Calibration of the pHSM signal was performed in pH 6.0 and 8.0 pH standards (ThermoFisher Scientific, Pittsburgh, PA) and a single-point calibration was made at pH 7.5 in ND96 immediately before oocyte impalement. The NaSM signal was calibrated in solutions that contained (in mM): 1, 2, 5, 10 and 20 Na+. The 20-mM Na+ calibration solution contained (in mM): 20 NaCl, 76 NMDG, 5 HEPES (pH 7.5). Other Na+ concentrations were obtained by mixing the 20-mM solution in the desired ratio with a Na+-free solution (96 mM NMDG, 5 mM HEPES, pH 7.5). Calibration slopes of both pHSM and NaSM were always between 50–58 mV per decade.
Superfusion of Oocytes.
A single oocyte in the recording chamber was constantly superfused at a flow rate of 4 ml/min. We delivered bath solutions using Harvard 33 dual syringe pumps (Harvard Apparatus, South Natick, MA), and switched among solutions with pneumatically operated valves (Clippard Instrument Laboratory, Cincinnati, OH). All experiments were performed at room temperature (~22 °C).
Data analysis
Voltage-clamp data were analyzed using Clampfit 10.7 (Molecular Devices) and Origin 2018 (OriginLab, Northampton, MA). I–V relationships were determined by measuring the mean steady-state Im during the last 1/6th of each voltage step epoch (e.g. for 60-ms voltage step durations the mean Im is calculated from the final 10 ms of the epoch, for 1000-ms voltage steps mean Im is calculated from the final 167 ms, and for 30 s voltage steps mean Im is calculated from the final 5 s). Data are presented as mean ± SD with the number of replicates (n) for each data set. The rate of change for pHi or [Na+]i was determined from linear fits of pHi vs. time or [Na+]i vs. time records using in-house software.
Statistics
Statistical analyses are performed using Origin 2018 software. When comparing the mean initial pHi, (dpHi/dt)max, initial [Na+]i, (d[Na+]i/dt)max, ΔIm, Gm, or GNBC measured from different classes of oocytes (i.e., H2O- or Tris-injected control oocytes vs. hCA II- or bCA-injected), we perform unpaired t-tests with Welch’s correction (to assume non-equal variance) to generate unadjusted p-values. When comparing the means for these same measured signals that result from successive CO2/ exposures on one class of oocyte (i.e., H2O-, Tris-, hCA II- or bCA-injected), we perform paired-samples t-tests to generate unadjusted p-values. We set the familywise error rate (FWER) to α = 0.05, and apply the Holm-Bonferroni (Holm, 1979) method to control for type I errors across multiple comparisons. For each of m comparisons in a test group, we order the unadjusted p-values (see above) from lowest to highest. For the first test, we compare the lowest unadjusted p-value to the first adjusted α value, α/m. If the null hypothesis is rejected, then we compare the second-lowest p-value to the second adjusted α value, α/(m–1). If the null hypothesis is rejected yet again, we then compare the third-lowest p-value to the third adjusted α value, α/(m–2) and so on. If at any point the unadjusted p-value is ≥ the adjusted α, the null hypothesis is accepted and all subsequent hypotheses in the test group are considered null. We report unadjusted p-values and associated adjusted α values in Statistics Tables associated with each figure.
Results
Functional expression of NBCe1 constructs
To determine if the presence of additional fused proteins on the Nt and Ct of NBCe1-A influence its functional expression1, we used a 60-ms data-acquisition protocol (Lu et al., 2006) to record I–V relationships from Xenopus oocytes expressing three NBCe1 constructs: human NBCe1-A (e1), and human NBCe1-A tagged at the Nt with enhanced green fluorescent protein (eGFP-e1) or tagged both at the Nt with eGFP and at the Ct with CA II (eGFP-e1-CAII). On three separate occasions, we injected oocytes, 72 h prior to recording, with 1.5 ng cRNA encoding each of the three NBCe1-A constructs. Fig. 1A presents the mean I–V relationship for each construct, and shows that GNBC for eGFP-e1 is 40% larger than for e1 or eGFP-e1-CAII. After I–V acquisition, we grouped 12 oocytes expressing each of the three constructs to assay surface expression by biotinylation (Fig. 1B). Fig. 1C shows the surface expression of eGFP-e1 has a greater mean value than for either e1 or eGFP-e1-CAII, but the differences among classes are not statistically significant. Fig. 1D shows a similar trend for total expression. Normalizing for surface expression in Fig. 1E, we see that GNBC values for all three constructs are indistinguishable.
In summary, Fig. 1 shows that our three NBCe1-A constructs are functioning properly.
As noted in the Introduction, our group (Lu et al., 2006) and another research group (Becker & Deitmer, 2007; Schueler et al., 2011) reached opposite conclusions when investigating the impact of CA activity on the function of NBCe1-A, heterologously expressed in Xenopus oocytes. Table 1 summarizes differences in experimental approach between the two groups. In the present study, we begin by validating the experiments of (Lu et al., 2006) and then systematically adjust the experimental protocol, eventually replicating, as nearly as possible, the conditions employed by in Becker & Deitmer (2007) and Schueler et al. (2011). As a shorthand, we will refer the Lu et al. (2006) paper as Lu, and the Becker & Deitmer (2007) paper as B&D.
Table 1:
Main differences between electrophysiological studies of NBCe1-A function in the presence of CA.
| Difference | Ref. (Lu et al., 2006) | Refs. (B&D; Schueler et al., 2011) | Figure # addressing difference |
|---|---|---|---|
| Voltage-clamp duration. | Xenopus oocytes voltage-clamped only for the duration of the I–V protocol. | Xenopus oocytes voltage-clamped at −40 mV throughout data acquisition in non- and CO2/ containing buffers. |
Fig. 2 vs. Fig. 5 Fig. 3 vs. Fig. 6–8 Fig. 12 vs. Fig. 10–11 & 17 |
| I–V protocol step duration and voltage sequence. | Stepped Vh in 20-mV increments from −160 to +20 mV, using 60-ms epochs. | 10 s step duration following a double-staircase sequence: −40, −60, −80, −100, and −120 mV, followed by a jump to −20, then 0 and +20 mV |
Fig. 2 vs. Fig. 5 Fig. 3 vs. Fig. 6–8 Fig. 12 vs. Fig. 10–11 & 17 |
| NBC current or whole cell membrane current. | Measured INBC. | Measured Im. | Fig. 5–11, 13 & 17 |
| Quantity of CA protein/oocyte. | 300 ng hCA II per oocyte (10−11 mol/oocyte ≅ 24 μM) which was calculated to be ~20% higher than present in a red blood cell. | 50 ng bCA/oocyte (B&D; Schueler et al., 2011) based on quantities in Nakhoul et al., (1998) & Becker et al., (2005). 0–200 ng human CA I (Schueler et al., 2011). ~65ng CA III expressed from cRNA (Becker et al., 2011). |
Fig. 3 & 4 vs. Fig. 6–8 Fig. 12 vs. Fig. 10, 11, & 17 |
| CA buffer. | Tris pH 8.0. | H2O. |
Fig. 3 vs. Fig. 12 Fig. 7 & 8 vs. Fig. 9 Fig. 10 & 11 vs. Fig. 13 Fig. 14 vs. Fig. 15 |
| CA Source. | Recombinant human CA II purified from E. coli. or Human CA II cDNA fused to Ct of eGFP-e1 construct. |
Mixture of CAs purified from bovine erythrocytes – contains CA II (bCA) (B&D; Schueler et al., 2011). CA I purified from human erythrocytes (Schueler et al., 2011). CA I, CA II and CA III expressed in oocytes from 11.5 ng injected cRNA (Schueler et al., 2011). |
Fig. 2 & 3 vs. Fig. 12 Fig. 7 & 8 vs. Fig. 9 Fig. 10 & 11 vs. Fig. 13 Fig. 14 vs. Fig. 15 |
| Inhibition of CA activity by EZA. | 3 h incubation in 400 μM EZA in between 1st and 2nd I–V and pHi recordings. | 10 μM EZA perfused in the recording chamber for 10 min before the final CO2-induced acidification during a continuous recording. | Figs. 2, 3 & 12 vs. Figs. 5–11, 13–15 & 17 |
| EZA stock concentration and vehicle. | 50-mM in NaOH. | 10-mM EZA stock in ethanol. | Figs. 2, 3 & 12 vs. Figs. 5–11, 13–15 & 17 |
| NBCe1 construct. | N-terminally eGFP tagged NBCe1-A (eGFP-e1) | Wild type non-tagged NBCe1-A (e1). |
Fig. 3 vs. Fig. 12 Fig. 6 vs. Fig. 13 Fig. 9 vs. Fig. 10 & 11 |
| Quantity injected cRNA. | 25 ng/oocyte | 14 ng /oocyte | Fig. 7 |
| CO2/ buffer. | 5% CO2/ 33 mM pH 7.5 | 5% CO2/ 24 mM pH 7.36 | Not addressed |
| Intracellular Na+ electrode recordings. | Not performed | Performed | Fig. 7, 9, 10 & 13–17 |
Lu-like protocols
Effect of increasing I–V step duration when CA II is tethered to the Ct of NBCe1-A (eGFP-e1-CAII).
As noted in the Introduction, we hypothesize that voltage clamping the Vm of NBCe1-A oocytes far from Erev would create intracellular gradients for transport-related parameters, that these gradients would increase with increasing clamp duration, and that CA II distributed throughout the cytosol would dissipate CO2/-related gradients and thereby increase transport. Thus, CA II restricted to the Ct of NBCe1-A ought to have a minimal effect. We begin by repeating one of the Lu protocols, in which they confined CA II expression to the inner surface of the plasma membrane by expressing in oocytes the fusion protein eGFP-e1-CAII. We generate I–V relationships by stepping the holding potential (Vh) in 20-mV increments between −160 and +20 mV, using 60-ms epochs. One difference from Lu is that we inject only 1.5 ng per oocyte (rather than 25 ng) of the cRNA. Nevertheless, the GNBC values in the present study are ~2-fold higher than in Lu, presumably reflecting cRNA of higher activity.
We generate the I–V relationships in Fig. 2A by measuring the mean steady-state Im during each voltage step. By subtracting, oocyte by oocyte, the I–V measured in ND96 solution (solid squares) from the I–V measured in the 5% CO2/33 mM solution (solid diamonds), we calculate the mean GNBC (Fig. 2B, 60 ms, black bar) of eGFP-e1-CAII oocytes with uninhibited CA II. Previous work has shown that subtracting the background I–V relationship in ND96 from that in CO2/ yields virtually the same slope conductance as subtracting the I–V relationship obtained in the presence of a saturating concentration of tenidap (figure 3A Lu et al., 2006; figure 5A Lu & Boron, 2007; figure 6G Parker et al., 2012), which blocks NBCe1-A (Ducoudret et al., 2001). We avoid using tenidap in the present experiments because it is not fully reversible and because (over a short time) it also elicits an endogenous -independent conductance in Xenopus oocytes (Parker et al., 2012).
After acquiring the I–V data in the absence of a CA II inhibitor, we remove the oocytes from the chamber and incubate them for 3 h in 400 μM EZA (dissolved in ND96) to permanently inhibit the catalytic activity of the tethered CA II in eGFP-e1-CAII. We then acquire a second set of I–V relationships, using 60-ms epochs away from Vh, on the same oocytes in the absence (Fig. 2A, open squares) and presence (open diamonds) of CO2/ to compute GNBC. The black bar at 60 ms in Fig. 2B summarizes the mean GNBC with CA II unblocked (Pre EZA), and the gray bar shows a comparable summary for CA II that is presumably blocked (post EZA). As hypothesized, the presumed blockade of tethered CA II has no effect on NBCe1-A activity.
Fig. 2A and B also summarize comparable experiments in which the epochs away from Vh in our I–V protocols have durations of 1 s or 30 s. Although GNBC falls with progressively longer step durations, blockade of tethered CA II by EZA has no effect (Fig. 2B, black vs. gray bars). The decrease in GNBC with increased step duration reflects the slow relaxation in the -dependent current (INBC), presumably caused by the cytosolic accumulation of Na+ and (or, for example, ) during long voltage steps, especially at positive Vh values, where NBCe1-A activity is high. The positive shift in Erev observed with the 30-s epochs have the same explanation.
In Fig. 2C and D, we verify that the CA II moiety of eGFP-e1-CAII functions in the absence of EZA but not in the presence of the drug. Fig. 2C shows the initial portion of the CO2-induced acidification for a representative oocyte expressing eGFP-e1-CAII, before and after incubation for 3 h with 400 μM EZA. In each case we compute the maximal rate of pHi descent, (dpHi/dt)max—an index of CA II activity. The data summary in Fig. 2D shows that that (dpHi/dt)max for eGFP-e1-CAII oocytes blocked with EZA is virtually identical to the (dpHi/dt)max for eGFP-e1 oocytes (i.e., without attached CA II) in the absence of inhibitor. Moreover, both are far smaller than (dpHi/dt)max for eGFP-e1-CAII oocytes in the absence of inhibitor. Thus, the EZA incubation reduces the CA II activity of eGFP-e1-CAII oocytes to a level indistinguishable from that of oocytes expressing eGFP-e1 (Fig. 2D).
In summary, Fig. 2 shows that although CA II tethered to NBCe1-A exhibits robust catalytic activity in converting CO2 + H2O → + H+, it does not significantly influence the magnitude of GNBC—in agreement with our first prediction.
Effect of increasing I–V step duration when CA II protein is injected into the cytoplasm of oocytes expressing NBCe1-A.
To test our second prediction—that cytosolic CA II will dissipate CO2/-related gradients, perhaps enough to increase NBCe1-A activity—we injected 300 ng of recombinant hCA II dissolved in Tris buffer, or an equal volume of Tris buffer as a control, into the cytosol of oocytes expressing eGFP-e1. We employed the same I–V acquisition protocols as in Fig. 2A, with step durations of 60 ms, 1 s, or 30 s.
Fig. 3A displays the I–V relationships recorded from eGFP-e1 oocytes injected with Tris (top row) or with hCA II (bottom row), both before a 3-h incubation with 400 μM EZA (solid black symbols) and after EZA-treatment (open gray symbols). The I–V relationships acquired with 60-ms epochs (Fig. 3A, left) confirm the Lu observations that: (a) injected hCA II does not affect the GNBC from eGFP-e1 oocytes (Fig. 3B, 60 ms, black bars), and (b) EZA does not have a substantial effect on the GNBC of either hCA II or Tris-injected oocytes Fig. 3B, 60 ms, gray bars).
GNBC decreases significantly as we increase the duration of the steps in the I–V protocols both from 60 ms to 1 s and from 1 s to 30 s (Fig. 3B, black bars), as observed for the eGFP-e1-CAII construct (Fig. 2B). Analogous to what we observed for the eGFP-e1-CAII construct, blockade of untethered hCA II by EZA has no effect (Fig. 3B, black vs. gray bars).
As confirmed by Fig. 3C and D, the injected hCA II is catalytically active before being blocked by the 3-h incubation in 400 μM EZA. Moreover, the high intracellular concentration of untethered hCA II that results from injecting 300 ng of the recombinant protein into eGFP-e1 oocytes, as one would expect, causes the CO2-induced (dpHi/dt)max to be 57% faster than in oocytes expressing eGFP-e1-CAII, in which CA II expression is restricted to the inner surface of the plasma membrane (black bars in Fig. 2D vs. Fig. 3D).
In conclusion, Fig. 3 shows that cytosolic hCA II does not have a progressively greater stimulatory effect on GNBC as step durations increase—contrary to our hypothesis. In fact, injected hCA II has no effect at any step duration.
pHi-recovery rate during prolonged depolarization
Effect of cytosolic hCA II on -dependent rate of pHi increase when NBCe1-A is working at high rates for long periods.
The discussion of B&D suggests that one reason that Lu did not observe a CA II-dependent increase in NBCe1-A activity was that NBCe1-A activity in the Lu experiments was too small when I–V relationships were acquired with Vh ≅ Erev. Actually, the INBC values of Lu were substantially greater than the Im values reported in Becker & Deitmer (2007) (only part of which is INBC) and, as already noted, the INBC values in the present study are greater still. Although NBCe1-A currents are only briefly maintained in Lu (i.e., 60 ms), our new data in Fig. 2 and Fig. 3 rule out step duration as being the critical issue. One difference between the two studies was that B&D (but not Lu) monitored rates of pHi increase (a measure of net acid extrusion) during long periods in which they clamped Vm to values far more positive than Erev. We address this issue in Fig. 4, where we compare oocytes expressing eGFP-e1 (or controls injected with H2O), with and without hCA II.
The experiment begins, as in Fig. 3, by exposing oocytes to 5% CO2/33 mM (Fig. 4A & B). Oocytes expressing eGFP-e1 as well as controls injected with water show a significant increase in initial, CO2-induced (dpHi/dt)max when injected the day before the assay with hCA II in Tris, as compared to oocytes injected with only Tris (Fig. 4C).
We obtain I–V relationships using a 60-ms step protocol at three time points during the recording. The first—IV#1—we obtain a few seconds after the switch to CO2/, as Vm reaches its hyperpolarized nadir (i.e., before pHi begins to acidify). Fig. 4D shows four mean I–V relationships, each of which is the result of subtracting the I–V relationship in ND96 from that in CO2/, oocyte by oocyte. Thus, for oocytes expressing eGFP-e1, the relationships represent GNBC. We see that hCA II has no effect on GNBC, confirming the data in Fig. 2 and Fig. 3, obtained under similar conditions.
We acquire IV#2 when the pHi settles at its acidic nadir and before the NBCe1-A mediated pHi recovery begins (Fig. 4A & B). At this time, the spontaneous Vm is only slightly more positive than whole-oocyte Erev (i.e., about –120 mV). For this acquisition, eGFP-e1 oocytes injected with Tris exhibit a slightly larger GNBC than those injected with 300 ng of hCA II, but the difference is not statistically significant (Fig. 4E).
Once the pHi begins to recover, we Vclamp Vm to –120 mV (~resting Vm) and let the Im stabilize. We then step Vh to 0 mV. This switch from −120 mV to 0 mV elicits a large outward current (Fig. 4A & B, ΔIm) not observed in control oocytes not expressing eGFP-e1 (not shown). However, among oocytes expressing eGFP-e1, the magnitude of the ΔIm is not significantly different between the subset of oocytes injected with hCA II versus the other subset injected with Tris (Fig. 4F). 5–10 s after observing the peak ΔIm (Fig. 4A & B), we acquire IV#3. The Erev for INBC in IV#3 is right-shifted compared to IV#1 or IV#2. Nevertheless, hCA II has no significant effect on GNBC at this time point (Fig. 4G).
After obtaining IV#3, we monitor the pHi recovery while still clamping Vh at –120 mV. In eGFP-e1 oocytes, the Vm shift promotes a robust pHi recovery (Fig. 4A & B) not observed in control oocytes not expressing eGFP-e1 (not shown). However, among oocytes expressing eGFP-e1, we detect no significant difference in pHi recovery rates between the subset injected with hCA II and Tris versus the other subset injected with only Tris (Fig. 4H).
In summary, even when eGFP-e1 is carrying large currents (approaching 2.5 μA in Fig. 4F) for several minutes, injected hCA II has no significant effect on the pHi-recovery rate (Fig. 4H), which is an indication of net acid extrusion.
B&D solution-change and I–V protocols
Neither lengthening the duration of the voltage steps in the I–V protocol (i.e., from 60 ms to 30 s in Fig. 2 & Fig. 3) nor monitoring pHi while driving NBCe1-A at high rates for long periods (i.e., Vh = 0 mV for several minutes in Fig. 4) reveals a CA II-dependent modulation of NBCe1-A activity. Although our methodology in the aforementioned experiments is similar to that in B&D, it differs in several respects. In the remainder of our experiments, we systematically address the differences (highlighted in Table 1) between Lu and B&D.
In Fig. 5 and Fig. 6, we improve the match between the two protocols in five ways by: (a) continuously clamping the oocyte to –40 mV (vs. briefly clamping to Erev ≅ –140 mV), (b) using the B&D I–V protocol (vs. the Lu protocol in Fig. 2A), (c) inhibiting CA II with a 10-min exposure to 10 μM EZA (vs. 3 h at 400 μM), (d) using a 10-mM EZA stock in ethanol (vs. 50-mM in NaOH), and (e) reducing the amount of injected hCA II to 50 ng (vs. 300 ng, Fig. 6). In the first set of these studies, when CA II is present, it is tethered to the NBCe1-A, whereas in the second, when CA II is present, it is injected.
eGFP-e1-CAII fusion protein.
Here we ask whether—with CA II tethered to NBCe1-A, a B&D-like protocol can detect a significant reduction in ΔIm and GNBC when we block CA II activity.
Fig. 5A displays representative recordings of pHi (green trace), Vm (red trace) and Im (black trace) for an oocyte expressing eGFP-e1 and clamped to –40 mV from the start of the experiment. Fig. 5B shows an equivalent recording for an oocyte expressing eGFP-e1-CAII. In each case, we twice acidify the oocyte with CO2/, with a 15-min recovery period in ND96 in-between. 10 min before the second acidification, we begin superfusing the oocytes with 10 μM EZA diluted from an ethanol stock. The points a1 (pre-EZA) and a2 (10 μM EZA) represent the initial pHi values before the two CO2/ exposures.
Fig. 5C shows that pHi values at a1 (pre-EZA) and a2 (10 μM EZA) are not significantly different for either eGFP-e1 or eGFP-e1-CAII oocytes; the similarity of initial pHi values simplifies comparisons of (dpHi/dt)max values under pre-EZA vs. EZA conditions (Musa-Aziz et al., 2014a, 2014b). Fig. 5D confirms that the tethered CA II is active.
The magnitude of ΔIm recorded from eGFP-e1 oocytes is not different from that of eGFP-e1-CAII oocytes (Fig. 5E, black bars). Nor does 10 μM EZA affect ΔIm, either in eGFP-e1-CAII or in eGFP-e1 oocytes (Fig. 5E, compare black and gray bars in each group). Thus, ΔIm does not depend on either the presence or activity of the tethered CA II.
B&D does not specify the Vclamp parameters. Examination of representative I–V records from B&D, allows us to estimate the step duration as 10 s, and to reconstruct the following double-staircase sequence: –40, –60, –80, –100, and –120 mV, followed by a jump to –20, and then 0 and +20 mV. This split step sequence results in two linear I–V relationships, a steeper one from –40 to –120 mV, and a shallower one from –20 to +20 mV. The explanation for the steeper I–V relationship is that stepping from –40 to –120 mV (without intervening steps to –40 mV) depletes the cell of Na+ and and inadvertently shifts Erev to more negative voltages. Because (Vm–Erev) increases, Im values increase as well, resulting in a larger Gm. On the other end of the double-staircase, positive shifts in Vm cause Na+ and to accumulate inside the cell, shifting Erev to more positive voltages, thereby reducing (Vm–Erev), Im, and thus Gm. As in B&D, we fit the high-Gm and low-Gm portions of the I–V relationship with a single line. Although not reported in B&D, we acquire I–V relationships in ND96 just before each exposure to CO2/, providing the data necessary for computing INBC from the difference Im(CO2/) – Im(ND96). During the CO2/ exposures in both the absence and presence of EZA, our acquisition of IV#1 and IV#2 commence 30 s and 2.5 min, respectively, after the peak ΔIm (blue boxes Fig. 5A & B). The resulting INBC-Vm relationships for oocytes expressing eGFP-e1 (Fig. 5F) or eGFP-e1-CAII (Fig. 5G) show that, although Erev is right-shifted2 for IV#2 relative to IV#1—for both eGFP-e1 (Fig. 5F) and eGFP-e1-CAII (Fig. 5G)—EZA treatment does not significantly affect the magnitude of the GNBC calculated from IV#1 or IV#2 (Fig. 5H).
In summary, Fig. 5 shows that when CA II is tethered to the NBCe1-A Ct in the eGFP-e1-CAII construct, and data is acquired by a protocol that is more B&D-like, inhibiting the catalytic activity of the tethered hCA II does not significantly reduce ΔIm, Gm, or GNBC.
eGFP-e1 and injected CA II.
Although physical linking between NBCe1-A and CA II is guaranteed in eGFP-e1-CAII, it is possible that the tether between NBCe1-A Ct and the CA II moiety may not permit the appropriate interaction between the two. Therefore, we used the same B&D-like acquisition protocol as in Fig. 5, but with oocytes expressing eGFP-e1 and injected with 50 ng of recombinant hCA II 24 h before recording. This quantity of injected hCA II is one-sixth of that in Fig. 3 and Fig. 4, but identical to that in B&D and Schueler et al., (2011). The results for this series of experiments, summarized in Fig. 6, are virtually identical to those in Fig. 5. The only substantive difference is that the EZA reduces CA activity only by half in Fig. 6 (eGFP-e1+hCAII), instead of ~100% in Fig. 5. The likely explanation is that the short exposure to the low concentration of EZA in Fig. 6 is not sufficient to block the large amount of hCA II distributed throughout the cytosol.
Nevertheless, Fig. 6 leads us to conclude that the injection of hCA II has no effect on ΔIm, Gm, or GNBC and thus the activity of GFP-e1 when data is acquired by a more B&D-like protocol.
Is it possible to detect stimulation of NBCe1-A by CAII in B&D-like protocols, when the expressed current magnitude is small?
Although the data of the previous section does not replicate those of B&D, we note that NBCe1-A functional expression (i.e., GNBC), both in Lu and thus far in the present study, is typically 3-fold greater than the Gm data of B&D and Schueler et al. (2011). Because it is possible that our NBCe1-A expression levels are so great that effects of exogenous CA II become superfluous, here we reduce the quantity of eGFP-e1 cRNA injected per oocyte sufficiently to reduce ΔIm at −40 mV to ≤ 0.5 μA (i.e., similar to B&D. We also monitor [Na+]i to allow direct comparisons with B&D’s data.
We inject—4 days before recording—150 pg/oocyte of eGFP-e1 cRNA (10× less than injected in previous experiments in the present study and almost 100× less than in B&D. Then—24 h before recording—we inject positively expressing oocytes with either 50 mM Tris (Fig. 7A) or 50 ng hCA II (Fig. 7B).
To minimize the difference between the maximal pHi after CO2 removal and the initial pHi (b1 – a1 in Fig. 7A & B), we introduce a CO2/ pre-pulse—as employed by Nakhoul et al. (1998)—so that the comparable (b2 – a2) difference for the second CO2/ pulse is substantially smaller than the first. Notice that, in both Fig. 7A & B, adding CO2/ causes [Na+]i to rise, whereas removing CO2/ causes [Na+]i to fall. The rise in [Na+]i presumably reflects the action of a Na+-driven acid-extrusion mechanism (e.g., NBCe1-A or an endogenous Na-H exchanger). The fall in [Na+]i presumably reflects a slowing (or reversal) of the Na+-driven acid extrusion, coupled with an increase in Na+ extrusion via the Na-K pump. We will use the rate of [Na+]i increase (d[Na+]i/dt) as a surrogate for the rate of the Na+-driven acid-extrusion process. Fig. 7C summarizes the mean initial pHi for all cells at the beginning of each of the three CO2-induced acidifications, and shows that values corresponding to a2 (before EZA) and a3 (after 10 min in 10 μM EZA) are not significantly different for either eGFP-e1+Tris oocytes or eGFP-e1+hCA II oocytes. As expected, the mean (dpHi/dt)max in eGFP-e1+Tris oocytes is relatively low and virtually identical during pre-EZA #2 and 10 μM EZA (Fig. 7D, 2 hatched bars on right). On the other hand, in eGFP-e1+hCA II oocytes the (dpHi/dt)max is relatively large during pre-EZA #2 and markedly reduced by EZA (Fig. 7D, 2 solid bars on right); however, even during EZA, (dpHi/dt)max remains greater than the values for eGFP-e1+Tris oocytes. These data confirm that the injected hCA II is functional.
Interestingly, we find that—for both eGFP-e1+Tris and eGFP-e1+hCAII oocytes—the initial [Na+]i prevailing before the three CO2/ applications tends to rise during the experiment (a1, a2, a3 in Fig. 7A & B), although the changes from a2→a3 are not statistically significant (Fig. 7E). In Fig. 7A & B, we chose the most representative examples of experiments in which we recorded four parameters; initial [Na+]i is the most subtle of all the values we report in Fig. 7 and later figures. In judging trends for initial [Na+]i, it is especially important to focus on the mean values, in this case, those reported in Fig. 7E.
During each of the three CO2/ exposures, [Na+]i rises appreciably with time (Fig. 7A & B). Although the (d[Na+]i/dt)max tends to fall during the experiments (Fig. 7F)—for both eGFP-e1+Tris and eGFP-e1+hCAII oocytes—the differences among (d[Na+]i/dt)max values do not reach statistical significance.
Fig. 7G summarizes the peak ΔIm elicited by each of the transitions to 5% CO2/33 mM . We see no significant differences, although, for eGFP-e1+hCAII oocytes, the mean ΔIm falls by nearly 17% in the presence of EZA. B&D had reported that EZA treatment produces a complete CA II block as well as a significant, 25% reduction in ΔIm.
Before each CO2/ exposure, and 5 min into each CO2/ exposure, we obtain an I–V relationship for eGFP-e1+Tris (Fig. 8A) and for eGFP-e1+hCAII oocytes (Fig. 8B) using the same step protocol as Fig. 5 and B&D. For neither group of oocytes, examined in CO2/, do we record a significant difference in Gm between pre-EZA #2 and 10 μM EZA (Fig. 8C). Moreover, when we subtract the appropriate Gm values obtained in ND96 from those obtained in CO2/, we similarly find that GNBC does not differ significantly between eGFP-e1+Tris oocytes and eGFP-e1+hCAII oocytes (Fig. 8D, striped vs. solid bars). Nor do we observe a difference in GNBC following 10 μM EZA treatment for either group of oocytes (Fig. 8D, burgundy vs. red bars).
In summary, Fig. 7 and Fig. 8 show that when we expressed eGFP-e1 at low levels to mimic the ΔIm data reported in B&D, we observe no hCA II-dependent modulation of NBCe1-A activity as judged by effects on initial [Na+]i, (d[Na+]i/dt)max, ΔIm, or GNBC
On a background of eGFP-e1 with a B&D Vclamp protocol, is the CA source important?
Until this point in the present study, as in Lu, we injected purified recombinant hCA II dissolved in Tris buffer (pH 8). However, the majority of experiments in B&D involved commercial erythrocyte bCA dissolved in dH2O before injection B&D.3 The experiments in Fig. 9 are very similar to those in Fig. 7, the major difference being the source of CA.4 Here in Fig. 9, 3 days after injecting oocytes with 1.5 ng cRNA encoding eGFP-e1, we inject 50 ng bCA (rather than hCA II). Nevertheless, the trends in Fig. 9B–I are fundamentally the same as in Fig. 7C–G and Fig. 8, indicating no effect of bCA on eGFP-e1 activity, as assessed by changes in initial [Na+]i, (d[Na+]i/dt)max, ΔIm, Gm, or GNBC.
On a background of bCA with a B&D Vclamp protocol, is the eGFP tag on NBCe1-A important?
Because we have been working with eGFP-e1, whereas B&D reports experiments with untagged NBCe1-A, in Fig. 10 we now repeat the protocol of Fig. 9, but replace eGFP-e1 with e1. In Fig. 10G, the EZA treatment of e1+bCA oocytes—but not of e1+H2O oocytes—is associated with a 21% reduction in ΔIm, similar to the 27% reduction in ΔIm reported in B&D. Thus, a comparison of Fig. 9 and Fig. 10 shows that—on a background of bCA with a B&D Vclamp protocol—the inhibitory effect of EZA on ΔIm requires that e1 not be tagged with eGFP.
Note that the Gm values for e1+bCA oocytes in the presence of CO2/ reveal no significant effects of EZA (Fig. 11C). Moreover, Fig. 11D, reveals no effect of EZA on the GNBC (not determined in B&D). Thus, Fig. 10 and Fig. 11 show that the effect of EZA on ΔIm notwithstanding, we conclude that EZA does not affect NBCe1-A activity in e1+bCA oocytes.
The remarkable feature of Fig. 10 that we cannot explain at this juncture is that in e1+bCA oocytes—but not e1+H2O oocytes—initial [Na+]i increases significantly (by 42%) from point a1 to a2 and again by 32% from point a1 to a3 (Fig. 10E and Statistics Table 10E).5 At the same time, (d[Na+]i/dt)max #2 is 23% slower than (d[Na+]i/dt)max #1 (p=0.05), and EZA causes a significant (22%) fall in the (d[Na+]i/dt)max vs. (d[Na+]i/dt)max #2 (Fig. 10F and Statistics Table 10F). Thus, a comparison of Fig. 9 and Fig. 10 shows that—on a background of bCA with a B&D Vclamp protocol—both the increase [Na+]i (Fig. 10E) and the decrease in (d[Na+]i/dt)max caused by EZA (Fig. 10F) requires that e1 not be tagged with eGFP.
Statistics Table 10E.
for Figure 10E
| Initial [Na+]i | e1+H2O | Initial [Na+]i | e1+bCA | Initial [Na+]i | e1+H2O vs. e1+bCA | |||
|---|---|---|---|---|---|---|---|---|
| Unadj. p | Adj. α | Unadj. p | Adj. α | Unadj. p | α | |||
| a1 vs. a2 | 0.143 | 0.025 | a1 vs. a2 | 0.014 | 0.025 | a2 | 0.765 | 0.050 |
| a2 vs. a3 | 0.198 | 0.050 | a2 vs. a3 | 0.040 | 0.050 | |||
Statistics Table 10F.
for Figure 10F
| (d[Na+]i/dt)max | e1+H2O | (d[Na+]i/dt)max | e1+bCA | (d[Na+]i/dt)max | e1+H2O vs. e1+bCA | |||
|---|---|---|---|---|---|---|---|---|
| Unadj. p | Adj. α | Unadj. p | Adj. α | Unadj. p | α | |||
| #1 vs. #2 | 0.034 | 0.025 | #2 vs. EZA | 0.007 | 0.025 | #2 | 0.741 | 0.050 |
| #2 vs. EZA | 0.861 | 0.050 | #1 vs. #2 | 0.050 | 0.050 | |||
On a background of e1+bCA, is the Vclamp protocol important?
Our approach in Fig. 10—using e1+bCA, while continuously clamping to –40 mV and performing 10-s step double-staircase I–V protocols—is the one that most closely approximates the methodology of B&D, and the one that allows us to replicate two aspects of B&D (i.e., the EZA sensitivity of ΔIm and d[Na+]i/dt). Here in Fig. 12A, we continue to use e1+bCA, but return to the I–V acquisition protocols of Fig. 2 and Fig. 3, in which we clamp the oocyte only during I–V protocols, choose a control Vh that is close to Erev, and return to this control Vh during voltage steps. We find that—whether the I–V step duration is 60 ms, 1 s or 30 s—injection of bCA (vs. injection of H2O) into e1 oocytes does not significantly affect GNBC (Fig. 12B, black bars). Furthermore, a 3-h incubation in 400 μM EZA does not significantly change GNBC in either H2O- or bCA-injected oocytes (Fig. 12B, black vs. gray bars), even though EZA reduces the activity of injected bCA to the baseline levels observed in e1+H2O oocytes (Fig. 12C & D). Thus, a comparison of Fig. 12 vs. Fig. 10 and Fig. 11 shows that on the background of e1+bCA, CA inhibition does not significantly change GNBC, whether the data is acquired with a B&D-like or Lu-like Vclamp protocol. But the ability of CA inhibition to reduce ΔIm and (d[Na+]i/dt)max requires the Vclamp protocol of B&D.
On a background of e1 with the B&D Vclamp protocol, is the CA source important?
In Fig. 10 (e1+bCA + Vclamp protocol of B&D), we saw that EZA reduces ΔIm and (d[Na+]i/dt)max. Here in Fig. 13, the conditions are the same as in Fig. 10 except that we replace bCA with hCA II. Indeed, the results of Fig. 13 are basically the same as those of Fig. 10 except that in Fig. 13, EZA does not reduce ΔIm or (d[Na+]i/dt)max, or raise the initial [Na+]i. Thus, on the background of e1 with the B&D Vclamp protocol, the ability of EZA to reduce ΔIm and (d[Na+]i/dt)max requires bCA.
In conclusion, Fig. 7–13 (summarized in Table 2) show that the ability of EZA to reduce ΔIm and (d[Na+]i/dt)max requires untagged NBCe1-A (vs. eGFP-e1), bCA (vs. hCA II), and the B&D Vclamp protocol (vs. Lu protocol).
Table 2:
Incremental protocol changes to address differences of experimental approach between Ref. Lu et al. (2006) and Becker & Deitmer (2007)
Stimulation of native oocyte Na-H exchange by injected CA
Effect of hCA II in oocytes lacking NBCe1-A.
Because the experiment in Fig. 14A (H2O+Tris) lacks a Na/HCO3 co-transporter (NBC) construct, it is a control for Fig. 7A (eGFP-e1+Tris). Similarly, Fig. 14B (H2O+hCAII) is a control for Fig. 7B (eGFP-e1+hCAII) and Fig. 13A (e1+hCAII). These control experiments in Fig. 14 yielded two key results:
Figure 14: Injected hCA II significantly enhances the CO2-induced increase in d[Na+]i/dt in H2O injected oocytes.

Recordings from control oocytes injected 4 days prior to recording with 9.2 nl H2O (no NBCe1-A) and 1 day before recording with either A, 50 nl Tris buffer or B, 50 ng hCA II in 50 nl Tris observing the same protocol as in Fig. 7. Vh is clamped at –40 mV and oocytes are exposed to three periods of 5% CO2/33 mM (gray shading and “CO2/” label). Prior to the 3rd CO2/ delivery, the oocyte is perfused for 10 min with 10 μM EZA to inhibit CA II activity (cyan shading and “10 μM EZA” label). C, Although not expressing NBCe1-A, pHi always recovers to a more alkaline pH after each CO2/ exposure in hCA II injected oocytes (points a1 vs. a2 vs. a3). D, hCA II injected oocytes acidify significantly faster than Tris injected oocytes, and this activity is inhibited by 10 μM EZA to a rate similar to that from the Tris injected oocytes. E, The initial [Na+]i is larger in hCA II injected oocytes than Tris injected oocytes, but the differences are not significant. However, the increase in initial [Na+]i before each successive CO2/ exposure in both Tris and hCA II injected oocytes is significant. F, EZA inhibition of hCA II activity results in a significant decrease in the d[Na+]i/dt for cells injected with hCA II, not observed in the Tris injected cells. I–V relationships are acquired during the recording of the data exampled in panels A and B for H2O injected oocytes plus 50 nl Tris and H2O injected oocytes plus 50 ng hCA II. G, The mean Gm for each condition is plotted in panel. We perform paired-samples t-tests to compare the differences between each successive CO2/ exposure in panels C–G (* denotes a significant difference from point a2 or period #2). Holm-Bonferroni analyses determine significance (α = 0.05, m = 2). † indicates that the measured a2 or period #2 means are significantly different between H2O + Tris vs. H2O + 50 ng hCA II oocytes, as determined by an unpaired t-test with Welch’s correction. α = 0.05. Statistics Table 14C–H reports the unadjusted p-values and adjusted or unadjusted α values in for all analyses. The numbers in parentheses in panels C-G indicate the number of oocytes for each group. Bar values are mean ± SD in panels C–G with the individual points used to calculate each mean represented by solid symbols for H2O + Tris oocytes and open symbols for H2O + hCAII oocytes.
First, after each removal of CO2/, the pHi of H2O+Tris oocytes rises to the same value as before the introduction of CO2/, whereas pHi in H2O+hCAII oocytes rises to a more alkaline pHi after each CO2-induced acidification (Fig. 14A–C). These pHi overshoots (Boron & De Weer, 1976a) imply that—during the CO2/ exposure—acid extrusion is occurring—in H2O+hCAII but not in H2O+Tris oocytes. We can conclude that the injected hCAII is active because (a) the CO2-induced acidification rates were greater in the H2O+hCAII oocytes vs. H2O+Tris oocytes and (b) EZA eliminated this difference (Fig. 14D).
Second, the behavior of [Na+]i differs in the two groups of oocytes. The initial [Na+]i values trend higher in oocytes containing hCA II than in the Tris controls, although the differences are not significant (Fig. 14E and Statistics Table 14E). Note, however, that in the hCA II oocytes, [Na+]i is significantly higher at a3 than at a2. Far more striking is the behavior of [Na+]i during the CO2/ exposures. In Fig. 14B (H2O+hCAII), [Na+]i rises far more rapidly than in Fig. 14A (H2O+Tris). The mean data bear out this effect, as we see that (d[Na+]i/dt)max is 4- to 5-fold higher in H2O+hCAII oocytes than in H2O + Tris oocytes (Fig. 14F, striped vs. solid bars), and that EZA reduces this difference by ~70% (Fig. 14F, pre-EZA #2 vs. EZA for solid bars).
Statistics Table 14E.
for Figure 14E
| Initial [Na+]i | H2O+Tris | Initial [Na+]i | H2O+hCAII | Initial [Na+]i | H2O+Tris vs. H2O+hCAII |
|||
|---|---|---|---|---|---|---|---|---|
| Unadj. p | Adj. α | Unadj. p | Adj. α | Unadj. p | α | |||
| a1 vs. a2 | 0.013 | 0.025 | a1 vs. a2 | 0.005 | 0.025 | a2 | 0.075 | 0.050 |
| a2 vs. a3 | 0.035 | 0.050 | a2 vs. a3 | 0.007 | 0.050 | |||
Thus, hCA II activity (as indicated by (dpHi/dt)max values in Fig. 14D) correlates positively with (d[Na+]i/dt)max, raising the possibility that hCA II stimulates a native electrogenic NBC that imports Na+. However, I–V data reveal no difference in Gm that correlates with hCA II activity (Fig. 14G).
Fig. 15 is similar to Fig. 14 except that we inject bCA rather than hCA II. Because the experiment in Fig. 15A (H2O+H2O) lacks an NBC construct, it is a control for Fig. 10A (e1+H2O). Similarly, Fig. 15B (H2O+bCA) is a control for Fig. 9A (eGFP-e1+bCA) and Fig. 10B (e1+bCA). The results of these control experiments in Fig. 15 are basically the same as those in Fig. 14, except that whereas the stimulatory effects of bCA on (dpHi/dt)max (Fig. 15D) and of hCA II on (dpHi/dt)max (Fig. 14D) are both ~1.6-fold increase, the stimulatory effect of bCA on (d[Na+]i/dt)max is a 15-fold increase (Fig. 15F) vs. only a 5-fold increase for hCA II (Fig. 14F).
Figure 15: Injected bCA significantly enhances the CO2-induced increase in d[Na+]i/dt in H2O injected oocytes.

Recordings from control oocytes injected 4 days prior to recording with H2O (no NBCe1-A) and 1 day before recording with either A, 23 nl H2O or B, 50 ng bCA in 23 nl H2O observing the same protocol as in Fig. 7 and Fig. 14. C, The initial pHi immediately before successive CO2/ periods is not significantly different in the H2O injected oocytes. In bCA injected oocytes the initial pHi is significantly increased at point a2 vs. a1 but is not significantly different between points a2 and a3. D, bCA injected oocytes acidify significantly faster than H2O injected oocytes, and this activity is significantly inhibited by 10 μM EZA. E, [Na+]i significantly increases in bCA injected oocytes but not in H2O injected oocytes after each period in CO2/ solution and we observe during EZA perfusion a significant decrease in the F, d[Na+]i/dt for cells injected with bCA, but not those injected with H2O. We acquire I–V relationships during the recording of the data exampled in panels A and B for H2O injected oocytes plus 50 nl H2O and H2O injected oocytes plus 50 ng bCA. G, We measure no significant differences in Gm between successive periods in CO2/ or between H2O + H2O vs. H2O + bCA injected oocytes. For panels C–G, * denotes a significant difference from point a2 or period #2 by paired-samples t-test. Holm-Bonferroni analyses determine significance (α = 0.05, m = 2). † indicates that the measured a2 or period #2 means are significantly different between H2O + H2O vs. H2O + 50 ng bCA oocytes, as determined by an unpaired t-test with Welch’s correction (α = 0.05). Statistics Table 15C-G presents the unadjusted p-values and adjusted or unadjusted α values or all analyses. The numbers in parentheses in panels C-G indicate the number of oocytes for each group. Bar values are mean ± SD in panels C-G, with the individual points used to calculate each mean represented by solid symbols for H2O + H2O oocytes and open symbols for H2O + bCA oocytes.
From Fig. 14 and Fig. 15, we conclude that the activity of exogenous CA injected into Xenopus oocytes stimulates an electroneutral process that extrudes acid and takes up Na+ during CO2-induced intracellular acid loads.
Effect of ethyl-isopropyl amiloride (EIPA) on CA-stimulated increases in [Na+]i.
In 1992, Burckhardt & Frömter (Burckhardt et al., 1992) identified Na-H exchange as the principle endogenous acid-extrusion mechanism in Xenopus laevis oocytes. In 1998, Busch et al (Busch et al., 1998) cloned the cDNA for the Xenopus laevis oocyte Na-H exchanger XL-NHE. Our data in the previous section led us to hypothesize that the activity of injected, exogenous CA stimulates XL-NHE.
We test this hypothesis in Fig. 16 by injecting graded amounts of hCA II or bCA, and monitoring the rise in [Na+]i as we acid load the oocytes by an exposure to CO2/. For consistency with the experiments in Fig. 4–Fig. 10 and Fig. 13–Fig. 15, we Vclamp the oocytes at −40 mV during the recordings. For oocytes injected with either 50 ng or 300 ng hCA II or bCA, (dpHi/dt)max during CO2-induced acidifications is increased ~1.6-fold compared to control oocytes (Fig. 16G). Particularly in the oocytes injected with hCA II (Fig. 16B, C) or bCA (Fig. 16E, F), we see that, coincident with the application of CO2/, [Na+]i begins to rise—consistent with modest Na-H exchange. EIPA halts the [Na+]i rise, and—as particularly clear in Fig. 16B, F—the removal of EIPA allows the [Na+]i rise to resume. During this period, we do not see a concomitant rise in pHi because the acidifying effect of CO2 influx opposes the alkalinizing effect Na-H exchange (Boron & De Weer, 1976a). Busch et al report that 50 μM EIPA inhibits XL-NHE >90% (Busch et al., 1998). Adding this level of EIPA to the CO2/ solution markedly slows the rise in [Na+]i.
Figure 16: The activity of the endogenous Xenopus oocyte Na-H exchanger (XL-NHE) is modulated in a dose dependent manner by CA.

Recordings from control oocytes injected 4 days prior to recording with 9.2 nl H2O (no NBCe1-A) and 1 day before recording with either A, 50 nl 50 mM Tris buffer B, 50 ng hCA II or C, 300 ng hCA II dissolved in 50 nl Tris buffer or D, 23 nl H2O, E, 50 ng bCA, or F, 300 ng bCA dissolved in 23 nl H2O. Cells are acidified by switching from ND96 to 5% CO2/33 mM . After 5 min, 50 µM EIPA is introduced to the 5% CO2/33 mM solution in the bath. Panel B displays a 10 min ND96 washout step, followed by a second CO2-induced acidification to show that the EIPA block is reversible. In panel C, EIPA block reverses when we switch the bath solution back to 5% CO2/33 mM . In panel F, we also present a second application of 50 µM EIPA to demonstrate that the increase in [Na+]i on starting the second CO2-induced acidification is still attributable to XL-NHE. G, Both hCA II and bCA significantly enhance (dpHi/dt)max during CO2-induced acidifications but the magnitude of the enhancement is not significantly different between oocytes injected with either 50 ng or 300 ng of hCA II or bCA (Statistics Table 16G). H, Both hCA II and bCA enhance (d[Na+]i/dt)max in a concentration dependent manner. The Na+-influx could be completely inhibited by 50 µM EIPA in all cases. For panels G & H, † indicates that the measured means are significantly different between H2O or Tris injected oocytes vs. 50 ng hCA II and 300 ng hCA II injected oocytes, or vs. 50 ng bCA and 300 ng bCA respectively as determined by an unpaired t-test with Welch’s correction. ‡ indicates a significant difference between the mean for 50 ng vs. 300 ng from hCA II or bCA injected oocytes. Holm-Bonferroni analyses determine significance (α = 0.05, m = 3, Statistics Table 16H part I). For panel H, paired-samples t-test determine the significance of the differences between mean (d[Na+]i/dt)max pre- and post EIPA perfusion in each injection. * denotes a significant difference as determined by the Holm-Bonferroni method (α = 0.05, m = 6, Statistics Table 16H part II). The numbers in parentheses in panel G and H indicate the number of oocytes for each group. Bar values are mean ± SD in panel G & H with the individual points used to calculate each mean represented by solid symbols for +Tris or +H2O oocytes and open symbols for +hCA II or + bCA oocytes.
As summarized in Fig. 16H, we see (d[Na+]i/dt)max is significantly > 0, even in Tris and H2O oocytes. Moreover, EIPA eliminates most of this accumulation. Injecting 50 ng of hCA II produces a ~2-fold increase in (d[Na+]i/dt)max, and 300 ng a ~4-fold increase. However, injected bCA has a stronger effect on (d[Na+]i/dt)max than hCA II. 50 ng of bCA produces a ~3.5-fold (d[Na+]i/dt)max increase and 300 ng bCA a ~5-fold increase. Even after large bCA stimulations, EIPA reduces (d[Na+]i/dt)max to about the same level as in Tris and H2O oocytes (Fig. 16H, cyan bars). These results indicate that both recombinant hCA II and purified bCA can potentiate XL-NHE activity. Finally, the block by EIPA appears to be reversible, as illustrated by the effect of a 10-min washout period followed by second CO2-induced acidification (Fig. 16B and F) or an immediate switch back to CO2/ solution without EIPA (Fig. 16C).
In conclusion, Fig. 16 shows that during CO2/ perfusion, hCA II or bCA increase (d[Na]i/dt)max in oocytes not expressing NBCe1-A in a dose dependent manner. EIPA reversibly inhibits this increase, indicating that it is mediated by XL-NHE.
Elimination of bCA-activity–dependent changes in NBCe1-A function during inhibition of XL-NHE
Having determined that the injection of exogenous CA increases the activity of XL-NHE, we next investigated whether it is this stimulation that is responsible for the observed bCA-dependent changes in (d[Na+]i/dt)max and ΔIm in oocytes expressing e1 presented in Fig. 10. For the experiments summarized in Fig. 17, we injected 50 ng bCA into oocytes injected 3 days earlier with 1.5 ng/oocyte cRNA encoding e1. Our protocol was similar to that described for Fig. 10, except that all extracellular solutions contained 50 μM EIPA to inhibit XL-NHE. Under these conditions, the EZA decreases (dpHi/dt)max during the delivery of CO2/ (Fig. 17C), indicating significant inhibition of bCA activity. However, unlike the situation in Fig. 10F and G (no EIPA present), in Fig. 17 (XL-NHE blocked by EIPA) EZA reduced neither (d[Na+]i/dt)max (Fig. 17E) nor ΔIm (Fig. 17F). On the other hand, like the situation in Fig. 10H and I, EZA in EIPA-treated oocytes had no significant effect on either Gm (Fig. 17H) or GNBC (Fig. 17I).
In summary, Fig. 17 shows that, with XL-NHE blocked by EIPA, the CA blocker EZA no longer reduces (d[Na+]i/dt)max or ΔImin NBCe1-A-expressing oocytes, even when employing a B&D-like protocol to record signals. Of course, regardless of whether or not we add EIPA to block XL-NHE, EZA never reduces Gm or GNBC. Thus, Fig. 17 confirms that bCA activity does not influence NBCe1-A activity, and also confirms that the ability of bCA to enhance [Na+]i kinetics requires the presence of an active NHE.
Discussion
How bCA, by stimulating XL-NHE, can increase [Na+]i and (d[Na+]i/dt)max, and can produce ΔIm changes that mimic INBC changes
According to the NBCe1/CA II metabolon hypothesis, intracellular CA molecules—either directly or indirectly associated with NBCe1 molecules—modulate []is and thereby enhance transporter activity by providing or consuming substrate. Although some reports conclude that carbonic anhydrases (CAs) can increase NBCe1 intrinsic activity (Gross et al., 2002; Becker & Deitmer, 2007; Schueler et al., 2011; Villafuerte et al., 2014), others do not (Lu et al., 2006; Yamada et al., 2011). Refined attempts to confirm direct binding of CA II to the Ct of Na+-coupled bicarbonate transporters (NCBTs) have proven negative (Piermarini et al., 2007). Moreover, even when fused to the Ct of NBCe1-A, CA II fails to enhance NBCe1-A activity as assessed by GNBC (Lu et al., 2006).
The purpose of the present paper is to resolve a discrepancy as to why our laboratory appeared to find that CA II does not increase GNBC (Lu et al., 2006), whereas another laboratory later appeared to find that CA I, CA II and CA III are each capable of enhancing the intrinsic activity of NBCe1-A heterologously expressed in Xenopus oocytes (Becker & Deitmer, 2007; Schueler et al., 2011). We therefore systematically investigated technical differences between the approaches of two groups. Both heterologously expressed NBCe1-A in Xenopus laevis oocytes, directly measured electrical current by TEVC, and recorded changes in pHi using ion-selective microelectrodes. However, in several respects, the reagents, protocols, and analyses were different, as noted in Table 1. In the present paper, we make four major groups of observations:
First, we demonstrate that hCA II does not stimulate NBCe1-A. Whether the hCA II is (a) recombinantly expressed, purified, and then injected into the cytosol of eGFP-e1 expressing oocytes, or (b) tethered to NBCe1-A (i.e., eGFP-e1-CAII), neither the Lu-like protocols used in Fig. 2, Fig. 3, and Fig. 4 nor the B&D-like protocols in Fig. 5, Fig. 6, and Fig. 7 evoke significant or substantial differences in GNBC due to hCA II. Moreover, we find that neither increasing the duration of the TEVC step, nor increasing the magnitude of the electrochemical driving force (Vm – Erev) makes NBCe1-A sensitive to hCA II.
Second, in e1-expressing oocytes, we find—using a B&D-like acquisition protocol—that EZA produces statistically significant reductions in (d[Na+]i/dt)max (see Fig. 10F) and ΔIm (see Fig. 10G), similar to those changes reported by B&D. However, we observe these reductions only when we express wild-type e1 (i.e., not tagged with eGFP) and subsequently inject bCA (i.e., not recombinant hCA II). However, this apparently positive result is illusory because, even under the above conditions, we observe no bCA-dependent changes in GNBC using either a B&D-like protocol (Fig. 11D) or Lu-like protocols (Fig. 12). Therefore, the (d[Na+]i/dt)max and ΔIm reductions that we observe in the presence of EZA cannot reflect decreases in NBCe1-A activity.
Injecting hCA II in place of bCA into e1-expressing oocytes does not result in a substantial or significant CA-dependent change in GNBC, (d[Na+]i/dt)max, or ΔIm data acquired using a B&D-like protocol (Fig. 13). The observation that bCA produces a greater effect than hCA II on ΔIm is consistent with our observation that bCA is more effective than hCA II in stimulating XL-NHE, as discussed beginning in the next paragraph.
Third, in oocytes not expressing NBCe1-A, CAs stimulate an endogenous XL-NHE. In Fig. 14 and Fig. 15, we show that exposure to CO2/ triggers an increase in [Na+]i, but only if we previously had injected the oocytes with hCA II (Fig. 14E) or bCA (Fig. 15E). Indeed, the CO2/-induced (d[Na+]i/dt)max is greater in oocytes injected with either hCA II (Fig. 14F) or bCA (Fig. 15F) than in oocytes lacking exogenous CA, and EZA reverses these effects. In Fig. 16 we use EIPA to identify the target of the CA-mediated stimulation as the endogenous XL-NHE (Busch et al., 1998). Both the hCA II and bCA preparations stimulate XL-NHE in a dose-dependent manner but, quantitatively, the bCA preparation is more effective in stimulating XL-NHE (Fig. 16H). We propose that the CO2-induced acidification activates XL-NHE—itself stimulated by CA—and thereby causes both a rise in initial [Na+]i (compare a1 vs. a2 vs. a3) and an increase in (d[Na+]i/dt)max, even in the absence of NBCe1-A.
Fourth, in oocytes overexpressing e1, XL-NHE activity underlies the bCA-dependent changes that we can observe in ΔIm and (d[Na+]i/dt)max. In the periods immediately following CO2/-removal from the bath, NBCe1-A immediately starts to operate in reverse, due to a near-infinite outward gradient for and , and as a result NBCe1-A mediates net Na+ efflux. On the other hand, CO2/ removal ought not to reverse XL-NHE. Thus, we are not surprised that that [Na+]i tends to drift upward from just before the first CO2/ exposure (a1 in Fig. 10E) to just before the second (a2) to just before the third (a3). Moreover, this drift is more pronounced in the presence (solid bars) than in the absence (hatched bars) of bCA. This difference presumably reflects the enhanced contribution of XL-NHE to Na+ influx throughout the experiment. Indeed, Fig. 17D shows that blocking XL-NHE with EIPA prevents the upward [Na+]i drift from points a1 to a2 to a3 even though bCA is present. We conclude that bCA stimulates XL-NHE, which is necessary for the upward [Na+]i drift.
Three minor points remain unresolved. First, our NBCe1-A currents are larger than those of B&D. Even when we inject only 1/10th as much cRNA, we observe currents 4-fold larger. We are concerned that, with even lower injected amounts of cRNA, expression would become less consistent and background currents would begin to represent an unacceptably large fraction of total current (i.e., background + INBC).
Second, unlike B&D, we do not observe that CAs produce a statistically significant increase ΔIm. We believe that CAs really do increase ΔIm but that we do not have the statistical power to observe the phenomenon because of subtle differences in the properties of the oocytes or the injected CAs. Indeed, we can detect the inhibitory effect of CA inhibitors on ΔIm (Fig. 10G).
Third, although we could never detect an inhibitory effect of EZA on GNBC, we could––like B&D—detect an inhibitory effect of EZA on ΔIm, but only with bCA on the untagged e1. Below, we address the potential importance of bCA vs. hCA II. It is possible that the tag at the Nt of eGFP-e1 interferes with the ability of bCA to bind to XL-NHE. In salamander proximal tubules, the basolateral membrane has high activities of both electrogenic Na/HCO3 cotransport (Boron & Boulpaep, 1983a) and Na-H exchange (Boron & Boulpaep, 1983b). In mammalian proximal tubules, NBCe1-A and NHE1 are both present in the basolateral membrane (Biemesderfer et al., 1992; Schmitt et al., 1999; Maunsbach et al., 2000). If NBCe1-A and NHE1 physically interact in the basolateral membrane, then it is possible that an eGFP tag at the NBCe1-A Nt could prevent bCA from binding to a site on XL-NHE (see last section of Discussion for a consideration of CA binding to NHEs).
In conclusion, we hypothesize that the reason that EZA significantly reduces ΔIm in Fig. 10G is not that the blockade of bCA inhibits NBCe1-A activity per se. In fact, our data show that GNBC is unaffected by bCA (Fig. 11D, Fig. 12B) or by the blockade of bCA by EZA (Fig. 9I, Fig. 11D, Fig. 12B). Although EZA does indeed attenuate the bCA-dependent stimulation of XL-NHE, this attenuation can have no direct effect on ΔIm because XL-NHE is electroneutral. Rather, we propose that, by the time we reach point a3 (which happens to be in the presence of EZA) in Fig. 10B, the bCA-stimulated XL-NHE has raised [Na+]i significantly (compare a1 vs. a2 vs. a3 for three bars on right in Fig. 10E) and shifted the Erev for INBC in the positive direction—closer to the holding potential of –40 mV. Even though GNBC—the most direct measure of NBCe1 activity—is unaffected by bCA, the positive shift in the INBC-Vm plot (i.e., in Erev) reduces the driving force for NBCe1-A (Vm – Erev), and thus reduces ΔINBC, and as a result, reduces ΔIm. We find that, in protocols in which the upward drift of [Na+]i is not significant from a1 to a2 to a3, (as observed in the absence of exogenous CA activity or with inhibition of XL-NHE by EIPA), then neither are the differences in ΔIm significant when recorded immediately after a1, a2, and a3, (Fig. 7E & G, Fig. 9D & F and Fig. 13D & F). Thus, the fundamental difference between the analyses of Lu and the present study on the one hand and those of B&D and Schueler et al. (2011) on the other is that the former are based on a parameter (GNBC) that directly reports NBCe1-A activity, whereas the latter analyses are based on a parameter (i.e., ΔIm) that is under the influence of factors other than NBCe1-A activity.
Potential differences in characteristics of Xenopus oocytes
Although Xenopus oocytes are a well-established model system for the expression and characterization of electrogenic membrane proteins, physiological parameters can vary significantly among oocytes from different colonies of frogs (Dascal, 1987; Tzounopoulos et al., 1995), presumably reflecting differences in Xenopus husbandry. Moreover, collagenase treatment (Dascal et al., 1984), the heterologous expression of specific membrane proteins (Tzounopoulos et al., 1995), and the season of the year (Dascal et al., 1984; Dascal, 1987) can all affect various aspects of oocyte physiology. Thus, we should not be surprised by quantitative differences between the data of Lu and those of the present paper vs. those of B&D and Schueler et al. (2011). Nevertheless, after changing only one substantive aspect of our protocol—the introduction of a CO2/ pre-pulse pulse to minimize the pHi difference between points a2 and a3 in experiments like that in Fig. 10A & B—we were able to reproduce the salient features of B&D and Schueler et al. (2011). Quantitatively, three parameters are substantially different between our results and those of B&D and Schueler et al. (2011) : (a) The absolute value of (d[Na+]i/dt)max is substantially less in the present study. (b) The fraction of (d[Na+]i/dt)max blocked by EZA is substantially smaller in in the present study (compare our Fig. 10 with figure 4 in Becker & Deitmer, 2007). And (c) ΔIm is substantially greater in the present study (Fig. 10). The larger ΔIm in the present study almost certainly reflects a much greater expression of NBCe1-A, whereas the smaller d[Na+]i/dt values could reflect a lower expression of XL-NHE (or other membrane proteins besides NBCe1-A).
Differences in sources of carbonic anhydrases
In the present study, we augment cytosolic CA activity in three ways. The first two involve introducing hCA II either (a) fused to the Ct of eGFP-e1, or (b) recombinantly expressed, affinity-purified and injected into oocytes. In both cases, the hCA II greatly accelerates CO2–induced changes in pHi. However, in neither case does hCA II modulate any aspect of NBCe1-A function under the conditions of our experiments.
Our third approach for augmenting cytosolic CA activity is to inject bCA. We find that injected bCA is more potent than hCA II in producing effects on [Na+]i and ΔIm. One possible explanation for this difference in the nature of the preparations. The human CA II for injection, we produced as a recombinant protein in E. coli, followed by affinity purification. The bCA is a commercial mixture of CA I (the dominant form) and CA II purified from bovine RBCs.
The two injected CA preparations could also differ in specific activity. The injected hCA II and bCA produce—at a dose of 50 ng—nearly identical increases in (dpHi/dt)max during CO2-induced acidifications compared to controls (Fig. 14D, Fig. 15D, Fig. 16G). This effect already appears to be saturated at 50 ng, inasmuch as 300-ng doses of injected hCA II or bCA produce no further increases in (dpHi/dt)max (Fig. 16G). Thus, these pHi data do not rule out a difference in enzymatic specific activity. However, when we examine effects on (d[Na+]i/dt)max, we see that even when the pHi effects are saturating (Fig. 16G), the [Na+]i effects tend to increase with the amount of injected hCA II or bCA (Fig. 16H). Moreover, we observe a trend—though not consistently statistically significant—for hCA II to produce greater pHi effects, and for bCA to produce greater [Na+]i effects (Fig. 16G vs. H). Thus, the [Na+]i effects of hCA II and bCA presumably reflect more than just carbonic anhydrase activity per se.
Differences in inhibition of carbonic anhydrases by EZA protocols
In Fig. 2, Fig. 3 and Fig. 12, using a Lu-like protocol, we achieve near-complete blockade of CA activity, as evidenced by the reduction in (dpHi/dt)max, by incubating the oocytes for 3 h in 400 μM EZA. In Fig. 6–7, Fig. 9–10, Fig. 13–15, and Fig. 17, using B&D-like protocols, we achieve a far-less complete blockade of injected CA when we superfuse oocytes for 10 min with 10 μM EZA. This EZA-superfusion protocol only produces near-complete blockade when we tether the CA to the NBCe1-A Ct, using the eGFP-e1-CAII construct (Fig. 5). In this case, the CA is largely restricted to the vicinity of the plasma membrane, and thus within easy access of low-dose extracellular EZA. Therefore, unlike a long exposure to high-dose EZA, a short exposure to low-dose EZA leaves unblocked a substantial fraction of the injected CA, which distributes widely throughout the cytosol.
Theoretical evaluation of NBCe1-CA metabolon models
In Xenopus oocytes heterologously expressing NBCe1, the protein mediates the influx of one Na+ and the equivalent of two ions (Sciortino & Romero, 1999; Parker & Boron, 2013). To address the question of how cytosolic CA would influence NBCe1 operating in an inward direction, we must distinguish between (a) a model in which NBCe1 mediates the influx of 1 Na+ and 2 ions vs. (b) an alternate model in which NBCe1 mediates either the influx of 1 Na+ and 1 ion or 1 ion pair.
Influx of 1 Na+ + 2 .
The uptake of 1 Na+ and 2 ions will lead to increase in [Na+] and [] at the intracellular surface of the membrane. Although kinetic data are available that describe the apparent affinities of NBCe1—operating in the inward direction—for extracellular Na+ and (Boron, 1985; Grichtchenko et al., 1999; Sciortino & Romero, 1999; McAlear et al., 2006), we lack such kinetic data for the cytosolic side of NBCe1, and thus simply do not know how the hypothetical build-up of these ions at the inner surface of the membrane at would affect net inward cotransport by NBCe1.
The newly arriving Na+ simply diffuses away into the bulk intracellular fluid (bICF). However, the newly arrived at the inner surface has three fates. It can (a) diffuse into the bICF; (b) combine with an H+—sourced almost exclusively from non- buffers—to form CO2 and H2O, which must in turn diffuse from the inner surface; or (c) lose a proton to form , which would diffuse from the inner surface either as or a Na+ or Mg++ ion pair. A cytosolic CA would accelerate only path ‘b’, and we will now show how this acceleration would have only a minor effect at physiological pHi.
Imagine that the pKa of the CO2/ equilibrium is 6.1 and that pHi is 7.1. As first described by Boron & De Weer, (1976a), of the newly arriving at the inner surface, a fraction α would convert to CO2, and a fraction (1–α) would remain :
In other words, only 10% of the newly arriving would—at equilibrium—convert to . The actual % is actually slightly less because pHi rises during the formation of the CO2. Cytosolic CA can speed the reaction + H+ → CO2 + H2O, but the enzyme cannot change the fundamental thermodynamic principle that a maximum of only ~10% of the incoming can form CO2, even at a catalytic acceleration of ∞. The actual % must be less. Of course, at lower pHi values, the maximal conversion would be correspondingly higher, but at higher pHi values, the maximum possible conversion of to CO2 would be even less than ~10%. B&D do not report absolute pHi or [H+]i values, but only Δ[H+]i; they do report that the mean pHi of CA-injected oocytes was 7.35. Our initial pHi values were similar. In our Fig. 10B, for example, pHi is ~7.4. Here, α (i.e., the maximum possible conversion → CO2) would be only ~5%.
Confounding the small fraction of newly arriving that can possibly convert to CO2 is an unfavorable combination of diffusion constants. The diffusion constant for in water (DHCO3) is ~0.8 × 10⁻⁵ cm2/s (Swietach et al., 2003)), whereas that for CO2 (DCO2) is only slightly higher, ~1.1 × 10⁻⁵ cm2/s (Poling et al., 2001)). Thus, the CA-catalyzed conversion of generates a solute (i.e., CO2) with only a slightly greater diffusion constant.
A final confounding factor is the high prevailing []i/[CO2]i ratio, 10:1 at pHi 7.1 and 20:1 at pHi 7.4. Even with a catalytic acceleration of ∞, the CO2 concentration gradient from the inner surface of the membrane to the bICF would only be 10% or even 5% as large as that for . As a result, converting the incoming carbon from to CO2 would slow the diffusion of this carbon away from the membrane by a very large factor. Note this unfavorable scenario outlined for the conversion of newly arriving to CO2 is the opposite for the highly favorable effect of converting newly arriving CO2 to (e.g., in a red blood cell). Here, the action of cytosolic CA converts the incoming carbon from a low-concentration/low-gradient solute to a high-concentration/high-gradient solution, and greatly accelerates carbon diffusion.
Note that the presence of CA near the membrane of a -uptake mechanism could have a potentially deleterious effect because the CA would tend to raise pH in the cytosolic nanodomains near the transporter, and this could negatively impact the function of NBCe1 and other membrane proteins.
In summary, our theoretical analysis shows that if NBCe1 were to cotransport 1 Na+ and 2 , we would not expect the addition of cytosolic CA to have a substantial effect because (a) the CA catalyzes the conversion of a very small % of newly arriving , (b) the CO2 does not provide a substantial advantage in diffusion constant, and (c) the CO2 concentration gradient driving diffusion is a small fraction of the gradient for .
The above analysis addresses only CA as an enzyme catalyzing the interconversion of CO2 and , and not the binding of a CA to transporter or a regulatory molecule. Our analysis for the anticipated effects of CA on a hypothetical NBC carrying into a cell applies equally well to a Cl-HCO3 exchanger carrying into a cell. A theoretical analysis of the reverse process (i.e., transporting out of the cell) would lead to comparable results (i.e., a cytosolic CA would have little effect).
Carbonate as the substrate.
Kinetics data from the squid giant axon (Boron & Russell, 1983; Boron, 1985; Boron & Knakal, 1989, 1992) and preliminary data from NCBTs expressed in Xenopus oocytes (Grichtchenko & Boron, 2002a, 2002b) and other preliminary data from our group on NBCe1-A (Moss et al., 2014) are all consistent with the hypothesis that the rate-limiting step for these transporters is the approach to (or departure from) the transporter by the ion pair (Na+ + ⇌ ). Regardless of whether the transported species are 1 Na+ and 1 ion or a single ion pair, the uptake will lead to increases in [Na+], [], and [] at the intracellular surface of the membrane.
As in the case of the 1 Na+/2 model, the newly arriving Na+ simply diffuses away into the bICF. Any newly arriving has three fates. It can (a) diffuse into the bICF; (b) combine with an H+ to form , which must in turn diffuse from the inner surface; or (c) combine with Na+ or Mg2+ to form ion pairs, which in turn would diffuse from the membrane. Note that ‘c’ is far more important than ‘a’ because the sum of [] and [MgCO3] is an order of magnitude greater than [].
Any newly arriving has two fates. It can (a) diffuse into the bICF or (b) dissociate to form Na+ and . The , as noted above, could either diffuse away, react with H+ for form , or form an ion pair with Mg2+.
Regardless of whether it is Na+ + or the pair that dominantly diffuses away from the cytosolic surface of NBCe1-A, the dominant pathway for newly appearing will be the reaction + H+→ —with the H+ being sourced from both non- buffers and from the reaction CO2 + H2O → + H+. Because the pKa of the / reaction is approximately 2 pH units above physiological pHi values (i.e., α in the above equation is ~1%, and 1–α is ~99%), and because of the presence of non- buffers, we predict that the conversion of to has practically no dependence on cytosolic CA. The role of added CA is not to enhance the conversion, but to minimize the alkalinization of the nanodomain near the NBCe1-A. Mathematical models also indicate that CA activity should not substantially modulate either or fluxes via SLC4 transporters when the enzyme is restricted to the intracellular surface (Gros et al., 2010; Al-Samir et al., 2013). Indeed—consistent with theory—the data of both Lu et al. (2006) and Yamada et al. (2011), as well as the data in the present investigation (Fig. 3, Fig. 12, Fig. 13, Fig. 17) reveal no measurable dependence of NBCe1-A current (or GNBC)—a direct measure of transporter activity—on cytosolic CA.
The above arguments, which revolve around the enzymatic activity of CAs, apply equally well, not to just NBCe1-A, but to all NBCe1 variants. However, it is possible that a CA could stimulate other NBCe1 variants via allosteric interactions with the alternative Nt (which in turn would interact with the cytosolic activator protein IRBIT (Shirakabe et al., 2006; Yang et al., 2009; Lee et al., 2012; Lee & Boron, 2018) or the alternative Ct.
Reports of functional upregulation of NBCe1 by CA in cardiac myocytes
Others, monitoring rates of changes of pHi, have concluded that cytosolic CAs (Sterling et al., 2001) or CA II directly fused to the cytosolic C terminus of the transporter (Sowah & Casey, 2011) enhances the activity of the Cl-HCO3 exchanger AE1. Villafuerte et al. (2014) used a similar approach to reach similar conclusions for the effects of cytosolic CAs on NBC activity in cardiac myocytes. An additional complication of the native cardiac myocyte preparation is that NBC activity represents a combination of fluxes mediated by NBCe1 (De Giusti et al., 2011) and NBCn1 (Garciarena et al., 2013). However, fundamental problems with the approach of using pHi recordings to detect a potential stimulation of a transporter by cytosolic CAs are that (a) the measured production/consumption of cytosolic H+ only indirectly reflects the -transport event, and (b) the critical reaction that links the arrival of in cytosol to changes in pH is itself catalyzed by CAs. Musa-Aziz et al. (2014a, 2014b) and Occhipinti et al. (2014) coined the term “cis-side” to describe the complex situation in which one manipulates CA activity on the same side of the membrane on which pH is measured. They performed extensive simulations based on a reaction-diffusion model and concluded that one cannot draw intuitive conclusions in a cis-side CA/-transporters system—like those in the aforementioned AE1 and NBC experiments. Conclusions are difficult even with sophisticated mathematical modeling because the cytosolic CA can greatly accelerate the pHi changes that one measures, even without an intrinsic change in -transport rate.
In the paper by Villafuerte et al. (2014), the authors used the ammonium-prepulse technique (Boron & De Weer, 1976a, 1976b) to impose an acute intracellular acid load in cardiac myocytes in which they had blocked Na-H exchange with dimethylamiloride. They observed that inhibition of cytosolic CAs with acetazolamide (ACZ) markedly slows the pHi recovery. However, as noted above, even without inhibiting NBC activity, ACZ would have slowed conversion of the / signal to the observed rate of pHi change. In experiments in which they blocked Na-H exchange and depolarized with high [K+]o to stimulate NBCe1, they used a twin-pulse protocol of acetate/acetic acid to twice acid load the cells, first without and then with ACZ. They found that ACZ slowed the rise in [Na+]i by ~40%, consistent with a direct negative effect of CA inhibition on NBC activity. However, the lack of a clean [Na+]i baseline and the absence of control experiments (twin pulses without ACZ) makes it difficult to reach conclusions.
Stimulation of XL-NHE by hCA II and bCA
Although the cis-side principle precludes one from reaching definitive conclusions regarding effects on or transport activity when measuring pH on the same side of a membrane as a CA, the situation is very different with proteins that transport acid-base equivalents other than or . In such cases, CO2/ tends to buffer the pH changes produced by the production/consumption of (for example) H+, and the introduction of CAs would enhance the speed of such buffering. The result would be a tendency of the CA to slow cis-side pH changes. Thus, the CA-induced acceleration of pHi changes, even in a cis-side system, can yield valuable insight, such as in the stimulation of NHE1 by cytosolic CA II (Li et al., 2002, 2006; Jaquenod De Giusti et al., 2019) and NHE3 (Krishnan et al., 2015). In the present study, we employ three measures other than dpHi/dt for assessing the effect of CAs on NHE activity. First, we find that bCA causes a sequential upward drift of [Na+]i after repeated CO2/ pulses (see a1 vs. a2 vs. a3 in Fig. 15E). Second, we find that hCA II (Fig. 14F) and bCA (Fig. 15F) each cause substantial increases in (d[Na+]i/dt)max during CO2/ pulses. Third, we find that hCA II (Fig. 14C) and bCA (Fig. 15C) each enhance the pHi overshoot (compare a2 vs. a1, or a3 vs. a2) after removal of CO2/. Such overshoots are evidence of net acid extrusion during the preceding CO2/ exposure (Boron & De Weer, 1976a).
We suggest four mechanisms by which hCA II and bCA stimulate XL-NHE. First, the catalytic activity of CAs could promote the facilitated diffusion of H+ to/from the transporter (Spitzer et al., 2002; Occhipinti & Boron, 2019). Second, the CA could bind directly to XL-NHE and produce an allosteric stimulation that is independent of CA catalytic activity. Third, stimulation of XL-NHE by CAs could be a combination of the first two mechanisms, as suggested for CA-dependent stimulation of mammalian NHE1 (Li et al., 2002, 2006) and NHE3 (Krishnan et al., 2015). Fourth, the CAs could act as (non-catalytic) H+ antennae (Adelroth & Brzezinski, 2004; Brändén et al., 2006).
Regarding the first three mechanisms, the XL-NHE (NP_001081553) is ~80% identical to human (NP_003038), mouse (NP_058677) and rat (NP_036784) NHE1, but only ~40% identical to human NHE3 (NP_004165). Li et al. (2006) report that the Ct residues 790RIQRCLSDPGPHP802 in human NHE1 (residues 795–807 in mouse and rat), and particularly residues S796 and D797 are critical for CA II binding to NHE1. In the NHE3 Ct, Krishnan et al. (2015) report that 710IKEKDLELSDTEE722 are important for binding CA II. In XL-NHE, the corresponding motif is 749RLQRCLSDPGPHP761, which differs from the mammalian motif only with the substitution of leucine for isoleucine Therefore, it is reasonable to hypothesize that CAs injected into oocytes could stimulate XL-NHE by interacting at this site.
Regarding the fourth (H+ antenna) mechanism, Becker et al. have proposed that CA II stimulates MCT1 and MCT4 as E69 and N72 of CA II mediate H+-exchange with the ‘EEE’ cluster of the MCT Ct (Becker et al., 2011; Noor et al., 2015, 2018). Moreover, this group proposes that the proton-shuttle residue H64 of CA II mediates binding between CA II and the ‘EEE’ motif of MCT (Noor et al., 2015, 2018). Interestingly, the XL-NHE Ct contains two ‘EEE’ motifs—608EEE610 and 718EEE720—that are conserved in human, mouse and rat NHE1.
Supplementary Material
Statistics Table 1.
for Figure 1
| Panel C | Surface expression normalized to e1A | Panel D | Total expression | Panel E | GNBC normalized to surface expression | |||
|---|---|---|---|---|---|---|---|---|
| Unadj. p | Adj. α | Unadj. p | Adj. α | Unadj. p | Adj. α | |||
| eGFP-e1 vs. eGFP-e1-CAII | 0.308 | 0.017 | eGFP-e1 vs. eGFP-e1-CAII | 0.294 | 0.017 | e1 vs. eGFP-e1-CAII | 0.476 | 0.017 |
| e1 vs. eGFP-e1 | 0.441 | 0.025 | e1 vs. eGFP-e1-CAII | 0.619 | 0.025 | e1 vs. eGFP-e1 | 0.736 | 0.025 |
| e1 vs. eGFP-e1-CAII | 0.791 | 0.050 | e1 vs. eGFP-e1 | 0.758 | 0.050 | eGFP-e1 vs. eGFP-e1-CAII | 0.994 | 0.050 |
Statistics Table 2.
for Figure 2
| Panel B (black bars) |
GNBC | Panel B | Pre EZA vs. Post 3 h EZA | Panel D | (dpHi/dt)max | ||
|---|---|---|---|---|---|---|---|
| Unadj. p | Adj. α | Unadj. p | Adj. α | Unadj. p | |||
| 60 ms vs. 30 s | 4.451×10⁻¹¹ | 0.017 | 1 s | 0.436 | 0.017 | eGFP–e1 vs. eGFP–e1–CAII | 7.458×10⁻⁴ |
| 1 s vs. 30 s | 1.365×10⁻⁷ | 0.025 | 30 s | 0.619 | 0.025 | eGFP–e1–CAII Pre EZA vs. Post 3 h EZA | 4.193×10⁻⁴ |
| 60 ms vs. 1 s | 7.302×10⁻⁷ | 0.050 | 60 ms | 0.812 | 0.050 | ||
Statistics Table 3.
for Figure 3
| Panel B (comparing duration) | GNBC | GNBC Pre EZA vs. 3 h Post EZA | Panel B (comparing ±CA) | GNBC eGFP-e1 + Tris vs. eGFP-e1 + hCAII | Panel D (comparing pre/post EZA for dpHi/dt) | (dpHi/dt)max | |||||||
|---|---|---|---|---|---|---|---|---|---|---|---|---|---|
| Unadjusted p | Adj. α | Unadjusted. p | Adj. α | ||||||||||
| eGFP-e1 + Tris |
eGFP-e1 + hCAII |
Protocol | eGFP-e1 + Tris |
Protocol | eGFP-e1 + hCAII | Unadj. p | Adj. α | Unadj. p | |||||
| 60 ms vs. 30 s | 6.566×10⁻⁹ | 8.189×10⁻⁹ | 0.017 | 60 ms | 0.471 | 1 s | 0.098 | 0.017 | 30 s | 0.094 | 0.017 | eGFP-e1 + Tris vs. eGFP-e1 + hCAII | 6.528×10⁻⁵ |
| 60 ms vs. 1s | 6.163×10⁻⁸ | 2.661×10⁻⁷ | 0.025 | 1 s | 0.509 | 30 s | 0.210 | 0.025 | 1 s | 0.262 | 0.025 | eGFP-e1 + hCAII Pre EZA vs. Post 3 h EZA | 1.281×10⁻⁴ |
| 1s vs. 30 s | 0.005 | 0.035 | 0.050 | 30 s | 0.590 | 60 ms | 0.966 | 0.050 | 60 ms | 0.268 | 0.050 | ||
Statistics Table 4.
for Figure 4
| (dpHi/dt)max acidification | ΔIm | (dpHi/dt)max recovery | GNBC eGFP-e1 +Tris vs +hCAII | ||||||||
|---|---|---|---|---|---|---|---|---|---|---|---|
| Unadj. p | Adj. α | Unadj. p | Adj. α | Unadj. p | Adj. α | Unadj. p | Adj. α | ||||
| eGFP-e1+Tris vs. +hCAII | 1.962×10⁻⁵ | 0.025 | H2O+Tris vs. +hCAII | 0.258 | 0.025 | H2O+Tris vs. +hCAII | 0.327 | 0.025 | IV#2 | 0.507 | 0.017 |
| H2O +Tris vs. +hCAII | 0.009 | 0.050 | eGFP-e1+Tris vs. +hCAII | 0.750 | 0.050 | eGFP-e1+Tris vs. +hCAII | 0.780 | 0.050 | IV#3 | 0.759 | 0.025 |
| IV#1 | 0.760 | 0.050 | |||||||||
Statistics Table 5C.
for Figure 5C
| Initial pHi | a1 vs. a2 | Initial pHi | eGFP-e1 vs. eGFP-e1-CAII | ||
|---|---|---|---|---|---|
| Unadj. p | Adj. α | Unadj. p | Adj. α | ||
| eGFP-e1 | 0.037 | 0.025 | a2 | 0.498 | 0.025 |
| eGFP-e1-CAII | 0.505 | 0.050 | a1 | 0.880 | 0.050 |
Statistics Table 5D.
for Figure 5D
| (dpHi/dt)max | Pre EZA vs. +10 μM EZA | (dpHi/dt)max | eGFP-e1 vs. eGFP-e1-CAII | ||
|---|---|---|---|---|---|
| Unadj. p | Adj. α | Unadj. p | Adj. α | ||
| eGFP-e1-CAII | 0.005 | 0.025 | Pre EZA | 0.002 | 0.025 |
| eGFP-e1 | 0.967 | 0.050 | +10 μM EZA | 0.930 | 0.050 |
NB unadjusted p for eGFP-e1 vs. (eGFP-e1-CAII + EZA) = 0.923
Statistics Table 5E.
for Figure 5E
| ΔIm | Pre EZA vs. +10 μM EZA | ΔIm | eGFP-e1 vs. eGFP-e1-CAII | ||
|---|---|---|---|---|---|
| Unadj. p | Adj. α | Unadj. p | Adj. α | ||
| eGFP-e1 | 0.067 | 0.025 | +10 μM EZA | 0.869 | 0.025 |
| eGFP-e1-CAII | 0.239 | 0.050 | Pre EZA | 0.939 | 0.050 |
Statistics Table 5H.
for Figure 5H
| GNBC | Pre EZA vs. +10 µM EZA |
GNBC | eGFP-e1 vs. eGFP-e1-CAII | ||
|---|---|---|---|---|---|
| Unadj. p | Adj. α | Unadj. p | Adj. α | ||
| eGFP-e1-CAII IV#1 | 0.212 | 0.013 | +10 μM EZA IV#2 | 0.195 | 0.013 |
| eGFP-e1 IV#2 | 0.346 | 0.017 | IV#2 | 0.324 | 0.017 |
| eGFP-e1-CAII IV#2 | 0.501 | 0.025 | IV#1 | 0.625 | 0.025 |
| eGFP-e1 IV#1 | 0.702 | 0.050 | +10 μM EZA IV#2 | 0.630 | 0.050 |
Statistics Table 6C.
for Figure 6C
| Initial pHi | a1 vs. a2 | Initial pHi | eGFP-e1+Tris vs. eGFP-e1+hCAII | |||
|---|---|---|---|---|---|---|
| Unadj. p | Adj. α | Unadj. p | Adj. α | |||
| eGFP-e1+hCAII | 0.497 | 0.025 | a2 | 0.344 | 0.025 | |
| eGFP-e1+Tris | 0.767 | 0.050 | a1 | 0.592 | 0.050 | |
Statistics Table 6D.
for Figure 6D
| (dpHi/dt)max | Pre EZA vs. +10 μM EZA | (dpHi/dt)max | eGFP-e1+Tris vs. eGFP-e1+hCA II |
||
|---|---|---|---|---|---|
| Unadj. p | Adj. α | Unadj. p | Adj. α | ||
| eGFP-e1+hCAII | 0.023 | 0.025 | +10 μM EZA | 2.886×10⁻⁶ | 0.025 |
| eGFP-e1+Tris | 0.724 | 0.050 | Pre EZA | 0.001 | 0.050 |
NB unadjusted p for eGFP-e1 vs. ([eGFP-e1 +50 ng hCAII] + EZA) = 1.226×10⁻⁵
Statistics Table 6E.
for Figure 6E
| ΔIm | Pre EZA vs. +10 μM EZA | ΔIm | eGFP-e1+Tris vs. eGFP-e1+hCAII |
||
|---|---|---|---|---|---|
| Unadj. p | Adj. α | Unadj. p | Adj. α | ||
| eGFP-e1+hCAII | 0.031 | 0.025 | Pre EZA | 0.183 | 0.025 |
| eGFP-e1+Tris | 0.267 | 0.050 | +10 μM EZA | 0.524 | 0.050 |
Statistics Table 6H.
for Figure 6H
| GNBC | Pre EZA vs.+10 µM EZA | GNBC | eGFP-e1+Tris vs. eGFP-e1+hCAII | ||
|---|---|---|---|---|---|
| Unadj. p | Adj. α | Unadj. p | Adj. α | ||
| eGFP-e1+Tris IV#2 | 0.035 | 0.013 | +10 μM EZA IV#2 | 0.066 | 0.013 |
| eGFP-e1+Tris IV#1 | 0.063 | 0.017 | +10 μM EZA IV#1 | 0.275 | 0.017 |
| eGFP-e1+hCAII IV#2 | 0.302 | 0.025 | IV#1 | 0.360 | 0.025 |
| eGFP-e1+hCAII IV#1 | 0.597 | 0.050 | IV#2 | 0.388 | 0.050 |
Statistics Table 7C.
for Figure 7C
| Initial pHi | eGFP-e1+Tris | Initial pHi | eGFP-e1+hCAII | Initial pHi | +Tris vs.+hCAII | |||
|---|---|---|---|---|---|---|---|---|
| Unadj. p | Adj. α | Unadj. p | Adj. α | Unadj. p | α | |||
| a1 vs. a2 | 0.028 | 0.025 | a1 vs. a2 | 4.847×10⁻⁸ | 0.025 | a2 | 0.025 | 0.05 |
| a2 vs. a3 | 0.135 | 0.050 | a2 vs. a3 | 0.649 | 0.050 | |||
Statistics Table 7D.
for Figure 7D
| (dpHi/dt)max | eGFP-e1+Tris | (dpHi/dt)max | eGFP-e1+hCAII | (dpHi/dt)max | +Tris vs. +hCAII | |||
|---|---|---|---|---|---|---|---|---|
| Unadj. p | Adj. α | Unadj. p | Adj. α | Unadj. p | α | |||
| #1 vs. #2 | 0.022 | 0.025 | #1 vs. #2 | 0.009 | 0.025 | #2 | 0.006 | 0.050 |
| #2 vs. EZA | 0.476 | 0.050 | #2 vs. EZA | 0.024 | 0.050 | |||
Statistics Table 7E.
for Figure 7E
| Initial [Na+]i | eGFP-e1+Tris | Initial [Na+]i | eGFP-e1+hCAII | Initial [Na+]i | +Tris vs. +hCAII | |||
|---|---|---|---|---|---|---|---|---|
| Unadj. p | Adj. α | Unadj. p | Adj. α | Unadj. p | α | |||
| a1 vs. a2 | 6.324×10⁻⁴ | 0.025 | a1 vs. a2 | 0.004 | 0.025 | a2 | 0.820 | 0.050 |
| a2 vs. a3 | 0.137 | 0.050 | a2 vs. a3 | 0.891 | 0.050 | |||
Statistics Table 7F.
for Figure 7F
| (d[Na+]i/dt)max | eGFP-e1+Tris | (d[Na+]i/dt)max | eGFP-e1+hCAII | (d[Na+]i/dt)max | +Tris vs. +hCAII | |||
|---|---|---|---|---|---|---|---|---|
| Unadj. p | Adj. α | Unadj. p | Adj. α | Unadj. p | α | |||
| #1 vs. #2 | 0.032 | 0.025 | #2 vs. EZA | 0.520 | 0.025 | #2 | 0.515 | 0.050 |
| #2 vs. EZA | 0.878 | 0.050 | #1 vs. #2 | 0.647 | 0.050 | |||
Statistics Table 7G.
for Figure 7G
| ΔIm | eGFP-e1+Tris | ΔIm | eGFP-e1+ hCAII | ΔIm | +Tris vs. +hCAII | |||
|---|---|---|---|---|---|---|---|---|
| Unadj. p | Adj. α | Unadj. p | Adj. α | Unadj. p | Adj. α | |||
| #1 vs. #2 | 0.308 | 0.025 | #2 vs. EZA | 0.107 | 0.025 | #2 | 0.949 | 0.050 |
| #2 vs. EZA | 0.906 | 0.050 | #1 vs. #2 | 0.625 | 0.050 | |||
Statistics Table 8C.
for Figure 8C
| Gm | eGFP-e1+Tris | Gm | eGFP-e1+hCA II | Gm | +Tris vs. +hCAII | |||
|---|---|---|---|---|---|---|---|---|
| Unadj. p | Adj. α | Unadj. p | Adj. α | Unadj. p | Adj. α | |||
| #1 vs. #2 | 0.524 | 0.025 | #2 vs. EZA | 0.909 | 0.025 | #2 | 0.478 | 0.050 |
| #2 vs. EZA | 0.762 | 0.050 | #1 vs. #2 | 0.910 | 0.050 | |||
Statistics Table 8D.
for Figure 8D
| GNBC | eGFP-e1+Tris | GNBC | eGFP-e1+hCAII | GNBC | +Tris vs. +hCAII | |||
|---|---|---|---|---|---|---|---|---|
| Unadj. p | Adj. α | Unadj. p | Adj. α | Unadj. p | Adj. α | |||
| #2 vs. EZA | 0.382 | 0.025 | #1 vs. #2 | 0.122 | 0.025 | #2 | 0.710 | 0.050 |
| #1 vs. #2 | 0.647 | 0.050 | #2 vs. EZA | 0.375 | 0.050 | |||
Statistics Table 9B.
for Figure 9B
| Initial pHi | eGFP-e1+bCA | |
|---|---|---|
| Unadj. p | Adj. α | |
| a1 vs. a2 | 5.840×10⁻⁴ | 0.025 |
| a2 vs. a3 | 0.034 | 0.050 |
Statistics Table 9C.
for Figure 9C
| (dpHi/dt)max | eGFP-e1+bCA | |
|---|---|---|
| Unadj. p | Adj. α | |
| #1 vs. #2 | 0.006 | 0.025 |
| #2 vs. EZA | 0.033 | 0.050 |
Statistics Table 9D.
for Figure 9D
| Initial [Na+]i | eGFP-e1+bCA | |
|---|---|---|
| Unadj. p | Adj. α | |
| a2 vs. a3 | 0.370 | 0.025 |
| a1 vs. a2 | 0.914 | 0.050 |
Statistics Table 9E.
for Figure 9E
| (d[Na+]i /dt)max | eGFP-e1+bCA | |
|---|---|---|
| Unadj. p | Adj. α | |
| #2 vs. EZA | 0.193 | 0.025 |
| #1 vs. #2 | 0.375 | 0.050 |
Statistics Table 9F.
for Figure 9F
| ΔIm | eGFP-e1+bCA | |
|---|---|---|
| Unadj. p | Adj. α | |
| #2 vs. EZA | 0.423 | 0.025 |
| #1 vs. #2 | 0.558 | 0.050 |
Statistics Table 9H.
for Figure 9H
| Gm | eGFP-e1+bCA | |
|---|---|---|
| Unadj. p | Adj. α | |
| #2 vs. EZA | 0.161 | 0.025 |
| #1 vs. #2 | 0.504 | 0.050 |
Statistics Table 9.
for Figure 9I
| GNBC | eGFP-e1+bCA | |
|---|---|---|
| Unadj. p | Adj. α | |
| #2 vs. EZA | 0.138 | 0.025 |
| #1 vs. #2 | 0.417 | 0.050 |
Statistics Table 10C.
for Figure 10C
| Initial pHi | e1+H2O | Initial pHi | e1+bCA | Initial pHi | e1+H2O vs. e1+bCA | |||
|---|---|---|---|---|---|---|---|---|
| Unadj. p | Adj. α | Unadj. p | Adj. α | Unadj. p | α | |||
| a1 vs. a2 | 0.051 | 0.025 | a1 vs. a2 | 1.368×10⁻⁶ | 0.025 | a2 | 1.068×10⁻⁴ | 0.050 |
| a2 vs. a3 | 0.572 | 0.050 | a2 vs. a3 | 1.146×10⁻⁵ | 0.050 | |||
Statistics Table 10D.
for Figure 10D
| (dpHi/dt)max | e1+H2O | (dpHi/dt)max | e1+bCA | (dpHi/dt)max | e1+H2O vs. e1+bCA | |||
|---|---|---|---|---|---|---|---|---|
| Unadj. p | Adj. α | Unadj. p | Adj. α | Unadj. p | α | |||
| #1 vs. #2 | 0.070 | 0.025 | #1 vs. #2 | 2.047×10⁻⁶ | 0.025 | #2 | 2.366×10⁻⁴ | 0.050 |
| #2 vs. EZA | 0.116 | 0.050 | #2 vs. EZA | 0.003 | 0.050 | |||
Statistics Table 10G.
for Figure 10G
| ΔIm | e1+H2O | ΔIm | e1+bCA | ΔIm | e1+H2O vs. e1+bCA | |||
|---|---|---|---|---|---|---|---|---|
| Unadj. p | Adj. α | Unadj. p | Adj. α | Unadj. p | α | |||
| #2 vs. EZA | 0.065 | 0.025 | #2 vs. EZA | 5.849×10⁻⁴ | 0.025 | #2 | 0.254 | 0.050 |
| #1 vs. #2 | 0.346 | 0.050 | #1 vs. #2 | 0.020 | 0.050 | |||
Statistics Table 11C.
for Figure 11C
| Gm | e1+H2O | Gm | e1+bCA | Gm | e1+H2O vs. e1+bCA | |||
|---|---|---|---|---|---|---|---|---|
| Unadj. p | Adj. α | Unadj. p | Adj. α | Unadj. p | α | |||
| #1 vs. #2 | 0.042 | 0.025 | #2 vs. EZA | 0.672 | 0.025 | #2 | 0.532 | 0.050 |
| #2 vs. EZA | 0.507 | 0.050 | #1 vs. 2 | 0.988 | 0.050 | |||
Statistics Table 11I.
for Figure 11I
| GNBC | e1+H2O | GNBC | e1+bCA | GNBC | e1+H2O vs. e1+bCA | |||
|---|---|---|---|---|---|---|---|---|
| Unadj. p | Adj. α | Unadj. p | Adj. α | Unadj. p | α | |||
| #2 vs. EZA | 0.470 | 0.025 | #1 vs. #2 | 0.026 | 0.025 | #2 | 0.097 | 0.050 |
| #1 vs. #2 | 0.588 | 0.050 | #2 vs. EZA | 0.204 | 0.050 | |||
Statistics Table 12.
for Figure 12
| Panel B (comparing epoch duration for GNBC) | GNBC | GNBC Pre EZA vs. 3 h Post EZA | Panel B (comparing ±CA) | GNBC e1+H2O vs. e1+ bCA | Panel D (comparing pre/post EZA for dpHi/dt) | (dpHi/dt)max | |||||||
|---|---|---|---|---|---|---|---|---|---|---|---|---|---|
| Unadjusted p | Adj. α | Unadjusted. p | Adj. α | ||||||||||
| e1+H2O | e1+bCA | Protocol | e1+H2O | Protocol | e1+bCA | Unadj. p | Adj. α | Unadj. p | |||||
| 1 s vs. 30 s | 3.920×10⁻⁷ | 1.873×10⁻⁷ | 0.017 | 60 ms | 0.079 | 60 ms | 0.357 | 0.017 | 1 s | 0.428 | 0.017 | e1+H2O vs. e1 +bCA | 0.009 |
| 60 ms vs. 30 s | 1.625×10⁻⁴ | 0.001 | 0.025 | 1 s | 0.663 | 30 s | 0.632 | 0.025 | 60 ms | 0.869 | 0.025 | e1+bCA Pre EZA vs Post 3 h EZA | 0.007 |
| 60 ms vs. 1s | 0.514 | 0.759 | 0.050 | 30 s | 0.333 | 1 s | 0.867 | 0.050 | 30 s | 0.888 | 0.050 | ||
Statistics Table 13B.
for Figure 13B
| Initial pHi | e1+hCAII | |
|---|---|---|
| Unadj. p | Adj. α | |
| a1 vs. a2 | 0.004 | 0.025 |
| a2 vs. a3 | 0.009 | 0.050 |
Statistics Table 13C.
for Figure 13C
| (dpHi/dt)max | e1+hCAII | |
|---|---|---|
| Unadj. p | Adj. α | |
| #2 vs. EZA | 0.011 | 0.025 |
| #1 vs. #2 | 0.028 | 0.050 |
Statistics Table 13D.
for Figure 13D
| Initial [Na+]i | e1+hCAII | |
|---|---|---|
| Unadj. p | Adj. α | |
| a1 vs. a2 | 0.476 | 0.025 |
| a2 vs. a3 | 0.490 | 0.050 |
Statistics Table 13E.
for Figure 13E
| (d[Na+]i /dt)max | e1+hCAII | |
|---|---|---|
| Unadj. p | Adj. α | |
| #2 vs. EZA | 0.201 | 0.025 |
| #1 vs. #2 | 0.374 | 0.050 |
Statistics Table 13F.
for Figure 13F
| ΔIm | e1+hCAII | |
|---|---|---|
| Unadj. p | Adj. α | |
| #2 vs. EZA | 0.100 | 0.025 |
| #1 vs. #2 | 0.338 | 0.050 |
Statistics Table 13H.
for Figure 13H
| Gm | e1+hCAII | |
|---|---|---|
| Unadj. p | Adj. α | |
| #2 vs. EZA | 0.088 | 0.025 |
| #1 vs. #2 | 0.623 | 0.050 |
Statistics Table 13I.
for Figure 13I
| GNBC | e1+hCAII | |
|---|---|---|
| Unadj. P | Adj. α | |
| #2 vs. EZA | 0.293 | 0.025 |
| #1 vs. #2 | 0.949 | 0.050 |
Statistics Table 14C.
for Figure 14C
| Initial pHi | H2O+Tris | Initial pHi | H2O+hCAII | Initial pHi | H2O+Tris vs. H2O+hCAII | |||
|---|---|---|---|---|---|---|---|---|
| Unadj. p | Adj. α | Unadj. p | Adj. α | Unadj. p | α | |||
| a2 vs. a3 | 0.574 | 0.025 | a2 vs. a3 | 0.005 | 0.025 | a2 | 0.335 | 0.050 |
| a1 vs. a2 | 0.799 | 0.050 | a1 vs. a2 | 0.008 | 0.050 | |||
Statistics Table 14D.
for Figure 14D
| (dpHi/dt)max | H2O+Tris | (dpHi/dt)max | H2O+hCAII | (dpHi/dt)max | H2O+Tris vs. H2O+hCAII | |||
|---|---|---|---|---|---|---|---|---|
| Unadj. p | Adj. α | Unadj. p | Adj. α | Unadj. p | α | |||
| #2 vs. EZA | 0.465 | 0.025 | #1 vs. #2 | 0.002 | 0.025 | #2 | 0.003 | 0.050 |
| #1 vs. #2 | 0.877 | 0.050 | #2 vs. EZA | 0.006 | 0.050 | |||
Statistics Table 14F.
for Figure 14F
| (d[Na+]i /dt)max | H2O+Tris | (d[Na+]i /dt)max | H2O+hCAII | (d[Na+]i/dt)max | H2O+Tris vs. H2O+hCAII | |||
|---|---|---|---|---|---|---|---|---|
| Unadj. p | Adj. α | Unadj. p | Adj. α | Unadj. p | α | |||
| #2 vs. EZA | 0.039 | 0.025 | #2 vs. EZA | 7.176×10⁻⁵ | 0.025 | #2 |
5.696×10⁻⁴ | 0.050 |
| #1 vs. #2 | 0.525 | 0.050 | #1 vs. #2 | 0.437 | 0.050 | |||
Statistics Table 14G.
for Figure 14G
| Gm | H2O+Tris | Gm | H2O+hCAII | Gm | H2O+Tris vs. H2O+hCAII |
|||
|---|---|---|---|---|---|---|---|---|
| Unadj. p | Adj. α | Unadj. p | Adj. α | Unadj. p | α | |||
| #2 vs. EZA | 0.107 | 0.025 | #2 vs. EZA | 0.077 | 0.025 | #2 | 0.753 | 0.050 |
| #1 vs. #2 | 0.116 | 0.050 | #1 vs. #2 | 0.777 | 0.050 | |||
Statistics Table 15C.
for Figure 15C
| Initial pHi | H2O+H2O | Initial pHi | H2O+bCA | Initial pHi | H2O+H2O vs. H2O+bCA |
|||
|---|---|---|---|---|---|---|---|---|
| Unadj. p | Adj. α | Unadj. p | Adj. α | Unadj. p | α | |||
| a2 vs. a3 | 0.040 | 0.025 | a1 vs. a2 | 0.006 | 0.025 | a2 | 0.318 | 0.050 |
| a1 vs. a2 | 0.387 | 0.050 | a2 vs. a3 | 0.588 | 0.050 | |||
Statistics Table 15D.
for Figure 15D
| (dpHi/dt)max | H2O+H2O | (dpHi/dt)max | H2O+bCA | (dpHi/dt)max | H2O+H2O vs. H2O+bCA | |||
|---|---|---|---|---|---|---|---|---|
| Unadj. p | Adj. α | Unadj. p | Adj. α | Unadj. p | α | |||
| #2 vs. EZA | 0.309 | 0.025 | #1 vs. #2 | 0.003 | 0.025 | #2 | 0.022 | 0.050 |
| #1 vs. #2 | 0.456 | 0.050 | #2 vs. EZA | 0.003 | 0.050 | |||
Statistics Table 15E.
for Figure 15E
| Initial [Na+]i | H2O + H2O | Initial [Na+]i | H2O + bCA | Initial [Na+]i | H2O + H2O vs. H2O + bCA | |||
|---|---|---|---|---|---|---|---|---|
| Unadj. p | Adj. α | Unadj. p | Adj. α | Unadj. p | α | |||
| a2 vs. a3 | 0.049 | 0.025 | a1 vs. a2 | 0.022 | 0.025 | a2 | 0.183 | 0.050 |
| a1 vs. a2 | 0.252 | 0.050 | a2 vs. a3 | 0.032 | 0.050 | |||
Statistics Table 15F.
for Figure 15F
| (d[Na+]i/dt)max | H2O + H2O | (d[Na+]i/dt)max | H2O + bCA | (d[Na+]i/dt)max | H2O + H2O vs. H2O + bCA |
|||
|---|---|---|---|---|---|---|---|---|
| Unadj. p | Adj. α | Unadj. p | Adj. α | Unadj. p | α | |||
| #2 vs. EZA | 0.448 | 0.025 | #2 vs. EZA | 0.016 | 0.025 | #2 | 6.637×10⁻⁴ | 0.050 |
| #1 vs. #2 | 0.892 | 0.050 | #1 vs. #2 | 0.855 | 0.050 | |||
Statistics Table 15G.
for Figure 15G
| Gm | H2O+H2O | Gm | H2O+bCA | Gm | H2O+H2O vs. H2O+bCA | |||
|---|---|---|---|---|---|---|---|---|
| Unadj. p | Adj. α | Unadj. p | Adj. α | Unadj. P | α | |||
| #2 vs. EZA | 0.611 | 0.025 | #2 vs. EZA | 0.629 | 0.025 | #2 | 0.810 | 0.050 |
| #1 vs. #2 | 0.716 | 0.050 | #1 vs. #2 | 0.757 | 0.050 | |||
Statistics Table 16G.
for Figure 16G
| (dpHi/dt)max | Unadj. p | Unadj. p | Unadj. p | Adj. α | ||
|---|---|---|---|---|---|---|
| +Tris vs. +50 ng hCAII | 0.007 | +H2O vs. +300 ng bCA | 0.006 | +300ng hCAII vs. +300 ng bCA | 0.190 | 0.017 |
| +Tris vs. +300 ng hCAII | 0.020 | +H2O vs. +50 ng bCA | 0.022 | +50ng hCAII vs. +50 ng bCA | 0.258 | 0.025 |
| +50ng vs. +300 ng hCAII | 0.852 | +50ng vs. +300 ng bCA | 0.858 | Tris vs. H2O | 0.468 | 0.050 |
Statistics Table 16H.
for Figure 16H part I
| (d[Na+]i/dt)max | Unadj. p | Unadj. p | Unadj. p | Adj. α | ||
|---|---|---|---|---|---|---|
| +Tris vs. +50 ng hCAII | 3.598×10⁻⁴ | +H2O vs. +50 ng bCA | 0.016 | +50ng hCAII vs. +50 ng bCA | 0.059 | 0.017 |
| +Tris vs. +300 ng hCAII | 8.383×10⁻⁴ | +H2O vs. +300 ng bCA | 0.019 | Tris vs. H2O | 0.241 | 0.025 |
| +50ng vs. +300 ng hCAII | 0.009 | +50ng vs. +300 ng bCA | 0.466 | +300ng hCAII vs. +300 ng bCA | 0.267 | 0.050 |
Statistics Table 16H.
for Figure 16H part II
| Pre EIPA vs. Post EIPA (d[Na+]i /dt)max | Unadj. p | Adjusted α |
|---|---|---|
| +50ng hCAII | 1.735×10⁻⁵ | 0.008 |
| +300ng hCAII | 5.654×10⁻⁵ | 0.010 |
| +300ng bCA | 0.006 | 0.013 |
| +50ng bCA | 0.008 | 0.017 |
| +H2O | 0.008 | 0.025 |
| +Tris | 0.016 | 0.050 |
Statistics Table 17B.
for Figure 17B
| Initial pHi | e1+50 ng bCA +50 μM EIPA | |
|---|---|---|
| Unadj. P | Adj. α | |
| a2 vs. a3 | 0.001 | 0.025 |
| a1 vs. a2 | 0.136 | 0.050 |
Statistics Table 17C.
for Figure 17C
| (dpHi/dt)max | e1+bCA+50 μM EIPA | |
|---|---|---|
| Unadj. p | Adj. α | |
| #2 vs. EZA | 0.012 | 0.025 |
| #1 vs. #2 | 0.169 | 0.050 |
Statistics Table 17D.
for Figure 17D
| Initial [Na+]i | e1+bCA +50 μM EIPA | |
|---|---|---|
| Unadj. p | Adj. α | |
| a2 vs. a3 | 0.435 | 0.025 |
| a1 vs. a2 | 0.846 | 0.050 |
Statistics Table 17E.
for Figure 17E
| (d[Na+]i /dt)max | e1+bCA +50 μM EIPA | |
|---|---|---|
| Unadj. p | Adj. α | |
| #1 vs. #2 | 0.039 | 0.025 |
| #2 vs. EZA | 0.598 | 0.050 |
Statistics Table 17F.
for Figure 17F
| ΔIm | e1+bCA +50 μM EIPA | |
|---|---|---|
| Unadj. p | Adj. α | |
| #2 vs. EZA | 0.183 | 0.025 |
| #1 vs. #2 | 0.759 | 0.050 |
Statistics Table 17H.
for Figure 17H
| Gm | e1+bCA +50 μM EIPA | |
|---|---|---|
| Unadj. p | Adj. α | |
| #2 vs. EZA | 0.109 | 0.025 |
| #1 vs. #2 | 0.287 | 0.050 |
Statistics Table 17I.
for Figure 17I
| GNBC | e1+bCA +50 μM EIPA | |
|---|---|---|
| Unadj. p | Adj. α | |
| #2 vs. EZA | 0.175 | 0.025 |
| #1 vs. #2 | 0.685 | 0.050 |
Key Points.
According to the metabolon hypothesis, direct association of cytosolic carbonic anhydrases (CAs) with the electrogenic Na/HCO3 cotransporter NBCe1-A speeds transport by regenerating/consuming . The present work addresses published discrepancies as to whether cytosolic CAs stimulate NBCe1-A, heterologously expressed in Xenopus oocytes.
We confirm the essential elements of the previous experimental observations, taken as support for the metabolon hypothesis.
However, using our own experimental protocols or those of others, we find that NBCe1-A function is unaffected by cytosolic CAs.
Previous conclusions that cytosolic CAs do stimulate NBCe1-A can be explained by an unanticipated stimulatory effect of the CAs on an endogenous Na-H exchanger.
Theoretical analyses show that, although CAs could stimulate non- transporters (e.g., Na-H exchangers) by accelerating CO2/-mediated buffering of acid-base equivalents, they could not appreciably affect transport rates of NBCe1 or other transporters carrying , , or ion pairs.
Acknowledgements
We thank Summer Watterson for technical assistance in the purification of recombinant human carbonic anhydrase, Dale E. Huffman for technical and computer support and Gerald T. Babcock in his role as laboratory manager. The authors would like to thank Rosanna Occhipinti for her helpful discussions during writing this paper. W.F.B gratefully acknowledges the support of the Myers/Scarpa endowed chair.
Funding
This work was supported by NIH grants DK030344, DK007470 and DK113197 and Office of Naval Research Grant N00014-11-1-0889 and N00014-15-1-2060 (to W.F.B.).
Abbreviations
- ACZ
acetazolamide
- Nt
amino terminus
- []is
[] at the intracellular surface of the membrane
- bCA
bovine CA
- bICF
bulk intracellular fluid
- CA
carbonic anhydrase
- CAs
carbonic anhydrases
- CA II
carbonic anhydrase II
- Ct
carboxy terminus
- I–V
current-voltage
- NBCe1
electrogenic Na/HCO3 co-transporter 1
- eGFP
enhanced green fluorescent protein
- EZA
ethoxyzolamide
- EIPA
ethyl-isopropyl amiloride
- Vh
holding potential
- hCA II
human CA II
- pHi
intracellular pH
- (d[Na+]i/dt)max
maximum rate of sodium influx
- Vm
membrane potential
- NBC
Na/HCO3 co-transporter
- NCBTs
Na+-coupled bicarbonate transporters
- GNBC
NBCe1 slope conductance
- pHSM
pH sensitive microelectrodes
- d[Na+]i/dt
rate of change of intracellular sodium concentration
- PT
renal proximal tubule
- Erev
reversal potential
- G
Slope conductance
- NaSM
Na+-sensitive microelectrodes
- ΔIm
total membrane current
- Gm
total membrane slope conductance
- TEVC
two-electrode voltage clamp
- Vclamp
voltage clamp
Footnotes
Functional expression is defined as the product of surface expression and the intrinsic transporter activity of individual molecules (Parker & Boron, 2013).
The reason for the right-shift in the INBC-V relationships from IV#1 to IV#2 was probably the rapid intracellular accumulation of Na+ and as we continuously clamp Vm to –40 mV. Even within a single I–V protocol, Erev may shift to the left at the most negative voltages, and shift to the right at the most positive one.
Although the Methods sections of B&D and Schueler et al. (2011) refer to the CA from bovine erythrocytes (Sigma C3934) as CA II, the preparation is in fact a mixture of CA I and CA II, sold on the basis of enzymatic activity units/mg protein. For this reason, we refer to the material as bCA.
Another difference is that, here in Fig. 9, we inject 1.5 ng cRNA/oocyte, rather than the 0.15 ng in Fig. 7, accounting for the larger ΔIm.
Fig. 10B is an example in which the example experiment does not reflect the trend of mean initial [Na+]i values that we see in Fig. 10E.
Competing interests
All authors declare no conflict of interests.
All authors approved the final version of the manuscript and all qualify for authorship, and all those who qualify for authorship are listed.
Supporting information
N/A
Data Availability Statement
The data that support the findings of this study are available from the corresponding author upon reasonable request.
References
- Adelroth P & Brzezinski P (2004). Surface-mediated proton-transfer reactions in membrane-bound proteins. Biochim Biophys Acta 1655, 102–115. [DOI] [PubMed] [Google Scholar]
- Al-Samir S, Papadopoulos S, Scheibe RJ, Meißner JD, Cartron J-P, Sly WS, Alper SL, Gros G & Endeward V (2013). Activity and distribution of intracellular carbonic anhydrase II and their effects on the transport activity of anion exchanger AE1/SLC4A1. J Physiol 591, 4963–4982. [DOI] [PMC free article] [PubMed] [Google Scholar]
- Becker HM & Deitmer JW (2007). Carbonic anhydrase II increases the activity of the human electrogenic Na+/HCO3− cotransporter. J Biol Chem 282, 13508–13521. [DOI] [PubMed] [Google Scholar]
- Becker HM, Hirnet D, Fecher-Trost C, Sültemeyer D & Deitmer JW (2005). Transport activity of MCT1 expressed in Xenopus oocytes is increased by interaction with carbonic anhydrase. J Biol Chem 280, 39882–39889. [DOI] [PubMed] [Google Scholar]
- Becker HM, Klier M, Schüler C, McKenna R & Deitmer JW (2011). Intramolecular proton shuttle supports not only catalytic but also noncatalytic function of carbonic anhydrase II. Proc Natl Acad Sci U S A 108, 3071–3076. [DOI] [PMC free article] [PubMed] [Google Scholar]
- Biemesderfer D, Reilly RF, Exner M, Igarashi P & Aronson PS (1992). Immunocytochemical characterization of Na+-H+ exchanger isoform NHE-1 in rabbit kidney. Am J Physiol 263, F833–840. [DOI] [PubMed] [Google Scholar]
- Boron WF (1985). Intracellular pH-regulating mechanism of the squid axon. Relation between the external Na+ and HCO3− dependences. J Gen Physiol 85, 325–345. [DOI] [PMC free article] [PubMed] [Google Scholar]
- Boron WF & Boulpaep EL (1983a). Intracellular pH regulation in the renal proximal tubule of the salamander: basolateral HCO3- transport. J Gen Physiol 81, 53–94. [DOI] [PMC free article] [PubMed] [Google Scholar]
- Boron WF & Boulpaep EL (1983b). Intracellular pH regulation in the renal proximal tubule of the salamander. Na-H exchange. J Gen Physiol 81, 29–52. [DOI] [PMC free article] [PubMed] [Google Scholar]
- Boron WF & De Weer P (1976a). Intracellular pH transients in squid giant axons caused by CO₂, NH₃, and metabolic inhibitors. J Gen Physiol 67, 91–112. [DOI] [PMC free article] [PubMed] [Google Scholar]
- Boron WF & De Weer P (1976b). Active proton transport stimulated by CO2/HCO3−, blocked by cyanide. Nature 259, 240–241. [DOI] [PubMed] [Google Scholar]
- Boron WF & Knakal RC (1989). Intracellular pH-regulating mechanism of the squid axon. Interaction between DNDS and extracellular Na+ and HCO3−. J Gen Physiol 93, 123–150. [DOI] [PMC free article] [PubMed] [Google Scholar]
- Boron WF & Knakal RC (1992). Na+-dependent Cl−-HCO3− exchange in the squid axon. Dependence on extracellular pH. J Gen Physiol 99, 817–837. [DOI] [PMC free article] [PubMed] [Google Scholar]
- Boron WF & Russell JM (1983). Stoichiometry and ion dependencies of the intracellular-pH-regulating mechanism in squid giant axons. J Gen Physiol 81, 373–399. [DOI] [PMC free article] [PubMed] [Google Scholar]
- Brändén M, Sandén T, Brzezinski P & Widengren J (2006). Localized proton microcircuits at the biological membrane-water interface. Proc Natl Acad Sci U S A 103, 19766–19770. [DOI] [PMC free article] [PubMed] [Google Scholar]
- Burckhardt BC, Kroll B & Frömter E (1992). Proton transport mechanism in the cell membrane of Xenopus laevis oocytes. Pflüg Arch Eur J Physiol 420, 78–82. [DOI] [PubMed] [Google Scholar]
- Burnham CE, Amlal H, Wang Z, Shull GE & Soleimani M (1997). Cloning and functional expression of a human kidney Na+:HCO3− cotransporter. J Biol Chem 272, 19111–19114. [DOI] [PubMed] [Google Scholar]
- Busch S, Rosskopf D, Lang HJ, Weichert A & Siffert W (1998). Expression, functional characterization and tissue distribution of a Na+/H+ exchanger cloned from Xenopus laevis oocytes (XL-NHE). Pflüg Arch Eur J Physiol 436, 828–833. [DOI] [PubMed] [Google Scholar]
- Chen LM, Liu Y & Boron WF (2011). Role of an extracellular loop in determining the stoichiometry of Na+-HCO3− cotransporters. J Physiol 589, 877–890. [DOI] [PMC free article] [PubMed] [Google Scholar]
- Chen LM, Qin X, Moss FJ, Liu Y & Boron WF (2012). Effect of Simultaneously Replacing Putative TM6 and TM12 of Human NBCe1-A with Those from NBCn1 on Surface Abundance in Xenopus Oocytes. J Membr Biol 245, 131–140. [DOI] [PMC free article] [PubMed] [Google Scholar]
- Choi I, Romero MF, Khandoudi N, Bril A & Boron WF (1999). Cloning and characterization of a human electrogenic Na+-HCO3− cotransporter isoform (hhNBC). Am J Physiol 276, C576–C584. [DOI] [PubMed] [Google Scholar]
- Dascal N (1987). The use of Xenopus oocytes for the study of ion channels. CRC Crit Rev Biochem 22, 317–387. [DOI] [PubMed] [Google Scholar]
- Dascal N, Landau EM & Lass Y (1984). Xenopus oocyte resting potential, muscarinic responses and the role of calcium and guanosine 3’,5’-cyclic monophosphate. J Physiol 352, 551–574. [DOI] [PMC free article] [PubMed] [Google Scholar]
- De Giusti VC, Orlowski A, Villa-Abrille MC, de Cingolani GEC, Casey JR, Alvarez BV & Aiello EA (2011). Antibodies against the cardiac sodium/bicarbonate co-transporter (NBCe1) as pharmacological tools. Br J Pharmacol 164, 1976–1989. [DOI] [PMC free article] [PubMed] [Google Scholar]
- Demirci FY, Chang MH, Mah TS, Romero MF & Gorin MB (2006). Proximal renal tubular acidosis and ocular pathology: a novel missense mutation in the gene (SLC4A4) for sodium bicarbonate cotransporter protein (NBCe1). Mol Vis 12, 324–330. [PubMed] [Google Scholar]
- Dinour D, Chang MH, Satoh J, Smith BL, Angle N, Knecht A, Serban I, Holtzman EJ & Romero MF (2004). A novel missense mutation in the sodium bicarbonate cotransporter (NBCe1/SLC4A4) causes proximal tubular acidosis and glaucoma through ion transport defects. J Biol Chem 279, 52238–52246. [DOI] [PubMed] [Google Scholar]
- Ducoudret O, Diakov A, Muller-Berger S, Romero MF & Frömter E (2001). The renal Na-HCO3-cotransporter expressed in Xenopus laevis oocytes: inhibition by tenidap and benzamil and effect of temperature on transport rate and stoichiometry. Pflüg Arch 442, 709–717. [DOI] [PubMed] [Google Scholar]
- Elder I, Han SF, Tu CK, Steele H, Laipis PJ, Viola RE & Silverman DN (2004). Activation of carbonic anhydrase II by active-site incorporation of histidine analogs. Arch Biochem Biophys 421, 283–289. [DOI] [PubMed] [Google Scholar]
- Garciarena CD, Ma Y, Swietach P, Huc L & Vaughan-Jones RD (2013). Sarcolemmal localisation of Na+/H+ exchange and Na+-HCO3− co-transport influences the spatial regulation of intracellular pH in rat ventricular myocytes. J Physiol 591, 2287–2306. [DOI] [PMC free article] [PubMed] [Google Scholar]
- Grichtchenko II & Boron WF (2002a). Surface-pH measurements in voltage-clamped Xenopus oocytes co-expressing NBCe1 and CAIV: evidence for CO32 transport. FASEB J 16, A795. [Google Scholar]
- Grichtchenko II & Boron WF (2002b). Surface-pH gradient measurements in Xenopus oocytes co-expressing the Na⬚+-driven Cl-HCO3 exchanger (NDCBE1) and CAIV: evidence for CO3= transport. FASEB J 16, A797. [Google Scholar]
- Grichtchenko II, Romero MF & Boron WF (2000). Extracellular HCO3- dependence of electrogenic Na/HCO3 cotransporters cloned from salamander and rat kidney. J Gen Physiol 115, 533–545. [DOI] [PMC free article] [PubMed] [Google Scholar]
- Grichtchenko LI, Hogan EM & Boron WF (1999). Extracellular HCO3 directly inhibits HCO3 efflux in Xenopus oocytes expressing the electrogenic rat kidney Na/HCO3 cotransporter (rkNBC). FASEB J 13, A65–A65. [Google Scholar]
- Gros G, Al-Samir S, Sly WS, Papadopoulos S & Endeward V (2010). Does direct interaction of the anion exchanger AE1 and carbonic anhydrase II facilitate HCO3− transport? Acta Physiol 198, Supplement 677: S-SUN-3–4. [Google Scholar]
- Gross E, Pushkin A, Abuladze N, Fedotoff O & Kurtz I (2002). Regulation of the sodium bicarbonate cotransporter kNBC1 function: role of Asp986, Asp988 and kNBC1-carbonic anhydrase II binding. J Physiol 544, 679–685. [DOI] [PMC free article] [PubMed] [Google Scholar]
- Heyer M, Muller-Berger S, Romero MF, Boron WF & Frömter E (1999). Stoichiometry of the rat kidney Na+-HCO3− cotransporter expressed in Xenopus laevis oocytes. Pflüg Arch 438, 322–329. [DOI] [PubMed] [Google Scholar]
- Holm S (1979). A simple sequentially rejective multiple test procedure. Scand J Stat 6, 65–70. [Google Scholar]
- Horita S, Yamada H, Inatomi J, Moriyama N, Sekine T, Igarashi T, Endo Y, Dasouki M, Ekim M, Al Gazali L, Shimadzu M, Seki G & Fujita T (2005). Functional analysis of NBC1 mutants associated with proximal renal tubular acidosis and ocular abnormalities. J Am Soc Nephrol 16, 2270–2278. [DOI] [PubMed] [Google Scholar]
- Horowitz SB & Fenichel IR (1970). Analysis of sodium transport in the amphibian oocyte by extractive and radioautographic techniques. J Cell Biol 47, 120–131. [DOI] [PMC free article] [PubMed] [Google Scholar]
- Igarashi T, Inatomi J, Sekine T, Cha SH, Kanai Y, Kunimi M, Tsukamoto K, Satoh H, Shimadzu M, Tozawa F, Mori T, Shiobara M, Seki G & Endou H (1999). Mutations in SLC4A4 cause permanent isolated proximal renal tubular acidosis with ocular abnormalities. Nat Genet 23, 264–266. [DOI] [PubMed] [Google Scholar]
- Igarashi T, Inatomi J, Sekine T, Seki G, Shimadzu M, Tozawa F, Takeshima Y, Takumi T, Takahashi T, Yoshikawa N, Nakamura H & Endou H (2001). Novel nonsense mutation in the Na+/HCO3− cotransporter gene (SLC4A4) in a patient with permanent isolated proximal renal tubular acidosis and bilateral glaucoma. J Am Soc Nephrol 12, 713–718. [DOI] [PubMed] [Google Scholar]
- Igarashi T, Sekine T, Inatomi J & Seki G (2002). Unraveling the molecular pathogenesis of isolated proximal renal tubular acidosis. J Am Soc Nephrol 13, 2171–2177. [DOI] [PubMed] [Google Scholar]
- Inatomi J, Horita S, Braverman N, Sekine T, Yamada H, Suzuki Y, Kawahara K, Moriyama N, Kudo A, Kawakami H, Shimadzu M, Endou H, Fujita T, Seki G & Igarashi T (2004). Mutational and functional analysis of SLC4A4 in a patient with proximal renal tubular acidosis. Pflüg Arch 448, 438–444. [DOI] [PubMed] [Google Scholar]
- Jaquenod De Giusti C, Blanco PG, Lamas PA, Carrizo Velasquez F, Lofeudo JM, Portiansky EL & Alvarez BV (2019). Carbonic anhydrase II/sodium-proton exchanger 1 metabolon complex in cardiomyopathy of ob−/− type 2 diabetic mice. J Mol Cell Cardiol 136, 53–63. [DOI] [PubMed] [Google Scholar]
- Kim S, Choi K-H, Baykiz AF & Gershenfeld HK (2007). Suicide candidate genes associated with bipolar disorder and schizophrenia: an exploratory gene expression profiling analysis of post-mortem prefrontal cortex. BMC Genomics 8, 413. [DOI] [PMC free article] [PubMed] [Google Scholar]
- Krishnan D, Liu L, Wiebe SA, Casey JR, Cordat E & Alexander RT (2015). Carbonic anhydrase II binds to and increases the activity of the epithelial sodium-proton exchanger, NHE3. Am J Physiol Renal Physiol 309, F383–392. [DOI] [PMC free article] [PubMed] [Google Scholar]
- Lee S-K & Boron WF (2018). Exploring the autoinhibitory domain of the electrogenic Na+/HCO₃− transporter NBCe1-B, from residues 28 to 62. J Physiol 596, 3637–3653. [DOI] [PMC free article] [PubMed] [Google Scholar]
- Lee S-K, Boron WF & Parker MD (2012). Relief of autoinhibition of the electrogenic Na-HCO3 cotransporter NBCe1-B: role of IRBIT vs.amino-terminal truncation. Am J Physiol Cell Physiol 302, C518–526. [DOI] [PMC free article] [PubMed] [Google Scholar]
- Li X, Alvarez B, Casey JR, Reithmeier RAF & Fliegel L (2002). Carbonic anhydrase II binds to and enhances activity of the Na+/H+ exchanger. J Biol Chem 277, 36085–36091. [DOI] [PubMed] [Google Scholar]
- Li X, Liu Y, Alvarez BV, Casey JR & Fliegel L (2006). A novel carbonic anhydrase II binding site regulates NHE1 activity. Biochemistry 45, 2414–2424. [DOI] [PubMed] [Google Scholar]
- Lu J & Boron WF (2007). Reversible and irreversible interactions of DIDS with the human electrogenic Na/HCO3 cotransporter NBCe1-A: role of lysines in the KKMIK motif of TM5. Am J Physiol-Cell Physiol 292, C1787–C1798. [DOI] [PubMed] [Google Scholar]
- Lu J, Daly CM, Parker MD, Gill HS, Piermarini PM, Pelletier MF & Boron WF (2006). Effect of human carbonic anhydrase II on the activity of the human electrogenic Na/HCO3- cotransporter NBCe1-A in Xenopus oocytes. J Biol Chem 281, 19241–19250. [DOI] [PubMed] [Google Scholar]
- Maunsbach AB, Vorum H, Kwon TH, Nielsen S, Simonsen B, Choi I, Schmitt BM, Boron WF & Aalkjaer C (2000). Immunoelectron microscopic localization of the electrogenic Na2HCO3− cotransporter in rat and ambystoma kidney. J Am Soc Nephrol JASN 11, 2179–2189. [DOI] [PubMed] [Google Scholar]
- McAlear SD, Liu X, Williams JB, McNicholas-Bevensee CM & Bevensee MO (2006). Electrogenic Na/HCO3 cotransporter (NBCe1) variants expressed in Xenopus oocytes: functional comparison and roles of the amino and carboxy termini. J Gen Physiol 127, 639–658. [DOI] [PMC free article] [PubMed] [Google Scholar]
- Moss F, Lee S, Parker M & Boron W (2014). Distinguishing HCO₃− from CO₃= transport by the electrogenic Na/HCO₃ cotransporter NBCe1 (SLC4A4). FASEB J 28, 1098.7.24285090 [Google Scholar]
- Musa-Aziz R, Boron WF & Parker MD (2010). Using fluorometry and ion-sensitive microelectrodes to study the functional expression of heterologously-expressed ion channels and transporters in Xenopus oocytes. Methods 51, 134–145. [DOI] [PMC free article] [PubMed] [Google Scholar]
- Musa-Aziz R, Occhipinti R & Boron WF (2014a). Evidence from simultaneous intracellular- and surface-pH transients that Carbonic Anhydrase II enhances CO2 fluxes across Xenopus oocytes plasma membranes. Am J Physiol Cell Physiol 307, C791–813. [DOI] [PMC free article] [PubMed] [Google Scholar]
- Musa-Aziz R, Occhipinti R & Boron WF (2014b). Evidence from simultaneous intracellular- and surface-pH transients that Carbonic Anhydrase IV enhances CO2 fluxes across Xenopus oocyte plasma membranes. Am J Physiol Cell Physiol 307, C814–840. [DOI] [PMC free article] [PubMed] [Google Scholar]
- Nakhoul NL, Davis BA, Romero MF & Boron WF (1998). Effect of expressing the water channel aquaporin-1 on the CO2 permeability of Xenopus oocytes. Am J Physiol 274, C543–C548. [DOI] [PubMed] [Google Scholar]
- Niculescu AB et al. (2015). Understanding and predicting suicidality using a combined genomic and clinical risk assessment approach. Mol Psychiatry 20, 1266–1285. [DOI] [PMC free article] [PubMed] [Google Scholar]
- Noor SI, Dietz S, Heidtmann H, Boone CD, McKenna R, Deitmer JW & Becker HM (2015). Analysis of the binding moiety mediating the interaction between monocarboxylate transporters and carbonic anhydrase II. J Biol Chem 290, 4476–4486. [DOI] [PMC free article] [PubMed] [Google Scholar]
- Noor SI, Jamali S, Ames S, Langer S, Deitmer JW & Becker HM (2018). A surface proton antenna in carbonic anhydrase II supports lactate transport in cancer cells. eLife; DOI: 10.7554/eLife.35176. [DOI] [PMC free article] [PubMed]
- Occhipinti R & Boron WF (2019). Role of carbonic anhydrases and inhibitors in acid-base physiology: Insights from mathematical modeling. Int J Mol Sci; DOI: 10.3390/ijms20153841. [DOI] [PMC free article] [PubMed]
- Occhipinti R, Musa-Aziz R & Boron WF (2014). Evidence from mathematical modeling that Carbonic Anhydrase II and IV enhance CO₂ fluxes across Xenopus oocytes plasma membranes. Am J Physiol Cell Physiol 307, C841–858. [DOI] [PMC free article] [PubMed] [Google Scholar]
- Park K, Hurley PT, Roussa E, Cooper GJ, Smith CP, Thevenod F, Steward MC & Case RM (2002). Expression of a sodium bicarbonate cotransporter in human parotid salivary glands. ArchOral Biol 47, 1–9. [DOI] [PubMed] [Google Scholar]
- Parker MD & Boron WF (2013). The divergence, actions, roles, and relatives of sodium-coupled bicarbonate transporters. Physiol Rev 93, 803–959. [DOI] [PMC free article] [PubMed] [Google Scholar]
- Parker MD, Qin X, Williamson RC, Toye AM & Boron WF (2012). HCO3--independent conductance with a mutant Na+/HCO3− cotransporter (SLC4A4) in a case of proximal renal tubular acidosis with hypokalemic paralysis. J Physiol 590, 2009–2034. [DOI] [PMC free article] [PubMed] [Google Scholar]
- Perlis RH et al. (2010). Genome-wide association study of suicide attempts in mood disorder patients. Am J Psychiatry 167, 1499–1507. [DOI] [PMC free article] [PubMed] [Google Scholar]
- Piermarini PM, Kim EY & Boron WF (2007). Evidence against a direct interaction between intracellular carbonic anhydrase II and pure C-terminal domains of SLC4 bicarbonate transporters. J Biol Chem 282, 1409–1421. [DOI] [PubMed] [Google Scholar]
- Poling BE, Prausnitz JM & O’Connell JP (2001). The properties of gases and liquids, Fifth Edition. McGraw-Hill, New York. [Google Scholar]
- Purkerson JM & Schwartz GJ (2007). The role of carbonic anhydrases in renal physiology. Kidney Int 71, 103–115. [DOI] [PubMed] [Google Scholar]
- Romero MF, Fulton CM & Boron WF (2004). The SLC4 family of HCO3- transporters. Pflüg Arch 447, 495–509. [DOI] [PubMed] [Google Scholar]
- Romero MF, Hediger MA, Boulpaep EL & Boron WF (1997). Expression cloning and characterization of a renal electrogenic Na+/HCO3− cotransporter. Nature 387, 409–413. [DOI] [PubMed] [Google Scholar]
- Schmitt BM, Biemesderfer D, Romero MF, Boulpaep EL & Boron WF (1999). Immunolocalization of the electrogenic Na+-HCO₃−cotransporter in mammalian and amphibian kidney. Am J Physiol - Ren Physiol 276, F27–F38. [DOI] [PubMed] [Google Scholar]
- Schueler C, Becker HM, McKenna R & Deitmer JW (2011). Transport activity of the sodium bicarbonate cotransporter NBCe1 is enhanced by different isoforms of carbonic anhydrase. PloS One 6, e27167. [DOI] [PMC free article] [PubMed] [Google Scholar]
- Sciortino CM & Romero MF (1999). Cation and voltage dependence of rat kidney electrogenic Na+-HCO3− cotransporter, rkNBC, expressed in oocytes. Am J Physiol 277, F611–623. [DOI] [PubMed] [Google Scholar]
- Shirakabe K, Priori G, Yamada H, Ando H, Horita S, Fujita T, Fujimoto I, Mizutani A, Seki G & Mikoshiba K (2006). IRBIT, an inositol 1,4,5-trisphosphate receptor-binding protein, specifically binds to and activates pancreas-type Na+HCO3− cotransporter 1 (pNBC1). Proc Natl Acad Sci U S A 103, 9542–9547. [DOI] [PMC free article] [PubMed] [Google Scholar]
- Skelton LA, Boron WF & Zhou Y (2010). Acid-base transport by the renal proximal tubule. J Nephrol 23, 4–18. [PMC free article] [PubMed] [Google Scholar]
- Soleimani M, Grassl SM & Aronson PS (1987). Stoichiometry of Na+-HCO3−- cotransport in basolateral membrane vesicles isolated from rabbit renal cortex. J Clin Invest 79, 1276–1280. [DOI] [PMC free article] [PubMed] [Google Scholar]
- Sowah D & Casey JR (2011). An intramolecular transport metabolon: fusion of carbonic anhydrase II to the COOH terminus of the Cl-/HCO3- exchanger, AE1. Am J Physiol Cell Physiol 301, C336–346. [DOI] [PubMed] [Google Scholar]
- Spitzer KW, Skolnick RL, Peercy BE, Keener JP & Vaughan-Jones RD (2002). Facilitation of intracellular H+ ion mobility by CO2/HCO3− in rabbit ventricular myocytes is regulated by carbonic anhydrase. J Physiol 541, 159–167. [DOI] [PMC free article] [PubMed] [Google Scholar]
- Steiner RA, Oehme M, Ammann D & Simon W (1979). Neutral carrier sodium ion-selective microelectrode for intracellular studies. Anal Chem 51, 351–353. [DOI] [PubMed] [Google Scholar]
- Sterling D, Reithmeier RA & Casey JR (2001). A transport metabolon: Functional interaction of carbonic anhydrase II and chloride/bicarbonate exchangers. J Biol Chem 276, 47886–47894. [DOI] [PubMed] [Google Scholar]
- Suzuki M et al. (2010). Defective membrane expression of the Na+-HCO3− cotransporter NBCe1 is associated with familial migraine. Proc Natl Acad Sci U S A 107, 15963–15968. [DOI] [PMC free article] [PubMed] [Google Scholar]
- Suzuki M, Vaisbich MH, Yamada H, Horita S, Li Y, Sekine T, Moriyama N, Igarashi T, Endo Y, Cardoso TP, de Sa LC, Koch VH, Seki G & Fujita T (2008). Functional analysis of a novel missense NBC1 mutation and of other mutations causing proximal renal tubular acidosis. Pflüg Arch 455, 583–593. [DOI] [PubMed] [Google Scholar]
- Swietach P, Zaniboni M, Stewart AK, Rossini A, Spitzer KW & Vaughan-Jones RD (2003). Modelling intracellular H+ ion diffusion. Prog Biophys Mol Biol 83, 69–100. [DOI] [PubMed] [Google Scholar]
- Tanhauser SM, Jewell DA, Tu CK, Silverman DN & Laipis PJ (1992). A T7 expression vector optimized for site-directed mutagenesis using oligodeoxyribonucleotide cassettes. Gene 117, 113–117. [DOI] [PubMed] [Google Scholar]
- Toye AM, Parker MD, Daly CM, Lu J, Virkki LV, Pelletier MF & Boron WF (2006). The human NBCe1-A mutant R881C, associated with proximal renal tubular acidosis, retains function but is mistargeted in polarized renal epithelia. Am J Physiol-Cell Physiol 291, C788–C801. [DOI] [PubMed] [Google Scholar]
- Trudeau MC, Warmke JW, Ganetzky B & Robertson GA (1995). HERG, a human inward rectifier on the voltage-gated potassium channel family. Science 269, 92–95. [DOI] [PubMed] [Google Scholar]
- Tzounopoulos T, Maylie J & Adelman JP (1995). Induction of endogenous channels by high levels of heterologous membrane proteins in Xenopus oocytes. Biophys J 69, 904–908. [DOI] [PMC free article] [PubMed] [Google Scholar]
- Vallon V, Schwark JR, Richter K & Hropot M (2000). Role of Na+/H+ exchanger NHE3 in nephron function: micropuncture studies with S3226, an inhibitor of NHE3. Am J Physiol Ren Physiol 278, F375–F379. [DOI] [PubMed] [Google Scholar]
- Villafuerte FC, Swietach P, Youm J-B, Ford K, Cardenas R, Supuran CT, Cobden PM, Rohling M & Vaughan-Jones RD (2014). Facilitation by intracellular carbonic anhydrase of Na+-HCO3− co-transport but not Na+/H+ exchange activity in the mammalian ventricular myocyte. J Physiol; DOI: 10.1113/jphysiol.2013.265439. [DOI] [PMC free article] [PubMed]
- Vince JW, Carlsson U & Reithmeier RA (2000). Localization of the Cl−/HCO3− anion exchanger binding site to the amino-terminal region of carbonic anhydrase II. Biochemistry 39, 13344–13349. [DOI] [PubMed] [Google Scholar]
- Vince JW & Reithmeier RA (1998). Carbonic anhydrase II binds to the carboxyl terminus of human band 3, the erythrocyte Cl−/HCOHCO3− exchanger. J Biol Chem 273, 28430–28437. [DOI] [PubMed] [Google Scholar]
- Vince JW & Reithmeier RA (2000). Identification of the carbonic anhydrase II binding site in the Cl-/HCO3- anion exchanger AE1. Biochemistry 39, 5527–5533. [DOI] [PubMed] [Google Scholar]
- Wang T, Yang CL, Abbiati T, Schultheis PJ, Shull GE, Giebisch G & Aronson PS (1999). Mechanism of proximal tubule bicarbonate absorption in NHE3 null mice. Am J Physiol-Ren Physiol 277, F298–F302. [DOI] [PubMed] [Google Scholar]
- Whitney PL (1974). Affinity chromatography of carbonic anhydrase. Anal Biochem 57, 467–476. [DOI] [PubMed] [Google Scholar]
- Yamada H, Horita S, Suzuki M, Fujita T & Seki G (2011). Functional role of a putative carbonic anhydrase II-binding domain in the electrogenic Na2HCO3− cotransporter NBCe1 expressed in Xenopus oocytes. Channels Austin Tex 5, 106–109. [DOI] [PubMed] [Google Scholar]
- Yang D, Shcheynikov N, Zeng W, Ohana E, So I, Ando H, Mizutani A, Mikoshiba K & Muallem S (2009). IRBIT coordinates epithelial fluid and HCO3− secretion by stimulating the transporters pNBC1 and CFTR in the murine pancreatic duct. J Clin Invest 119, 193–202. [DOI] [PMC free article] [PubMed] [Google Scholar]
Associated Data
This section collects any data citations, data availability statements, or supplementary materials included in this article.