Abstract
Fluorescence live-cell imaging allows for continuous interrogation of cellular behaviors, and the recent development of portable live-cell imaging platforms has rapidly transformed conventional schemes with high adaptability, cost-effective functionalities and easy accessibility to cell-based assays. However, broader applications remain restrictive due to compatibility with conventional cell culture workflow and biochemical sensors, accessibility to up-right physiological imaging, or parallelization of data acquisition. Here, we introduce miniaturized modular-array fluorescence microscopy (MAM) for compact live-cell imaging in flexible formats. We advance the current miniscopy technology to devise an up-right modular architecture, each combining a gradient-index (GRIN) objective and individually-addressed illumination and acquisition components. Parallelization of an array of such modular devices allows for multi-site data acquisition in situ using conventional off-the-shelf cell chambers. Compared with existing methods, the device offers a high fluorescence sensitivity and efficiency, exquisite spatiotemporal resolution (∼3 µm and up to 60 Hz), a configuration compatible with conventional cell culture assays and physiological imaging, and an effective parallelization of data acquisition. The system has been demonstrated using various calibration and biological samples and experimental conditions, representing a promising solution to time-lapse in situ single-cell imaging and analysis.
1. Introduction
Visualizing diverse anatomical and functional behaviors of single cells provides critical insights into the fundamentals of living organisms. Conventional assays rely on standard cell fixation to observe and characterize cells at discrete time points, insufficient to reveal many dynamic, rare and heterogeneous cellular events. In contrast, the rapid development of time-lapse imaging techniques permits uninterrupted and noninvasive interrogation of cells with exquisite spatiotemporal contextual details [1–3]. These techniques have greatly enabled recent studies on various dynamic cellular mechanisms and behaviors such as cell proliferation [4], morphology evolution [5], cell-cell interaction [6], and cell interaction with microenvironment [7].
To maintain optimum culture conditions for continuous and long-term observation, commonly-used live-cell imaging instruments equip conventional microscopy with environmental control and incubation systems [8,9]. However, these modalities regulate culture conditions less accurately compared to standard cell incubators, causing potential temperature inhomogeneity and the leakage of gas and humidity compositions [1,8]. As a result, the methods can induce cell stress due to environmental alterations from native physiological conditions, detrimental to many sensitive cell types and impeding long-term observation [10]. Furthermore, many of these high-end instruments lack the flexibility to adapt to diverse project-specific requirements and become impractical for those chip-based biological systems incompatible with conventional microscopy [11–13].
Addressing these challenges, the emergence of portable cell imaging strategies has thus far transformed many conventional schemes with high adaptability, cost-effective functionalities and easy accessibility to cell-based assays [14]. Integrating advanced fabrication, computation and sensor technologies, these platforms have been reported in various implementations such as lens-free techniques, smartphone imaging, and miniaturized microscopy [14]. Amongst these advancements, for example, lens-free and smartphone imaging methods bypass the restrictions of traditional optical hardware, thereby effectively overcoming either the fundamental trade-offs or the instrumentation complexity of lens-based imaging systems. These breakthroughs have exploited such versatility of adaptation and integration for cell diagnosis and analysis [15–20].
On the contrary to the lens-free or smartphone techniques, miniaturized microscopy retains commonly-adopted imaging features and sample assays of conventional microscopy, while particularly optimized for time-lapse cell observation in situ [21,22]. Specifically, various fluorescence implementations have been exploited for miniaturized microscopy to investigate cells with high sensitivity and molecular specificity [23–29]. The current architectures require specialized cell chambers, inverted microscope configurations, and mechanical scanning across a larger field of view. However, these features restrict experimental demands such as compatibility with conventional cell culture workflow, accessibility to up-right physiological imaging, integration with biochemical sensors under the cell platform, and parallelization of data acquisition [30,31]. Furthermore, many of these fluorescence components are additionally implemented to the existing bright-field miniaturized systems, adopting a broad-beam illumination or compound objective lenses, thus less optimum in image quality, fluorescence efficiency and phototoxicity for time-lapse observation. In this context, the fluorescence imaging capability of in situ microscopy remains to be fully explored to meet ever-increasing live-cell imaging needs.
Here, we introduce miniaturized modular-array microscopy (MAM) for compact portable fluorescence live-cell imaging in flexible formats. The MAM system is formulated on the basis of the emerging miniscopy technology for functional brain imaging, which has offered remarkable advantages in the fluorescence imaging capability, high flexibility and scalability, and open accessibility to mass-fabricated micro-optics and semiconductor optoelectronics [32,33]. In this work, we advanced the miniscopy architecture and designed compact up-right modular microscopes, implemented with gradient-index (GRIN) objectives and individually-addressed illumination and digital components. The system provides high fluorescence efficiency and low photo-toxicity and enables parallel data acquisition in situ using conventional off-the-shelf cell chambers. The modular device offers a high optical sensitivity and spatiotemporal resolution (∼3 µm laterally and up to 60 Hz), a configuration compatible with conventional cell culture assays and physiological imaging, and an enhanced imaging content through parallelization of data acquisition. The system has been demonstrated using various calibration and biological samples and experimental conditions, representing a promising solution to time-lapse in situ single-cell imaging and analysis.
2. Materials and methods
2.1. Cell staining
HEK-293 T and COS-7 cells were permeabilized by adding 4% Paraformaldehyde fixative solution for 12 min after washing with PBS several times. The fixative solution was prepared by diluting 3 mL of 16% aqueous paraformaldehyde solutions with 6 mL of PBS and 3 mL of Milli-Q water. Fixed cells were carefully washed with PBS and stained using fluorescent stock solutions prepared according to proper protocols provided by the distributor (Invitrogen). Nucleus were stained with 0.5 mL of 1× HCS NuclearMask Deep Red (H10294, Invitrogen) for 1 hour at room temperature. Mitochondria were co-stained by adding 0.05 µL from 500 nM working solutions of MitoTracker Deep Red FM (M22426 Invitrogen) and 0.4 µL from 200nM working solutions of MitoTracker Green FM (M7514, Invitrogen) probes. The 1 mL of complete DMEM were added with Mitochondria staining probes for 45 min at room temperature. For staining cytosol, we applied 100 nM of 1000× stock solutions of Image-iT DEAD Green viability (I10291, Invitrogen) on fixed cells for 30 min at room temperature. After proper application of fluorophore staining, we washed twice with HBSS to refrain from overloading. 2 mL of PBS were added to refrain from drying cells. For live-cell staining, the HCS NuclearMask Deep Red solutions were applied for 30 min inside the incubator and washed with PBS. Next, 2 mL of FluoroBrite DMEM (A18967-01, Gibco) were filled in multiwell plates for time-lapse imaging inside the incubator. All stained cells were prepared right before visualization.
2.2. Image alignment with inverted microscopy
We compared the image quality of the MAM system with that of an inverted microscope equipped with 10×, 0.3NA objective lens by imaging fixed COS-7 cells stained with HCS NuclearMask Deep Red using both systems. Given the different magnification and pixel size, i.e. 6.5 µm for the sCMOS camera (ORCA-Flash 4.0 V3, Hamamatsu) used in the inverted microscope and 6 µm for the CMOS sensor used in the MAM system, as well as the actual misalignment between the optical axis of the two setups, we realigned the images. First, we performed a preliminary coarse alignment by rotating the image obtained with an inverted microscope. To improve the effectiveness of image registration, we removed hot pixels and fixed-pattern noise in the MAM image through a feature-based approach [34], which could hinder feature matching. Hot pixels were substituted with the median value between neighboring pixels. Fixed-pattern stripes were removed by filtering the corresponding peak in the Fourier space.
2.3. Cytotoxicity assay
We prepared 1 mM of Paclitaxel (Taxol, P3456, Invitrogen) stock according to the protocol provided by the distributor (Invitrogen). For cytotoxicity test, we administered 400 nM of Taxol stock on live COS-7 cells for 8 hours inside the incubator. Before the end of Taxol application, we added HCS NuclearMask for 1 hour and Image-iT DEAD Green viability stain for 30 minutes inside the incubator. Next, we washed the cells with HBS several times before fixation steps. The fixation steps follow the above description in cell staining. Stained cells were filled with PBS for visualization. All cells for cytotoxicity assay were prepared right before visualization.
2.4. Image post-processing
We processed the raw images of fixed cell data by applying the Subtract Background built-in function in ImageJ with Rolling ball radius of 50 pixels with no other options applied. For live-cell data, we processed the time-lapse sequence of HCS NuclearMask Deep Red stained nucleus of COS-7 cells to remove the noise introduced by the CMOS sensor. First, we evaluated the pixel-dependent response of the chip. Then, we used the ACsN algorithm for the joint correction of CMOS-related noise in the acquired frames [35]. Briefly, the algorithm uses the sensor calibration to remove fixed-pattern noise and the optical parameters to estimate the noise variance in the Fourier space. Finally, all the input images were processed together by collaborative sparse filtering, which used the data correlation in both space and time to correct the CMOS noise while preserving the image details of the signals.
3. Results
3.1. Design and construction of the MAM system
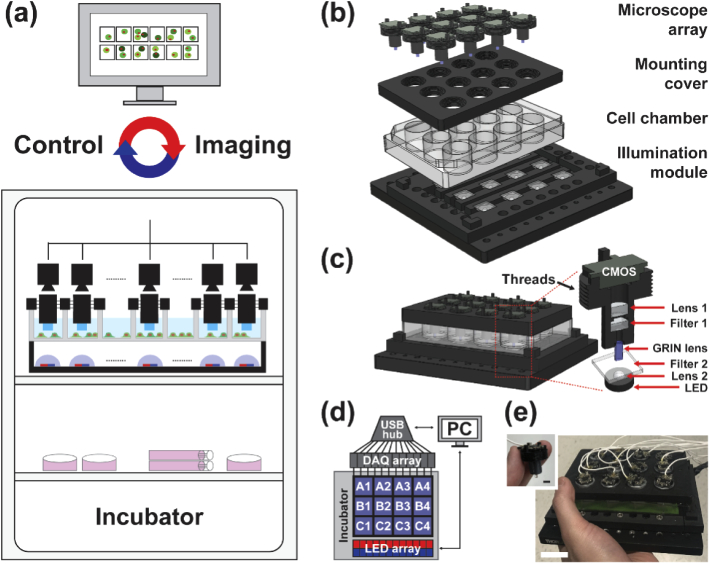
The MAM system is illustrated in Fig. 1(a) and Appendix 1 (Fig. 5), consisting of an imaging device compatible with various in situ conditions and associated with a control algorithm for system operation and data acquisition. The imaging device contains three main components: an array of modular microscopes, a mounting cover, and an illumination panel (Fig. 1(b,c)).
Fig. 1.
MAM system design and architecture. (a) Illustration of the MAM system operating inside the incubator and controlled by an external computer. (b,c) Architecture of the MAM system (b) and the modular miniaturized microscope (c). A 12-well plate is utilized for demonstration. (d) Modular devices are operated through individually addressed data acquisition boards (DAQ). (e) Photograph of the fully assembled MAM system on a 12-well plate, exhibiting a compact size in 15 cm × 15 cm × 3 cm, portable and accessible in various in situ conditions. The inset photograph shows a single modular detection unit. Scale bars: 25 mm (e), 5 mm (e, inset).
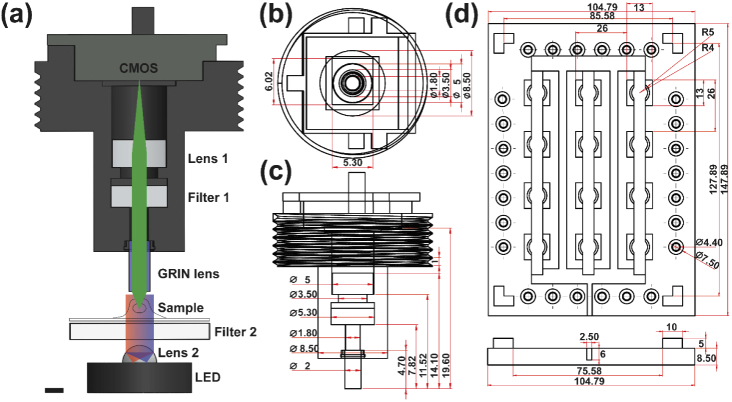
In particular, each miniaturized microscope was constructed using an infinitely-corrected GRIN lens (0.25 pitch, 0.5NA, GT-IFRL-200-inf-50-NC, GRINTECH), a customized dual-band emission filter (5.0 × 6.0 × 2.0 mm, ET520/30 & ET705/70, Chroma), an achromatic tube lens (45-207, Edmund), and a CMOS sensor (MT9V032C12STM, ON Semiconductor) [36]. Individual modular microscopes were threaded onto a 3D-printed mounting cover that environmentally encloses the cell culture chamber (e.g. a 12-well plate was utilized in this work as shown in Fig. 1(b)) and positions the microscopes in a user-defined array pattern according to the specimens of interest. The illumination panel consists of a corresponding array of multi-color LEDs (NeoPixel5050, ID1612, Adafruit) with peak spectra at 470 nm, 520 nm and 625 nm, half-ball lenses (90859, Edmund), and customized dual-band excitation filters (12.0 × 12.0 × 1.0 mm, ET-FITC/Cy5x, Chroma). The illumination panel was placed on a mounting plate (MSB15_M, Thorlabs). The overall device was designed with computer-aided software (Solidworks) and fabricated using a 3D printer (RS-F2-GPBK-04, FormLabs2) (Fig. 5(b-d)). The control system utilized a lab-written GUI (Visual Studio C++, LabVIEW, and Arduino) to operate the illumination panel and data acquisition. Flexible coaxial cables were used to supply power, operate hardware, and transmit image data with each CMOS sensor through their individual data acquisition boards (DAQ) (Fig. 1(d)). General hardware and CMOS operating software are openly available on miniscope.org. The MAM design documents and codes are available from the authors and on GitHub (https://github.com/shujialab/MAM). As a proof-of-concept, the fully assembled imaging device consisting of 12 modules is highly compact in 15 cm × 15 cm × 3 cm, permitting hand-held portability and accessibility to various in situ conditions (Fig. 1(e)).
Notably, the design and architecture of the MAM system offer several unique features compared to existing miniaturized microscopy. First, unlike compound objective lenses, GRIN lenses allow for water immersion and thus up-right imaging of cell populations with low cost, light weight (<1 g), small diameters (<1 mm), long relay lengths (>1 cm), and relatively high numerical aperture (NA, >0.45). Next, each modular microscope can be individually addressed, and their array distribution can be customized into various patterns to facilitate parallel acquisition from user-defined areas of interest. The associated mounting cover forms an effective enclosure to the cell culture condition and is adaptable to a wide range of imaging chambers such as cell culture dishes, plates and slides, as well as microfluidic chips. Furthermore, the design of the illumination and detection optics in MAM utilized schemes consistent with the miniscopy techniques to obtain optimum fluorescence efficiency, high image quality, and low phototoxicity [36,37].
3.2. System characterization
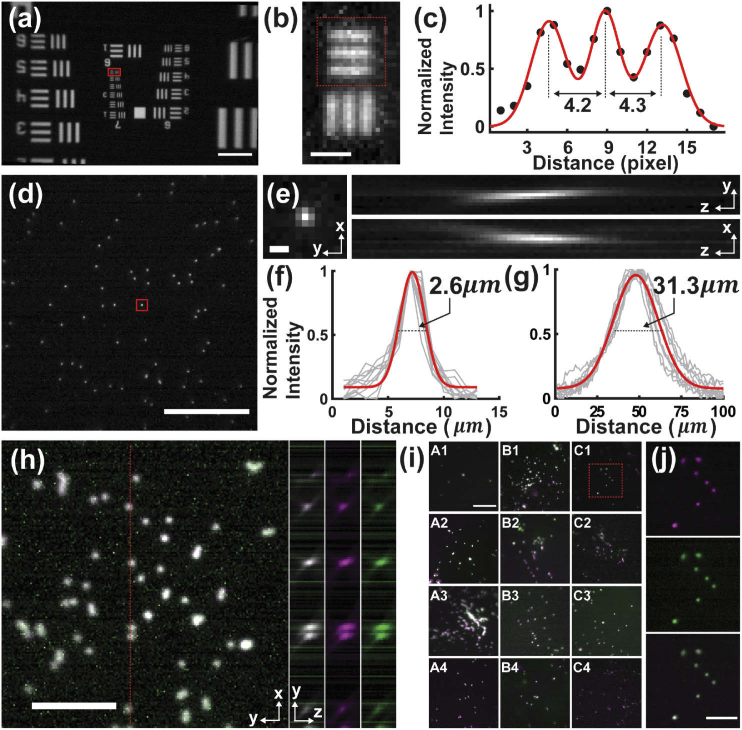
To characterize the MAM system, we first used the blue LED and imaged a water-immersed negative USAF target (R1DS1N, Thorlabs), attached to a green fluorescent slide (92001, Chroma) (Fig. 2(a)). A uniform fluorescence emission was observed throughout the full CMOS sensor (752 pixels × 480 pixels, physical pixel size = 6 µm), and the measurement of the calibration structures determined the magnification (∼6×) and the effective pixel size (1 µm) of the system (Fig. 2(a-c)).
Fig. 2.
System characterization of MAM. (a) Image of a fluorescent USAF 1591 target, showing the full FOV (750 μm × 450 μm) using a single modular unit. (b,c) Zoomed-in image (b, rotated by 90°) of the boxed region in (a) and the corresponding intensity profile (c) along the bars in the red box in (b). The profile resolves the calibration bars separated by a known distance of 4.4 μm over 4.2 or 4.3 pixels (physical pixel size = 6 μm), determining a ∼6× magnification of the MAM system. (d) Image of 2-μm fluorescent beads. (e,f) x-y, y-z and x-z views (e) of the point-spread function (PSF) generated using the bead as marked in (d). The measurement exhibited mean FWHM values of 2.6 ± 0.21 µm and 31.3 ± 3.6 µm in the lateral and axial dimensions (red), respectively, based on measurement of 10 beads (gray lines) over an axial range of 100 µm. (h) Merged two-color images of 4-µm TetraSpeck fluorescent beads. The inset images show the merged (left) and individual (middle and right) images in y-z. (i) Two-color images of 4-µm TetraSpeck fluorescent beads in a 12-well plate. (j) Zoomed-in individual and merged images of the boxed region in (i), showing a consistent spatial alignment. Scale bars: 100 µm (a,d,i), 50 µm (h,j), 10 µm (b), 3 µm (e).
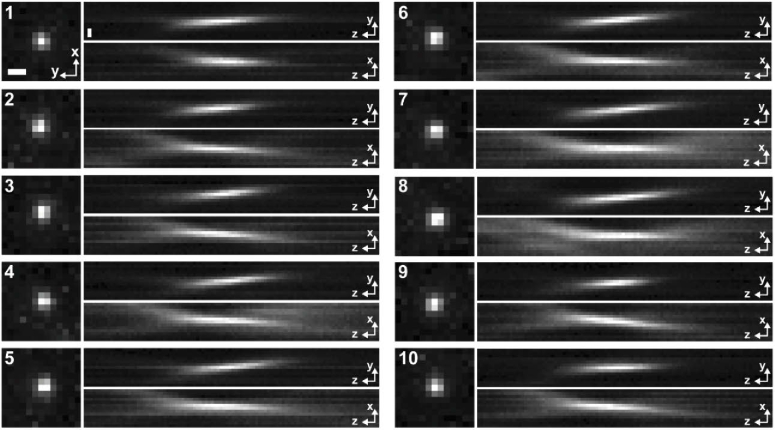
Next, we imaged 2-µm fluorescent beads (FSDG005, Bangs Laboratories) immersed in water on a glass slide and recorded the point-spread function (PSF) of the system at varying depths (Fig. 2(d-g) and Appendix 2 (Fig. 6)). The PSF images were Gaussian-fitted and exhibited FWHM values of ∼3 µm and ∼30 µm in the lateral and axial dimensions, respectively (Fig. 2(f,g)). It should be mentioned that the GRIN lens is not diffraction-limited due to aberrations. Therefore, the use of 2-µm beads allows viable measurements below the resolution of the system. As seen, the axial PSF is substantially extended due to the intrinsic spherical effects of the GRIN lens [38], which, however, effectively enhance the depth of focus (DOF) to cover the thickness of most single-cell specimens. Furthermore, we recorded the PSFs of the MAM system in different spectra using 4-µm fluorescent beads (TetraSpeck T7283, Invitrogen), showing a good agreement between the two-color PSFs in all three dimensions (Fig. 2(h)). Parallel two-color readouts from the entire array of microscopes on a 12-well plate demonstrated consistent alignments between spectral channels and across each modular device (Fig. 2(i,j) and Visualization 1 (25.3MB, avi) ).
3.3. In vitro cell imaging
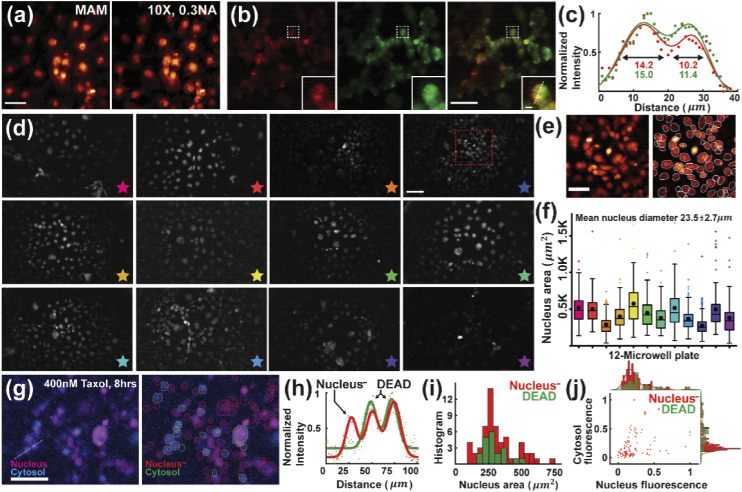
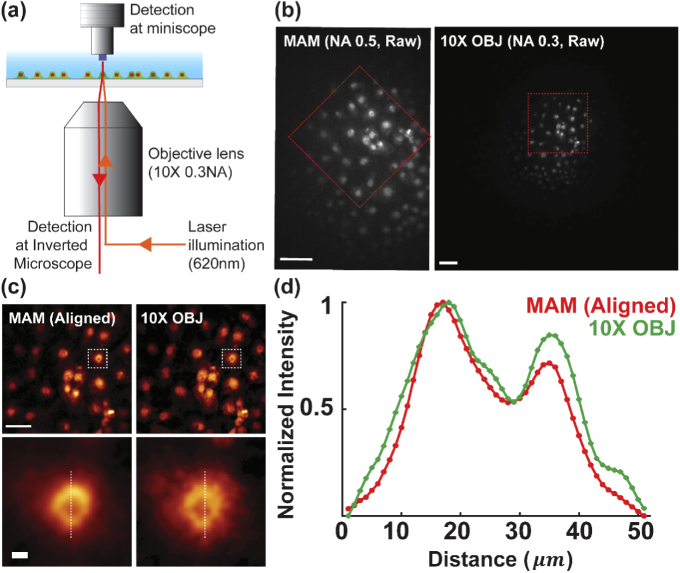
To demonstrate cell imaging, we first recorded the nuclei of COS-7 cells stained with HCS NuclearMask Deep Red (H10294, Invitrogen), showing consistent MAM image quality as compared with the same region taken by conventional inverted wide-field microscopy using a 10×, 0.3NA objective lens (Fig. 3(a) and Appendix 3 (Fig. 7)). It should be mentioned that in Fig. 3(a), we implemented a modular microscope (without the illumination panel) atop an inverted conventional epifluorescence microscope. This configuration allows for a simultaneous acquisition of the same cell population in a multi-scale fashion combining both the up-right MAM module and inverted conventional imaging (Appendix 3 (Fig. 7)).
Fig. 3.
MAM imaging of fixed cells. (a) Fixed COS-7 cell population stained with HCS NuclearMask Deep Red and imaged by an up-right MAM module and conventional epifluorescence microscopy using a 10×, 0.3NA objective. (b) HEK-293T cells co-stained with MitoTracker Deep Red (left) and Green (middle) and their merged image (right). The insets show the zoomed-in images of the corresponding boxed regions. (c) Cross-sectional profile of the normalized intensity along the dashed line in (b), showing consistent cell profiles and a good alignment between the two spectral channels. (d) Images of fixed COS-7 cells stained with HCS NuclearMask Deep Red taken by an array of 12 modular devices. (e) Zoomed-in image (left) of the boxed region in (d) and the corresponding segmented cells (right). (f) Measurement of the nucleus area in each modular image, showing an average of the nucleus diameter at 23.5 ± 2.7 µm. Each color of the measurement in (f) corresponds to the modular image marked by the star of the same color. (g) Left, two-color imaging of nucleus and cytosol in COS-7 cells. Right, segmented ROIs mark the dead (cytosol) and active (nucleus-) cells. (h) Normalized intensity profiles of nucleus (red) and cytosol (green) along the dashed line in (g), distinguishing different cell states. (i) Histogram of the nucleus area, showing consistent measurements between dead and active cells. (j) Scattering plot of the corresponding nucleus and cytosol fluorescence intensity of each cell. The histograms show consistent distribution in nucleus fluorescence between dead and active cells while distinct in cytosol fluorescence. Scale bars: 100 μm (a,b,d,g), 50 μm (e), 10 μm (b, inset).
To examine two-color imaging, we next imaged mitochondria in HEK-293 T cells, co-stained with MitoTracker in deep red (M22426) and green (M7514, Invitrogen) (Fig. 3(b)). Two-color MAM modular imaging showed a consistent distribution of cells across the field of view, as well as the quantitative measurement on their cross-sectional profiles in both channels (Fig. 3(b,c)).
Next, we utilized an array of 12 modular devices and performed MAM imaging of the nucleus-stained COS-7 cells using a 12-well, black-walled, and clear-bottom cell plate (P12-1.5P, Cellvis) (Fig. 3(d)). To facilitate in-focus acquisition throughout the entire array of FOVs, the focal planes of each miniaturized microscope can be fine-adjusted using the threads on the microscope body that position the camera sensor, which design also offers a high stability after each adjustment for time-lapse observation. As seen, individual cells can be clearly resolved and precisely identified in the MAM images using automatic nucleus segmentation [39] (Fig. 3(e)). We then measured all the segmented nucleus areas on the 12-well plate, showing consistent quantification of the cells across the array with an average nucleus size of 23.5 ± 2.7 µm, in a good agreement with the known size of ∼25.0 µm for COS-7 cells [40] (Fig. 3(f)).
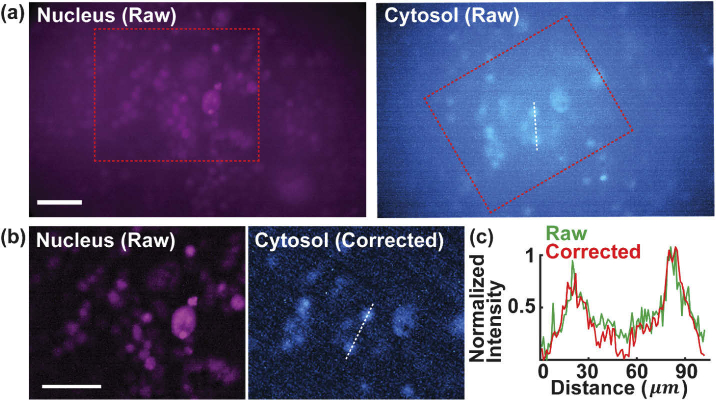
To further assess the usability of MAM to image and measure cytotoxicity, we conducted a two-color assay to determine viability of COS-7 cells. The assay allows for adding the fluorescent reagents, incubating for a time period, and visualizing the results without sample transfer or wash steps in situ. Specifically, the cells were treated with paclitaxel (Taxol) as a chemotherapeutic drug for 8 hours to destabilize the formation of cytoskeletons and induce apoptosis by blocking cell cycle [41,42]. We then labeled the nuclei of all the cells with HCS NuclearMask Deep Red (H10294, Invitrogen) and the dead cells with Image-iT DEAD Green (I10291, Invitrogen), a permeant dye only when the plasma membrane of cells becomes disrupted by Taxol. Using the red and blue LEDs, the MAM system sequentially acquired and registered the optical signals from the two channels (Fig. 3(g) and Appendix 4 (Fig. 8)). As seen, the two-color fluorescence assay distinguished the dead-cell population from the rest of the active cell population (marked as nucleus-), exhibiting a high spatial correlation and sensitivity based on fluorescence intensity (Fig. 3(h)). The areas of the nuclei of the two population groups were processed and measured, implying a consistent cell size between dead and active cells after drug treatment (Fig. 3(i)). Furthermore, as expected, the two-color fluorescence scatter plot distinguished cells of the two population groups (dead and nucleus-) of comparable nucleus fluorescence intensity while different expressions in cytosol (Fig. 3(j)). These measurements demonstrate the high resolution, sensitivity and assay-compatibility of the MAM system.
3.4. Live cell imaging inside a conventional incubator
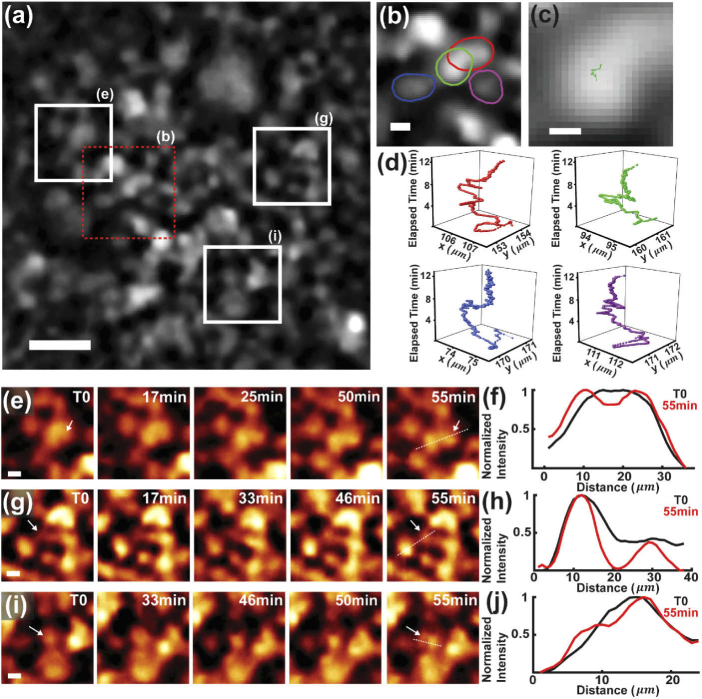
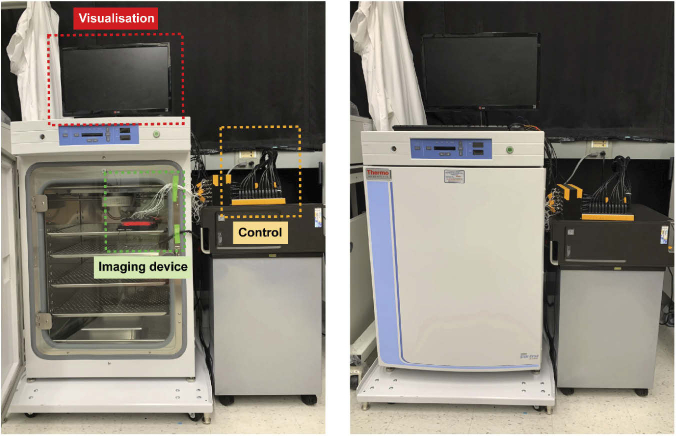
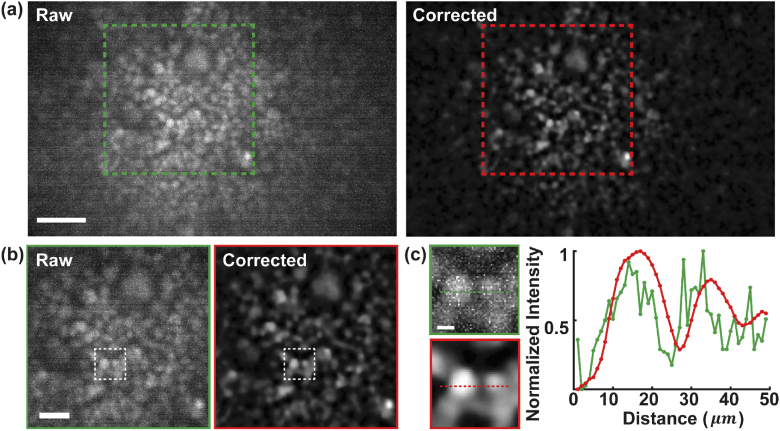
Retaining the physiological function of cells is essential for continuous, time-lapse observation and analysis. Thereby, it often remains as the ultimate limiting step to maintain an appropriate incubation and environmental condition. Here, we performed live-cell imaging inside a conventional incubator, where the compactness and portability of the MAM system permits feasible in situ microscopy (Appendix 5 (Fig. 9)). We imaged the nucleus-stained live COS-7 cells and tracked the cellular movement and proliferation (Fig. 4). The cell population was continuously recorded at 2 Hz, and individual cells were identified and segmented to generate the corresponding trajectories [43] (Fig. 4(a-d)). To facilitate the cell analysis, we have developed a denoising algorithm to enhance the SNR of live-cell imaging [35] (Appendix 6 (Fig. 10)). As seen, the sub-pixel movements of individual cells were localized and continuously tracked over a time period from minutes to about an hour without noticeable focal drifts, which in longer term, can be fine-adjusted using the threads and computationally correlated for uninterrupted frame-by-frame tracking. Furthermore, cell proliferation events were clearly visualized and quantitatively depicted to resolve the continuous formation of daughter cells over time (Fig. 4(e-j) and Visualization 2 (1.7GB, avi) ). It is noted that the high resolution of the MAM system allows for imaging of cell morphology, motility, and proliferation at a highly confluency level of >1000 cells/mm2.
Fig. 4.
MAM imaging of living COS-7 cells in incubator. (a) Representative image of COS-7 cells stained with HCS NuclearMask Deep Red. (b) Zoomed-in image of the dashed boxed region in (a), enclosing four representative segmented cells. (c) Tracking of the segmented cell outlined in green in (b). (d) Time-lapse trajectories of the four cells in (b) over a time period > 10 min, which localize the sub-pixel movements. (e-j) Time-lapse images (e,g,i) and corresponding intensity profiles along the dashed lines (f,h,j) of different cell populations with respect to the marked regions in (a), resolving cell proliferation events over a ∼1-h time period. The arrows point to the cells of interest in the measurements in (f,h,j). Scale bars: 50 μm (a), 10 μm (b,e,g,i), 5 μm (c).
4. Discussion and conclusions
We have developed miniaturized modular-array microscopy (MAM) for fluorescence live-cell imaging in a flexible and portable format. The system takes advantage of the emerging miniscopy technology and presents a new up-right architecture, integrating compact GRIN objectives and illumination and detection components. The modular design allows for feasible parallelization of multi-site data acquisition from conventional well plates using an array of the devices. The system provides a high fluorescence sensitivity and efficiency and resolution for capture of spatiotemporal details. It should be noted that the proof-of-concept could be readily extended to various cell culture chambers by customizing the mounting pattern of the array of the devices. It should also be mentioned that several recent developments of miniscopy have demonstrated significant advances by implementing such as light-field imaging [44], optical design [45], multi-focal phase mask [46], and computational frameworks [47], substantially enhancing the capability for imaging large-scale tissues with miniature systems. These concepts and designs are readily adaptable to improve the MAM system for single-cell studies. Other ongoing efforts strive to downsize each modular device to enhance the parallelization with a higher throughput and content. In addition, the system can be applied to various large-scale specimens beyond single cells by implementing motorized axial scanning. The imaging scheme presents minimal instrumental complexity and full compatibility with various cell culture, conventional microscopy or sensing modalities, and microfluidic configurations, permitting different levels of integration for long-term in situ single-cell imaging and analysis at the chip scale.
Acknowledgements
We acknowledge the support of the faculty start-up fund of Georgia Institute of Technology.
Appendix 1
Fig. 5.
Design and architecture of the modular device. (a) Illustration showing the propagation of light in the MAM system. Multi-color LED light is collimated through Lens 2 and an excitation filter (Filter 2). Fluorescence emission is collected by a GRIN lens, emission filter (Filter 1) and tube lens (Lens 1) and imaged by a CMOS sensor. (b,c) Top and side views of the modular microscope. (d) Top and side views of the illumination panel. (b-d) unit is mm. Scale bar: 2 mm (a).
Appendix 2
Fig. 6.
Point spread functions (PSFs) taken from various 2-µm fluorescent beads. The measurements are shown as gray lines in Fig. 2(f) in the main text. Scale bars: 3 µm.
Appendix 3
Fig. 7.
Correlative MAM and conventional wide-field imaging. (a) Experiment configuration for simultaneous cell imaging by MAM and an inverted microscope as in Fig. 3(a). The two modalities share the laser illumination from the wide-field setup. (b) The nucleus of COS-7 cells were imaged by both systems, exhibiting different fields of view and magnification. (c. top) Zoomed-in images of the boxed regions in (b) after image alignment process. (c. bottom) Zoomed-in images of the boxed regions in (c. top). (d) Cross-sectional profile of the normalized intensity along the dashed line in (c. bottom), showing consistent image contrast of single cells. Scale bars: 100 µm (b, c. top), 10 µm (c. bottom).
Appendix 4
Fig. 8.
Two-color images of nucleus and cytosol in COS-7 cells in Fig. 3(g). (a) Raw images of Nucleus and Cytosol stained COS-7 cells. (b) Zoomed-in images of raw nucleus and corrected cytosol of the dashed boxed regions in (a). (c) Cross-sectional profiles of the normalized intensity along the dashed line in (a) and (b). Scale bars: 100 µm.
Appendix 5
Fig. 9.
Photographs of the MAM system within an incubator (GT370FS, Thermo Fisher Scientific).
Appendix 6
Fig. 10.
Raw and processed images of nucleus-stained COS-7 cells. Red dashed box marks the region of Fig. 4(a) and the same region in raw image. (b) Zoomed-in images of the boxed regions in (a). (c) Zoomed-in images of the boxed regions in (b). Cross-sectional profile of the normalized intensity along the dashed line in (c). Scale bars: 100 µm (a), 50 µm (b), 10 µm (c).
Appendix 7
| Visualization 1 (25.3MB, avi) | Imaging two-color (left and right boxed panels) 4-µm TetraSpeck fluorescent beads by the MAM system as in Fig. 2(h). Scale bar: 100 µm. |
| Visualization 2 (1.7GB, avi) | Time-lapse recording of cell population and proliferation as in Fig. 4(e-i). Scale bar: 50 µm. |
Funding
Georgia Institute of Technology10.13039/100006778.
Disclosures
The authors declare that there are no conflicts of interest to this article.
References
- 1.Skylaki S., Hilsenbeck O., Schroeder T., “Challenges in long-term imaging and quantification of single-cell dynamics,” Nat. Biotechnol. 34(11), 1137–1144 (2016). 10.1038/nbt.3713 [DOI] [PubMed] [Google Scholar]
- 2.Yuan G.-C. C., Cai L., Elowitz M., Enver T., Fan G., Guo G., Irizarry R., Kharchenko P., Kim J., Orkin S., Quackenbush J., Saadatpour A., Schroeder T., Shivdasani R., Tirosh I., “Challenges and emerging directions in single-cell analysis,” Genome Biol. 18(1), 84 (2017). 10.1186/s13059-017-1218-y [DOI] [PMC free article] [PubMed] [Google Scholar]
- 3.Cooper S., Bakal C., “Accelerating live single-cell signalling studies,” Trends Biotechnol. 35(5), 422–433 (2017). 10.1016/j.tibtech.2017.01.002 [DOI] [PubMed] [Google Scholar]
- 4.Min M., Rong Y., Tian C., Spencer S. L., “Temporal integration of mitogen history in mother cells controls proliferation of daughter cells,” Science 368(6496), 1261–1265 (2020). 10.1126/science.aay8241 [DOI] [PMC free article] [PubMed] [Google Scholar]
- 5.Iannetti E. F., Smeitink J. A. M., Beyrath J., Willems P. H. G. M., Koopman W. J. H., “Multiplexed high-content analysis of mitochondrial morphofunction using live-cell microscopy,” Nat. Protoc. 11(9), 1693–1710 (2016). 10.1038/nprot.2016.094 [DOI] [PubMed] [Google Scholar]
- 6.Shaya O., Binshtok U., Hersch M., Rivkin D., Weinreb S., Amir-Zilberstein L., Khamaisi B., Oppenheim O., Desai R. A., Goodyear R. J., Richardson G. P., Chen C. S., Sprinzak D., “Cell-cell contact area affects notch signaling and notch-dependent patterning,” Dev. Cell 40(5), 505–511.e6 (2017). 10.1016/j.devcel.2017.02.009 [DOI] [PMC free article] [PubMed] [Google Scholar]
- 7.Ji K., Sameni M., Osuala K., Moin K., Mattingly R. R., Sloane B. F., “Spatio-temporal modeling and live-cell imaging of proteolysis in the 4D microenvironment of breast cancer,” Cancer Metastasis Rev. 38(3), 445–454 (2019). 10.1007/s10555-019-09810-8 [DOI] [PMC free article] [PubMed] [Google Scholar]
- 8.Frigault M. M., Lacoste J., Swift J. L., Brown C. M., “Live-cell microscopy - Tips and tools,” J. Cell Sci. 122(6), 753–767 (2009). 10.1242/jcs.033837 [DOI] [PubMed] [Google Scholar]
- 9.Schroeder T., “Long-term single-cell imaging of mammalian stem cells,” Nat. Methods 8(S4), S30–S35 (2011). 10.1038/nmeth.1577 [DOI] [PubMed] [Google Scholar]
- 10.Varma S., Voldman J., “Caring for cells in microsystems: principles and practices of cell-safe device design and operation,” Lab Chip 18(22), 3333–3352 (2018). 10.1039/C8LC00746B [DOI] [PMC free article] [PubMed] [Google Scholar]
- 11.El-Ali J., Sorger P. K., Jensen K. F., “Cells on chips,” Nature 442(7101), 403–411 (2006). 10.1038/nature05063 [DOI] [PubMed] [Google Scholar]
- 12.Huh D., Hamilton G. A., Ingber D. E., “From 3D cell culture to organs-on-chips,” Trends Cell Biol. 21(12), 745–754 (2011). 10.1016/j.tcb.2011.09.005 [DOI] [PMC free article] [PubMed] [Google Scholar]
- 13.Chin L. K., Lee C.-H., Chen B.-C., “Imaging live cells at high spatiotemporal resolution for lab-on-a-chip applications,” Lab Chip 16(11), 2014–2024 (2016). 10.1039/C5LC01556A [DOI] [PubMed] [Google Scholar]
- 14.Yang K., Wu J., Santos S., Liu Y., Zhu L., Lin F., “Recent development of portable imaging platforms for cell-based assays,” Biosens. Bioelectron. 124-125, 150–160 (2019). 10.1016/j.bios.2018.10.024 [DOI] [PubMed] [Google Scholar]
- 15.Greenbaum A., Luo W., Su T.-W., Göröcs Z., Xue L., Isikman S. O., Coskun A. F., Mudanyali O., Ozcan A., “Imaging without lenses: achievements and remaining challenges of wide-field on-chip microscopy,” Nat. Methods 9(9), 889–895 (2012). 10.1038/nmeth.2114 [DOI] [PMC free article] [PubMed] [Google Scholar]
- 16.Roy M., Seo D., Oh S., Yang J. W., Seo S., “A review of recent progress in lens-free imaging and sensing,” Biosens. Bioelectron. 88, 130–143 (2017). 10.1016/j.bios.2016.07.115 [DOI] [PubMed] [Google Scholar]
- 17.Ozcan A., McLeod E., “Lensless Imaging and Sensing,” Annu. Rev. Biomed. Eng. 18(1), 77–102 (2016). 10.1146/annurev-bioeng-092515-010849 [DOI] [PubMed] [Google Scholar]
- 18.Liu X., Lin T.-Y., Lillehoj P. B., “Smartphones for cell and biomolecular detection,” Ann. Biomed. Eng. 42(11), 2205–2217 (2014). 10.1007/s10439-014-1055-z [DOI] [PubMed] [Google Scholar]
- 19.Kanchi S., Sabela M. I., Mdluli P. S., Inamuddin K., Bisetty, “Smartphone based bioanalytical and diagnosis applications: A review,” Biosens. Bioelectron. 102, 136–149 (2018). 10.1016/j.bios.2017.11.021 [DOI] [PubMed] [Google Scholar]
- 20.Berg B., Cortazar B., Tseng D., Ozkan H., Feng S., Wei Q., Chan R. Y. L., Burbano J., Farooqui Q., Lewinski M., Di Carlo D., Garner O. B., Ozcan A., “Cellphone-Based Hand-Held Microplate Reader for Point-of-Care Testing of Enzyme-Linked Immunosorbent Assays,” ACS Nano 9(8), 7857–7866 (2015). 10.1021/acsnano.5b03203 [DOI] [PubMed] [Google Scholar]
- 21.Kim S. B., in Koo K., Bae H., Dokmeci M. R., Hamilton G. A., Bahinski A., Kim S. M., Ingber D. E., Khademhosseini A., “A mini-microscope for in situ monitoring of cells,” Lab Chip 12(20), 3976–3982 (2012). 10.1039/c2lc40345e [DOI] [PMC free article] [PubMed] [Google Scholar]
- 22.Gürkan G., Gürkan K., “Incu-Stream 1.0: An open-hardware live-cell imaging system based on inverted bright-field microscopy and automated mechanical scanning for real-time and long-term imaging of microplates in incubator,” IEEE Access 7, 58764–58779 (2019). 10.1109/ACCESS.2019.2914958 [DOI] [Google Scholar]
- 23.Zhang Y. S., Ribas J., Nadhman A., Aleman J., Selimović Š., Lesher-Perez S. C., Wang T., Manoharan V., Shin S. R., Damilano A., Annabi N., Dokmeci M. R., Takayama S., Khademhosseini A., “A cost-effective fluorescence mini-microscope for biomedical applications,” Lab Chip 15(18), 3661–3669 (2015). 10.1039/C5LC00666J [DOI] [PMC free article] [PubMed] [Google Scholar]
- 24.Jin D., Wong D., Li J., Luo Z., Guo Y., Liu B., Wu Q., Ho C. M., Fei P., “Compact wireless microscope for in-situ time course study of large scale cell dynamics within an incubator,” Sci. Rep. 5(1), 18483 (2015). 10.1038/srep18483 [DOI] [PMC free article] [PubMed] [Google Scholar]
- 25.Kim J., Henley B. M., Kim C. H., Lester H. A., Yang C., “Incubator embedded cell culture imaging system (EmSight) based on Fourier ptychographic microscopy,” Biomed. Opt. Express 7(8), 3097 (2016). 10.1364/BOE.7.003097 [DOI] [PMC free article] [PubMed] [Google Scholar]
- 26.Chan A. C. S., Kim J., Pan A., Xu H., Nojima D., Hale C., Wang S., Yang C., “Parallel Fourier ptychographic microscopy for high-throughput screening with 96 cameras (96 Eyes),” Sci. Rep. 9(1), 11114 (2019). 10.1038/s41598-019-47146-z [DOI] [PMC free article] [PubMed] [Google Scholar]
- 27.Tristan-Landin S. B., Gonzalez-Suarez A. M., Jimenez-Valdes R. J., Garcia-Cordero J. L., “Facile assembly of an affordable miniature multicolor fluorescence microscope made of 3D-printed parts enables detection of single cells,” PLoS One 14(10), e0215114 (2019). 10.1371/journal.pone.0215114 [DOI] [PMC free article] [PubMed] [Google Scholar]
- 28.Rodríguez-Pena A., Uranga-Solchaga J., Ortiz-de-Solórzano C., Cortés-Domínguez I., “Spheroscope: A custom-made miniaturized microscope for tracking tumour spheroids in microfluidic devices,” Sci. Rep. 10(1), 2779 (2020). 10.1038/s41598-020-59673-1 [DOI] [PMC free article] [PubMed] [Google Scholar]
- 29.Beck C. L., Hickman C. J., Kunze A., “Low-cost calcium fluorometry for long-term nanoparticle studies in living cells,” Sci. Rep. 10(1), 12568 (2020). 10.1038/s41598-020-69412-1 [DOI] [PMC free article] [PubMed] [Google Scholar]
- 30.Rajan D. K., Kreutzer J., Välimäki H., Pekkanen-Mattila M., Ahola A., Skogberg A., Aalto-Setälä K., Ihalainen H., Kallio P., Lekkala J., “A portable live-cell imaging system with an invert-upright-convertible architecture and a mini-bioreactor for long-term simultaneous cell imaging, chemical sensing, and electrophysiological recording,” IEEE Access 6, 11063–11075 (2018). 10.1109/ACCESS.2018.2804378 [DOI] [Google Scholar]
- 31.Välimäki H., Verho J., Kreutzer J., Kattipparambil Rajan D., Ryynänen T., Pekkanen-Mattila M., Ahola A., Tappura K., Kallio P., Lekkala J., “Fluorimetric oxygen sensor with an efficient optical read-out for in vitro cell models,” Sens. Actuators, B 249, 738–746 (2017). 10.1016/j.snb.2017.04.182 [DOI] [Google Scholar]
- 32.Ghosh K. K., Burns L. D., Cocker E. D., Nimmerjahn A., Ziv Y., El Gamal A., Schnitzer M. J., “Miniaturized integration of a fluorescence microscope,” Nat. Methods 8(10), 871–878 (2011). 10.1038/nmeth.1694 [DOI] [PMC free article] [PubMed] [Google Scholar]
- 33.Aharoni D., Khakh B. S., Silva A. J., Golshani P., “All the light that we can see: a new era in miniaturized microscopy,” Nat. Methods 16(1), 11–13 (2019). 10.1038/s41592-018-0266-x [DOI] [PMC free article] [PubMed] [Google Scholar]
- 34.Zitová B., Flusser J., “Image registration methods: A survey,” Image Vis. Comput. 21(11), 977–1000 (2003). 10.1016/S0262-8856(03)00137-9 [DOI] [Google Scholar]
- 35.Mandracchia B., Hua X., Guo C., Son J., Urner T., Jia S., “Fast and accurate sCMOS noise correction for fluorescence microscopy,” Nat. Commun. 11(1), 94 (2020). 10.1038/s41467-019-13841-8 [DOI] [PMC free article] [PubMed] [Google Scholar]
- 36.Son J., Mandracchia B., Caponegro M. D., Tsirka S. E., Jia S., “BSSE: An open-source image processing tool for miniaturized microscopy,” Opt. Express 27(13), 17620–17637 (2019). 10.1364/OE.27.017620 [DOI] [PMC free article] [PubMed] [Google Scholar]
- 37.Cai D. J., Aharoni D., Shuman T., Shobe J., Biane J., Song W., Wei B., Veshkini M., La-Vu M., Lou J., Flores S. E., Kim I., Sano Y., Zhou M., Baumgaertel K., Lavi A., Kamata M., Tuszynski M., Mayford M., Golshani P., Silva A. J., “A shared neural ensemble links distinct contextual memories encoded close in time,” Nature 534(7605), 115–118 (2016). 10.1038/nature17955 [DOI] [PMC free article] [PubMed] [Google Scholar]
- 38.Aharoni D., Hoogland T. M., “Circuit investigations with open-source miniaturized microscopes: past, present and future,” Front. Cell. Neurosci. 13, 141 (2019). 10.3389/fncel.2019.00141 [DOI] [PMC free article] [PubMed] [Google Scholar]
- 39.Schmidt U., Weigert M., Broaddus C., Myers G., “Cell detection with star-convex polygons,” in International Conference on Medical Image Computing and Computer-Assisted Intervention (MICCAI, 265–273 (2018). [Google Scholar]
- 40.Sagi Y., Basser P., Assaf Y., “Estimation of cell size using the composite hindered and restricted model of diffusion,” in Proceedings 17th Scientific Meeting, International Society for Magnetic Resonance in Medicine (2009), p. 1390. [Google Scholar]
- 41.Mielgo A., Torres V. A., Clair K., Barbero S., Stupack D. G., “Paclitaxel promotes a caspase 8-mediated apoptosis through death effector domain association with microtubules,” Oncogene 28(40), 3551–3562 (2009). 10.1038/onc.2009.210 [DOI] [PMC free article] [PubMed] [Google Scholar]
- 42.De P., Carlson J. H., Leyland-Jones B., Williams C., Dey N., “Triple fluorescence staining to evaluate mechanism-based apoptosis following chemotherapeutic and targeted anti-cancer drugs in live tumor cells,” Sci. Rep. 8(1), 13192 (2018). 10.1038/s41598-018-31575-3 [DOI] [PMC free article] [PubMed] [Google Scholar]
- 43.Sbalzarini I. F., Koumoutsakos P., “Feature point tracking and trajectory analysis for video imaging in cell biology,” J. Struct. Biol. 151(2), 182–195 (2005). 10.1016/j.jsb.2005.06.002 [DOI] [PubMed] [Google Scholar]
- 44.Skocek O., Nöbauer T., Weilguny L., Martínez Traub F., Xia C., Molodtsov M., Grama A., Yamagata M., Aharoni D., Cox D. D. D. D., Golshani P., Vaziri A., “High-speed volumetric imaging of neuronal activity in freely moving rodents,” Nat. Methods 15(6), 429–432 (2018). 10.1038/s41592-018-0008-0 [DOI] [PMC free article] [PubMed] [Google Scholar]
- 45.Scott B. B., Thiberge S. Y., Guo C., Tervo D. G. R., Brody C. D., Karpova A. Y., Tank D. W., “Imaging Cortical dynamics in GCaMP transgenic rats with a head-mounted widefield macroscope,” Neuron 100(5), 1045–1058.e5 (2018). 10.1016/j.neuron.2018.09.050 [DOI] [PMC free article] [PubMed] [Google Scholar]
- 46.Yanny K., Antipa N., Liberti W., Dehaeck S., Monakhova K., Liu F. L., Shen K., Ng R., Waller L., “Miniscope3D: optimized single-shot miniature 3D fluorescence microscopy,” Light: Sci. Appl. 9(1), 171 (2020). 10.1038/s41377-020-00403-7 [DOI] [PMC free article] [PubMed] [Google Scholar]
- 47.Xue Y., Davison I. G., Boas D. A., Tian L., “Single-shot 3D wide-field fluorescence imaging with a Computational miniature mesoscope,” Sci. Adv. 6(43), eabb7508 (2020). 10.1126/sciadv.abb7508 [DOI] [PMC free article] [PubMed] [Google Scholar]


