

Abstract
Measurements of cellular pH are used to infer information such as stage of cell cycle, presence of cancer and other diseases, as well as delivery or effect of a therapeutic drug. Surface enhanced Raman spectroscopy (SERS) of nanoparticle-based pH probes have been used to interrogate intracellular pH, with the significant advantage of avoiding photobleaching compared to fluorescent indicators. 4-mercaptobenzoic acid (MBA) is a commonly used pH sensitive reporter molecule. Intracellular pH sensing by surface enhanced Raman spectroscopy requires analysis of the observed MBA spectrum and spectral interference can affect the pH determination. Background from common cell containers, imaging too few particles, signal to noise ratios, and degradation of reporter molecules are among the factors that may alter appropriate SERS-based pH determination in cells. Here, we have compared common methods of spectral analysis to see how different factors alter the calculated pH in Raman maps of MBA functionalized Au nanostars in SW620 cancer cells. The methods included in our comparison use the relative intensity of the ν(COO−) stretch, chemometric analysis of the ν8a mode, and analyzing the frequency shift of the ν8a mode. These methods show different sensitivity to some of these sources of error in live cell experiments. pH determination based on Raman frequency shift appears to give a more reliable pH determination, though in high signal to noise environments, intensity ratios may provide better sensitivity to small changes in pH for cellular imaging.
Keywords: SERS, Raman, microscopy, pH, cellular imaging
Introduction
The local pH of biological systems changes with cellular events and phenotypes. For example, tumor cells are known to develop a more acidic extracellular matrix,1 cellular pH is known to change during cell division,2,3 and different cellular compartments maintain different pH.4,5 Measuring pH in cells therefore allows monitoring of biological conditions or events. A variety of methods have been developed for either whole cell or subcellular pH determinations, with surface enhanced Raman spectroscopy (SERS) showing promise as a technique resistant to photobleaching and able to monitor changes in subcellular pH over time.
Raman microspectroscopy is a label-free technique capable of revealing the spatial distribution of analyte molecules based on the vibrational modes of the analyte.6 Raman spectroscopy measures the inelastic scattering of light, which is a weak effect and often lacks the sensitivity necessary for detecting low concentrations in biological samples. SERS provides an enhanced Raman spectrum of analytes near the surface of plasmonic nanoparticles.7,8 A common approach to pH sensing is to attach molecules to nanoparticles, where the vibrational modes of the attached molecule changes upon protonation/deprotonation. These pH sensitive molecules attached to nanoparticles provide a sensitive probe that can be incorporated into cells at low concentrations and detected in Raman imaging experiments.3,4,9–13
4-mercaptobenzoic acid (MBA) is a pH sensitive molecule with a large Raman cross section and a thiol functionality, and is therefore commonly attached to nanoparticles for this purpose. MBA has multiple pH sensitive features that can be calibrated and used to make pH measurements. The peaks at 1380 cm−1 and 1410 cm−1 are attributed to COO− stretching and are therefore present in the spectrum of deprotonated MBA.4,9–21 The orientation of the MBA molecule on the nanoparticle surface can alter which of the two peaks is observed in the SERS spectrum.13,18–21 These features at 1380 cm−1 and 1410 cm−1 have been used for extracellular pH detection by a SERS probe anchored to the cell membrane.13 The peak around 1700 cm−1 is attributed to a COOH stretch, and is therefore present in the protonated state of MBA.9,10,12–14,18,20,21 The frequency of the ν8a ring breathing mode (around 1580 cm−1) is also known to shift with changing pH.18,19,22 Other peaks are affiliated with the protonated or deprotonated state of the molecule, but have much lower intensity relative to the spectral features described. Indeed other molecules have pH sensitive properties, but the MBA molecule is prominently used in the SERS literature, and thus the focus of the current study.4,9–15,17,18,18,19,21–24
For imaging in cells, and other biological systems, it is desirable to detect a single functionalized nanoparticle probe. While common colloidal nanoparticles have been used,4,9,11,12,14,17,23 more intense Raman scattering from MBA can be achieved through of the use of asymmetric nanoparticles. Asymmetric nanoparticles, such as rods and nanostars, provide greater SERS enhancements relative to the enhancements obtained from spherical nanoparticles due to strong electric fields at the tips of such particles.25 The enhanced electric fields enable SERS detection of nanostars without aggregating the particles, a condition typically required with colloidal gold.26 These increased electromagnetic field enhancements provided by gold nanostars have been used for a variety of SERS sensing applications including extracellular biomarker detection,27 intracellular RNA detection,28 selective tumor imaging,29 imaging of cell membrane receptors,30 and pH sensing.
The SERS spectrum of MBA has been shown to be sensitive to aspects of chemical environment aside from pH, potentially confounding pH measurement by SERS. Decarboxylation of MBA on Au and Ag surfaces is an established phenomenon with features attributable to thiophenol in SERS spectra.21 The features arising from decarboxylation have been further observed to increase in intensity with increasing laser power, increasing acquisition time, and increasing pH.13,14,24,31,32 Orientation of the MBA molecule on the surface of a nanoparticle is thought to determine rate of decarboxylation, with COO− groups close to the metal surface more likely to undergo decarboxylation.18,21 An alternative explanation for the presence of peaks resembling thiophenol in SERS spectra of MBA is the interaction of binding partners with MBA,33–35 though this hypothesis has yet to find support in the calculated spectra of MBA with binding partners.
Here, we compare three methods to analyze the SERS spectra observed from plasmonic nanostars functionalized with MBA for pH sensing in cells.9,13,14,18 The nanostars used for pH measurement in cells in this study have been co-functionalized with MBA and a cell penetrating peptide (CPP12-Cys) for cytosolic delivery of the particles in SW620 cancer cells. Nanoparticles can be trapped in endosomes upon endocytosis, where the pH is more acidic than the cytosol of cells.4,5,36 Accurate determination of pH assists in determining the fate of the nanostars within the cells. We compare the ratio of the integrated intensity of the ν(COO-) stretch normalized to the ν8a mode, the most often used method for pH sensing by SERS of MBA, with two methods based on the shift of the intense ν8a mode. The latter two methods have not, to the best of our knowledge, been used yet for pH sensing in cells, despite the advantages of using a high intensity peak at a frequency outside the range of glass photoluminescence background. Our results suggest that the method of pH analysis can be biased by measurement conditions and provide insight into the preferred method for different experimental situations.
Materials and Methods
All reagents were purchased from Sigma Aldrich unless otherwise specified. Ultrapure water was obtained from an in-house Milli-Q unit. CPP12-Cys was synthesized by the Pei group at The Ohio State University as reported previously.37 SW620 colon cancer cell lines (human Caucasian colon adenocarcinoma) were obtained from ATCC (Manassas, Va). Cell media (RPMI), fetal bovine serum (FBS), and phosphate buffered saline (PBS) were purchased from Thermo Fisher (Gibco).
Raman Spectroscopy:
Raman measurements were obtained on two different Raman spectrometers. A custom Snowy Range IM-52 spectrometer with a 638 nm laser was used in calibration experiments. A Renishaw InVia Qontor Raman microscope with three excitation lasers (532 nm, 633 nm, and 785 nm) was used for Raman maps of cellular samples. A 63x dipping objective was used (LEICA 63x catalog # 506148) for cell imaging experiments. Cell maps were acquired the same day, and the Renishaw spectrometer was calibrated with a silicon reference. There was no visible evidence of cell damage in the maps used (other maps with different acquisition parameters had resulted in visible rupture of cells). Raman maps were collected in the spectral range between 719.12 and 1816.9 cm−1 using a 1200 l/mm grating and a single 10 s accumulation per pixel. Confocal images were acquired with 5 mW power at the sample. Linefocus images were acquired with 10 mW power at the sample.
Solution pH Measurements:
Solution pH was measured using an Orion™ PerpHecT™ ROSS™ Combination pH Micro Electrode calibrated at pH 2, 4, 7, and 11 with a precision of 0.01 pH.
Nanostar synthesis:
Different batches of nanostars were synthesized, characterized, and used in these experiments. Nanostars were synthesized using a seed mediated method.38 Prior to use, stir bars and glassware were thoroughly cleaned with NoChromix and aqua regia, washed with soap and water, rinsed thoroughly with ultrapure water, and rinsed three times with boiling ultrapure water. Au seeds were synthesized by adding 0.500 mL of a 10 mM HAuCl4 solution to 10 mL of a 100 mM CTAC solution in a round bottom flask while vigorously stirring. 150 μL of a 100 mM NaBH4 solution (chilled) was added approximately 30 seconds later. The solution was then stirred for 3 minutes and stored in the fridge for 20 hours before use in nanostar seeded growth synthesis.
Nanostars were then grown by combining 9 mL of 100 mM CTAC solution vigorously stirring in a round bottom flask with 450 μL of a 10 mM HAuCl4 solution. After approximately 20 seconds 90 uL of a 10 mM AgNO3 solution, 180 μL of a 1.2 M HCl solution, and 90 μL of a 100 mM (L)ascorbic acid were quickly added, in order, to the flask. The solution was vigorously stirred for 2 minutes. During this time 1 μL of seed solution from the 4° C fridge was added to 1 mL of a 100 mM CTAC solution to dilute the seed. Next, 10 μL of this diluted seed solution was added and the solution to stirred for a further 20 minutes. 1 mL of the solution was extracted for characterization of the NS, the remainder was centrifuged (6000 g for 20 minutes) and the pellet was resuspended in 1 mL of milli Q water.
Nanostar Characterization:
The synthesized nanostars were characterized by transmission electron microscopy (TEM), ultraviolet-visible (UV-Vis) extinction spectroscopy, and nanoparticle tracking analysis (NTA). TEM measurements were obtained using a Tecnai F20 electron microscope in the Center for Electron Microscopy and Analysis (CEMAS) at The Ohio State University. UV-Vis extinction measurements were obtained on VWR UV-1600PC spectrometer. NTA analysis was performed using a Malvern NanoSight (NS300).
Nanostar Functionalization:
10 μL of a 2.0 mM MBA solution (3.8 mg in 12.7 mL ethanol) was added to 1 mL of nanostars solution, and the solution was left shaking for approximately 20 hours. The solution was centrifuged at 6000 g for 5 minutes, the supernatant was removed, and the pellet resuspended in 1 mL ultrapure water. For imaging experiments, a cell penetrating peptide (CPP) was co-adsorbed to the nanostars. 2 μL of the 2.0 mM MBA solution and 20 μL of 2.97×10⁻⁴ M CPP was added to 200 μL of nanostars solution, and the solution was left shaking for approximately 20 hours. The solution was then centrifuged at 6000 g for 5 minutes, the supernatant was removed, and the pellet resuspended in 700μL ultrapure water. Before use, nanostar concentration and particle size distribution were determined by NTA.
Cell Culture:
SW620 colon cancer cell lines (human Caucasian colon adenocarcinoma) were cultured in RPMI media with 10% FBS added according to established protocols.39 Cells were taken from the cell culture incubator and placed under the microscope. Two days prior to Raman microscopy experiments, 106 cells were plated in glass dishes with 3 mL RPMI+10% FBS. 2 hours prior to Raman measurements, the culture media was replaced, and 18.7 μL of the CPP and MBA functionalized nanostars was added to the culture system.
Data Analysis:
Vibrational bands observed were fit with a gaussian lineshape using a Matlab script.40 The mean fit error of the peak fit at approximately 1580 cm−1 of each spectrum was required to be less than 15%, otherwise the spectrum was excluded from analysis.
PCA was performed in Matlab. The calibration spectra were truncated to the spectral range between 1540 cm−1 to 1620 cm−1, baseline corrected, mean centered and the variance scaled to unity, before PCA. Principal component 2 (PC2) scores for each spectrum were plotted against pH and fit to provide a calibration curve. PC2 scores of mean-centered, unit variance spectra in cells were determined in Wire by direct classical least squares (DCLS) regression. The scores were associated with a pH using the calibration model.
Results
Nanostars were synthesized, characterized by UV-Visble spectroscopy (see Supplemental Material Figures S1), nanoparticle tracking analysis (Table SI) and transmission electron microscopy (Figure S2). The synthesized nanostars where then functionalized with MBA. Figure 1 shows the SERS spectra obtained from solutions of MBA functionalized Au nanostars as function of pH. Solutions of 1x PBS were pH adjusted with addition of 0.1 M HCl or NaOH, in order to achieve the desired pH. For each pH, 300 μL of buffer was added to 30 μL of MBA functionalized nanostars in a glass vial. Raman spectra were immediately acquired using a SnRI Raman spectrometer using 60 s integration time and 3 replicate acquisitions. The spectra were collected with a power at the sample of approximately 20 mW and were referenced to the detector signal with the laser off. The pHs of the solutions were verified after obtaining the Raman spectrum. The data in Figure 1 show the expected changes in spectral lineshape with changing pH.4,9–18,22,24
Figure 1:
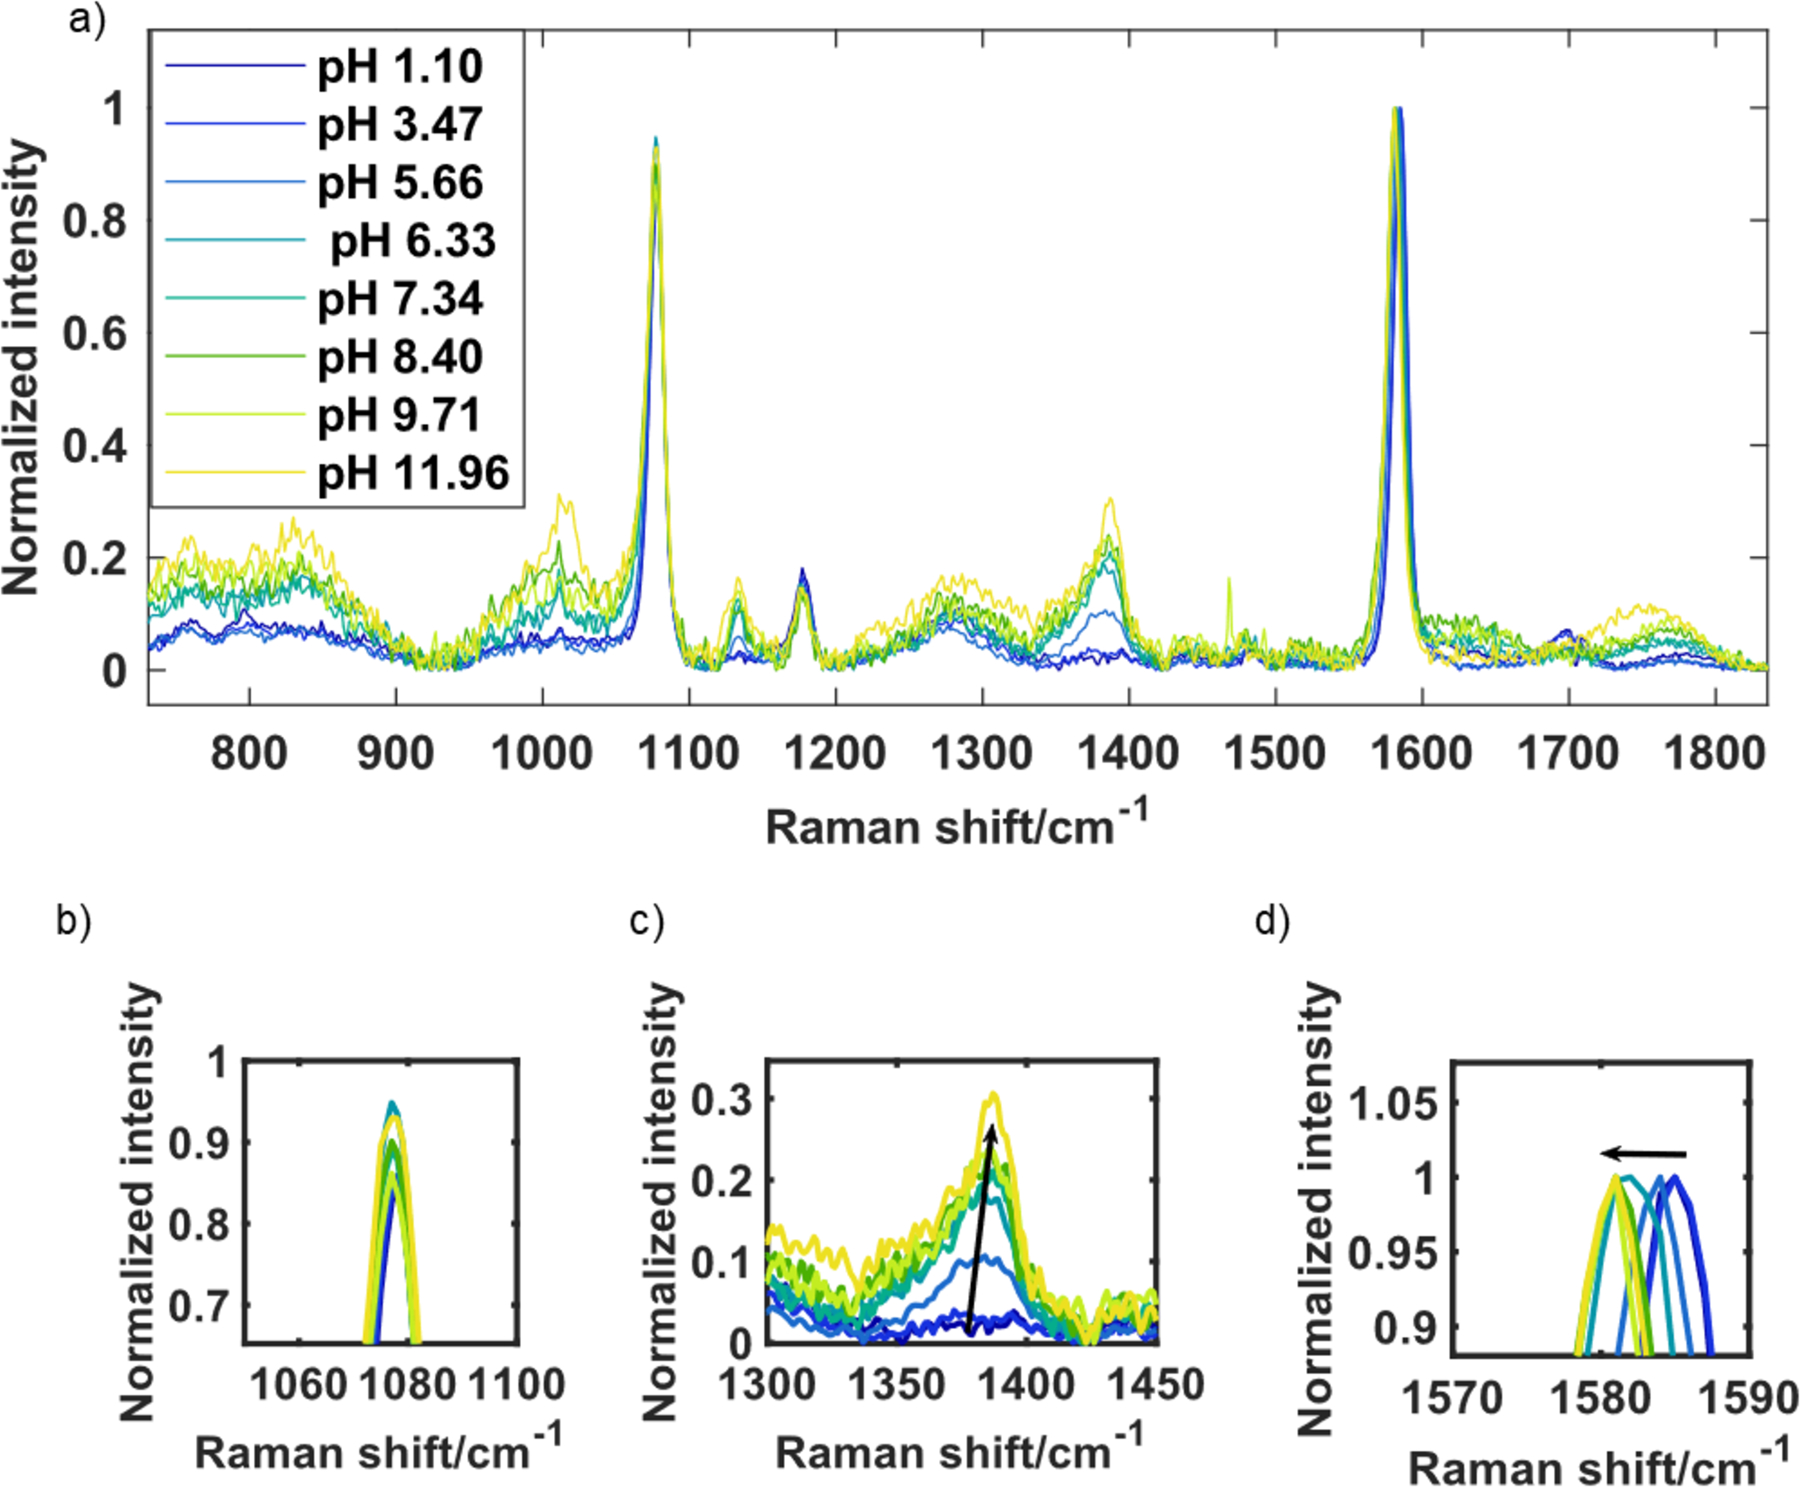
The SERS spectra of MBA functionalized nanostars changes as a function of pH. a) baseline corrected and normalized spectra; zoom plots of (b) the peak around 1080 cm−1 does not show significant variation with pH, (c) the peak around 1380 cm−1 increases in intensity with pH, and (d) the peak around 1580 cm−1 redshifts with an increase in pH.
The SERS data shown in Figure 1 were used as calibration data and processed using three spectral analysis methods to generate models to determine pH from the SERS data (Figure 2). The spectra were background corrected using the spectrum of unfunctionalized nanostars. The methods used represent common methods by which MBA SERS probes have been calibrated and applied to make pH measurements previously.4,9–18,22,24 The three methods chosen for analysis are: the intensity ratio of the ν(COO−) stretch (1380 cm−1) to the ν8a ring breathing mode (1580 cm−1), PCA analysis of the frequency shift of the ν8a ring breathing mode, and relative frequency shift of the ν8a ring breathing mode vs the ν12 ring breathing at 1080 cm−1. In all three methods the response as function of pH was determined and plotted vs. pH to generate calibration curves. The calibration data shows the expected sigmoidal shape and was fit to a sigmoidal curve as follows:
| (1) |
Where k is the range of the data, a is a slope factor, and z is the inflection point.
Figure 2:
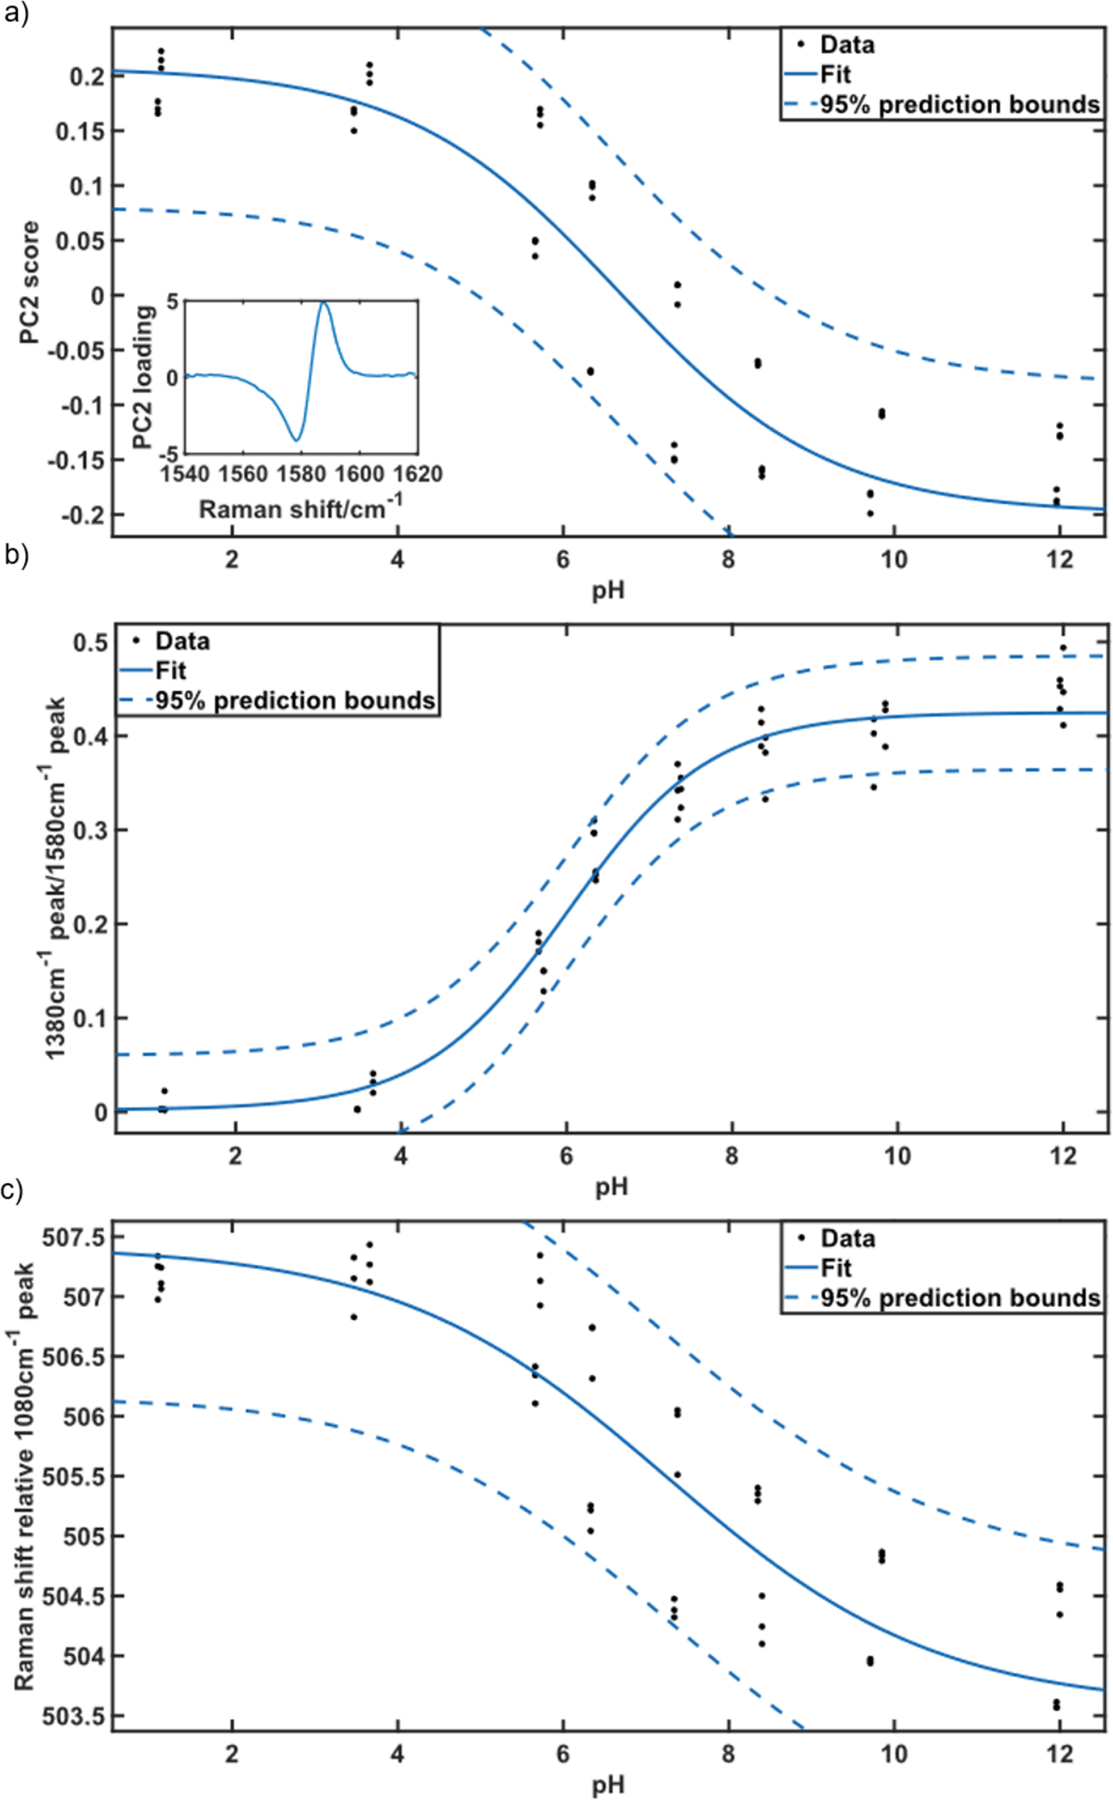
Models of pH based on the SERS response of MBA-functionalized nanoparticles: (a) scores for PC2 plotted against pH, inset PC2 loading; (b) integrated intensity of the ν(COO−) mode (1380 cm−1) relative to the integrated intensity of the ν8a ring breathing mode (1580 cm−1) plotted against pH; (c) Raman shift of the center of the ν8a ring breathing mode relative to the center of the ν12 ring breathing mode (1080 cm−1).
The peak ratio of the ν(COO−) stretch to the ν8a ring breathing mode is commonly used to determine pH, as this ratio increases with increased deprotonation of MBA.4,9–17 The ratio was determined from areas of a gaussian lineshape fit to the peaks around 1380 cm−1 and 1580 cm−1. The mean fit error of the peak fit of the ν8a ring breathing mode at 1580 cm−1 of each spectrum was required to be less than 15%, otherwise the spectrum was excluded from analysis. This threshold avoids using spectra with low, or no signal in the analysis. This method is robust for measurement of pH of nanoparticle solutions, as evidenced in a lower error of calibration relative to other methods (Table I, Figure 2a). This method uses the appearance and disappearance of bands associate with the change in protonation of the COOH – COO− functional group. The ν(COO−) band appears at basic pH (Figure 1c), is often low in intensity and can be difficult to clearly discern in low signal to noise ratio measurements.
Table I:
Comparison of methods for pH determination from MBA SERS probes. The data was mean centered and normalized.
| pH calibration method | RMSE of normalized fit | slope coefficient +/− 95% confidence |
|---|---|---|
| Peak intensity ratio 1380cm−1 /1580cm−1 | 0.17 | 0.50 +/− 0.10 |
| PCA [1540 – 1620 cm−1] | 0.40 | 0.34 +/− 0.12 |
| 1580cm−1 peak shift | 0.45 | 0.26 +/− 0.10 |
Chemometric methods have also been applied to determine pH based on changes in the SERS spectra of MBA-functionalized probes.22,24 The frequency of the ν8a ring breathing mode (1580 cm−1) is also reported to be sensitive to pH, and principal component analysis (PCA) of a region of the MBA spectra encompassing the ν8a ring breathing mode was shown to model changes in pH.22 We applied PCA to this region of our spectra. Our results indicate that PC1 is attributed to differences in signal to noise and was found to have little correlation with pH (see Supplemental Material, Figure S3); however, PC2 has a strong pH dependence (Figure 2b). No further components were used for analysis, as these first two principal components together account for over 99% of the variance in the data. This method tracks the frequency of the ν8a ring breathing mode, and experiment to experiment reproducibility is sensitive to the calibration and resolution of the spectrometer. The calibration was performed on the Snowy Range spectrometer, which has a resolution of 8 cm−1. The uncertainty in this method may be improved with a higher resolution spectrometer.
To account for possible changes in frequency calibration, we also report the shift in the ν8a ring breathing mode relative to the ν12 ring breathing mode at 1080 cm−1. In our analysis, the frequency of each band was determined by a fit to a gaussian lineshape. The ν12 ring breathing mode does not show significant change in frequency with pH and provides an internal frequency standard to correct for calibration. The relative frequency of the ν8a ring breathing mode shows a systematic shift that can be correlated to the solution pH (Figure 1d, Figure 2c), in agreement with previous reports.18,19,22 The results for this calibration method are similar to the PCA method, which is not surprising as they measure changes of the same spectral feature.
Table I compares the results from the 3 methods of pH sensing applied. The normalized root mean square error (RMSE) suggests that the ratio method provides the most precise measure of pH. Similarly, the slope of the calibration curve also suggests the ratio method is the most sensitive. However, the ratio requires the ν(COO−) mode to be clearly observed and higher signal to noise ratio measurements. The ν8a ring breathing mode is one of the most intense bands in the SERS spectrum, which enables detection and pH determination in low signal to noise environments.
Raman mapping of CPP-MBA-nanostars in cells was performed on SW620 cells. The cells were taken from the cell culture incubator and placed under the microscope immediately before measurements. The SERS signal from the cells was mapped. Figure 3 and Figure 4 show SW620 cells that were incubated with nanostars co-functionalized with MBA and the CPP. Figure 3 shows a high-resolution confocal Raman map of a cell aggregate, while Figure 4 shows a linefocus scan of a larger field of view and the correspondingly larger number of cells. The CPP was added to promote internalization of the nanostars into the cells. The addition of the CPP does not contribute to the SERS spectrum observed. The SERS spectrum is dominated by the MBA molecule on the surface of the nanostars (see Supplemental Material, Figure S4). The heatmaps in Figures 3b and 4b are plots of the correlation coefficients of each spectra with the MBA reference spectrum (blue). The Raman map of the cells and nanostars were obtained and the non-negative least squares analysis of an MBA reference (Figure 3b) was used to determine the location of nanostars in the Raman map.
Figure 3:
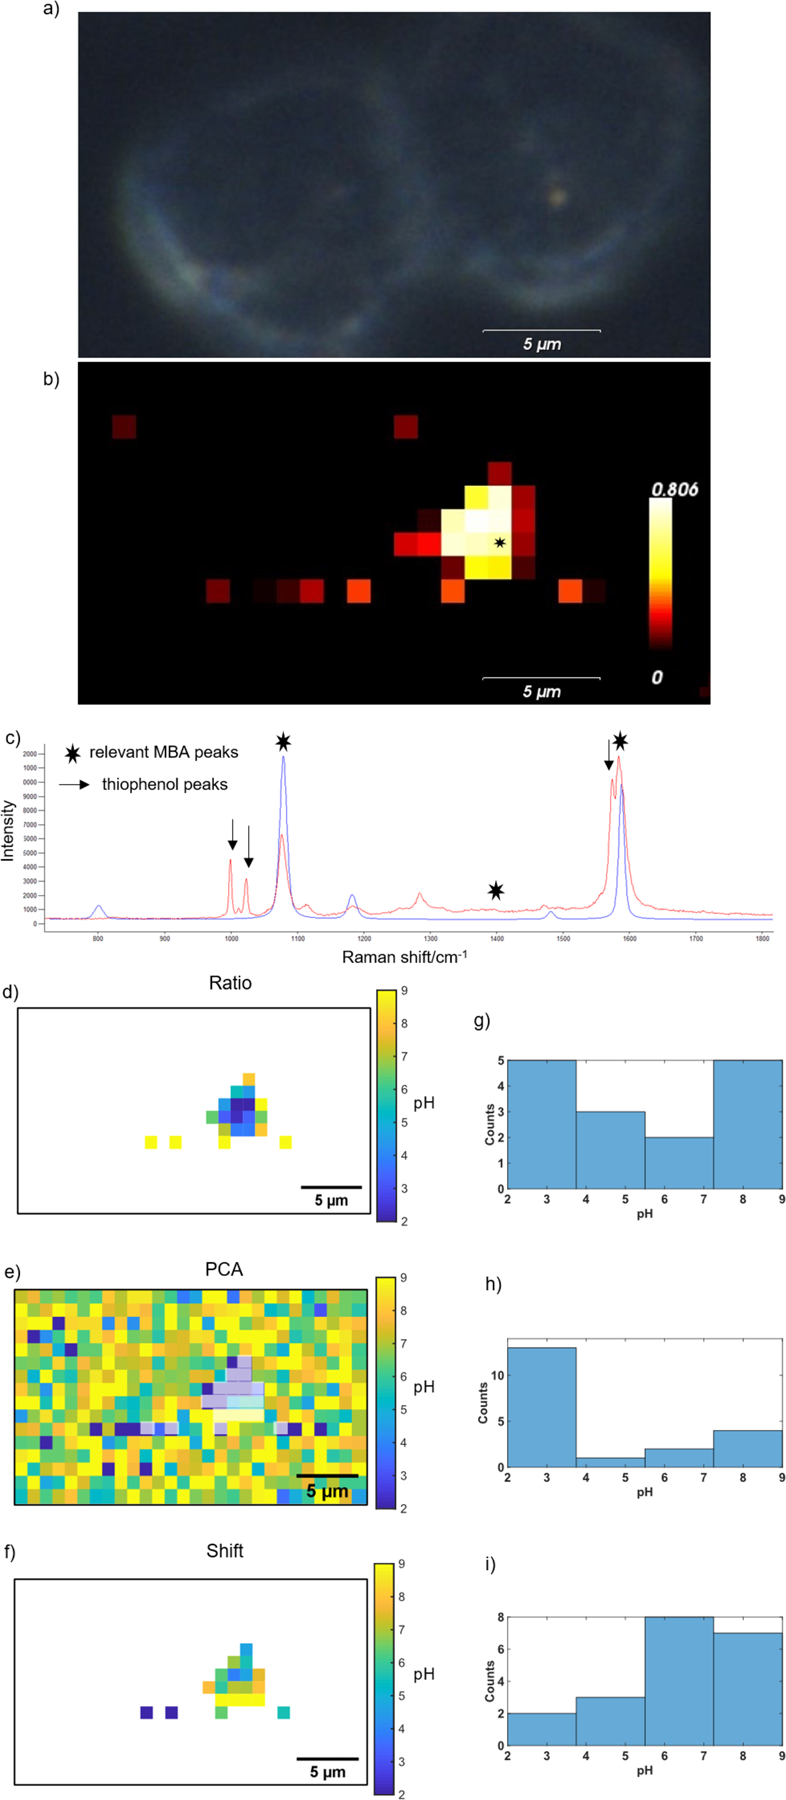
(a) Darkfield image and corresponding (b) Raman map of cells incubated with SERS pH probes; (c) sample spectrum of higher intensity signal from map. Heatmap is non-negative least squares agreement of each spectrum with the MBA reference spectra in blue (used to create all heatmaps). The spectrum in red corresponds to the location with an asterisk in the heatmap. The pH maps corresponding to the Raman map were calculated using: (d) ratio method, (e) PCA method, and (f) shift method. Histograms show the distribution of predicted pHs, with values below pH 2 represented by pH 2 and values above pH 9 represented at pH 9 to include all data points in the histogram by (g) ratio method, (h) PCA method, (i) shift method.
Figure 4:
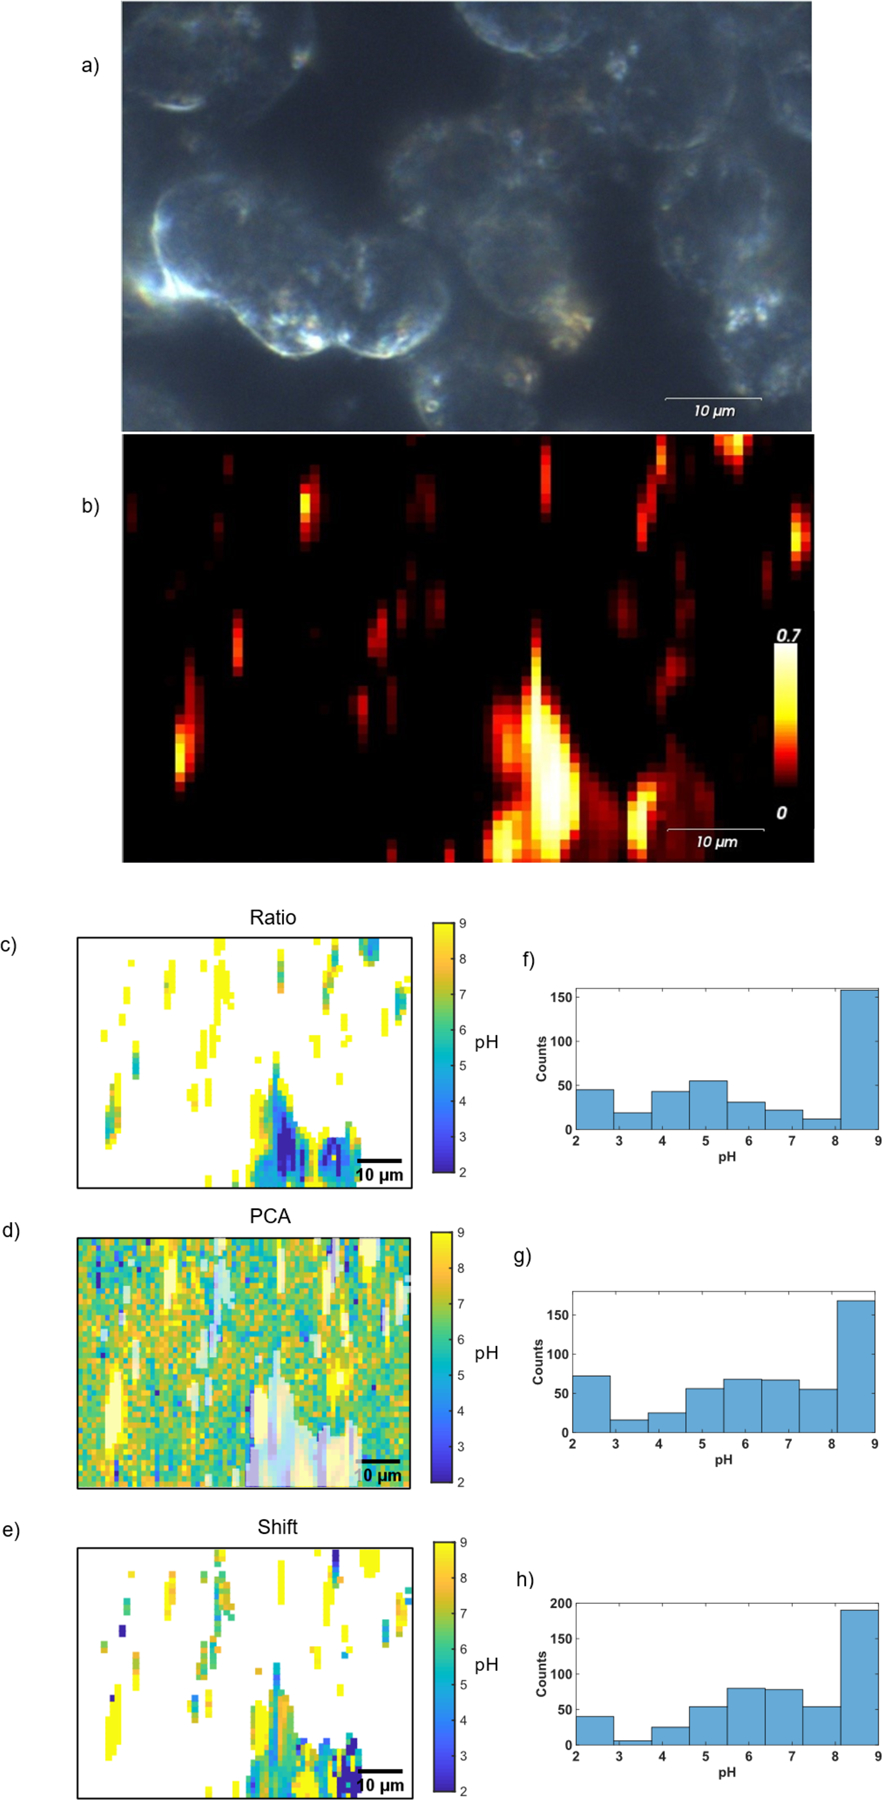
(a) Darkfield image and corresponding (b) Raman map of cells incubated with SERS pH probes. The pH maps corresponding to the Raman map were calculated using: (c) ratio method, (d) PCA method, (e) shift method. Histograms show the distributions of calculated pH, with values below pH 2 represented by pH 2 and values above pH 9 represented at pH 9 to include all data points in the histogram by (f) ratio method, (g) PCA method, (h) shift method.
The pH models developed above (Figure 2) were applied to the SERS data to determine the local pH of the nanostar probes. Figure 3d–f and Figure 4c–e show the pH calculated for nanostars detected in the SERS maps of cells. The pH maps and histograms were set to have a maximum pH of 9 and a minimum pH of 2, as these values are both beyond the expected range of physiological pH and beyond the predictive range for the established pH models. Differences between methods are observed in the distributions of pH values in the histograms. It should be noted that the ratio and shift methods require the MBA spectrum to be observed, while the PCA method will provide a pH value for all points in the image. We have added shading to the PCA-calculated pH maps to indicate the points that correspond to the other methods. Additionally, histogram distributions of the PCA method include only the data that are included in other methods. Interestingly, the pH distribution for the ratio method shows a distinct and significant difference from the pH distributions using the frequency of the ν8a ring breathing mode. The ratio method has a greater number of spectra with predicted pH values of 3.5–5.5, whereas the shift and PCA methods have a greater number of spectra with predicted pH values of about 5–7 (Figure 3g, h, i and Figure 4f, g, h). Additionally, the pH maps of the ratio method reveal a bias toward low pH with higher signal intensity (Figure 3d, g; Figure 4c, f).
The different pH models give different predicted pH values in cells, as each method is sensitive to different factors. The ratio method is signal to noise limited, requiring moderately high signal to noise in order to reliably quantify the ν(COO−) band.4,11 At low signal, the ν(COO−) stretch cannot be detected, and there is a bias toward acidic pH. Decarboxylation of MBA has previously reported, with features attributed to thiophenol at 1003 cm−1 (βCH), 1026 cm−1 (βCH) and 1576 cm−1 (νCC).21,31,32 These same features are evident in the spectrum shown in Figure 3c at 1000 cm−1, 1023 cm−1, and 1575 cm−1. Decarboxylation has been found to influence the ratio method of pH determination.13,14,24 Though it can be accounted for in data processing,13 sufficient decarboxylation will result in poor signal to noise of the ν(COO−) stretch. Both Figure 3d and Figure 4c show a decrease in predicted pH by the ratio method with increase in signal intensity (and decarboxylation), and Figure 3c suggests decarboxylation of a large portion of the MBA molecules has led to inaccurate pH sensing in certain cases. Decarboxylation has been observed to be dependent on pH and laser power,26,27 and therefore occurs to various degrees for spectra acquired from cells. Overlap of the thiophenol ring breathing mode with the MBA ν8a ring breathing mode around 1580 cm−1 leads to a lower predicted pH. Conversely, spectra of low intensity (with less decarboxylation) are affected more severely by background signal. At 785nm laser excitation, commonly used for biological samples, a glass background influences the peak ratio method.24 The glass photoluminescence overlaps the ν(COO−) stretch around 1380 cm−1, resulting in higher predicted pH. The ratio is therefore influenced by variability in signal intensity common in SERS due to irregularities in enhancement of Raman scattering by SERS probes. Figure 3g shows both high and low extreme pH values. High values are likely due to glass background and low values are likely due to decarboxylation of MBA. Additionally the ν(COO−) stretch is known to be subject to variability such as shifts in frequency and changes in linewidth with pH,10,18,20,21 making reliable peak fitting more challenging.
The PCA method does not provide an intrinsic means of determining the presence of nanostars in pH maps. The other methods used a cutoff for the mean fit error of the ν8a peak, also used in pH determination for these methods. The PCA method may also show sensitivity to decarboxylation; the growth of the thiophenol ring breathing peak (Figure 3c) occurs within the wavenumber range used for PCA, and therefore effects the scores of the spectra for PC2 (Figure 1a).
Despite measuring changes in the same spectral feature, the shift method appears less sensitive than the PCA method to the differences in intensity between spectra when applied in cells. This results in more physiological reasonable predicted pHs (Figure 3h, i). The shift method may be less influenced by the growth of the thiophenol peak, and better able to monitor the shift of the v8a ring breathing mode known to occur with varying protonation state.18,19,22 The vibrational modes used for this method are intense, allowing for accurate determination of peak centers at lower signal to noise. This is particularly advantageous when measuring cellular pH to avoid local heating and enable more rapid mapping for time lapse experiments. Although the least sensitive to small changes in pH, the shift method is straightforward to apply, and less susceptible to sources of error common in cellular measurements.
Conclusion
Analysis of pH in cells using SERS of MBA functionalized nanoparticles by common methods have been shown here to result in intensity dependent inaccuracies of predicted pH. A comparison of the limitations or challenges for the application of each method to cellular pH sensing is shown in Table II.
Table II:
Comparison of the practical use of various data analysis methods for pH determination in cells by MBA SERS probes.
| pH calibration method | Limitations/challenges |
|---|---|
| • Peak intensity ratio 1380 cm−1 /1580 cm−1 |
|
| • PCA [1540 – 1620 cm−1] |
|
| • 1580 cm−1 peak shift |
|
Variability in SERS intensity detected from pH probes in cells is often unavoidable due to the anisotropic shape or aggregation of particles necessary for large signal enhancements. Inaccuracies due to variation in signal intensity may be largely attributable to decarboxylation of MBA, though additional factors such as glass photoluminescence and intermolecular interactions may contribute as well. Many methods of analysis for pH determination rely on quantifying peaks that may be below the limit of detection in some spectra. pH determination based on the shift of the v8a ring breathing mode of MBA appears to avoid the intensity dependence of pH predictions in cells. Effects of the environment on a pH probe is not unique to SERS,41 and may be more easily understood by SERS than other methods. pH sensing methods that take advantage of frequency changes in high intensity peaks are easier to observe, and probes that generate frequency changes in high intensity Raman bands in optically silent portions of the spectrum should improve sensing. Optimization of SERS based pH sensing will improve understanding of pH environments in cells.
Supplementary Material
Acknowledgements
The authors thank Prof. Dehua Pei for helpful discussions. Electron microscopy was performed at the Center for Electron Microscopy and Analysis (CEMAS) at The Ohio State University. This work was funded by the National Institutes of Health, National Institutes of General Medical Sciences award R01 GM109988 and The National Cancer Institute through Ohio State University Comprehensive Cancer Center under grant number P30 CA016058.
Footnotes
Supplemental Material
All supplemental material mentioned in the text, including nanoparticle characterization and PCA component 1, is available in the online version of the journal.
References
- 1.Kato Y, Ozawa S, Miyamoto C, Maehata Y, Suzuki A, Maeda T, et al. “Acidic Extracellular Microenvironment and Cancer”. Cancer Cell Int. BioMed Central, 2013. 13(1): 89–89. 10.1186/1475-2867-13-89. [DOI] [PMC free article] [PubMed] [Google Scholar]
- 2.Flinck M, Kramer SH, Pedersen SF. “Roles of pH in Control of Cell Proliferation”. Acta Physiol. John Wiley & Sons, Ltd, 2018. 223(3): e13068 10.1111/apha.13068. [DOI] [PubMed] [Google Scholar]
- 3.Zheng X-S, Zong C, Wang X, Ren B. “Cell-Penetrating Peptide Conjugated SERS Nanosensor for in Situ Intracellular pH Imaging of Single Living Cells during Cell Cycle”. Anal. Chem 2019. 91(13): 8383–8389. 10.1021/acs.analchem.9b01191. [DOI] [PubMed] [Google Scholar]
- 4.Kneipp J, Kneipp H, Wittig B, Kneipp K. “Following the Dynamics of pH in Endosomes of Live Cells with SERS Nanosensors”. J. Phys. Chem. C 2010. 114(16): 7421–7426. 10.1021/jp910034z. [DOI] [Google Scholar]
- 5.Casey JR, Grinstein S, Orlowski J. “Sensors and Regulators of Intracellular pH”. Nat. Rev. Mol. Cell Biol 2010. 11(1): 50–61. 10.1038/nrm2820. [DOI] [PubMed] [Google Scholar]
- 6.Smith R, Wright KL, Ashton L. “Raman Spectroscopy: an Evolving Technique for Live Cell Studies”. Analyst. The Royal Society of Chemistry, 2016. 141(12): 3590–3600. 10.1039/C6AN00152A. [DOI] [PubMed] [Google Scholar]
- 7.Langer J, Jimenez de Aberasturi D, Aizpurua J, Alvarez-Puebla RA, Auguié B, Baumberg JJ, et al. “Present and Future of Surface-Enhanced Raman Scattering”. ACS Nano. American Chemical Society, 2020. 14(1): 28–117. 10.1021/acsnano.9b04224. [DOI] [PMC free article] [PubMed] [Google Scholar]
- 8.Pilot R, Signorini R, Durante C, Orian L, Bhamidipati M, Fabris L. “A Review on Surface-Enhanced Raman Scattering”. Biosensors. MDPI, 2019. 9(2): 57 10.3390/bios9020057. [DOI] [PMC free article] [PubMed] [Google Scholar]
- 9.Zhang Z, Bando K, Mochizuki K, Taguchi A, Fujita K, Kawata S. “Quantitative Evaluation of Surface-Enhanced Raman Scattering Nanoparticles for Intracellular pH Sensing at a Single Particle Level”. Anal. Chem 2019. 91(5): 3254–3262. 10.1021/acs.analchem.8b03276. [DOI] [PubMed] [Google Scholar]
- 10.Pallaoro A, Braun GB, Reich Norbert.O., Moskovits M. “Mapping Local pH in Live Cells Using Encapsulated Fluorescent SERS Nanotags”. Small. John Wiley & Sons, Ltd, 2010. 6(5): 618–622. 10.1002/smll.200901893. [DOI] [PubMed] [Google Scholar]
- 11.Kneipp J, Kneipp H, Wittig B, Kneipp K. “One- and Two-Photon Excited Optical pH Probing for Cells Using Surface-Enhanced Raman and Hyper-Raman Nanosensors”. Nano Lett. American Chemical Society, 2007. 7(9): 2819–2823. 10.1021/nl071418z. [DOI] [PubMed] [Google Scholar]
- 12.Wei H, Willner MR, Marr LC, Vikesland PJ. “Highly Stable SERS pH Nanoprobes Produced by Co-Solvent Controlled AuNP Aggregation”. Analyst. 2016. 141(17): 5159–5169. 10.1039/C6AN00650G. [DOI] [PMC free article] [PubMed] [Google Scholar]
- 13.Puppulin L, Hosogi S, Sun H, Matsuo K, Inui T, Kumamoto Y, et al. “Bioconjugation Strategy for Cell Surface Labelling with Gold Nanostructures Designed for Highly Localized pH Measurement”. Nat. Commun 2018. 9(1): 5278 10.1038/s41467-018-07726-5. [DOI] [PMC free article] [PubMed] [Google Scholar]
- 14.Capocefalo A, Mammucari D, Brasili F, Fasolato C, Bordi F, Postorino P, et al. “Exploring the Potentiality of a SERS-Active pH Nano-Biosensor”. Front. Chem. Frontiers Media S.A, 2019. 7: 413–413. 10.3389/fchem.2019.00413. [DOI] [PMC free article] [PubMed] [Google Scholar]
- 15.Talley CE, Jusinski L, Hollars CW, Lane SM, Huser T. “Intracellular pH Sensors Based on Surface-Enhanced Raman Scattering”. Anal. Chem. American Chemical Society, 2004. 76(23): 7064–7068. 10.1021/ac049093j. [DOI] [PubMed] [Google Scholar]
- 16.Scaffidi JP, Gregas MK, Seewaldt V, Vo-Dinh T. “SERS-Based Plasmonic Nanobiosensing in Single Living Cells”. Anal. Bioanal. Chem 2009. 393(4): 1135–1141. 10.1007/s00216-008-2521-y. [DOI] [PMC free article] [PubMed] [Google Scholar]
- 17.Wang F, Widejko RG, Yang Z, Nguyen KT, Chen H, Fernando LP, et al. “Surface-Enhanced Raman Scattering Detection of pH with Silica-Encapsulated 4-Mercaptobenzoic Acid-Functionalized Silver Nanoparticles”. Anal. Chem. American Chemical Society, 2012. 84(18): 8013–8019. 10.1021/ac3018179. [DOI] [PubMed] [Google Scholar]
- 18.Liu Y, Yuan H, Fales AM, Vo-Dinh T. “pH-sensing Nanostar Probe Using Surface-Enhanced Raman Scattering (SERS): Theoretical and Experimental Studies”. J. Raman Spectrosc. John Wiley & Sons, Ltd, 2013. 44(7): 980–986. 10.1002/jrs.4302. [DOI] [Google Scholar]
- 19.Xiang S-Q, Zhang L, Gao S-T, Zhao L-B. “Simulating pH-dependent Surface-Enhanced Raman Spectra by Density Functional Theory Calculations”. J. Raman Spectrosc. John Wiley & Sons, Ltd, 2019. 50(8): 1065–1073. 10.1002/jrs.5613. [DOI] [Google Scholar]
- 20.Ho WKH, Bao ZY, Gan X, Wong K-Y, Dai J, Lei D. “Probing Conformation Change and Binding Mode of Metal Ion–Carboxyl Coordination Complex through Resonant Surface-Enhanced Raman Spectroscopy and Density Functional Theory”. J. Phys. Chem. Lett. American Chemical Society, 2019. 10(16): 4692–4698. 10.1021/acs.jpclett.9b01435. [DOI] [PubMed] [Google Scholar]
- 21.Michota A, Bukowska J. “Surface-Enhanced Raman Scattering (SERS) of 4-Mercaptobenzoic Acid on Silver and Gold Substrates”. J. Raman Spectrosc. John Wiley & Sons, Ltd, 2003. 34(1): 21–25. 10.1002/jrs.928. [DOI] [Google Scholar]
- 22.Gardner B, Stone N, Matousek P. “Noninvasive Simultaneous Monitoring of pH and Depth using Surface-Enhanced Deep Raman Spectroscopy”. J. Raman Spectrosc. John Wiley & Sons, Ltd, 2020. ; 51: 1078–1082. 10.1002/jrs.5875. [DOI] [Google Scholar]
- 23.Lu Peng, Wang Jing, Lin Jinyong, Lin Juqiang, Liu Nenrong, Huang Zufang, et al. “Gold Nanoaggregates for Probing Single-Living Cell Based on Surface-Enhanced Raman Spectroscopy”. J. Biomed. Opt 2014. 20(5): 1–5. [DOI] [PubMed] [Google Scholar]
- 24.Williams A, Flynn KJ, Xia Z, Dunstan PR. “Multivariate Spectral Analysis of pH SERS Probes for Improved Sensing Capabilities”. J. Raman Spectrosc. John Wiley & Sons, Ltd, 2016. 47(7): 819–827. 10.1002/jrs.4910. [DOI] [Google Scholar]
- 25.Sousa-Castillo A, Comesaña-Hermo M, Rodríguez-González B, Pérez-Lorenzo M, Wang Z, Kong X-T, et al. “Boosting Hot Electron-Driven Photocatalysis through Anisotropic Plasmonic Nanoparticles with Hot Spots in Au–TiO2 Nanoarchitectures”. J. Phys. Chem. C. American Chemical Society, 2016. 120(21): 11690–11699. 10.1021/acs.jpcc.6b02370. [DOI] [Google Scholar]
- 26.Yuan H, Fales AM, Khoury CG, Liu J, Vo-Dinh T. “Spectral Characterization and Intracellular Detection of Surface-Enhanced Raman Scattering (SERS)-Encoded Plasmonic Gold Nanostars”. J. Raman Spectrosc. John Wiley & Sons, Ltd, 2013. 44(2): 234–239. 10.1002/jrs.4172. [DOI] [PMC free article] [PubMed] [Google Scholar]
- 27.He S, Kyaw YME, Tan EKM, Bekale L, Kang MWC, Kim SS-Y, et al. “Quantitative and Label-Free Detection of Protein Kinase A Activity Based on Surface-Enhanced Raman Spectroscopy with Gold Nanostars”. Anal. Chem. American Chemical Society, 2018. 90(10): 6071–6080. 10.1021/acs.analchem.7b05417. [DOI] [PubMed] [Google Scholar]
- 28.Dardir K, Wang H, Martin BE, Atzampou M, Brooke CB, Fabris L. “SERS Nanoprobe for Intracellular Monitoring of Viral Mutations”. J. Phys. Chem. C. American Chemical Society, 2020. 124(5): 3211–3217. 10.1021/acs.jpcc.9b09253. [DOI] [Google Scholar]
- 29.Song C, Li F, Guo X, Chen W, Dong C, Zhang J, et al. “Gold Nanostars for Cancer Cell-Targeted SERS-Imaging and NIR Light-triggered Plasmonic Photothermal Therapy (PPTT) in the First and Second Biological Windows”. J. Mater. Chem. B. The Royal Society of Chemistry, 2019. 7(12): 2001–2008. 10.1039/C9TB00061E. [DOI] [PubMed] [Google Scholar]
- 30.Sloan-Dennison S, Schultz ZD. “Label-Free Plasmonic Nanostar Probes to Illuminate In Vitro Membrane Receptor Recognition”. Chem. Sci 2019. 10(6): 1807–1815. 10.1039/C8SC05035J. [DOI] [PMC free article] [PubMed] [Google Scholar]
- 31.Zong Y, Guo Q, Xu M, Yuan Y, Gu R, Yao J. “Plasmon-Induced Decarboxylation of Mercaptobenzoic Acid on Nanoparticle Film Monitored by Surface-Enhanced Raman Spectroscopy”. RSC Adv. The Royal Society of Chemistry, 2014. 4(60): 31810–31816. 10.1039/C4RA03512G. [DOI] [Google Scholar]
- 32.Chakraborty I, Som A, Adit Maark T, Mondal B, Sarkar D, Pradeep T. “Toward a Janus Cluster: Regiospecific Decarboxylation of Ag44(4-MBA)30@Ag Nanoparticles”. J. Phys. Chem. C. American Chemical Society, 2016. 120(28): 15471–15479. 10.1021/acs.jpcc.6b04769. [DOI] [Google Scholar]
- 33.Zhang X, Yu Z, Ji W, Sui H, Cong Q, Wang X, et al. “Charge-Transfer Effect on Surface-Enhanced Raman Scattering (SERS) in an Ordered Ag NPs/4-Mercaptobenzoic Acid/TiO2 System”. J. Phys. Chem. C. American Chemical Society, 2015. 119(39): 22439–22444. 10.1021/acs.jpcc.5b06001. [DOI] [Google Scholar]
- 34.Guerrini L, Pazos E, Penas C, Vázquez ME, Mascareñas JL, Alvarez-Puebla RA. “Highly Sensitive SERS Quantification of the Oncogenic Protein c-Jun in Cellular Extracts”. J. Am. Chem. Soc. American Chemical Society, 2013. 135(28): 10314–10317. 10.1021/ja405120x. [DOI] [PubMed] [Google Scholar]
- 35.Ma T, Guo J, Chang S, Wang X, Zhou J, Liang F, et al. “Modulating and Probing the Dynamic Intermolecular Interactions in Plasmonic Molecule-Pair Junctions”. Phys. Chem. Chem. Phys. The Royal Society of Chemistry, 2019. 21(29): 15940–15948. 10.1039/C9CP02030F. [DOI] [PubMed] [Google Scholar]
- 36.Benčina M. “Illumination of the Spatial Order of Intracellular pH by Genetically Encoded pH-Sensitive Sensors”. Sensors. 2013. 13: 16736–16758. 10.3390/s131216736. [DOI] [PMC free article] [PubMed] [Google Scholar]
- 37.Qian Z, Martyna A, Hard RL, Wang J, Appiah-Kubi G, Coss C, et al. “Discovery and Mechanism of Highly Efficient Cyclic Cell-Penetrating Peptides”. Biochemistry. 2016. 55(18): 2601–2612. 10.1021/acs.biochem.6b00226. [DOI] [PMC free article] [PubMed] [Google Scholar]
- 38.Zhang Q, Large N, Wang H. “Gold Nanoparticles with Tipped Surface Structures as Substrates for Single-Particle Surface-Enhanced Raman Spectroscopy: Concave Nanocubes, Nanotrisoctahedra, and Nanostars”. ACS Appl. Mater. Interfaces 2014. 6(19): 17255–17267. 10.1021/am505245z. [DOI] [PubMed] [Google Scholar]
- 39.Bauer KM, Lambert PA, Hummon AB. “Comparative Label-Free LC-MS/MS Analysis of Colorectal Adenocarcinoma and Metastatic Cells Treated with 5-Fluorouracil”. Proteomics. 2012. 12(12): 1928–1937. 10.1002/pmic.201200041. [DOI] [PMC free article] [PubMed] [Google Scholar]
- 40.O’Haver TC. peakfit.m. 2013.
- 41.Zhang X-X, Wang Z, Yue X, Ma Y, Kiesewetter DO, Chen X. “pH-Sensitive Fluorescent Dyes: Are They Really pH-Sensitive in Cells?” Mol. Pharm 2013/03/25 ed. 2013. 10(5): 1910–1917. 10.1021/mp3006903. [DOI] [PMC free article] [PubMed] [Google Scholar]
Associated Data
This section collects any data citations, data availability statements, or supplementary materials included in this article.