

Abstract
Autism Spectrum Disorder (ASD) is a heterogeneous disorder that is often accompanied with many co-morbidities. Recent genetic studies have identified various pathways from hundreds of candidate risk genes with varying levels of association to ASD. However, it is unknown which pathways are specific to the core symptoms or which are shared by the co-morbidities. We hypothesised that critical ASD candidates should appear widely across different scoring systems, and that comorbidity pathways should be constituted by genes expressed in the relevant tissues. We analysed the Simons Foundation for Autism Research Initiative (SFARI) database and four independently published scoring systems and identified 292 overlapping genes. We examined their mRNA expression using the Genotype-Tissue Expression (GTEx) database and validated protein expression levels using the human protein atlas (HPA) dataset. This led to clustering of the overlapping ASD genes into 2 groups; one with 91 genes primarily expressed in the central nervous system (CNS geneset) and another with 201 genes expressed in both CNS and peripheral tissues (CNS+PT geneset). Bioinformatic analyses showed a high enrichment of CNS development and synaptic transmission in the CNS geneset, and an enrichment of synapse, chromatin remodelling, gene regulation and endocrine signalling in the CNS+PT geneset. Calcium signalling and the glutamatergic synapse were found to be highly interconnected among pathways in the combined geneset. Our analyses demonstrate that 2/3 of ASD genes are expressed beyond the brain, which may impact peripheral function and involve in ASD co-morbidities, and relevant pathways may be explored for the treatment of ASD co-morbidities.
Introduction
Autism Spectrum Disorder (ASD) is a heterogeneous and complex neurodevelopmental disorder [1], with core features including stereotypical behaviours and impaired social and communication skills, and with various comorbidity. The CNS comorbidity of ASD includes epilepsy, sleeping disorders [2], intellectual disabilities, language delay, anxiety and hyperactivity [3, 4], and the peripheral comorbidity includes gastrointestinal, metabolic disorders, auto-immune disorders, tuberous sclerosis, attention-deficit hyperactivity disorder, and sensory problems associated motor problems [2, 5–8]. It appears that genetic heterogeneity and environmental factors impact not only the severity of ASD, but also the presence and severity of comorbid disorders [9]. However, it is unknown why different individuals display overlapping core symptoms and/or different comorbidities.
With the advent and increasing availability of DNA sequencing over the past decade, much has been uncovered about the genetics of ASD [10], which include de novo events [11–17], mosaic mutations [18] and gene dosage changes resulted from copy number variations [19–25], as well as epigenetic/transcriptome changes with no apparent genetic alterations [26]. As a result, hundreds to thousands of ASD risk factors have been identified by different studies, suggesting that ASD is a multi-genetic disorder and each has small effects in terms of ASD population. This presents a huge challenge to develop ASD diagnosis or treatment. Meanwhile, little is known about which set of genetic factors links to peripheral comorbidity, and it is therefore crucial to decipher factors/pathways which are associated with the comorbidities.
The genetic studies have allowed formation of ASD databases for investigations [27, 28]. The early network analyses using the SFARI database have identified ASD pathways of abnormal synaptic function, chromatin remodelling and ion channel activity [29] which are highly connected by MAPK signalling and calcium channels, with some genes associated with cardiac and neurodegenerative disorders [30]. This was carried out before the scoring system from SFARI became available. In addition, the SFARI list of ASD genes has risen from 680 in 2016 to 1053 in January 2019. Furthermore, independent scoring systems have become available and suggested additional genes with significance to ASD, from either sequencing thousands of individuals across the globe [31], or using existing interaction databases in conjunction with SFARI database [32, 33], or employing machine learning on datasets [32, 34]. This suggests that another round of ASD pathway analysis is due.
Our hypotheses were that the high ASD candidates would recur in different scoring systems, and that comorbidities in ASD would involve expression of risk genes in relevant tissues/organs. Therefore, in this study, we focused on the identification of the overlapping genes in the updated SFARI database and autistic genes shortlisted by the majority of the third-party scoring systems as summarised in Table 1. To explore the biological context of these genes, we first examined their expression using the GTEx database to find out if they were transcribed not only in the brain but also in other peripheral tissues, and then used the human protein atlas (HPA) dataset to verify protein expression levels. We also explored tissue specific networks from human reference interactome (Huri) [35] to see if any ASD candidates interacted with genes in these networks.
Table 1. Overview of five datasets and the independent scoring systems used to shortlist ASD genes for overlapping analysis.
| Score name | Data Source | Starting genes | Score Threshold | Shortlisted genes | References |
|---|---|---|---|---|---|
| EXAC | Exome sequences from 60,706 individuals | 15735 | pLi >0.9 with >90% negative effect upon mutation | 3126 | Lek et al. [31] |
| SFARI | SFARI GENE (Jan 2019) | 1053 | All genes recorded in Jan 2019 | 1053 | Gene.SFARI.org (Jan 2019) |
| Krishnan | SFARI, OMIM, GAD, HUGE (up to 2013) | 25825 | q value < 0.05 | 3225 | Krishnan et al. [32] |
| Duda | Microarray data from human, mouse and rat. Protein interaction databases (MIPS, BIOGRID, MINT, IntAct) | 21115 | Top 10th percentile | 2111 | Duda et al. [34] |
| Zhang | Mouse CNS Microarray Data, Genes homologous to human | 15950 | Positive DAMAGE score (D>0) | 7189 | Zhang et al. 2017 |
Our analyses suggest that a third of ASD risk genes (CNS geneset) is specifically expressed in the CNS, which are involved in brain development, synaptic function and ion transport, whereas the majority of ASD factors are highly expressed in both CNS and peripheral tissues (CNS+PT geneset), with pathways of brain development, chromatin organisation and gene regulation, which may account for ASD peripheral comorbidity.
Methods
Datasets and shortlisting of the ASD risk factors
Five datasets were chosen as the starting point of this study [28, 31–34], and high-ranking genes were shortlisted from each dataset with defined criteria (Table 1, Fig 1). For the Exome Aggregation Consortium (EXAC) with exome sequencing data from ~60,000 cases (S1 Table), a high intolerance to mutation of pLi ≥ 0.9 was applied, where pLi indicated the level of intolerance to mutations in a given gene, with many containing loss of function variants. In the Krishnan’s geneset (S2 Table) created using human disease databases of GAD, OMIN, HUGE and SFARI in December 2013, along with a brain-specific functional interaction network, a q-value of ≤0.05 was used, where q-value was the probability of the gene being an ASD risk candidate after multiple testing for false positivity. For the Zhang’s geneset (S3 Table) made using CNS microarray expression data from six brain regions derived from mice and validated using data from exome sequencing studies [11, 14, 17, 29, 36, 37], mutations of the human homologues with a (DAMAGE) score of D≥0 were shortlisted, where positive D-score was a measure of a mutation’s likeliness to be associated with ASD. For the Duda’s list (S4 Table) which was created from de novo mutation analysis, protein-protein interaction and phenotype information, the top 10% of genes in the list were selected, as this was used as a cut off in the original publication. Finally, for the SFARI collection, all genes up to January 2019 were included (S5 Table).
Fig 1. Flowchart of the analysis for the paper: Arrow indicates the steps of each analysis.

Overlap of shortlisted genes with SFARI
After shortlisting of high-ranking genes from each dataset, the Jvenn program was applied to identify the common ASD risk genes among the 5 sources [38]. A list of 519 genes, which were overlapped among 4 of 5 sources, was extracted (Table 1, Fig 1). Among them, 319 genes appeared in the SFARI database were taken forward for expression and enrichment analyses.
Filtering using gene expression analysis data
Since ASD has a wide array of peripheral co-morbidities, we believe that some ASD genes are expressed in peripheral tissues. To explore this possibility, mRNA expression data were downloaded from the GTEx consortium (v7) in the form of median TPM (Transcripts Per Million) values from all tissues [39]. We excluded low expression genes based on the average of the median (TPM<3) in both CNS and PT groups. Additionally, we removed genes with a SFARI score of 6, which were not likely to be associated with ASD. The expression data was applied to the 319 selected genes and uploaded to Morpheus (https://software.broadinstitute.org/morpheus) to generate heatmap (with settings for clustering: hierarchical, euclidean distance, linkage method complete, clustering based on columns). Genes with extremely low levels of mRNA expression, at an average TPM≤3 in both the brain and peripheral tissues, were excluded from the subsequent analyses (S8 Table).
Overview of protein expression levels
As an additional level of verification, we used HPA data (v19.3) obtained via HPA analyze [40], a Bioconductor program that runs in R, to assess protein expression levels across multiple tissues among the two genesets, and used ggplot2 [41] to visualise the data.
Tissue specific interaction networks
The expression of ASD genes in other tissues indicates that they may interact with other factors in tissue-specific networks. To explore this, we used tissue-specific networks generated from Huri to see if ASD candidate genes were present in other networks, and if they had any interacting partners within these networks.
Functional enrichment analysis of the final geneset
The final list of ASD common risk factors was analyzed through STRING program for pathway analyses, except for SHANK3 that was misidentified as HOMER2 in the current human database of STRING v11. The resulting GO Terms (Biological Processes, Cellular Components, and Molecular Function) and KEGG pathways were downloaded. The same list was also loaded into Cytoscape [42] to identify sub-clusters of genes in interaction network.
Analysis of genesets for co-morbid phenotypes
To examine potential association of the ASD genesets with occurring co-morbidities, an overrepresentation analysis (ORA) was carried out using the tool WebGestalt [43] to assess other co-morbid conditions linking to the ASD genesets. The Human Phenotype Ontology database was used for the analysis [44]. The top 50 terms were used as a cut off to balance between the co-morbidities reported in ASD and to ensure that the final lists are not too broad and overly diluted.
Comparison of shortlisted ASD geneset with ASD expression studies
To examine the utility of the ASD geneset in the literature of ASD gene expression studies, we compared the ASD geneset with DEGs reported from post-mortem brain [45], blood [46–48] and GI tissue [46, 49], as well as iPSC-derived cell models [50–55], to see if any of the ASD genes were significantly up or downregulated. The DEGs were obtained using autism versus control group with FDR (adj p-value) at 0.05, except for Voineagu [56] and Pramparo [47], which we used Geo2R [57] using autism versus controls as groups to obtain DEGS at 0.05 FDR (adj p-value).
Expression of genes across brain development and sex-bias
We used CSEA [58] tool to check for enrichment of our genes for human gene expression across developmental periods and brain tissues in the Brainspan dataset. We also used the genesets from the publications [59, 60] to see if any of our shortlisted genes had sex-bias expression in prenatal stages [59], or if there was sex-specific splicing in our geneset [60] using the bioconductor package GeneOverlap [61].
Comparison with psychiatric and peripheral diseases
Our functional analyses of the ASD genesets showed enrichment for processes in areas relating to cardiac function and insulin. In addition, it is known that many ASD risk genetic factors share molecular pathways with other psychiatric conditions. To future explore this, we downloaded genesets for schizophrenia (SCZ), bipolar disorder (BP), and major depressive disorder (MDD) from Psygenet [62]. We also downloaded genelists from Harmonizome database [63, 64] for 4 peripheral conditions of arrythmia (ARY), type 1 (T1D) and type 2 (T2D) diabetes based on our results, and inflammatory bowel disease (IBD) based on co-morbidity of gastrointestinal issues with ASD for comparison of ASD risk factors in the current study.
Results
To explore the hypothesis that ASD candidate genes were recurrent across different scoring systems, we selected the SFARI dataset and four other published scoring systems for the current study (Table 1, Fig 1). Consequently, we selected 3126 genes out of 15735 from the EXAC dataset with pLi ≥ 90% chance of intolerance to loss of function [31], 3225 genes from Krishnan’s data [32] based on q<0.05, 7189 genes out of 15950 from Zhang’s data [33] with a positive DAMAGE score (D>0), and 2111 genes from the top 10% of the 21115 genes in the Duda’s data [34], and all 1053 SFARI genes as of Jan 2019 [28].
These shortlists were subsequently analysed by Jvenn web tool for overlapping ASD genes [38], and 114 genes were found to be shared by all five shortlists (Fig 2, S6 Table). Considering that some well-known ASD genes such as SHANK3 and CHD8 were excluded from the 114 geneset, we adjusted to include the genes that were overlapped in 4 of the 5 scoring systems, which resulted in a total to 519 ASD risk genes. Further examination of the 519 genes for the presence in the SFARI dataset has narrowed down the list to 319 SFARI genes, which were highly ranked in >3 of 4 other independent studies besides the SFARI dataset (Table 1, Fig 1).
Fig 2. Shortlisting of common ASD factors.
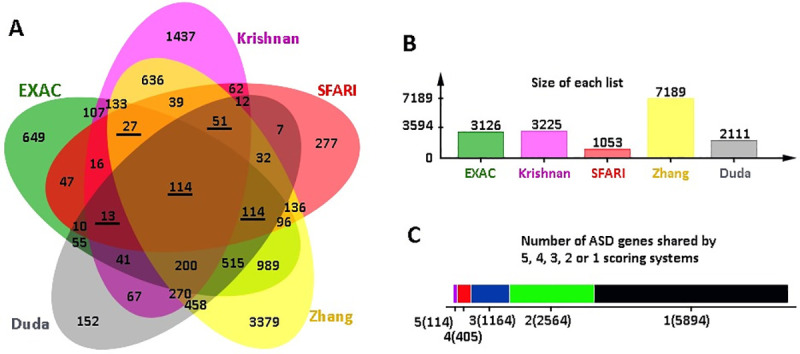
(A) JVenn Diagram of all overlapping genes from the scoring systems used. Underlined numbers indicate sets overlapped with SFARI. (B) Size of each set of shortlisted genes. (C) The number of genes that are shared by or specific to the lists.
Expression pattern of ASD genes
To assess the gene expression across different tissues, we next examined body-wide expression of the 319 genes using the GTEx dataset containing standardized mRNA expression in units of TPM. This further reduced the ASD genes to 292 genes to filter out low abundance genes with TMP≥3 in both CNS and PT (S7 Table).
The expression levels of the 292 genes were presented in the Heatmap, with high expression coloured in red, low expression in green and no expression in grey. Analysis of the 292 genes with GTEx (S8 Table) showed that the ASD genes were clustered into 2 groups (Fig 3); 91 genes were mainly expressed in the CNS with TMP<3 in PT, whereas the remaining 201 genes were ubiquitously expressed in both the CNS and PT.
Fig 3. Heatmap of 292 genes after filtering for low expressed genes (TPM<3).
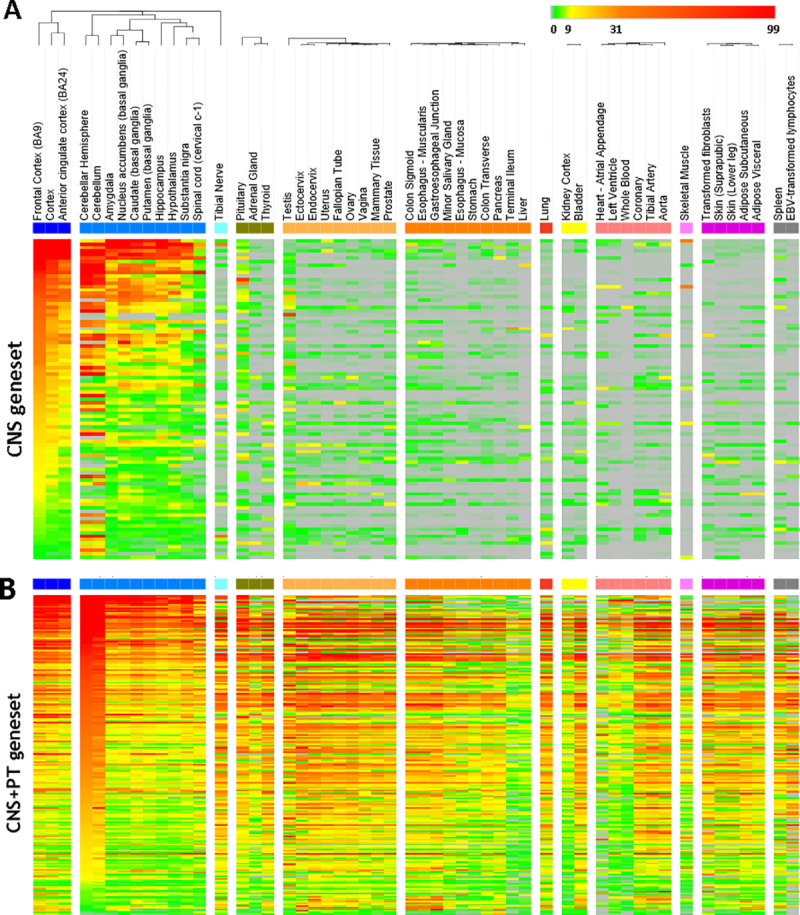
The tissues were indicated on the top. Scale bar on top right corner showed the scale of mRNA expression for each gene: grey is TPM = 0, green is 0–3, yellow is 9–31, orange is 31–99, red is > 99. (A) The 91 genes in the CNS geneset have an average median of TMP<3 in the peripheral tissues. (B) The 201 CNS+PT genes were expressed both CNS and peripheral tissues with TMP>3.
A similar expression profile for proteins was observed in HPA data (Figs 4 and 5), whereas CNS geneset showed protein expression mostly in the CNS (Fig 4), the CNS+PT geneset showed protein expression in both the CNS and other tissue types (Fig 5). We also identified that some of the ASD factors in the CNS+PT geneset (S1–S19 Figs) were indeed interacting with other proteins in tissue-specific networks (Table 2). Interestingly HDAC4 (S6) in the colon and STX1A (S15) in the pituitary gland were found to be tissue-specific genes in these organs.
Fig 4. Protein expression of CNS geneset from HPA across tissues.

Genes are displayed in order of decreasing protein expression.
Fig 5. Protein expression of CNS+PT geneset from HPA across tissues.

Genes are displayed in order of decreasing expression.
Table 2. Interacting ASD genes in tissue-specific networks.
Genes in bold denote ASD genes (POGZ and ANKRD11) present in nearly all networks.
| Tissue | ASD genes | Interacting partners |
|---|---|---|
| Heart left ventricle | TCF4, RFX3, HDAC4, POGZ, ANKRD11, RERE, YY1, CMIP, QRICH1 | MYH7B, TCF24, ASB15, SNRPC, TRIM54, FSD2, FHL2 |
| Heart-left atrial appendage | HDAC4, ANKRD11, TCF4, CMIP, QRICH1 | TRIM54, ASB15, MYH7B, TNNI1, TCF24, FSD2 |
| Artery-tibial | ANKRD11 | NOV |
| Small Intestine-terminal ileum | TCF4, POGZ, CLSTN3, NSD1 | A1CF, AOC1, BCL2L15, AGR2, OLFM4 |
| Pancreas | MEIS2, DAGLA, STX1A, TSC1, ARNT2, TCF4, POGZ, CLSTN3, ANKRD11 | FAM136A, LHFPL5, PNLIPRP1, SERP1, ENKD1, SIM1, NEUROD, BCL2L15, BANF2, A1CF, OLFM4, TMEM97 |
| Stomach | PRICKLE1, ANKRD11, TCF4, POGZ, NSD1 | BCL2L15, ODAM, AGR2, JRK |
| Esophagus-mucosa | DYRK1A, ARNT2, WAC, KATNAL1, TSC1, RNF38, EXOC5, YY1, HDAC4, MEIS2, POGZ, ANKRD11 | DTX2, BICD2, USH1G, TXN, CYSRT1, LGALS7B, LGALS7 |
| Esophagus-muscularis | USP7 | ANKS1A |
| Muscle-skeletal | NPAS2, TSC1, MEIS2, TCF4, CMIP, POGZ, ANKRD11, SRSF11, HDAC4, STX1A, QRICH1, CACNB2 | KRT31, ATG9A, CDR2L, TRIB3, MYF5, FAM222B, FAM166B, BICD2, MEF2A, MEF2C, GOLGA2, SSX2IP, AES, NGLY1, YWHAE, DUPD1, FHL3, TADA2B, TRIM27, CALCOCO2, INCA1, OIP5, LBX1, NFKBID, ASB15, CEP70, USP6, ZMYND12, VPS52, HEXIM2, TRIM54, FSD2, FCHSD2, KLHL38, HOOK2 |
| Colon-sigmoid | TCF4, POGZ, QRICH1, TSC1, YY1, SAE1 | MEF2C, MEOX2, CCNDBP1, TRIM27, ODAM, INCA1, CDPF1, PAX8, FCHSD2, CCDC136, NFKBID, CDR2L, HOOK2, CDR2, NFYC, GOLGA2, VPS52, BICD2, TFIP11, BLZF1, CALCOCO2, PICK1, CCDC125, CADPS, MTUS2, YWHAE, AES, SSX2IP, BEGAIN, CEP70, MEF2A, TRIB3, FSD2, ZMYND12, TSGA10, HAP1, |
| Colon-transverse | HDAC4, SAE1, POGZ, ANKRD11, CLSTN3, EXOC5, KATNAL1, MEIS2, NSD1, SATB2, TCF4 | SATB2, BCL2L15, KLC4, PTK6, A1CF, ABHD11, AGR2, NXPE2, AOC1 |
| Kidney | CACNB2, TCF4, SAE1, POGZ, MEIS2, PHF12 | MCCD1, AOC1, ATP6V0D2, CLCNKA, TMEM174, PAX8, A1CF |
| Pituitary | QRICH1, CIC, YY1, BAZ2B, USP7, USP15, HDAC4, ANKRD11, EP400, STXBP1, STX1A, MBD5, DPYSL2, WASF1, POGZ, DPYSL3, DAGLA, TCF4, MEIS2, DYNC1H1, NPAS2, EXOC5 | RAB3IL1, BLOC1S6, ZNF696, ZNF440, PLN, SEC22A, TMEM254, KRT40, RMDN2, C1GALT1, NAPB, ZNF76, ZNF250, APOL2, STX12, VSTM4, BRD8, NEUROD4, AOC3, CENPP, CASC4, NINJ2, VAMP1, CLCNKA, TMEM41A, ZNF136, ABI3, STX7, STX2, VTI1B, STX4, CD81, EXOC5, APOL3, RHBDD2, ARL13B, VAMP4, STX3, BET1, ZNF12, TRAF3IP3, UBE2I, MAPK1, PGAP2, EBAG9, ZNF785, SMIM1, DEUP1, DDX49, STX10, ANKRD46, TRIM38, EFHC1, SERP1, C2orf82, CLEC1A, AIG1, CLN6, TXLNA, SERP2, VAMP5, JAGN1, TMEM120A, TSNARE1, MALL, TMEM199, C4orf3, ERG28, HMOX1, AGTRAP, SNAP47, STX16, USE1, CXCL16, BTN2A2, MAL, ZFPL1, TMEM222, FAM3C, BPIFA1, SPICE1, GOLGA2, CYB5B, GIMAP5, TMEM128, STX11, NKG7, STX6, LHFPL5, CMTM7, STX5, NRM, AQP3, VAMP3, BNIP1, LHX3, ETNK2, RNF4, TBX19, ZNF835, CDC37, ZNF441, KIFC3, STX8, TMEM100, ZNF707, TMEM60 |
| Lung | PHF12, | ATP6V0D2 |
| Artery coronary | ANKRD11 | NOV |
| Artery aorta | ANKRD11 | NOV |
| Adipose subcutaneous | ARNT2 | SIM1 |
| Spleen | SAE1, ANKRD11, TCF4, WASF1, CLSTN3, POGZ, STX1A, MEIS2, CAMK2B, TLK2, KHDRBS3, MARK1 | POU2AF1, INPP5D, PAX5, DOCK2, NFAM1, GRB2, CCM2L, TCF23, TRAF3IP3, FOLR3, NKG7, RASAL3, ABI3, TCL1B |
| Adrenal Gland | TCF4, STX1A, EP400, QRICH1, TSC1, ANKRD11 | MTFR1L, TMEM41A, NOV, CHCHD2, TRAPPC2L, RMDN2, FAM166B, ALAS1 |
Enriched neurodevelopment, synaptic function, and ion transport in the CNS geneset
To assess the biological context of ASD factor, the STRING (v 11) program was used to analyse two groups of the ASD factors, respectively [65]. The 91 CNS-specific geneset gave rise to 305 “Biological Processes” (S10 Table), 73 “Cellular Components” (S11 Table) and 62 “Molecular Function” (S12 Table). Go term results revealed an enrichment for neuronal development and synaptic function in the CNS geneset (Fig 6A).
Fig 6. Significant ASD pathways.

(A) Selected genes from 91 CNS geneset, highlighting that Nervous development (blue), Trans-synapses (red) and Ion transmembrane transportation (yellow) are the most enriched pathways. (B) Selected genes highlighted from the 200 CNS+PT geneset, demonstrating that the Nervous development (blue), the Chromatin organisation (green) and Gene regulation (red) were the among the most significant pathways. (C) Glutamatergic/GABAergic synapses, (D) Cell signalling and Hormonal secretion pathways from the combined 291 genes all linked to calcium signalling, suggesting that Calcium signalling is the most interconnected pathways linking the ASD signalling pathways. Edges represent combined gene score, node colours represent selected GO terms (A-B) and KEGG pathways (C,D) The colours for 3D correspond to the following; Yellow-Calcium Signalling, Green -MAPK Signalling, Red -cAMP signalling, Blue—Wnt Signalling, Brown—thyroid signalling, purple–Insulin Signalling, Orange–Aldosterone Synthesis and Secretion.
We also visualized the interaction network using Cytoscape (V3.7). Among the 91 CNS genes (Table 3), 47 (colored in blue) were involved in “Nervous system development” (FDR = 1.39E-18), 31 (colored in red) were linked to “Trans-synaptic signalling” (FDR = 2.41E-25), and 30 were associated with “Ion transmembrane transport” (colored in yellow, FDR = 1.55E-14, Fig 6A), which included 6 calcium channels (ATP2B2, CACNA1A, CACNA1B, CACNA1D, CACNA1G, CACNA2D3), 3 sodium channels (SCN1A, SCN2A, SCN8A), 4 potassium (HCN1, KCND2, KCNQ2, KCNQ3) channels, 6 glutamatergic receptors (GRIA1, GRID1, GRIK2, GRIN1, GRIN2A, GRIN2B), 5 GABAergic receptors (GABRA1, GABRA3, GABRA4, GABRA5, GABRB3) and 5 transporters (SLC12A5, SLC1A2, SLC24A2, SLC30A3, SLC4A10).
Table 3. Key Go terms of the CNS-specific and ubiquitous ASD genesets.
| Term ID | Term description (Background Gene Count) | ASD genes | FDR | Matching proteins in the network (IDs) |
|---|---|---|---|---|
| Key GO terms of the CNS-specific geneset (91 genes) centered on brain development, synapse and ion transport | ||||
| GO:0007399 (Biol. Proc.) | Nervous system development (2206) | 47 (CNS) | 1.39E-18 | ATP2B2, BCL11A, CAMK2A, CNTN6, CNTNAP2, CTNNA2, CTNND2, CUX2, DAB1, DLX1, DSCAM, ELAVL3, ERBB4, FEZF2, FOXG1, GABRA4, GABRA5, GABRB3, GAP43, GDA, GRIN1, GRIN2A, GRIN2B, HCN1, KCNQ2, KIRREL3, LRRC7, MYT1L, NOS1, NRXN1, PLXNA4, RBFOX1, RELN, RIMS1, ROBO2, SCN2A, SCN8A, SHANK2, SLC12A5, SLC1A2, SLC4A10, SLITRK5, SRRM4, SYT1, SYT17, TBR1, UNC13A |
| GO:0043005 (Cell. Comp.) | Neuron projection (1142) | 44 (CNS) | 9.54E-28 | ANKS1B, CACNA1B, CADM2, CAMK2A, CDH8, CNKSR2, CNTNAP2, CTNNA2, CTNND2, DAB1, DSCAM, FRMPD4, GABBR2, GABRA5, GAD1, GAP43, GRIA1, GRIK2, GRIN1, GRIN2A, GRIN2B, GRM1, HCN1, HOMER1, KCND2, KCNQ2, KCNQ3, KIRREL3, LRRC4, LRRC7, NOS1, NRXN1, RELN, ROBO2, SCN1A, SCN2A, SCN8A, SHANK2, SLC12A5, SLC1A2, SLC30A3, SLC4A10, SYT1, UNC13A |
| GO:0099537 (Biol. Proc.) | Trans-synaptic signalling 408) | 31 (CNS) | 2.41E-25 | CACNA1B, CACNA1G, CDH8, DLGAP1, DLGAP2, GABBR2, GABRA1, GABRA5, GABRB3, GAD1, GLRA2, GRIA1, GRID1, GRIK2, GRIN1, GRIN2A, GRIN2B, GRM1, HOMER1, KCND2, KCNQ2, KCNQ3, NOS1, NRXN1, RIMS1, SLC12A5, SLC1A2, SLITRK5, SYT1, SYT17, UNC13A |
| GO:0045202 (Cell. Comp.) | Synapse (107) | 42 (CNS) | 4.06E-30 | ANKS1B, ATP2B2, CACNA1B, CADM2, CAMK2A, CDH8, CNKSR2, CTNNA2, DAB1, DLGAP1, DLGAP2, DLGAP3, DSCAM, FRMPD4, GABBR2, GABRA1, GABRA3, GABRA4, GABRA5, GABRB3, GAD1, GAP43, GLRA2, GRIA1, GRID1, GRIK2, GRIN1, GRIN2A, GRIN2B, GRM1, HOMER1, KCND2, LRRC4, LRRC7, NOS1, NRXN1, RIMS1, SHANK2, SLC30A3, SYT1, SYT17, UNC13A |
| GO:0030594 (Mol. Funct.) | Neurotransmitter receptor activity (849) | 13 (CNS) | 3.11E-13 | GABBR2, GABRA1, GABRA3, GABRA4, GABRB3, GLRA2, GRIA1, GRID1, GRIK2, GRIN1, GRIN2A, GRIN2B, GRM1 |
| GO:0008066 (Mol. Funct.) | Glutamate receptor activity (27) | 7 (CNS) | 2.73E-09 | GRIA1, GRID1, GRIK2, GRIN1, GRIN2A, GRIN2B, GRM1 |
| GO:0016917 (Mol. Funct.) | GABA receptor activity (22) | 6 (CNS) | 3.86E-08 | GABBR2, GABRA1, GABRA3, GABRA4, GABRA5, GABRB3 |
| GO:0034220 (Biol. Proc.) | Ion transmembrane transport (995) | 30 (CNS) | 1.55E-14 | ATP2B2, CACNA1A, CACNA1B, CACNA1D, CACNA1G, CACNA2D3, GABRA1, GABRA3, GABRA4, GABRA5, GABRB3, GLRA2, GRIA1, GRID1, GRIK2, GRIN1, GRIN2A, GRIN2B, HCN1, KCND2, KCNQ2, KCNQ3, SCN1A, SCN2A, SCN8A, SLC12A5, SLC1A2, SLC24A2, SLC30A3, SLC4A10 |
| GO:0034702 (Cell. Comp.) | Ion channel complex (278) | 24 (CNS) | 7.59E-22 | CACNA1A, CACNA1B, CACNA1D, CACNA1G, CNTNAP2, DPP10, GABRA1, GABRA3, GABRA4, GABRA5, GABRB3, GLRA2, GRIA1, GRIK2, GRIN1, GRIN2A, GRIN2B, HCN1, KCND2, KCNQ2, KCNQ3, SCN1A, SCN2A, SCN8A |
| GO:0022839 (Mol. Funct.) | Ion gated channel activity (329) | 24 (CNS) | 4.34E-19 | CACNA1A, CACNA1B, CACNA1D, CACNA1G, CACNA2D3, GABRA1, GABRA3, GABRA4, GABRA5, GABRB3, GLRA2, GRIA1, GRID1, GRIK2, GRIN1, GRIN2A, GRIN2B, HCN1, KCND2, KCNQ2, KCNQ3, SCN1A, SCN2A, SCN8A |
| GO:0005262 (Mol. Funct.) | Calcium channel activity (114) | 9 (CNS) | 7.18E-08 | CACNA1A, CACNA1B, CACNA1D, CACNA1G, CACNA2D3, GRIN1, GRIN2A, RIN2B, SLC24A2 |
| Key GO terms of the CNS+PT geneset (200 genes) clustered on brain development, synapse, and gene regulation | ||||
| GO:0007399 (Biol. Proc.) | Nervous system development (2206) | 72 (CNS+PT) | 7.50E-17 | ANK2, ANK3, APBB1, ARHGAP33, ARID1B, ARNT2, ATRX, AUTS2, CAMK2B, CAMSAP2, CHD5, CHD7, CHD8, CIC, CLSTN3, CNR1, CNTN4, CSNK1E, DAGLA, DLG4, DMD, DPYSL2, DPYSL3, DYRK1A, EPHB2, EXT1, GIGYF2, GSK3B, HDAC4, JARID2, KDM6A, KDM6B, KIF5C, KIT, MAP2, APK8IP2, MARK1, MBD5, MECP2, MYH10, MYO5A, NAV2, NEGR1, NEO1, NF1, NFIB, NIPBL, NLGN2, NPAS2, NR4A2, NRCAM, NRXN2, NRXN3, NTRK3, OPHN1, PLCB1, PRICKLE1, PTBP2, RERE, SATB2, SETD2, SLIT3, SMARCA2, SMARCC2, SNAP25, SPAST, STXBP1, SYN1, TAOK2, TCF4, TSC1, WASF1 |
| GO:0050804 (Biol. Proc.) | Modulation of chemical synaptic transmission (316) | 20 (CNS+PT) | 1.74E-08 | CAMK2B, CLSTN2, CLSTN3, CNR1, CNTN4, DLG4, EPHB2, GRIK5, KCNB1, KIT, MAPK8IP2, MECP2, NF1, NLGN2, OPHN1, RIMS3, SNAP25, STX1A, STXBP1, SYN1 |
| GO:0099537 (Biol. Proc.) | Trans-synaptic signalling (408) | 22 (CNS+PT) | 3.16E-08 | ARID1B, CACNB2, CASK, CLSTN3, CNR1, DAGLA, DLG4, EPHB2, GRIK5, GSK3B, MAPK8IP2, MECP2, MYO5A, NF1, NRXN2, RIMS3, SLC6A1, SNAP25, STX1A, STXBP1, SYN1, SYNJ1 |
| GO:0045202 (Cell. Comp.) | Synapse (849) | 45 (CNS+PT) | 3.25E-17 | ANK2, ANK3, APBB1, ARHGAP32, ARHGAP33, ATP1A3, CACNA1C, CADM1, CAMK2B, CASK, CLSTN2, CLSTN3, CNR1, CPEB4, DAGLA, DLG4, DMD, DMXL2, EPHB2, GPHN, GRIK5, GSK3B, HDAC4, ITPR1, KCNB1, MAP2, MAPK8IP2, MECP2, MYH10, NF1, NLGN2, NRCAM, NRXN2, OPHN1, PDE4B, PSD3, RIMS3, SNAP25, STX1A, STXBP1, STXBP5, SYN1, SYNE1, SYNJ1, WASF1 |
| GO:0005634 (Cell. Comp.) | Nucleus (6892) | 128 (CNS+PT) | 1.73E-14 | ANKRD11, APBB1, APC, ARHGAP32, ARID1B, ARNT2, ASH1L, ATRX, AUTS2, BAZ2B, BRD4, BTAF1, CAMK2B, CAMTA1, CASK, CDK13, CHD3, CHD5, CHD7, CHD8, CIC, CMIP, CPEB4, CREBBP, CSNK1E, CTCF, DCUN1D1, DDX3X, DMD, DOCK4, DST, DYRK1A, EHMT1, EP400, EPC2, EPHB2, FBXO11, FOXP1, GGNBP2, GRIK5, GSK3B, HCFC1, HDAC4, HERC2, HNRNPU, HUWE1, INTS6, IRF2BPL, ITPR1, JARID2, JMJD1C, KAT6A, KATNAL1, KDM4B, KDM6A, KDM6B, KHDRBS3, MAP2, MBD5, MECP2, MED13, MED13L, MEIS2, MKL2, NAV2, NCOR1, NEO1, NF1, NFIB, NFIX, NIPBL, NPAS2, NR2F1, NR3C2, NR4A2, NSD1, OCRL, OFD1, OGT, PDE4A, PHF2, PHIP, PLCB1, POGZ, PRICKLE1, PRICKLE2, PRKCB, PRPF39, PTBP2, QRICH1, RAI1, RB1CC1, RBM27, RERE, RFX3, RNF38, SAE1, SATB2, SETBP1, SETD2, SMARCA2, SMARCC2, SPAST, SRSF11, STX1A, STXBP1, SYN1, SYNE1, TAOK2, TCF4, TLK2, TOP1, TRIM33, TRIP12, TSC1, UBN2, UBR5, UPF2, USP15, USP7, WAC, WDFY3, WDR26, YEATS2, YY1, ZMYND11, ZNF462, ZNF827 |
| GO:0006325 (Biol. Proc.) | Chromatin organization (683) | 44 (CNS+PT) | 1.44E-18 | APBB1, ARID1B, ASH1L, ATRX, BAZ2B, BRD4, CHD3, CHD5, CHD7, CHD8, CREBBP, CTCF, EHMT1, EP400, EPC2, HCFC1, HDAC4, HNRNPU, HUWE1, JARID2, JMJD1C, KAT6A, KDM4B, KDM6A, KDM6B, MECP2, NCOR1, NSD1, OGT, PHF2, PRKCB, RERE, SATB2, SETD2, SMARCA2, SMARCC2, TLK2, TOP1, USP15, USP7, WAC, YEATS2, ZMYND11, ZNF462 |
| GO:0003682 (Mol. Func.) | Chromatin binding (501) | 29 (CNS+PT) | 2.62E-11 | APBB1, ASH1L, ATRX, AUTS2, BRD4, CHD7, CHD8, CIC, CREBBP, CTCF, EP400, HCFC1, HDAC4, HNRNPU, JARID2, JMJD1C, KDM6A, KDM6B, MBD5, MECP2, NIPBL, NSD1, PRKCB, RERE, SATB2, SMARCA2, TOP1, WAC, ZMYND11 |
| GO:0016570 (Biol. Proc.) | Histone modification (347) | 26 (CNS+PT) | 2.08E-12 | APBB1, ASH1L, CHD3, CHD5, CREBBP, EHMT1, EP400, EPC2, HCFC1, HDAC4, HUWE1, JMJD1C, KAT6A, KDM4B, KDM6A, KDM6B, MECP2, NSD1, OGT, PHF2, PRKCB, SETD2, USP15, USP7, WAC, YEATS2 |
| GO:0042393 (Mol. Func.) | Histone binding (188) | 12 | 2.99E-05 | APBB1, ATRX, BRD4, CHD5, CHD8, PHF2, PHIP, PRKCB, SMARCA2, USP15, YEATS2, ZMYND11 |
| GO:0008134 (Mol. Func.) | Transcription factor binding (610) | 24 | 2.05E-06 | APBB1, ARNT2, CDK13, CREBBP, DDX3X, FOXP1, GSK3B, HCFC1, HDAC4, HNRNPU, JARID2, JMJD1C, KAT6A, MECP2, MED13, MEIS2, NCOR1, NR4A2, NSD1, PRKCB, TCF4, TRIP12, USP7, YEATS2 |
| GO:0010468 (Biol. Proc.) | Regulation of gene expression (4533) | 96 (CNS+PT) | 4.21E-12 | ANK2, ANK3, APBB1, ARID1B, ARNT2, ASH1L, ATRX, AUTS2, BAZ2B, BRD4, BTAF1, CAMTA1, CDK13, CHD3, CHD5, CHD7, CHD8, CIC, CPEB4, CREBBP, CSNK1E, CTCF, DAPK1, DDX3X, DYRK1A, EHMT1, EPC2, EPHB2, FOXP1, GGNBP2, GIGYF2, GSK3B, HCFC1, HDAC4, HNRNPU, IRF2BPL, JARID2, JMJD1C, KAT6A, KDM4B, KDM6A, KDM6B, KHDRBS3, KIT, MECP2, MED13, MED13L, MEIS2, MKL2, NCOR1, NEO1, NF1, NFIB, NFIX, NIPBL, NPAS2, NR2F1, NR3C2, NR4A2, NSD1, NTRK3, OGT, PHF2, PHIP, PLCB1, POGZ, PRICKLE1, PRKCB, PTBP2, QRICH1, RAI1, RB1CC1, RERE, RFX3, SATB2, SETBP1, SETD2, SLIT3, SMARCA2, SMARCC2, TCF4, TNRC6B, TOP1, TRIM33, TSC1, UBR5, UPF2, USP15, USP7, VIP, WAC, YEATS2, YY1, ZMYND11, ZNF462, ZNF827 |
| GO:0003677 (Mol. Func.) | DNA binding (2457) | 53 | 5.62E-06 | ARID1B, ARNT2, ASH1L, ATRX, BAZ2B, BTAF1, CAMTA1, CDK13, CHD3, CHD5, CHD7, CHD8, CIC, CREBBP, CTCF, DDX3X, EP400, FOXP1, HDAC4, HNRNPU, HUWE1, JARID2, JMJD1C, KAT6A, KDM6A, KDM6B, MECP2, MEIS2, NCOR1, NFIB, NFIX, NPAS2, NR2F1, NR3C2, NR4A2, NSD1, POGZ, QRICH1, RAI1, RERE, RFX3, SATB2, SETBP1, SMARCA2, SMARCC2, TCF4, TOP1, TRIM33, UPF2, YY1, ZMYND11, ZNF462, ZNF827 |
| GO:0043167 (Mol. Func.) | Ion binding (6066) | 106 (CNS+PT) | 1.42E-08 | AGAP1, ARHGAP32, ARHGAP33, ASAP2, ASH1L, ATP1A3, ATP8A1, ATRX, BAZ2B, BTAF1, CACNA1C, CACNA2D1, CAMK2B, CASK, CDC42BPB, CDK13, CHD3, CHD5, CHD7, CHD8, CLSTN2, CLSTN3, CPEB4, CREBBP, CSNK1E, CTCF, DAGLA, DAPK1, DDX3X, DMD, DPYSL3, DST, DYNC1H1, DYRK1A, EHMT1, EP400, EPHB2, EXT1, FBXO11, FGD1, FOXP1, GPHN, GSK3B, HDAC4, HERC2, HNRNPU, IRF2BPL, ITPR1, JMJD1C, KAT6A, KATNAL1, KCND3, KCNMA1, KDM4B, KDM6A, KDM6B, KIF21B, KIF5C, KIT, MARK1, MYH10, MYO5A, NAV2, NF1, NPAS2, NR2F1, NR3C2, NR4A2, NRXN2, NRXN3, NSD1, NTRK3, OGT, OPHN1, PDE4A, PDE4B, PHF2, PHF3, PLCB1, POGZ, PRICKLE1, PRICKLE2, PRKCB, RAI1, RAPGEF4, RBM27, RERE, RNF38, SETD2, SLC6A1, SLIT3, SMARCA2, SPAST, SYN1, TAOK2, TLK2, TOP1, TRIM33, TRIO, UBR5, WDFY3, YTHDC2, YY1, ZMYND11, ZNF462, ZNF827 |
Consistently, the synapses (42/91 genes, FDR = 4.06E-30), neuronal projection (44/91, FDR = 9.54E-28) and ion channel complex (24/91, FDR = 7.59E-22, Table 3) were enriched in “Cell Components”. The ion-gated channel activity (24/91, FDR = 5.78E-19) and neurotransmitter receptor activity (13/91, FDR = 3.60E-13) including glutamate (7/91, 2.95E-09, GRIA1, GRID1, GRIK2, GRIN1, GRIN2A, GRIN2B, GRM1) and GABA receptor activity (6/91, 4.12E-08, GABBR2, GABRA1, GABRA3, GABRA4, GABRA5, GABRB3), were the most significant “Molecular Functions”. The “KEGG pathway” analyses (S13 Table) demonstrated that Glutamatergic synapse (12/91, 2.46E-11, CACNA1A, CACNA1D, DLGAP1, GRIA1, GRIK2, GRIN1, GRIN2A, GRIN2B, GRM1, HOMER1, SHANK2, SLC1A2), GABAergic synapse (11/91, 3.44E-11, CACNA1A, CACNA1B, CACNA1D, GABBR2, GABRA1, GABRA3, GABRA4, GABRA5, GABRB3, GAD1, SLC12A5), Calcium signalling pathway (11/91, 1.80E-08, ATP2B2, CACNA1A, CACNA1B, CACNA1D, CACNA1G, CAMK2A, ERBB4, GRIN1, GRIN2A, GRM1, NOS1) and Circadian entrainment (9/91, 1.74E-08, CACNA1D, CACNA1G, CAMK2A, GRIA1, GRIN1, GRIN2A, GRIN2B, NOS1, NOS1AP) were the top pathways in the CNS geneset (Table 3). Together, these data suggest that the 91 CNS-specific ASD risk factors are involved in regulation of brain development, E/I balance and calcium signalling, which are closely related to the ASD core features, and to the CNS comorbidity such as epilepsy, intellectual disability and sleeping disorders.
Enriched chromatin organisation and gene regulation in CNS+PT geneset
Analyses of the 200 CNS+PT genes resulted in 546 “Biological Processes” (S14 Table), 127 “Cellular Components” (S15 Table), and 123 “Molecular Function” (S16 Table). Like the CNS geneset, CNS development and synapse are the top pathways in the CNS+PT ASD geneset. This included Nervous system development (72/200 genes in blue, FDR = 7.50E-17, Fig 6B), Modulation of chemical synaptic transmission (20/200, FDR = 1.74E-08) and Trans-synaptic signalling (22/200, FDR = 3.16E-08) as top “Biological Processes”, Synapse (46/200 in red, FDR = 6.44E-18, Fig 6B) as the most significant “Cellular Components”, Ion binding (106/200, FDR = 2.09E-08) in the “Molecular Function” (Table 3), and Long-term potentiation (6/200, FDR = 0.003), Glutamatergic (7/200, FDR = 0.006), and Dopaminergic synapse (7/200, FDR = 0.011) identified in the “KEGG” pathways (Table 3, S17 Table).
However, the most prominent feature of the CNS+PT ASD geneset was transcription regulation, and this included Nucleus (128/200, FDR = 1.73E-14) in the “Cellular Components”, Regulation of gene expression (96/200 genes in red, FDR = 4.21E-12, Fig 6B), Chromatin organization (44/200 in green, FDR = 1.44E-18, Fig 6B) and Histone modification (26/200, FDR = 2.08E-12) identified in the “Biological Processes”, Chromatin binding (29/200, FDR = 3.00E-11), Transcription factor binding (24/200, FDR = 2.26E-06), DNA binding (53/200, FDR = 6.72E-06) and Histone binding (12/200, FDR = 3.17E-05) in the “Molecular Function”.
In addition, Circadian entrainment (5/200 genes, FDR = 0.034, CACNA1C, CAMK2B, ITPR1, PLCB1, PRKCB), WNT signalling (10/200, FDR = 3.1E-04, APC, CAMK2B, CHD8, CREBBP, CSNK1E, GSK3B, PLCB1, PRICKLE1, PRICKLE2, PRKCB), Thyroid hormone signalling (8/200, FDR = 1.5E-03, ATP1A3, CREBBP, GSK3B, MED13, MED13L, NCOR1, PLCB1, PRKCB), Aldosterone synthesis and secretion (8/200, FDR = 5.0E-04, ATP1A3, CACNA1C, CAMK2B, DAGLA, ITPR1, NR4A2, PLCB1, PRKCB), Gastric acid secretion (5/200, FDR = 0.0179, ATP1A3, CAMK2B, ITPR1, PLCB1, PRKCB), Insulin secretion (9/200, FDR = 7.16E-05, ATP1A3, CACNA1C, CAMK2B, KCNMA1, PLCB1, PRKCB, RAPGEF4, SNAP25, STX1A), Salivary secretion (5/200, FDR = 0.0298, ATP1A3, ITPR1, KCNMA1, PLCB1, PRKCB) and Pancreatic secretion (5/200, FDR = 0.0343, ATP1A3, ITPR1, KCNMA1, PLCB1, PRKCB) were also detected as significant KEGG pathways in the CNS+PT ASD geneset.
In consistency with this, STRING analysis of the combined 291 ASD genes gave rise to 47 “KEGG pathways” (S18 Table), 677 “Biological Processes” (S19 Table), 149 “Cellular Components” (S20 Table) and 177 “Molecular Function” (S21 Table). The top enriched pathways of the combined ASD risk factors included Nervous system development (119/291 genes, FDR = 8.85E-34), Synapse (87/291, 1.9E-43), Trans-synaptic signalling (53/291, 1.04E-28), Ion channel complex (36/291, 2.55E-20), Ion-gated channel activity (33/291, 1.2E-14), Regulation of ion transport (44/291, 4.79E-15) and Neurotransmitter receptor activity (14/291, 8.86E-08), Chromatin organisation (44/291, 9.4E-14), Chromosome (36/291, 4.80E-06) and Chromatin binding (31/291, 3.48E-09) and Positive regulation of gene expression (66/291, 8.15E-10). These data suggest that the CNS+PT geneset of ASD candidate genes may influence not only the core symptoms via CNS development and synaptic function, but also the comorbidities through dysregulated gene expression and hormonal signalling in the peripheral organs.
E/I balance, and calcium signalling are central to ASD
KEGG analyses generated 26 pathways for the CNS (S13 Table) geneset and 31 pathways for the CNS+PT geneset (S17 Table). The top pathways from the CNS geneset corresponded to Glutamatergic synapse (12/91 genes, 2.46E-11), GABAergic synapse (11/91, 3.44E-11), Neuroactive ligand-receptor interaction (14/91, 1.42E-09), Retrograde endocannabinoid signalling (11/91, 3.77E-09), Calcium signalling pathway (11/91, 1.80E-08) and MAPK signalling (6/91, 0.0105). The CNS+PT ASD geneset was also enriched for Secretion, Thyroid function, and Cellular signalling. Interestingly, 10 pathways from both ASD genesets appeared to overlap, which included Glutamatergic, Dopaminergic, Cholinergic synapses, Circadian entrainment, cAMP and Retrograde endocannabinoid signalling (Table 3). Calcium channels, Glutamatergic and GABAergic receptors appeared to link to most of the pathways.
To further investigate the interconnectivity among the KEGG pathways (S18 Table), we constructed an interaction matrix with the combined ASD geneset KEGG pathways (S22 Table), similar to a previous analysis [30]. The calcium signalling (27/47), MAPK Signalling (12/47) and cAMP signalling (6/47) were identified as highly interconnected signalling pathways. Pre-synaptically, the genes in calcium signalling also appeared frequently in the other pathways, particularly the genes encoding the pore-forming subunit of voltage-gated calcium channel (CACNA1A, CACNA1B, CACNA1C, CACNA1D), the I3P receptor IPTR1, PLCB and the calmodulin proteins (CAMK2A, CAMK2B) are connected to the neurotransmitter releases (Table 4). Post-synaptically, Glutamatergic synapse (8/47) had the largest number of interactions with other pathways, which was followed by Dopaminergic synapse (7/47). The NDMAR (GRIN2A, GRIN2B, GRIN1) and AMPA (GRIA1) receptors were also the highly interconnected notes in neural and synaptic, calcium and cAMP signalling pathways. In summary, this overlap analyses demonstrated that the E/I balance, and calcium signalling are the most significant pathways linking to the ASD core symptoms, and transcriptional regulation to the ASD comorbidities.
Table 4. Genes dysregulated in ASD expression studies that overlapped with our geneset.
| Study | Tissue type | genes overlap | up | down |
|---|---|---|---|---|
| Gupta [66] | Cortical post-mortem | 22 | 18 | 4 |
| Parikshak [67] | Cortical post-mortem | 24 | 4 | 20 |
| Voineagu [56] | Cortical post-mortem | 48 | 39 | 9 |
| Walker (2013) [49] | colon | 2 | 0 | 2 |
| Walker (2016) [46] | blood and colon | 70 | 5|37** | 29|6** |
| Mariani [50] | Organoids | 89 | 86* | 3* |
| Gresi Olivera [54] | IPSC neurons | 2 | 2 | 0 |
| DeRosa [53] | IPSC neurons | 15 | 4* | 11* |
| Velmeshev [68] | Cortical tissue post-mortem | 38 | 32 | 6 |
| Herrero [69] | Amygdala post-mortem | 9 | 2 | 7 |
| Chien [48] | Lymphblastoid cell lines | 9 | 2 | 7 |
| Ginsberg [70] | Cortical tissue | 2 | 2 | 0 |
| Garbett [45] | Superior Temporal Gyrus | 2 | 0 | 2 |
| Breen [55] | IPSC neurons and NPCs | 10 | 9 | 1 |
| Wang (2015) [64] | IPSC neurons and NPCs | 84 | 63 | 21 |
| Wang (2017) [52] | Organoids | 24 | 17 | 7 |
| Pramparo [47] | Leukocytes | 15 | 0 | 12 |
*denotes genes which have simultaneous up/down expression
** denote genes for blood and colon samples respectively.
Enriched epilepsy/seizures in the CNS geneset and congenital abnormalities/developmental delay in CNS+PT geneset
The results from WebGestalt (Fig 7, Supplementary links 1 and 2) showed that epilepsy and seizures were enriched in 19 of the top 50 phenotype terms and movement disorders in 9 of the 50 terms in the CNS geneset. In the CNS+PT set, there was enrichment for behaviour issues (9/50) such as self-injurious (FDR = 1.04E-07), aggressive behaviour (1.04E-11), and congenital abnormalities of the face (25/50 items).
Fig 7. Co-Morbid phenotypes associated with ASD.

(A) Top 50 terms enriched in CNS geneset, (B) top 50 terms enriched in CNS+PT geneset. X-axis denotes ratio of enrichment. Dark blue are terms below FDR < 0.05.
High proportion of the ASD genes were dysregulated in ASD
We compared the ASD geneset with DEGs between ASD and controls in the literature and found that 201 of the 292 genes in our ASD geneset were dysregulated, at least once across multiple ASD gene expression studies (Table 4, S23 Table). Recurrent DEGs such as RELN, FOXP1, GAD1, NRXN1, FOXG1 and CAMK2A were present in multiple studies (S23 Table). These data suggest that not only mutations but also dysregulated expression of the ASD risk genes can be linked to the development of ASD.
ASD genes enriched in cortex development and sex-bias brain expression
We compared ASD shortlist with CSEA dataset and found that 280 of the 292 ASD genes were mapped to CSEA, with an enrichment in the cortex across most timepoints (S24 Table), with most significant enrichment in the early-mid fetal stage of brain development at pSI 0.05 (p-value = 5.427e-16, FDR = 3.256e-14) pSI 0.01 (p-value = 5.560e-07 FDR = 3.336e-05) and pSI 0.001 p-value = 8.912e-04, FDR = 0.053) (Fig 8D). In addition, there was also enrichment of genes in the striatum at the early-mid fetal stage (p-value = 1.872e-08, FDR = 2.808e-07), in the cerebellum at childhood (p-value = 7.576e-07, FDR = 7.576e-06) and adolescence (p-value = 9.970e-04, FDR = 0.005), in the thalamus in early fetal (p-value = 0.010, 0.043) and neonatal period (p-value 4.333e-04, FDR = 0.003), and in the amygdala from mid-early (p-value = 0.009, FDR = 0.042) to mid-late (p-value = 0.017, FDR = 0.064) fetal stages. These data suggest that the ASD geneset plays essential role in brain development, especially corticogenesis.
Fig 8. Sex-biased expression of the ASD genesets.

Biased expression of the ASD genesets in female (A) and male (B) brain regions. Values are expressed as FDR in red and Log2 odds ratio in green with gradients. N.S for not significant. (C) Overlap of 34 ASD genes with sex-biased splicing genes. (D) Bullseye plot showing enrichment of ASD geneset in brain regions with most significant correlation in cerebral cortex throughout brain development. A1C -primary auditory cortex, AMY—amygdaloid complex, CBC—cerebellar cortex, DFC -dorsolateral prefrontal cortex, HIP—hippocampus, IPC—posterior inferior parietal cortex, ITC—inferolateral temporal cortex, M1C-primary motor cortex, MD—mediodorsal nucleus of thalamus, MFC—medial prefrontal cortex, OFC -orbital frontal cortex, S1C - primary somatosensory cortex, STC—posterior(caudal) superior temporal cortex, STR -striatum, VFC—ventrolateral prefrontal cortex, and V1C - primary visual cortex.
To investigate if the ASD genes are sex-related, we compared the ASD geneset with genes which were known to have sex-biased expression in prenatal male and female (S25 Table). Significant correlations were found with genes bias for female cerebellar cortex, dorsolateral prefrontal cortex, medial prefrontal cortex, orbital frontal cortex, inferolateral temporal cortex and caudal superior temporal cortex (Fig 8A), and with genes bias for male primary somatosensory cortex, mediodorsal nucleus of thalamus and striatum (Fig 8B). In addition, 34 of the 292 genes were found to have sex-biased gene-splicing in at least one brain region (Fig 8C, S25 Table). These genes are likely to contribute to sex-bias occurrence of the ASD.
ASD genes present in other conditions
We next compared the ASD genes with other neuropsychiatric conditions, including schizophrenia, bipolar and major depression, and peripheral conditions such as arrythmia, inflammatory bowel disease and type 1 and type 2 diabetes (Fig 9, S25 Table), and identified 94 genes which were identified in Pyschgenet database (Fig 9A), and involved in synaptic transmission. The remaining ASD-unique genes were enriched for chromatin organization and gene expression. We also found significant overlaps of the ASD genes with factors associated with psychiatric and peripheral conditions (Fig 9B), including a large overlap with type 2 diabetes (134/292, FDR = 3e-42). These data suggest a common disturbance in neuronal communication with CNS other neuropsychiatric disorders and gene dysregulation with peripheral conditions.
Fig 9. Overlap of ASD genes with other conditions.

A) Comparison of the ASD geneset with Pyschgenet (SCZ, BP, MDD) defines a network of 94 overlapping genes (green) and 198 ASD-unique genes (blue). B) matrix of overlaps between ASD/Psychiatric (SCZ, BP, MDD) and peripheral (IBD, ARY. T1D and T2D) conditions. C) Network of ASD genes and overlaps with peripheral (IBD, ARY. T1D and T2D) conditions, with orange circle for non-overlapping genes. IBD—Inflammatory bowel disease, Ary—Arrythmia, T1D - type 1 diabetes, T2D - type 2 diabetes. SCZ–schizophrenia, BP–bipolar disorder, MDD–major depressive disorder.
Discussion
It is becoming apparent that ASD genes could influence other organ systems. This is reflected by the many co-morbidities occurring outside the CNS such gastrointestinal issues, metabolic disorders, auto-immune disorders, tuberous sclerosis, attention-deficit hyperactivity disorder, and sensory problems associated motor problems. However, little attention has been given to related organs of major comorbidities. Here we have identified 319 overlapping ASD candidates among the four independent scoring systems and the SFARI database [28, 31–34]. We also introduced gene expression using the GTEx database [39, 71], which consists of mRNA data of 53 human tissues from approximately 1000 individuals at the age of 21–70. This resulted in a shortlist of 292 common ASD candidate genes with mRNA expression at TPM ≥3 transcripts. This also categorized the ASD factors into 2 genesets, the CNS-specific geneset of 91 genes (with a TMP<3 in PT) and the CNS+PT geneset of 201 genes. This was validated at the protein level across these tissues in the human protein atlas (HPA) dataset and Huri, showing that that ASD genes are not only expressed in other organs outside the brain, but also appear to interact with other proteins in tissue-specific networks.
STRING analyses show that the CNS geneset is enriched for nervous development, glutamatergic/GABAergic synapses, and calcium signalling. Phenotype analysis also showed high enrichment for epilepsy and seizures. Both results support the hypothesis that disruption of E/I balance during CNS development as a major feature of ASD [72], which are related to CNS co-morbidities such as epilepsy occurring in 30% of ASD at severe end of the spectrum.
The expression of 201 ASD candidate genes in CNS+PT suggest that ASD genes may influence not only the CNS but also peripheral systems in the body. This geneset is enriched for nervous development and synapse, as well as for chromatin organisation and gene regulation, which are consistent with previous reports from exome sequencing studies [12, 14, 16, 17, 29]. Therefore, the genes involved in chromatin organisation and gene regulation could have an influence in peripheral co-morbidities. Many of the genes in our ASD geneset also show dysregulated expression in multiple studies (Table 4) pertaining to cortical tissue and iPSC derived models, and in the few studies carried on gene expression in the gastrointestinal tract of ASD.
Strong candidate genes such as CHD8, POGZ and DYRK1A were previously reported to be associated with not only autism but also gastrointestinal issues, facial dysmorpisms, visual and feeding problems [73–76]. Indeed, facial dysmorphism is also a recurrent phenotype that emerges among various subgroups of autistics with known genetic mutations [77–79]. Some enrichment of ASD genes reported to overlap with heart development (S10-21) and congenital heart deformation [80, 81], and a high rate of ASD diagnosis was reported among children with congenital heart defects [82]. POGZ and ANKRD11 are also present in many tissue interaction networks (Table 2) which are involved in neural proliferation. The POGZ is a zinc finger protein interacting with the transcription factor SP1 [83], and ANKRD11 is a chromatin regulator, modulating histone acetylation and inhibiting ligand-dependent activation of transcription [84]. ANKRD11 mutations have been associated with diseases with distinctive craniofacial features, short stature, skeletal anomalies, global developmental delay, seizures and intellectual disability [85].
The strong enrichment for neuronal processes and functions in tissues beyond the brain is of curious interest, but researchers are starting to explore other aspects of ASD that could have an impact on other organs such as the heart via the sympathetic and parasympathetic nervous systems [86], and the gastrointestinal tract via the enteric nervous system [87]. In fact there is growing evidence that heart rate is affected among Autistics [88–91], along with evidence that ASD genes could be involved in aspects of gastrointestinal development and function [74, 92–97]. There is a potential for more work on how the parts of the brain control heart rate and gastrointestinal, how they are altered in autism, or even if reported autonomic issues in co-morbidities such gastroesophageal reflux [98, 99] hold true in the autistic population as well. The expression of proteins such as STX1A, SNAP25 and FOXP1 expressed in endocrine tissues could be of interest in ASD, given how knockouts in these genes can impact the development and function of certain parts of the endocrine system [100–102] and how genes involved in neurotransmission could also be involved in secretion of hormones [103].
Another unaddressed question is if the peripheral nervous system and peripheral organs are affected by mutations in addition to the CNS. Amongst the results we found enrichment for neuromuscular and cardiac function in STRING analysis (S9-20). Some animal models such as FOXP1, SHANK3, NOS1 and CHD8 [74, 92, 94, 96, 97] have been developed for functional analysis of ASD candidate genes in the gastrointestinal system, which indicates that ASD genes may play an important role in this organ [95], and yet most research have been mainly focused on the brain in both human and animal models. A greater utilisation of the animal models to explore other systems such as the cardiac and gastrointestinal systems would be welcome.
In fact, 88/292 genes in our ASD geneset already have existing genetic mouse models, as well as rescue models for 28/292 genes according to the SFARI database (July 2020) at the time of writing. They are helpful in understanding function of these genes, and may also assist drug development to remediate related pathways, not just in the brain, but also throughout the peripheral nervous system that connects to co-morbidity organs, and even in the peripheral organs themselves.
The interconnectivity analyses from the current study reveal calcium, MAPK and glutamatergic signalling as three highest interconnected pathways, all are also involved with each other based on the interaction matrix. This is in line with a previous publication that ASD factors are converged upon MAPK and calcium signalling [30]. It is worth to note that MAPK signalling is also interlinked with calcium signalling in this study. Ten of the 14 MAPK pathway members, CACNA1A, CACNA1B, CACNA1C, CACNA1D, CACNA1G, CACNA2D1, CACNA2D3, CACNB2, ERBB4 and PRKCB, are overlapped with the calcium signalling (Table 5), and 8 of them are calcium channels. Furthermore, calcium channels appear in 16 top KEGG pathways including glutamatergic, GABAergic, dopaminergic, cholinergic and serotonergic synapses of the ASD genes (Table 5). Our results add to the evidence that calcium and glutamatergic signalling are the significant components in ASD pathways.
Table 5. Converging ASD candidate genes on E/I balance and calcium signalling pathway.
| Term ID | Term description (Background Gene Count) | ASD genes | FDR | Matching proteins in the network (IDs) |
|---|---|---|---|---|
| hsa04724 | Glutamatergic synapse (112) | 12 (CNS) | 2.46E-11 | CACNA1A, CACNA1D, DLGAP1, GRIA1, GRIK2, GRIN1, GRIN2A, GRIN2B, GRM1, HOMER1, SHANK2, SLC1A2 |
| 6 (CNS+PT) | 0.0179 | CACNA1C, DLG4, GRIK5, ITPR1, PLCB1, PRKCB | ||
| 19 (Com) | 1.21E-10 | CACNA1A, CACNA1C, CACNA1D, DLG4, DLGAP1, GRIA1, GRIK2, GRIK5, GRIN1, GRIN2A, GRIN2B, GRM1, HOMER1, SHANK3, ITPR1, PLCB1, PRKCB, SHANK2, SLC1A2 | ||
| hsa04727 | GABAergic synapse (88) | 11 (CNS) | 3.44E-11 | CACNA1A, CACNA1B, CACNA1D, GABBR2, GABRA1, GABRA3, GABRA4, GABRA5, GABRB3, GAD1, SLC12A5 |
| 15 (Com) | 2.48E-09 | CACNA1A, CACNA1B, CACNA1C, CACNA1D, GABBR2, GABRA1, GABRA3, GABRA4, GABRA5, GABRB3, GAD1, GPHN, PRKCB, SLC12A5, SLC6A1 | ||
| hsa04728 | Dopaminergic synapse (128) | 8 (CNS) | 2.16E-06 | CACNA1A, CACNA1B, CACNA1D, CAMK2A, GRIA1, GRIN2A, GRIN2B, SCN1A |
| 7 (CNS+PT) | 0.0126 | CACNA1C, CAMK2B, GSK3B, ITPR1, KIF5C, PLCB1, PRKCB | ||
| 15 (Com) | 7.84E-08 | CACNA1A, CACNA1B, CACNA1C, CACNA1D, CAMK2A, CAMK2B, GRIA1, GRIN2A, GRIN2B, GSK3B, ITPR1, KIF5C, PLCB1, PRKCB, SCN1A | ||
| hsa04725 | Cholinergic synapse (111) | 6 (CNS) | 0.0001 | CACNA1A, CACNA1B, CACNA1D, CAMK2A, KCNQ2, KCNQ3 |
| 11 (Com) | 2.36E-05 | CACNA1A, CACNA1B, CACNA1C, CACNA1D, CAMK2A, CAMK2B, ITPR1, KCNQ2, KCNQ3, PLCB1, PRKCB | ||
| hsa04726 | Serotonergic synapse (112) | 5 (CNS) | 0.0011 | CACNA1A, CACNA1B, CACNA1D, GABRB3, KCND2 |
| 10 (Com) | 0.00062 | CACNA1A, CACNA1B, CACNA1C, CACNA1D, GABRB3, ITPR1, KCND2, PLCB1, PRKCB | ||
| hsa04720 | Long-term potentiation (64) | 6 (CNS) | 6.89E-06 | CAMK2A, GRIA1, GRIN1, GRIN2A, GRIN2B, GRM1 |
| 6 (CNS+PT) | 0.0025 | CACNA1C, CAMK2B, CREBBP, ITPR1, PLCB1, PRKCB | ||
| 12 (Com) | 3.14E-08 | CACNA1C, CAMK2A, CAMK2B, CREBBP, GRIA1, GRIN1, GRIN2A, GRIN2B, GRM1, ITPR1, PLCB1, PRKCB | ||
| hsa04730 | Long-term depression (60) | 4 (CNS) | 0.0011 | CACNA1A, GRIA1, GRM1, NOS1 |
| 7 (Com) | 0.00051 | CACNA1A, GRIA1, GRM1, ITPR1, NOS1, PLCB1, PRKCB | ||
| hsa04024 | cAMP signaling pathway (195) | 8 (CNS) | 3.21E-05 | ATP2B2, CACNA1D, CAMK2A, GABBR2, GRIA1, GRIN1, GRIN2A, GRIN2B |
| 7 (CNS+PT) | 0.0382 | ATP1A3, CACNA1C, CAMK2B, CREBBP, PDE4A, PDE4B, RAPGEF4 | ||
| 15 (Com) | 7.17E-06 | ATP1A3, ATP2B2, CACNA1C, CACNA1D, CAMK2A, CAMK2B, CREBBP, GABBR2, GRIA1, GRIN1, GRIN2A, GRIN2B, PDE4A, PDE4B, RAPGEF4 | ||
| hsa04010 | MAPK signaling pathway (293) | 6 (CNS) | 0.0105 | CACNA1A, CACNA1B, CACNA1D, CACNA1G, CACNA2D3, ERBB4 |
| 14 (Com) | 0.0013 | CACNA1A, CACNA1B, CACNA1C, CACNA1D, CACNA1G, CACNA2D1, CACNA2D3, CACNB2, ERBB4, KIT, MAPK8IP2, NF1, PRKCB, TAOK2 | ||
| hsa04020 | Calcium signaling pathway (179) | 11 (CNS) | 1.80E-08 | ATP2B2, CACNA1A, CACNA1B, CACNA1D, CACNA1G, CAMK2A, ERBB4, GRIN1, GRIN2A, GRM1, NOS1 |
| 16 (Com) | 7.79E-07 | ATP2B2, CACNA1A, CACNA1B, CACNA1C, CACNA1D, CACNA1G, CAMK2A, CAMK2B, ERBB4, GRIN1, GRIN2A, GRM1, ITPR1, NOS1, PLCB1, PRKCB | ||
| hsa04713 | Circadian entrainment (93) | 9 (CNS) | 1.74E-08 | CACNA1D, CACNA1G, CAMK2A, GRIA1, GRIN1, GRIN2A, GRIN2B, NOS1, NOS1AP |
| 5 (CNS+PT) | 0.0339 | CACNA1C, CAMK2B, ITPR1, PLCB1, PRKCB | ||
| 14 (Com) | 1.98E-08 | CACNA1C, CACNA1D, CACNA1G, CAMK2A, CAMK2B, GRIA1, GRIN1, GRIN2A, GRIN2B, ITPR1, NOS1, NOS1AP, PLCB1, PRKCB | ||
| hsa04925 | Aldosterone synthesis and secretion (93) | 4 (CNS) | 0.005 | ATP2B2, CACNA1D, CACNA1G, CAMK2A |
| 3 (CNS+PT) | 0.0475 | ATP1A3, NR3C2, PRKCB | ||
| 12 (Com) | 9.03E-07 | ATP1A3, ATP2B2, CACNA1C, CACNA1D, CACNA1G, CAMK2A, CAMK2B, DAGLA, ITPR1, NR4A2, PLCB1, PRKCB | ||
| hsa04723 | Retrograde endocannabinoid signalling (148) | 11 (CNS) | 3.77E-09 | CACNA1A, CACNA1B, CACNA1D, GABRA1, GABRA3, GABRA4, GABRA5, GABRB3, GRIA1, GRM1, RIMS1 |
| 6 (CNS+PT) | 0.0382 | CACNA1C, CNR1, DAGLA, ITPR1, PLCB1, PRKCB | ||
| 17 (Com) | 1.58E-08 | CACNA1A, CACNA1B, CACNA1C, CACNA1D, CNR1, DAGLA, GABRA1, GABRA3, GABRA4, GABRA5, GABRB3, GRIA1, GRM1, ITPR1, PLCB1, PRKCB, RIMS1 | ||
| hsa04310 | Wnt signaling pathway (143) | 10 (CNS+PT) | 0.00031 | APC, CAMK2B, CHD8, CREBBP, CSNK1E, GSK3B, PLCB1, PRICKLE1, PRICKLE2, PRKCB |
| 15 (Com) | 0.00017 | ATP1A3, ATP2B2, CACNA1C, CACNA1D, CAMK2A, CAMK2B, CREBBP, GABBR2, GRIA1, GRIN1, GRIN2A, GRIN2B, PDE4A, PDE4B, RAPGEF4 | ||
| hsa04921 | Oxytocin signaling pathway (149) | 7 (CNS+PT) | 0.0179 | CACNA1C, CACNA2D1, CACNB2, CAMK2B, ITPR1, PLCB1, PRKCB |
| 10 (Com) | 0.00098 | CACNA1C, CACNA1D, CACNA2D1, CACNA2D3, CACNB2, CAMK2A, CAMK2B, ITPR1, PLCB1, PRKCB | ||
| hsa04911 | Insulin secretion (84) | 9 (CNS+PT) | 7.16E-05 | TP1A3, CACNA1C, CAMK2B, KCNMA1, PLCB1, PRKCB, RAPGEF4, SNAP25, STX1A |
| 11 (Com) | 2.51E-06 | ATP1A3, CACNA1C, CACNA1D, CAMK2A, CAMK2B, KCNMA1, PLCB1, PRKCB, RAPGEF4, SNAP25, STX1A |
Calcium signalling is a highly integral system in the human body and is increasingly shown to be implicated in ASD [104, 105]. In neurons, the arrival of the electric current induces Ca2+ influx via voltage-gated calcium channels, and this triggers exocytosis and neurotransmitter release [106]. The voltage-gated calcium channels are tetramers containing three auxiliary subunits (β, α2δ, γ) and one pore-forming α1 subunit. Eight calcium channels (CACNA1A, CACNA1B, CACNA1C, CACNA1D, CACNA1G, CACNA2D1, CACNA2D3, CACNB2) are present in our 291 ASD geneset. Experiments using fibroblasts from monogenic [107] and non-syndromic autistic subjects [108] demonstrate aberrant calcium signalling mediated by I3PR. In addition, mutations of calcium channels have been found in ASD, for example, CACNA1A rs7249246/rs12609735 were associated with Chinese Han ASD [109], and CACNA1A mutations in Epileptic Encephalopathy [110, 111], gain of function of CACNA1C in Timothy syndrome with ASD [112] and recurring CNVs of CACNA2D3 [29, 36, 113, 114]. Exome sequencing has identified various mutations of CACNA1D in ASD [14, 16, 29, 36, 115], epilepsy [116] developmental delay [117] endocrine issues [117, 118], CACNA2D1 in epilepsy and intellectual disability [119] and CACNB2 mutations in ASD [120, 121]. CACNA1C (rs1024582) and CACNB2 (rs2799573) polymorphisms were suggested as the common risks across seven brain diseases [122]. Therefore, dysregulated calcium and synaptic signalling could be a commonly perturbed pathway in ASD and frequently occurring comorbidities.
Calcium channels are coupled to neuronal transmission, and E/I imbalance was proposed as a common ASD pathway previously [123]. For example, increased calcium signalling is found in NRXN1α+/− neurons derived from ASD induced pluripotent stem cells with increased expression of voltage-gated calcium channels [124]. In the current study, KEGG pathways show that CACNA1A, CACNA1C, CACNA1D are involved in glutamatergic synapse; CACNA1A, CACNA1B and CACNA1D in cholinergic synapse; and CACNA1A, CACNA1B, CACNA1C and CACNA1D in GABAergic, dopaminergic, and serotonergic synapses. The glutamatergic and GABAergic transmission are the major excitatory and inhibitory pathways in the CNS, which are recurrently featured in “Biological Processes”, “Molecular Functions”, “Cell Components” and KEGG pathways of the 291 ASD candidate genes. Various glutamatergic receptor genes (GRIA1, GRIK2, GRIK5, GRIN1, GRIN2A, GRIN2B, GRM1, GRM5, GRM7), scaffolding components of synapses (SHANK2, SHANK3, DLG4, DLGAP1) and transport of glutamate (SLC1A2) were all involved in ASD and other comorbidities [110, 125–130].
Remarkably, various calcium signalling members are commonly appeared in other pathways that are perturbed in ASD (Fig 5C–5D, Table 5). For example, 11/14 molecules in Circadian entrainment, 10/14 in MAPK signalling, 7/15 in Wnt signalling, 10/10 in Oxytocin signalling, 9/12 in Aldosterone synthesis and secretion, 8/17 in Retrograde endocannabinoid signalling, 6/11 in insulin secretion, were found in calcium signalling pathway, which could be of great interest given their role in the pancreas [131]. In the top KEGG pathways identified from the CNS geneset (CNS), the CNS+PT geneset and combined (Com) 292 ASD candidates, calcium signalling members (bold) appeared in all other KEGG pathways. Therefore, calcium signalling is likely to play a major role not only in ASD but also in ASD comorbidities.
Limitations
Like other meta-analyses, biases and limitations should be considered in pathway analyses. We first assumed that any significant ASD candidate genes shall appear in 4/5 independent datasets. However, some strong candidate genes, such as FMR1 and PTEN, did not appear in the final 291 gene list. While they have much evidence to support their role in ASD, the genes did not overlap due to differences in ranking criteria of different systems. For example, PTEN was in the top ranking in SFARI, Zhang and EXAC, however it was not shortlisted from Duda’s and Krishnan’s score systems. Likewise, FMR1 was ranked top in Duda’s, Zhang’s and SFARI, but did not pass the threshold in EXAC or Krishnan’s dataset. The biological influence of FMR1 and PTEN in ASD is very significant. For example, FMR1 is known to target 126/291 ASD candidates in the current study, and PTEN is a target of another strong ASD candidate, CHD8, on our list.
We also filtered out 200 genes (S26 Table), which were overlapped by four independent scoring systems but not existed in the SFARI database. 66 of them are targets of the FMR1, and 36 are targets of CHD8. Some of them like BCL11B, DPF1, ETV1, NFASC, PAK7, PLXNC1, SCN3A, SLC17A7 and SLITRK1 were also dysregulated in cerebral organoids derived from autistics with large head circumference [50], while others (NEDD4L, RICTOR, SLC8A1, CELF2, MLLT3, PPFIA2, EPHA7, LRRC4C and RORB) were identified from very recent single cell sequencing of autism cortical tissue [68]. This suggests they would still be modulated as downstream targets in some cases of ASD.
In the current study we hypothesized that a strong ASD candidate gene should be highly expressed in the brain and/or relative PT with strong comorbidity. However, this assumption could be potentially challenged by the following scenario. (1) If an ASD gene were development-specific but had low abundance in adult post-mortem tissues, it would be filtered out by GTEx dataset derived from donors of 20–79 age; (2) If a gene were highly expressed in a small subset of specific nuclei of the brain, which might appear not abundant in the total brain RNA; (3) If an ASD gene were modulated by ethnic genetic background, as 85.2% of GTEx donors were Caucasian European subjects, 12.7% were African-American, 1.1% were Asian and 0.3% were American-Indian. As for protein expression, the HPA is an evolving database, and genes with no protein expression data now can be updated in future releases. The same goes for cell types in tissue, which will also be incomplete, given the myriad cell types that are present in all organs. The use of single cell sequencing technology and flow cytometry will be useful in addressing the issue [132, 133].
It is interesting that many of the ASD genes are found to have sex-bias expression and/or splicing, which may be associated with sex-bias diagnosis of ASD [134–136]. We are limited in understanding its biological base by the lack of transcriptomic analysis of ASD genes. Many of the transcriptomic studies have focused on male subjects, or the ratio of female samples are too few to illustrate any sex-specific effects in ASD. It is suggested that future transcriptomic studies should incorporate an even number of male and female subjects in both groups of case and control. Organoid cell lines may also be created from both sexes to make up for this short coming.
It would be desirable if gene expression datasets are available to compare from control and ASD patients at different time points not just in the brain, but also across the entire body. A recent publication [137] has proposed a paediatric cell atlas, which would collate and characterise gene expression at the single cell level across multiple tissues and time points of human development from birth to adulthood. This would be a fantastic initiative if it fully goes ahead, as such a resource would bring great insight into the co-morbidities associated with ASD. Single-cell expression data from cortical tissue of ASD subjects has become available to researchers recently [68], which could be a good starting point to analyse cell-types of interest and explore ASD heterogeneity. The availability of iPSCs from different ASD cases allows to culture and analyse different cell types in both CNS and peripheral organs, which are not easily accessed by conventional methodologies. This can be useful to explore how ASD genes may influence the biological processes during brain development, neuronal function, as well as cells of comorbidity peripheral organs.
Conclusion
By utilizing multiple scoring systems, we have identified recurrent ASD candidate genes, with convergence on multiple pathways and processes involved in ASD (Fig 10). The use of GTEx and HPA data also gives a glimpse into their body-wide expression patterns, which has not been explored previously using ASD gene lists, which we have done so in this study. The bioinformatic analyses of CNS-specific and/or CNS+PT candidate genesets enable us to pinpoint CNS development, E/I balance and calcium signalling as important pathways involved in not just ASD but also brain comorbidity such as epilepsy. The analysis of CNS+PT geneset suggests chromosomal organisation/transcription regulation, calcium-interconnected MARK/WNT and secretion as major pathways with disruptive behaviour, developmental delay as well as congenital abnormalities. Calcium signalling is highly interconnected amongst pathways, which could be informative in exploring complications and co-morbidities associated with ASD where calcium signalling could be involved, especially those subsets of autistic individuals who harbour mutations in these genes that can result in channelopathies.
Fig 10. Working hypothesis of ASD.
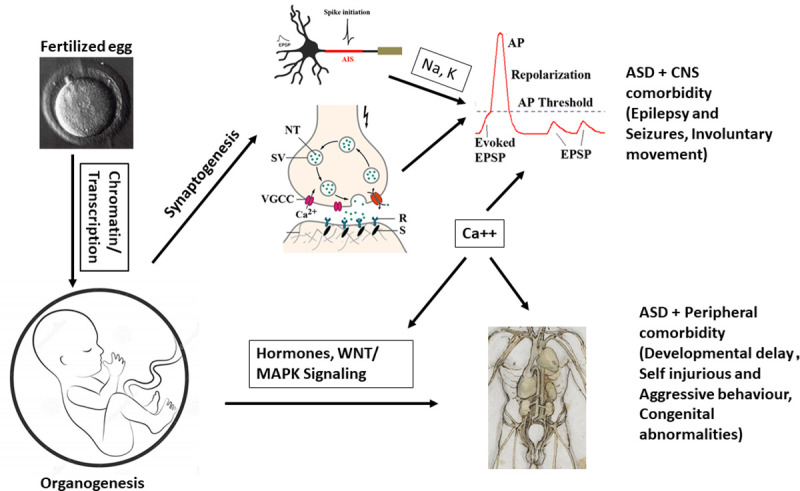
From fertilization to full development, mutations in chromatin modelling and transcription factors can contribute to altered developmental trajectory in brain formation, synaptogenesis, and organogenesis. Alterations in synaptic and ion channel genes may lead to perturbed action potentials and imbalance of E/I synapses that can contribute to the core ASD symptoms and CNS comorbidity such as epilepsy and motor functions. However, alterations in cellular, hormonal signalling and gene regulation can contribute to peripheral co-morbidities such as altered facial phenotypes and behaviour. Calcium signalling appears acting as a hub among the CNS and peripheral pathways.
Supporting information
Yellow nodes highlight ASD genes, green are tissue-specific genes, red edges are interactions between ASD genes and other partners. The graphs are in order of appearance; Adrenal Gland, Adipose subcutaneous, Artery aorta, Artery coronary, Artery tibial, Colon sigmoid, Colon transverse, Esophagus-mucosa, Esophagus-muscularis, Heart-left atrial appendage, Heart-left ventricle, Kidney, Lung, Muscle-skeletal, Pancreas, Pituitary, Small Intestine-terminal ileum, Spleen, Stomach.
(TIF)
Yellow nodes highlight ASD genes, green are tissue-specific genes, red edges are interactions between ASD genes and other partners. The graphs are in order of appearance; Adrenal Gland, Adipose subcutaneous, Artery aorta, Artery coronary, Artery tibial, Colon sigmoid, Colon transverse, Esophagus-mucosa, Esophagus-muscularis, Heart-left atrial appendage, Heart-left ventricle, Kidney, Lung, Muscle-skeletal, Pancreas, Pituitary, Small Intestine-terminal ileum, Spleen, Stomach.
(PNG)
Yellow nodes highlight ASD genes, green are tissue-specific genes, red edges are interactions between ASD genes and other partners. The graphs are in order of appearance; Adrenal Gland, Adipose subcutaneous, Artery aorta, Artery coronary, Artery tibial, Colon sigmoid, Colon transverse, Esophagus-mucosa, Esophagus-muscularis, Heart-left atrial appendage, Heart-left ventricle, Kidney, Lung, Muscle-skeletal, Pancreas, Pituitary, Small Intestine-terminal ileum, Spleen, Stomach.
(TIF)
Yellow nodes highlight ASD genes, green are tissue-specific genes, red edges are interactions between ASD genes and other partners. The graphs are in order of appearance; Adrenal Gland, Adipose subcutaneous, Artery aorta, Artery coronary, Artery tibial, Colon sigmoid, Colon transverse, Esophagus-mucosa, Esophagus-muscularis, Heart-left atrial appendage, Heart-left ventricle, Kidney, Lung, Muscle-skeletal, Pancreas, Pituitary, Small Intestine-terminal ileum, Spleen, Stomach.
(TIF)
(XLSX)
(XLSX)
(XLSX)
(XLSX)
(XLSX)
This can be found in the supporting excel file.
(XLSX)
This can be found in supporting excel file.
(XLSX)
(XLSX)
(XLSX)
(XLSX)
(XLSX)
(XLSX)
(XLSX)
(XLSX)
(XLSX)
(XLSX)
(XLSX)
(XLSX)
(XLSX)
(XLSX)
(XLSX)
(XLSX)
This can be found in supporting excel file.
(XLSX)
(XLSX)
These are found in the supporting excel file.
(XLSX)
This is found in the supporting excel file.
(XLSX)
(ZIP)
(R)
(R)
Acknowledgments
The Authors wish to thank all those who contributed to this manuscript.
Abbreviations
- A1C
Primary auditory cortex
- AMY
Amygdaloid complex
- Ary
Arrythmia
- ASD
Autism Spectrum Disorder
- BP
Bipolar Disorder
- CBC
Cerebellar cortex
- CNS
Central Nervous System
- DAMAGES
Disease-Associated Mutation Analysis Using Gene Expression Signatures
- DFC
Dorsolateral prefrontal cortex
- DNA
Deoxyribonucleic Acid
- EXAC
Exome Aggregation Consortium
- GABA
Gamma-Aminobutyric Acid
- GTEx
Genotype-Tissue Expression
- HIP
Hippocampus
- HPA
Human Protein Atlas
- Huri
Human Reference Interactome
- IBD
Inflammatory bowel disease
- IPC
Posterior inferior parietal cortex
- iPSC
Induced Pluripotent Stem Cell
- ITC
Inferolateral temporal cortex
- M1C
Primary motor cortex
- MAPK
Mitogen Activated Protein Kinase
- MD
Mediodorsal nucleus of thalamus
- MDD
Major Depressive Disorder
- MFC
Medial prefrontal cortex
- OFC
Orbital frontal cortex
- ORA
Overrepresentation Analysis
- PT
Peripheral Tissue
- S1C
Primary somatosensory cortex
- SFARI
Simons Foundation for Autism Research Initiative
- STC
Posterior(caudal) superior temporal cortex
- STR
Striatum
- T1D
Type 1 diabetes
- T2D
Type 2 diabetes. SCZ–Schizophrenia
- V1C
Primary visual cortex
- VFC
Ventrolateral prefrontal cortex
Data Availability
All data used in this paper are publicly available. The file for median GTEx expression data can be found here (https://gtexportal.org/home/datasets). The data from HPA can be accessed via Bioconductor in R, using the code provided in the supplementary information. The networks from Huri can be accessed from NDEX (http://www.ndexbio.org/#/user/69e7b21d-8981-11ea-aaef-0ac135e8bacf) Information from the scoring systems used can be found in the supplementary information sections of their respective publications. Differentially Expressed genes can be found in supporting information from respective publications and in Geo2r (GSE42133 for Pramparo, GSE28521 for Voineagu). Code is provided for data access to HPA and GeneOverlap and generating figures. Genelists were obtained from pysgenet(http://www.psygenet.org/web/PsyGeNET/menu), Harmonizome(https://maayanlab.cloud/Harmonizome/dataset/GWASdb+SNP-Disease+Associations) and the supplementary information from respective publications.
Funding Statement
Funding was provided by Science Foundation Ireland (Grant 13/IA/1787 to S.S. and L.G., 16/RC/3948 to FutureNeuro), and National University of Ireland Galway (Grant RSU002 to S.S.) for funding the research.
References
- 1.American Psychiatric Association (2013) Diagnostic and Statistical Manual of Mental Disorders 5th ed American Psychiatric Association; 10.1176/appi.books.9780890425596 [DOI] [Google Scholar]
- 2.Mannion A, Leader G (2014) Sleep problems in autism spectrum disorder: A literature review. Review Journal of Autism and Developmental Disorders 1: 101–109. 10.1007/s40489-013-0009-y [DOI] [Google Scholar]
- 3.Cervantes PE, Matson JL (2015) Comorbid Symptomology in Adults with Autism Spectrum Disorder and Intellectual Disability. J Autism Dev Disord 45: 3961–3970. 10.1007/s10803-015-2553-z [DOI] [PubMed] [Google Scholar]
- 4.Köse S, Yılmaz H, Ocakoğlu FT, Özbaran NB (2017) Sleep problems in children with autism spectrum disorder and intellectual disability without autism spectrum disorder. Sleep Med 40: 69–77. 10.1016/j.sleep.2017.09.021 [DOI] [PubMed] [Google Scholar]
- 5.Onore C, Careaga M, Ashwood P (2012) The role of immune dysfunction in the pathophysiology of autism. Brain Behav Immun 26: 383–392. 10.1016/j.bbi.2011.08.007 [DOI] [PMC free article] [PubMed] [Google Scholar]
- 6.Jolanta Wasilewska J, Klukowski M (2015) Gastrointestinal symptoms and autism spectrum disorder: links and risks–a possible new overlap syndrome. Pediatric Health, Medicine and Therapeutics: 153 10.2147/PHMT.S85717 [DOI] [PMC free article] [PubMed] [Google Scholar]
- 7.Shedlock K, Susi A, Gorman GH, Hisle-Gorman E, Erdie-Lalena CR, et al. (2016) Autism spectrum disorders and metabolic complications of obesity. J Pediatr 178: 183–187.e1. 10.1016/j.jpeds.2016.07.055 [DOI] [PubMed] [Google Scholar]
- 8.Kohane IS, McMurry A, Weber G, MacFadden D, Rappaport L, et al. (2012) The co-morbidity burden of children and young adults with autism spectrum disorders. PLoS ONE 7: e33224 10.1371/journal.pone.0033224 [DOI] [PMC free article] [PubMed] [Google Scholar]
- 9.Masi A, DeMayo MM, Glozier N, Guastella AJ (2017) An overview of autism spectrum disorder, heterogeneity and treatment options. Neurosci Bull 33: 183–193. 10.1007/s12264-017-0100-y [DOI] [PMC free article] [PubMed] [Google Scholar]
- 10.Krumm N, O’Roak BJ, Shendure J, Eichler EE(2014) A de novo convergence of autism genetics and molecular neuroscience. Trends Neurosci 37: 95–105. 10.1016/j.tins.2013.11.005 [DOI] [PMC free article] [PubMed] [Google Scholar]
- 11.Neale BM, Kou Y, Liu L, Ma’ayan A, Samocha KE, et al. (2012) Patterns and rates of exonic de novo mutations in autism spectrum disorders. Nature 485: 242–245. 10.1038/nature11011 [DOI] [PMC free article] [PubMed] [Google Scholar]
- 12.O’Roak BJ, Deriziotis P, Lee C, Vives L, Schwartz JJ, et al. (2011) Exome sequencing in sporadic autism spectrum disorders identifies severe de novo mutations. Nat Genet 43: 585–589. 10.1038/ng.835 [DOI] [PMC free article] [PubMed] [Google Scholar]
- 13.Dong S, Walker MF, Carriero NJ, DiCola M, Willsey AJ, et al. (2014) De novo insertions and deletions of predominantly paternal origin are associated with autism spectrum disorder. Cell Rep 9: 16–23. 10.1016/j.celrep.2014.08.068 [DOI] [PMC free article] [PubMed] [Google Scholar]
- 14.O’Roak BJ, Vives L, Girirajan S, Karakoc E, Krumm N, et al. (2012) Sporadic autism exomes reveal a highly interconnected protein network of de novo mutations. Nature 485: 246–250. 10.1038/nature10989 [DOI] [PMC free article] [PubMed] [Google Scholar]
- 15.Sanders SJ, Ercan-Sencicek AG, Hus V, Luo R, Murtha MT, et al. (2011) Multiple recurrent de novo CNVs, including duplications of the 7q11.23 Williams syndrome region, are strongly associated with autism. Neuron 70: 863–885. 10.1016/j.neuron.2011.05.002 [DOI] [PMC free article] [PubMed] [Google Scholar]
- 16.O’Roak BJ, Vives L, Fu W, Egertson JD, Stanaway IB, et al. (2012) Multiplex targeted sequencing identifies recurrently mutated genes in autism spectrum disorders. Science 338: 1619–1622. 10.1126/science.1227764 [DOI] [PMC free article] [PubMed] [Google Scholar]
- 17.Iossifov I, O’Roak BJ, Sanders SJ, Ronemus M, Krumm N, et al. (2014) The contribution of de novo coding mutations to autism spectrum disorder. Nature 515: 216–221. 10.1038/nature13908 [DOI] [PMC free article] [PubMed] [Google Scholar]
- 18.Lim ET, Uddin M, De Rubeis S, Chan Y, Kamumbu AS, et al. (2017) Rates, distribution and implications of postzygotic mosaic mutations in autism spectrum disorder. Nat Neurosci 20: 1217–1224. 10.1038/nn.4598 [DOI] [PMC free article] [PubMed] [Google Scholar]
- 19.Sebat J, Lakshmi B, Malhotra D, Troge J, Lese-Martin C, et al. (2007) Strong association of de novo copy number mutations with autism. Science 316: 445–449. 10.1126/science.1138659 [DOI] [PMC free article] [PubMed] [Google Scholar]
- 20.Pinto D, Pagnamenta AT, Klei L, Anney R, Merico D, et al. (2010) Functional impact of global rare copy number variation in autism spectrum disorders. Nature 466: 368–372. 10.1038/nature09146 [DOI] [PMC free article] [PubMed] [Google Scholar]
- 21.Levy D, Ronemus M, Yamrom B, Lee Y, Leotta A, et al. (2011) Rare de novo and transmitted copy-number variation in autistic spectrum disorders. Neuron 70: 886–897. 10.1016/j.neuron.2011.05.015 [DOI] [PubMed] [Google Scholar]
- 22.Glessner JT, Wang K, Cai G, Korvatska O, Kim CE, et al. (2009) Autism genome-wide copy number variation reveals ubiquitin and neuronal genes. Nature 459: 569–573. 10.1038/nature07953 [DOI] [PMC free article] [PubMed] [Google Scholar]
- 23.Bucan M, Abrahams BS, Wang K, Glessner JT, Herman EI, et al. (2009) Genome-wide analyses of exonic copy number variants in a family-based study point to novel autism susceptibility genes. PLoS Genet 5: e1000536 10.1371/journal.pgen.1000536 [DOI] [PMC free article] [PubMed] [Google Scholar]
- 24.Anney R, Klei L, Pinto D, Regan R, Conroy J, et al. (2010) A genome-wide scan for common alleles affecting risk for autism. Hum Mol Genet 19: 4072–4082. 10.1093/hmg/ddq307 [DOI] [PMC free article] [PubMed] [Google Scholar]
- 25.Krumm N, O’Roak BJ, Karakoc E, Mohajeri K, Nelson B, et al. (2013) Transmission disequilibrium of small CNVs in simplex autism. Am J Hum Genet 93: 595–606. 10.1016/j.ajhg.2013.07.024 [DOI] [PMC free article] [PubMed] [Google Scholar]
- 26.Quesnel-Vallières M, Weatheritt RJ, Cordes SP, Blencowe BJ (2019) Autism spectrum disorder: insights into convergent mechanisms from transcriptomics. Nat Rev Genet 20: 51–63. 10.1038/s41576-018-0066-2 [DOI] [PubMed] [Google Scholar]
- 27.Al-Jawahiri R, Milne E (2017) Resources available for autism research in the big data era: a systematic review. PeerJ 5: e2880 10.7717/peerj.2880 [DOI] [PMC free article] [PubMed] [Google Scholar]
- 28.Abrahams BS, Arking DE, Campbell DB, Mefford HC, Morrow EM, et al. (2013) SFARI Gene 2.0: a community-driven knowledgebase for the autism spectrum disorders (ASDs). Mol Autism 4: 36 10.1186/2040-2392-4-36 [DOI] [PMC free article] [PubMed] [Google Scholar]
- 29.De Rubeis S, He X, Goldberg AP, Poultney CS, Samocha K, et al. (2014) Synaptic, transcriptional and chromatin genes disrupted in autism. Nature 515: 209–215. 10.1038/nature13772 [DOI] [PMC free article] [PubMed] [Google Scholar]
- 30.Wen Y, Alshikho MJ, Herbert MR (2016) Pathway Network Analyses for Autism Reveal Multisystem Involvement, Major Overlaps with Other Diseases and Convergence upon MAPK and Calcium Signaling. PLoS ONE 11: e0153329 10.1371/journal.pone.0153329 [DOI] [PMC free article] [PubMed] [Google Scholar]
- 31.Lek M, Karczewski KJ, Minikel EV, Samocha KE, Banks E, et al. (2016) Analysis of protein-coding genetic variation in 60,706 humans. Nature 536: 285–291. 10.1038/nature19057 [DOI] [PMC free article] [PubMed] [Google Scholar]
- 32.Krishnan A, Zhang R, Yao V, Theesfeld CL, Wong AK, et al. (2016) Genome-wide prediction and functional characterization of the genetic basis of autism spectrum disorder. Nat Neurosci 19: 1454–1462. 10.1038/nn.4353 [DOI] [PMC free article] [PubMed] [Google Scholar]
- 33.Zhang C, Shen Y (2017) A Cell Type-Specific Expression Signature Predicts Haploinsufficient Autism-Susceptibility Genes. Hum Mutat 38: 204–215. 10.1002/humu.23147 [DOI] [PMC free article] [PubMed] [Google Scholar]
- 34.Duda M, Zhang H, Li H-D, Wall DP, Burmeister M, et al. (2018) Brain-specific functional relationship networks inform autism spectrum disorder gene prediction. Translational psychiatry 8: 56 10.1038/s41398-018-0098-6 [DOI] [PMC free article] [PubMed] [Google Scholar]
- 35.Luck K, Kim D-K, Lambourne L, Spirohn K, Begg BE, et al. (2020) A reference map of the human binary protein interactome. Nature 580: 402–408. 10.1038/s41586-020-2188-x [DOI] [PMC free article] [PubMed] [Google Scholar]
- 36.Iossifov I, Ronemus M, Levy D, Wang Z, Hakker I, et al. (2012) De novo gene disruptions in children on the autistic spectrum. Neuron 74: 285–299. 10.1016/j.neuron.2012.04.009 [DOI] [PMC free article] [PubMed] [Google Scholar]
- 37.Sanders SJ, Murtha MT, Gupta AR, Murdoch JD, Raubeson MJ, et al. (2012) De novo mutations revealed by whole-exome sequencing are strongly associated with autism. Nature 485: 237–241. 10.1038/nature10945 [DOI] [PMC free article] [PubMed] [Google Scholar]
- 38.Bardou P, Mariette J, Escudié F, Djemiel C, Klopp C (2014) jvenn: an interactive Venn diagram viewer. BMC Bioinformatics 15: 293 10.1186/1471-2105-15-293 [DOI] [PMC free article] [PubMed] [Google Scholar]
- 39.GTEx Consortium (2015) Human genomics. The Genotype-Tissue Expression (GTEx) pilot analysis: multitissue gene regulation in humans. Science 348: 648–660. 10.1126/science.1262110 [DOI] [PMC free article] [PubMed] [Google Scholar]
- 40.Tran AN, Dussaq AM, Kennell T, Willey CD, Hjelmeland AB (2019) HPAanalyze: an R package that facilitates the retrieval and analysis of the Human Protein Atlas data. BMC Bioinformatics 20: 463 10.1186/s12859-019-3059-z [DOI] [PMC free article] [PubMed] [Google Scholar]
- 41.Wickham H (2016) ggplot2 - Elegant Graphics for Data Analysis 2nd ed Cham: Springer International Publishing; 10.1007/978-3-319-24277-4 [DOI] [Google Scholar]
- 42.Shannon P, Markiel A, Ozier O, Baliga NS, Wang JT, et al. (2003) Cytoscape: a software environment for integrated models of biomolecular interaction networks. Genome Res 13: 2498–2504. 10.1101/gr.1239303 [DOI] [PMC free article] [PubMed] [Google Scholar]
- 43.Liao Y, Wang J, Jaehnig EJ, Shi Z, Zhang B (2019) WebGestalt 2019: gene set analysis toolkit with revamped UIs and APIs. Nucleic Acids Res 47: W199–W205. 10.1093/nar/gkz401 [DOI] [PMC free article] [PubMed] [Google Scholar]
- 44.Köhler S, Carmody L, Vasilevsky N, Jacobsen JOB, Danis D, et al. (2019) Expansion of the Human Phenotype Ontology (HPO) knowledge base and resources. Nucleic Acids Res 47: D1018–D1027. 10.1093/nar/gky1105 [DOI] [PMC free article] [PubMed] [Google Scholar]
- 45.Garbett K, Ebert PJ, Mitchell A, Lintas C, Manzi B, et al. (2008) Immune transcriptome alterations in the temporal cortex of subjects with autism. Neurobiol Dis 30: 303–311. 10.1016/j.nbd.2008.01.012 [DOI] [PMC free article] [PubMed] [Google Scholar]
- 46.Walker SJ, Beavers DP, Fortunato J, Krigsman A (2016) A Putative Blood-Based Biomarker for Autism Spectrum Disorder-Associated Ileocolitis. Sci Rep 6: 35820 10.1038/srep35820 [DOI] [PMC free article] [PubMed] [Google Scholar]
- 47.Pramparo T, Lombardo MV, Campbell K, Barnes CC, Marinero S, et al. (2015) Cell cycle networks link gene expression dysregulation, mutation, and brain maldevelopment in autistic toddlers. Mol Syst Biol 11: 841 10.15252/msb.20156108 [DOI] [PMC free article] [PubMed] [Google Scholar]
- 48.Chien W-H, Gau SS-F, Chen C-H, Tsai W-C, Wu Y-Y, et al. (2013) Increased gene expression of FOXP1 in patients with autism spectrum disorders. Mol Autism 4: 23 10.1186/2040-2392-4-23 [DOI] [PMC free article] [PubMed] [Google Scholar]
- 49.Walker SJ, Fortunato J, Gonzalez LG, Krigsman A (2013) Identification of unique gene expression profile in children with regressive autism spectrum disorder (ASD) and ileocolitis. PLoS ONE 8: e58058 10.1371/journal.pone.0058058 [DOI] [PMC free article] [PubMed] [Google Scholar]
- 50.Mariani J, Coppola G, Zhang P, Abyzov A, Provini L, et al. (2015) FOXG1-Dependent Dysregulation of GABA/Glutamate Neuron Differentiation in Autism Spectrum Disorders. Cell 162: 375–390. 10.1016/j.cell.2015.06.034 [DOI] [PMC free article] [PubMed] [Google Scholar]
- 51.Wang P, Lin M, Pedrosa E, Hrabovsky A, Zhang Z, et al. (2015) CRISPR/Cas9-mediated heterozygous knockout of the autism gene CHD8 and characterization of its transcriptional networks in neurodevelopment. Mol Autism 6: 55 10.1186/s13229-015-0048-6 [DOI] [PMC free article] [PubMed] [Google Scholar]
- 52.Wang P, Mokhtari R, Pedrosa E, Kirschenbaum M, Bayrak C, et al. (2017) CRISPR/Cas9-mediated heterozygous knockout of the autism gene CHD8 and characterization of its transcriptional networks in cerebral organoids derived from iPS cells. Mol Autism 8: 11 10.1186/s13229-017-0124-1 [DOI] [PMC free article] [PubMed] [Google Scholar]
- 53.DeRosa BA, El Hokayem J, Artimovich E, Garcia-Serje C, Phillips AW, et al. (2018) Convergent Pathways in Idiopathic Autism Revealed by Time Course Transcriptomic Analysis of Patient-Derived Neurons. Sci Rep 8: 8423 10.1038/s41598-018-26495-1 [DOI] [PMC free article] [PubMed] [Google Scholar]
- 54.Griesi-Oliveira K, Fogo MS, Pinto BGG, Alves AY, Suzuki AM, et al. (2020) Transcriptome of iPSC-derived neuronal cells reveals a module of co-expressed genes consistently associated with autism spectrum disorder. Mol Psychiatry. 10.1038/s41380-020-0669-9 [DOI] [PMC free article] [PubMed] [Google Scholar]
- 55.Breen MS, Browne A, Hoffman GE, Stathopoulos S, Brennand K, et al. (2020) Transcriptional signatures of participant-derived neural progenitor cells and neurons implicate altered Wnt signaling in Phelan-McDermid syndrome and autism. Mol Autism 11: 53 10.1186/s13229-020-00355-0 [DOI] [PMC free article] [PubMed] [Google Scholar]
- 56.Voineagu I, Wang X, Johnston P, Lowe JK, Tian Y, et al. (2011) Transcriptomic analysis of autistic brain reveals convergent molecular pathology. Nature 474: 380–384. 10.1038/nature10110 [DOI] [PMC free article] [PubMed] [Google Scholar]
- 57.Barrett T, Wilhite SE, Ledoux P, Evangelista C, Kim IF, et al. (2013) NCBI GEO: archive for functional genomics data sets—update. Nucleic Acids Res 41: D991–5. 10.1093/nar/gks1193 [DOI] [PMC free article] [PubMed] [Google Scholar]
- 58.Xu X, Wells AB, O’Brien DR, Nehorai A, Dougherty JD (2014) Cell type-specific expression analysis to identify putative cellular mechanisms for neurogenetic disorders. J Neurosci 34: 1420–1431. 10.1523/JNEUROSCI.4488-13.2014 [DOI] [PMC free article] [PubMed] [Google Scholar]
- 59.Shi L, Zhang Z, Su B (2016) Sex biased gene expression profiling of human brains at major developmental stages. Sci Rep 6: 21181 10.1038/srep21181 [DOI] [PMC free article] [PubMed] [Google Scholar]
- 60.Trabzuni D, Ramasamy A, Imran S, Walker R, Smith C, et al. (2013) Widespread sex differences in gene expression and splicing in the adult human brain. Nat Commun 4: 2771 10.1038/ncomms3771 [DOI] [PMC free article] [PubMed] [Google Scholar]
- 61.GitHub—shenlab-sinai/GeneOverlap: R package for testing and visualizing gene list overlaps (n.d.). Available: https://github.com/shenlab-sinai/geneoverlap. Accessed 16 October 2020.
- 62.Gutiérrez-Sacristán A, Grosdidier S, Valverde O, Torrens M, Bravo À, et al. (2015) PsyGeNET: a knowledge platform on psychiatric disorders and their genes. Bioinformatics 31: 3075–3077. 10.1093/bioinformatics/btv301 [DOI] [PMC free article] [PubMed] [Google Scholar]
- 63.Rouillard AD, Gundersen GW, Fernandez NF, Wang Z, Monteiro CD, et al. (2016) The harmonizome: a collection of processed datasets gathered to serve and mine knowledge about genes and proteins. Database (Oxford) 2016. 10.1093/database/baw100 [DOI] [PMC free article] [PubMed] [Google Scholar]
- 64.Li MJ, Liu Z, Wang P, Wong MP, Nelson MR, et al. (2016) GWASdb v2: an update database for human genetic variants identified by genome-wide association studies. Nucleic Acids Res 44: D869–76. 10.1093/nar/gkv1317 [DOI] [PMC free article] [PubMed] [Google Scholar]
- 65.Snel B, Lehmann G, Bork P, Huynen MA (2000) STRING: a web-server to retrieve and display the repeatedly occurring neighbourhood of a gene. Nucleic Acids Res 28: 3442–3444. 10.1093/nar/28.18.3442 [DOI] [PMC free article] [PubMed] [Google Scholar]
- 66.Gupta S, Ellis SE, Ashar FN, Moes A, Bader JS, et al. (2014) Transcriptome analysis reveals dysregulation of innate immune response genes and neuronal activity-dependent genes in autism. Nat Commun 5: 5748 10.1038/ncomms6748 [DOI] [PMC free article] [PubMed] [Google Scholar]
- 67.Parikshak NN, Luo R, Zhang A, Won H, Lowe JK, et al. (2013) Integrative functional genomic analyses implicate specific molecular pathways and circuits in autism. Cell 155: 1008–1021. 10.1016/j.cell.2013.10.031 [DOI] [PMC free article] [PubMed] [Google Scholar]
- 68.Velmeshev D, Schirmer L, Jung D, Haeussler M, Perez Y, et al. (2019) Single-cell genomics identifies cell type-specific molecular changes in autism. Science 364: 685–689. 10.1126/science.aav8130 [DOI] [PMC free article] [PubMed] [Google Scholar]
- 69.Herrero MJ, Velmeshev D, Hernandez-Pineda D, Sethi S, Sorrells S, et al. (2020) Identification of amygdala-expressed genes associated with autism spectrum disorder. Mol Autism 11: 39 10.1186/s13229-020-00346-1 [DOI] [PMC free article] [PubMed] [Google Scholar]
- 70.Ginsberg MR, Rubin RA, Falcone T, Ting AH, Natowicz MR (2012) Brain transcriptional and epigenetic associations with autism. PLoS ONE 7: e44736 10.1371/journal.pone.0044736 [DOI] [PMC free article] [PubMed] [Google Scholar]
- 71.GTEx Consortium (2013) The Genotype-Tissue Expression (GTEx) project. Nat Genet 45: 580–585. 10.1038/ng.2653 [DOI] [PMC free article] [PubMed] [Google Scholar]
- 72.Gao R, Penzes P (2015) Common mechanisms of excitatory and inhibitory imbalance in schizophrenia and autism spectrum disorders. Curr Mol Med 15: 146–167. 10.2174/1566524015666150303003028 [DOI] [PMC free article] [PubMed] [Google Scholar]
- 73.Cotney J, Muhle RA, Sanders SJ, Liu L, Willsey AJ, et al. (2015) The autism-associated chromatin modifier CHD8 regulates other autism risk genes during human neurodevelopment. Nat Commun 6: 6404 10.1038/ncomms7404 [DOI] [PMC free article] [PubMed] [Google Scholar]
- 74.Bernier R, Golzio C, Xiong B, Stessman HA, Coe BP, et al. (2014) Disruptive CHD8 mutations define a subtype of autism early in development. Cell 158: 263–276. 10.1016/j.cell.2014.06.017 [DOI] [PMC free article] [PubMed] [Google Scholar]
- 75.Van Bon BWM, Coe BP, Bernier R, Green C, Gerdts J, et al. (2016) Disruptive de novo mutations of DYRK1A lead to a syndromic form of autism and ID. Mol Psychiatry 21: 126–132. 10.1038/mp.2015.5 [DOI] [PMC free article] [PubMed] [Google Scholar]
- 76.Stessman HAF, Willemsen MH, Fenckova M, Penn O, Hoischen A, et al. (2016) Disruption of POGZ Is Associated with Intellectual Disability and Autism Spectrum Disorders. Am J Hum Genet 98: 541–552. 10.1016/j.ajhg.2016.02.004 [DOI] [PMC free article] [PubMed] [Google Scholar]
- 77.Tripi G, Roux S, Matranga D, Maniscalco L, Glorioso P, et al. (2019) Cranio-Facial Characteristics in Children with Autism Spectrum Disorders (ASD). J Clin Med 8 10.3390/jcm8050641 [DOI] [PMC free article] [PubMed] [Google Scholar]
- 78.Aldridge K, George ID, Cole KK, Austin JR, Takahashi TN, et al. (2011) Facial phenotypes in subgroups of prepubertal boys with autism spectrum disorders are correlated with clinical phenotypes. Mol Autism 2: 15 10.1186/2040-2392-2-15 [DOI] [PMC free article] [PubMed] [Google Scholar]
- 79.Tan DW, Gilani SZ, Maybery MT, Mian A, Hunt A, et al. (2017) Hypermasculinised facial morphology in boys and girls with Autism Spectrum Disorder and its association with symptomatology. Sci Rep 7: 9348 10.1038/s41598-017-09939-y [DOI] [PMC free article] [PubMed] [Google Scholar]
- 80.Jin SC, Homsy J, Zaidi S, Lu Q, Morton S, et al. (2017) Contribution of rare inherited and de novo variants in 2,871 congenital heart disease probands. Nat Genet 49: 1593–1601. 10.1038/ng.3970 [DOI] [PMC free article] [PubMed] [Google Scholar]
- 81.Homsy J, Zaidi S, Shen Y, Ware JS, Samocha KE, et al. (2015) De novo mutations in congenital heart disease with neurodevelopmental and other congenital anomalies. Science 350: 1262–1266. 10.1126/science.aac9396 [DOI] [PMC free article] [PubMed] [Google Scholar]
- 82.Bean Jaworski JL, Flynn T, Burnham N, Chittams JL, Sammarco T, et al. (2017) Rates of autism and potential risk factors in children with congenital heart defects. Congenit Heart Dis 12: 421–429. 10.1111/chd.12461 [DOI] [PMC free article] [PubMed] [Google Scholar]
- 83.Gunther M, Laithier M, Brison O (2000) A set of proteins interacting with transcription factor Sp1 identified in a two-hybrid screening. Mol Cell Biochem 210: 131–142. 10.1023/a:1007177623283 [DOI] [PubMed] [Google Scholar]
- 84.Zhang A, Li C-W, Chen JD (2007) Characterization of transcriptional regulatory domains of ankyrin repeat cofactor-1. Biochem Biophys Res Commun 358: 1034–1040. 10.1016/j.bbrc.2007.05.017 [DOI] [PMC free article] [PubMed] [Google Scholar]
- 85.Sirmaci A, Spiliopoulos M, Brancati F, Powell E, Duman D, et al. (2011) Mutations in ANKRD11 cause KBG syndrome, characterized by intellectual disability, skeletal malformations, and macrodontia. Am J Hum Genet 89: 289–294. 10.1016/j.ajhg.2011.06.007 [DOI] [PMC free article] [PubMed] [Google Scholar]
- 86.Ellenbroek B, Sengul H (2017) Autism spectrum disorders: Autonomic alterations with a special focus on the heart. Heart and Mind 1: 78 10.4103/hm.hm_5_17 [DOI] [Google Scholar]
- 87.Rao M, Gershon MD (2016) The bowel and beyond: the enteric nervous system in neurological disorders. Nat Rev Gastroenterol Hepatol 13: 517–528. 10.1038/nrgastro.2016.107 [DOI] [PMC free article] [PubMed] [Google Scholar]
- 88.Thapa R, Alvares GA, Zaidi TA, Thomas EE, Hickie IB, et al. (2019) Reduced heart rate variability in adults with autism spectrum disorder. Autism Res 12: 922–930. 10.1002/aur.2104 [DOI] [PubMed] [Google Scholar]
- 89.Panju S, Brian J, Dupuis A, Anagnostou E, Kushki A (2015) Atypical sympathetic arousal in children with autism spectrum disorder and its association with anxiety symptomatology. Mol Autism 6: 64 10.1186/s13229-015-0057-5 [DOI] [PMC free article] [PubMed] [Google Scholar]
- 90.Cohen S, Masyn K, Mastergeorge A, Hessl D (2015) Psychophysiological responses to emotional stimuli in children and adolescents with autism and fragile X syndrome. J Clin Child Adolesc Psychol 44: 250–263. 10.1080/15374416.2013.843462 [DOI] [PMC free article] [PubMed] [Google Scholar]
- 91.Sheinkopf SJ, Levine TP, McCormick CEB, Puggioni G, Conradt E, et al. (2019) Developmental trajectories of autonomic functioning in autism from birth to early childhood. Biol Psychol 142: 13–18. 10.1016/j.biopsycho.2019.01.003 [DOI] [PMC free article] [PubMed] [Google Scholar]
- 92.Fröhlich H, Kollmeyer ML, Linz VC, Stuhlinger M, Groneberg D, et al. (2019) Gastrointestinal dysfunction in autism displayed by altered motility and achalasia in Foxp1+/- mice. Proc Natl Acad Sci U S A 116: 22237–22245. 10.1073/pnas.1911429116 [DOI] [PMC free article] [PubMed] [Google Scholar]
- 93.Lutz A-K, Pfaender S, Incearap B, Ioannidis V, Ottonelli I, et al. (2020) Autism-associated SHANK3 mutations impair maturation of neuromuscular junctions and striated muscles. Sci Transl Med 12 10.1126/scitranslmed.aaz3267 [DOI] [PubMed] [Google Scholar]
- 94.Sauer AK, Bockmann J, Steinestel K, Boeckers TM, Grabrucker AM (2019) Altered intestinal morphology and microbiota composition in the autism spectrum disorders associated SHANK3 mouse model. Int J Mol Sci 20 10.3390/ijms20092134 [DOI] [PMC free article] [PubMed] [Google Scholar]
- 95.Niesler B, Rappold GA (2020) Emerging evidence for gene mutations driving both brain and gut dysfunction in autism spectrum disorder. Mol Psychiatry. 10.1038/s41380-020-0778-5 [DOI] [PMC free article] [PubMed] [Google Scholar]
- 96.James DM, Kozol RA, Kajiwara Y, Wahl AL, Storrs EC, et al. (2019) Intestinal dysmotility in a zebrafish (Danio rerio) shank3a;shank3b mutant model of autism. Mol Autism 10: 3 10.1186/s13229-018-0250-4 [DOI] [PMC free article] [PubMed] [Google Scholar]
- 97.Shteyer E, Edvardson S, Wynia-Smith SL, Pierri CL, Zangen T, et al. (2015) Truncating mutation in the nitric oxide synthase 1 gene is associated with infantile achalasia. Gastroenterology 148: 533–536.e4. 10.1053/j.gastro.2014.11.044 [DOI] [PubMed] [Google Scholar]
- 98.Milovanovic B, Filipovic B, Mutavdzin S, Zdravkovic M, Gligorijevic T, et al. (2015) Cardiac autonomic dysfunction in patients with gastroesophageal reflux disease. World J Gastroenterol 21: 6982–6989. 10.3748/wjg.v21.i22.6982 [DOI] [PMC free article] [PubMed] [Google Scholar]
- 99.Djeddi D-D, Kongolo G, Stéphan-Blanchard E, Ammari M, Léké A, et al. (2013) Involvement of autonomic nervous activity changes in gastroesophageal reflux in neonates during sleep and wakefulness. PLoS ONE 8: e83464 10.1371/journal.pone.0083464 [DOI] [PMC free article] [PubMed] [Google Scholar]
- 100.Fujiwara T, Kofuji T, Akagawa K (2011) Dysfunction of the hypothalamic-pituitary-adrenal axis in STX1A knockout mice. J Neuroendocrinol 23: 1222–1230. 10.1111/j.1365-2826.2011.02214.x [DOI] [PubMed] [Google Scholar]
- 101.Spaeth JM, Hunter CS, Bonatakis L, Guo M, French CA, et al. (2015) The FOXP1, FOXP2 and FOXP4 transcription factors are required for islet alpha cell proliferation and function in mice. Diabetologia 58: 1836–1844. 10.1007/s00125-015-3635-3 [DOI] [PMC free article] [PubMed] [Google Scholar]
- 102.Daraio T, Bombek LK, Gosak M, Valladolid-Acebes I, Klemen MS, et al. (2017) SNAP-25b-deficiency increases insulin secretion and changes spatiotemporal profile of Ca2+oscillations in β cell networks. Sci Rep 7: 7744 10.1038/s41598-017-08082-y [DOI] [PMC free article] [PubMed] [Google Scholar]
- 103.Rorsman P, Braun M (2013) Regulation of insulin secretion in human pancreatic islets. Annu Rev Physiol 75: 155–179. 10.1146/annurev-physiol-030212-183754 [DOI] [PubMed] [Google Scholar]
- 104.Nguyen RL, Medvedeva YV, Ayyagari TE, Schmunk G, Gargus JJ (2018) Intracellular calcium dysregulation in autism spectrum disorder: An analysis of converging organelle signaling pathways. Biochimica et Biophysica Acta (BBA)—Molecular Cell Research 1865: 1718–1732. 10.1016/j.bbamcr.2018.08.003 [DOI] [PubMed] [Google Scholar]
- 105.Lu AT-H, Dai X, Martinez-Agosto JA, Cantor RM (2012) Support for calcium channel gene defects in autism spectrum disorders. Mol Autism 3: 18 10.1186/2040-2392-3-18 [DOI] [PMC free article] [PubMed] [Google Scholar]
- 106.Tong X-J, López-Soto EJ, Li L, Liu H, Nedelcu D, et al. (2017) Retrograde Synaptic Inhibition Is Mediated by α-Neurexin Binding to the α2δ Subunits of N-Type Calcium Channels. Neuron 95: 326–340.e5. 10.1016/j.neuron.2017.06.018 [DOI] [PMC free article] [PubMed] [Google Scholar]
- 107.Schmunk G, Boubion BJ, Smith IF, Parker I, Gargus JJ (2015) Shared functional defect in IP₃R-mediated calcium signaling in diverse monogenic autism syndromes. Translational psychiatry 5: e643 10.1038/tp.2015.123 [DOI] [PMC free article] [PubMed] [Google Scholar]
- 108.Schmunk G, Nguyen RL, Ferguson DL, Kumar K, Parker I, et al. (2017) High-throughput screen detects calcium signaling dysfunction in typical sporadic autism spectrum disorder. Sci Rep 7: 40740 10.1038/srep40740 [DOI] [PMC free article] [PubMed] [Google Scholar]
- 109.Li J, You Y, Yue W, Jia M, Yu H, et al. (2015) Genetic evidence for possible involvement of the calcium channel gene CACNA1A in autism pathogenesis in chinese han population. PLoS ONE 10: e0142887 10.1371/journal.pone.0142887 [DOI] [PMC free article] [PubMed] [Google Scholar]
- 110.Epi4K Consortium (2016) De novo mutations in SLC1A2 and CACNA1A are important causes of epileptic encephalopathies. Am J Hum Genet 99: 287–298. 10.1016/j.ajhg.2016.06.003 [DOI] [PMC free article] [PubMed] [Google Scholar]
- 111.Epi4K Consortium, Epilepsy Phenome/Genome Project, Allen AS, Berkovic SF, Cossette P, et al. (2013) De novo mutations in epileptic encephalopathies. Nature 501: 217–221. 10.1038/nature12439 [DOI] [PMC free article] [PubMed] [Google Scholar]
- 112.Splawski I, Timothy KW, Sharpe LM, Decher N, Kumar P, et al. (2004) Ca(V)1.2 calcium channel dysfunction causes a multisystem disorder including arrhythmia and autism. Cell 119: 19–31. 10.1016/j.cell.2004.09.011 [DOI] [PubMed] [Google Scholar]
- 113.C Yuen RK, Merico D, Bookman M, L Howe J, Thiruvahindrapuram B, et al. (2017) Whole genome sequencing resource identifies 18 new candidate genes for autism spectrum disorder. Nat Neurosci 20: 602–611. 10.1038/nn.4524 [DOI] [PMC free article] [PubMed] [Google Scholar]
- 114.Wang T, Guo H, Xiong B, Stessman HAF, Wu H, et al. (2016) De novo genic mutations among a Chinese autism spectrum disorder cohort. Nat Commun 7: 13316 10.1038/ncomms13316 [DOI] [PMC free article] [PubMed] [Google Scholar]
- 115.Pinggera A, Lieb A, Benedetti B, Lampert M, Monteleone S, et al. (2015) CACNA1D de novo mutations in autism spectrum disorders activate Cav1.3 L-type calcium channels. Biol Psychiatry 77: 816–822. 10.1016/j.biopsych.2014.11.020 [DOI] [PMC free article] [PubMed] [Google Scholar]
- 116.Pinggera A, Mackenroth L, Rump A, Schallner J, Beleggia F, et al. (2017) New gain-of-function mutation shows CACNA1D as recurrently mutated gene in autism spectrum disorders and epilepsy. Hum Mol Genet 26: 2923–2932. 10.1093/hmg/ddx175 [DOI] [PMC free article] [PubMed] [Google Scholar]
- 117.Garza-Lopez E, Lopez JA, Hagen J, Sheffer R, Meiner V, et al. (2018) Role of a conserved glutamine in the function of voltage-gated Ca2+ channels revealed by a mutation in human CACNA1D. J Biol Chem 293: 14444–14454. 10.1074/jbc.RA118.003681 [DOI] [PMC free article] [PubMed] [Google Scholar]
- 118.Flanagan SE, Vairo F, Johnson MB, Caswell R, Laver TW, et al. (2017) A CACNA1D mutation in a patient with persistent hyperinsulinaemic hypoglycaemia, heart defects, and severe hypotonia. Pediatr Diabetes 18: 320–323. 10.1111/pedi.12512 [DOI] [PMC free article] [PubMed] [Google Scholar]
- 119.Vergult S, Dheedene A, Meurs A, Faes F, Isidor B, et al. (2015) Genomic aberrations of the CACNA2D1 gene in three patients with epilepsy and intellectual disability. Eur J Hum Genet 23: 628–632. 10.1038/ejhg.2014.141 [DOI] [PMC free article] [PubMed] [Google Scholar]
- 120.Breitenkamp AFS, Matthes J, Nass RD, Sinzig J, Lehmkuhl G, et al. (2014) Rare mutations of CACNB2 found in autism spectrum disease-affected families alter calcium channel function. PLoS ONE 9: e95579 10.1371/journal.pone.0095579 [DOI] [PMC free article] [PubMed] [Google Scholar]
- 121.Soldatov NM (2015) CACNB2: an emerging pharmacological target for hypertension, heart failure, arrhythmia and mental disorders. Curr Mol Pharmacol 8: 32–42. 10.2174/1874467208666150507093258 [DOI] [PubMed] [Google Scholar]
- 122.Cross-Disorder Group of the Psychiatric Genomics Consortium (2013) Identification of risk loci with shared effects on five major psychiatric disorders: a genome-wide analysis. The Lancet 381: 1371–1379. 10.1016/S0140-6736(12)62129-1 [DOI] [PMC free article] [PubMed] [Google Scholar]
- 123.Rubenstein JLR, Merzenich MM (2003) Model of autism: increased ratio of excitation/inhibition in key neural systems. Genes Brain Behav 2: 255–267. 10.1034/j.1601-183x.2003.00037.x [DOI] [PMC free article] [PubMed] [Google Scholar]
- 124.Avazzadeh S, McDonagh K, Reilly J, Wang Y, Boomkamp SD, et al. (2019) Increased Ca2+ signaling in NRXN1α+/- neurons derived from ASD induced pluripotent stem cells. Mol Autism 10: 52 10.1186/s13229-019-0303-3 [DOI] [PMC free article] [PubMed] [Google Scholar]
- 125.Stessman HAF, Xiong B, Coe BP, Wang T, Hoekzema K, et al. (2017) Targeted sequencing identifies 91 neurodevelopmental-disorder risk genes with autism and developmental-disability biases. Nat Genet 49: 515–526. 10.1038/ng.3792 [DOI] [PMC free article] [PubMed] [Google Scholar]
- 126.Durand CM, Betancur C, Boeckers TM, Bockmann J, Chaste P, et al. (2007) Mutations in the gene encoding the synaptic scaffolding protein SHANK3 are associated with autism spectrum disorders. Nat Genet 39: 25–27. 10.1038/ng1933 [DOI] [PMC free article] [PubMed] [Google Scholar]
- 127.Leblond CS, Nava C, Polge A, Gauthier J, Huguet G, et al. (2014) Meta-analysis of SHANK Mutations in Autism Spectrum Disorders: a gradient of severity in cognitive impairments. PLoS Genet 10: e1004580 10.1371/journal.pgen.1004580 [DOI] [PMC free article] [PubMed] [Google Scholar]
- 128.Xing J, Kimura H, Wang C, Ishizuka K, Kushima I, et al. (2016) Resequencing and Association Analysis of Six PSD-95-Related Genes as Possible Susceptibility Genes for Schizophrenia and Autism Spectrum Disorders. Sci Rep 6: 27491 10.1038/srep27491 [DOI] [PMC free article] [PubMed] [Google Scholar]
- 129.Uzunova G, Hollander E, Shepherd J (2014) The role of ionotropic glutamate receptors in childhood neurodevelopmental disorders: autism spectrum disorders and fragile x syndrome. Curr Neuropharmacol 12: 71–98. 10.2174/1570159X113116660046 [DOI] [PMC free article] [PubMed] [Google Scholar]
- 130.Rojas DC (2014) The role of glutamate and its receptors in autism and the use of glutamate receptor antagonists in treatment. J Neural Transm 121: 891–905. 10.1007/s00702-014-1216-0 [DOI] [PMC free article] [PubMed] [Google Scholar]
- 131.Yang S-N, Berggren P-O (2006) The role of voltage-gated calcium channels in pancreatic beta-cell physiology and pathophysiology. Endocr Rev 27: 621–676. 10.1210/er.2005-0888 [DOI] [PubMed] [Google Scholar]
- 132.Moshkovskii SA, Lobas AA, Gorshkov MV (2020) Single Cell Proteogenomics—Immediate Prospects. Biochemistry Mosc 85: 140–146. 10.1134/S0006297920020029 [DOI] [PubMed] [Google Scholar]
- 133.Regev A, Polonius-Teichmann S, Rozenblatt-Rosen O, Stubbington M, Ardlie K, et al. (2019) The Human Cell Atlas White Paper Apollo—University of Cambridge Repository; 10.17863/cam.40032 [DOI] [Google Scholar]
- 134.Werling DM (2016) The role of sex-differential biology in risk for autism spectrum disorder. Biol Sex Differ 7: 58 10.1186/s13293-016-0112-8 [DOI] [PMC free article] [PubMed] [Google Scholar]
- 135.Werling DM, Geschwind DH (2015) Recurrence rates provide evidence for sex-differential, familial genetic liability for autism spectrum disorders in multiplex families and twins. Mol Autism 6: 27 10.1186/s13229-015-0004-5 [DOI] [PMC free article] [PubMed] [Google Scholar]
- 136.Werling DM, Parikshak NN, Geschwind DH (2016) Gene expression in human brain implicates sexually dimorphic pathways in autism spectrum disorders. Nat Commun 7: 10717 10.1038/ncomms10717 [DOI] [PMC free article] [PubMed] [Google Scholar]
- 137.Taylor DM, Aronow BJ, Tan K, Bernt K, Salomonis N, et al. (2019) The Pediatric Cell Atlas: Defining the Growth Phase of Human Development at Single-Cell Resolution. Dev Cell 49: 10–29. 10.1016/j.devcel.2019.03.001 [DOI] [PMC free article] [PubMed] [Google Scholar]