

Abstract
Background:
Isokinetic training (IKT) and core stabilization training (CST) are commonly used for balance training in musculoskeletal conditions. The knowledge about the effective implementation of these training protocols on radiological and biochemical effects in university football players with chronic low back pain (LBP) is lacking.
Objective:
To find and compare the effects of isokinetic training and CST on radiological and biochemical effects in university football players with chronic LBP.
Design:
Randomized, double-blinded controlled study.
Setting:
University hospital.
Participants:
60 LBP participants were randomized into isokinetic group (IKT; n = 20), core stabilization group (CST; n = 20) and the control group (n = 20) and received respective exercises for 4 weeks.
Outcome measures:
Radiological (muscle cross sectional area & muscle thickness) and biochemical (C-reactive protein, tumor necrosis factor -α, interleukin [IL]-2, IL-4, IL-6) values were measured at baseline and after 4 weeks (immediate effect).
Results:
The reports of the IKT, CST and control group were compared between the groups. Four weeks following training IKT group shows more significant changes in muscle cross sectional area (Psoas Major, Quadratus Lumborum, Multifidus and Erector Spinae muscles) and muscle thickness (Multifidus) than CST and control groups (p < 0.001). Biochemical measures such as C-reactive protein, tumor necrosis factor -α, IL-2, IL-4 and IL-6 also show significant improvement in IKT group than the other 2 groups (P < .001).
Conclusion:
Training through Isokinetic is an effective treatment program than conventional exercise programs in the aspect of radiological and biochemical analysis in university football players with chronic LBP, which may also help to prevent further injury. The present study can be used to improve the physical therapist's knowledge and clinical decision skills on LBP in football players.
Keywords: chronic low back pain, core stabilization training, cross sectional area, isokinetic training, muscle thickness
1. Introduction
Football has become 1 of the world's leading team events; according to Federation of International Football Associations survey, there are 265 million people actively participating in this game around the world. Increasing in the number of players could increase the number of sports injuries, which was noted particularly in the back region (47%).[1] Low back pain (LBP) is considered to be the major disability affecting this game and this injury is associated with trunk balance control.[2] Recent studies report an injury to the muscles and proprioceptors in the trunk region during the sports activities affects the trunk balance control mechanisms.[3] The decline in trunk balance control may be due to technological development, abnormal physical activity, pathological changes and poor training in sports; and these factors lead to LBP in the later stages.[4,5] Participation in football without proper training usually associated with risk of back injuries, which commonly affects the activities of daily living and good quality of life.[6] Therefore various injury prevention and post-injury rehabilitation programs have been formulated to prevent and treat such sports injuries.[7–9] Generally, sports physiotherapists and coaches are providing and adopting such training at on and off the field to the players.[10]
Ho CW et al observed that the trunk muscles of football players with chronic LBP were weaker than normal healthy subjects.[11] It is proved clinically that isokinetic training has significant consistent results in mechanical LBP and found the positive correlation between trunk muscle imbalance and LBP dysfunction.[12] Usually in clinical studies the effectiveness of different exercise training protocols and fitness protocols in LBP were evaluated by measuring the core muscle strength.[13] The newly developed isokinetic trunk device is a tool which precisely measure the strength of the core muscles in LBP subjects. The device was also used as training (Isokinetic training –[IKT]) and rehabilitating tool for improving the muscle strength in various musculoskeletal conditions.[14] Moreover operating this device requires a trained person, a suitable place and a particular appointment time in the sports set up. Hence there is lack of studies in the current sports field to analyze its effect on football players with chronic LBP.
Core stabilization training (CST) is a special type of training commonly used for core muscles of trunk in treating lower back problems. It uses different size of Swiss ball to train the core muscles. It offers the participants to control the Centre of gravity of the body with minimum base of support. Moreover performing the exercises in Swiss ball is in upright position, which enhances the trunk muscle recruitment for spinal stabilization. Also the subjects found training through Swiss ball is highly inspired and added fun to the movements.[15,16] It is used widely due to the fact that the treatment session becomes more interesting which reduces the difficulty of rehabilitation. The real scientific physiological advantage of Swiss ball training is that this training permits the nervous system for neuroplastic changes and transferring into the muscular system for new motor learning.[17,18] In few studies there was a significant difference in the clinical outcomes among the subjects who had undergone conventional balance training and Swiss ball training in LBP subjects.[19,20]
Altogether, the knowledge about the effective implementation of IKT and CST and its radiological and biochemical effects on football players suffering from chronic LBP is lacking. Comprehensive understanding of the relation between radiological and biochemical analysis promote this clinical condition in a positive way. Hence these types of sports trainings should able to modify the risk and reduce the impact of future consequences in football. Therefore, the aim of the study is to find and compare the effects of isokinetic training over CST on radiological and biochemical effects in university football players with chronic LBP.
2. Materials and methods
2.1. Trial design
The study was a double-blinded randomized control study and the subjects were randomized and allocated equally according to computer random table method (www.stattrek.com) in 1:1:1 ratio in 3 groups. Sixty (N = 60) subjects were randomized in the study and allocated to Isokinetic training IKT (n = 20), CST (n = 20) and Control (n = 20) groups. The study was approved by the Departmental scientific ethical committee with reference no RHPT/020/002 and was conducted according to the ethical guidelines of the declaration of Helsinki 1964 and declaration of Tokyo, 1975. It was executed transparently and presented in accordance with CONSORT guidelines.
The study was executed in the Department of Physical Therapy and Health Rehabilitation, Prince Sattam Bin Abdul Aziz University, Al-Kharj, Saudi Arabia. Participants were recruited from the University Hospital and King Khalid hospital, Al-Kharj, Saudi Arabia. Sports therapist at the department evaluates the participants for participating in the study according to the eligibility criteria.
2.2. Patient involvement
In the initial phase, all the participants were instructed and explained about the research problems, study design, intervention procedures, outcome measures, study duration, harms and benefits of the research through study information form. Subjects who read and consent to participate in the study involved in primary screening for final selection.
2.3. Participants
In order to take part in the study, the subjects have to agree to participate in the study and to sign the informed consent approved by the ethical committee. Inclusion criteria for selection of the subjects were as follows university male football players in the age group of 18 – 25 years, chronic (≥3 months) LBP, 4 to 8 pain intensity in visual analog scale (VAS) and participants who were diagnosed LBP by an orthopedic surgeon and referred for physical therapy were included. Participants with severe musculoskeletal, neural, somatic and psychiatric conditions, waiting for spine surgery, having alcohol or drug abuse, involving in other weight and balance training program were excluded from the study. Participants with other soft tissue injuries, fracture at the lower limbs and pelvic bone, deformities were also excluded from the study.
2.4. Interventions
The 4 weeks rehabilitation protocols for the 3 groups were accepted by the ethical committee. The rehabilitation protocol was carried out by an experienced and trained physiotherapist with 5 years’ experience. We excluded eight participants with excruciating pain (≥8 in VAS scale), 7 participants with other musculoskeletal and joint injuries, 4 with awaiting surgery and 5 who were not willing to participate in the study (Fig. 1).
Figure 1.
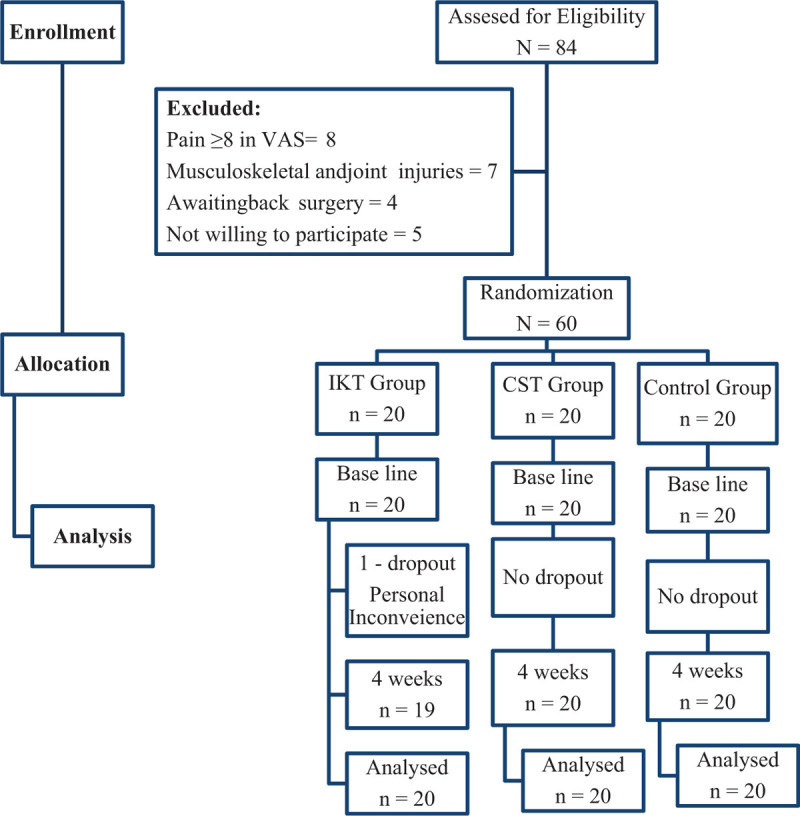
Flow chart showing the study details.
In IKT group before isokinetic training, the subjects were asked to perform 5 minutes warm-up followed by slow stretching of back extensors and flexors. The subject is asked to be in isokinetic dynamometer (Biodex Corporation, Newyork) in a vertical standing position. The knees were flexed slightly at 15 degrees, and the fixation straps were tied around the popliteus, thigh, pelvis, chest and scapula to prevent the tricky movements. Keep the trunk to maintain the range of motion of 100 of extension and 800 of flexion. The axis of the dynamometer was aligned with the intersection point of the mid-axillary line and the lumbosacral junction which is exactly 3.5 cm below the crest of iliac bone. The lever arm was customized according to the length of the subject's trunk and the resistance was given anterior and posterior to the trunk. The required modifications and procedures were done as per the user's manual to reduce the risk. The trunk was tested from -100 of extension to 800 of flexion 0 degree are considered as neutral.
The subjects were trained for familiarization in the exercise by showing model video clips and allowing them for practice attempts. Once they mastered in the training they were allowed to perform the exercise at an angular speed of 60 degrees/second, 90 degrees/s and 120 degrees/s with 15 repetitions of 3 sets. Between each set 30 seconds rest and between each pace 60 seconds rest has been given. The subjects were monitored and instructed throughout their training by a supervisor. The outcome parameters were assessed by different examiner, who was experienced in handling isokinetic devices.[21]
In CST group, the participant received the balance training through Swiss ball (Fitness world, Italy) for core muscles. The size of the ball was decided according to the guidelines of Togu (height: ball size) (under 155 cm, 45 cm; 156–165 cm, 55 cm; 165–178 cm, 65 cm; over 178 cm, 75 cm). The exercises performed were Supine bridge, Sit-up, Arms-legs cross lifting, and Side bridge on the Swiss ball for 10 times per set for 3 sets. Participants were informed to maintain the position for 10 seconds, with a 3-second break between the repetitions.[22]
The Control group focused on conventional balance training for core muscles. The training includes active isotonic and isometric exercise for abdominal muscles (Internal oblique, external oblique, transverse abdominus and Rectus abdominus) deep abdominal muscles (Psoas major, Psoas minor, Illiacus and Quadratus Lumborum) and back muscles (Erector spinae, Transverses spinalis, Inter spinalis and Inter transverse) and they performed these exercise 10 to 15 reps/d. Stretching should focus on each muscle group for 3 repetitions for 10 seconds per muscle group (Hamstring, Hip flexors and Lumbar Extensors).
All the 3 groups had undergone this training for 5 days per week for 4 weeks. A home-based exercise protocol was prescribed to all the subjects to perform at home. All the subjects in 3 groups were undergone hot pack therapy for 20 mins and ultrasound with a frequency of 1 Mhz and intensity of 1.5 W/cm2 in continuous form for 5 minutes.[23]
2.5. Outcome variables
2.5.1. Pain intensity
The pain intensity was measured by VAS which consist of 10 cm horizontal line representing 1 end with “no pain at all” and the other end with “as bad as possible it could be.” Each subject was asked to enter in the line as per his pain perception and the score is measured by the distance on the line. The reliability and validity of VAS in application of musculoskeletal conditions was good.[24]
2.5.2. Para spinal CSA
T2 weighted images of para spinal muscles (PM: Psoas Major, QL: Quadratus Lumborum, Mf: Multifidus and ES: Erector Spinae) cross-sectional area (CSA) were taken using a 3-T MRI-scanner (Closed MRI system, Siemens, Hamburg, Germany) with a slice thickness of 5 mm. The subjects were placed in a supine position with a pillow kept under the knees to maintain the normal lordosis of the lumbar spine. The CSA at the level of L3-L4 was selected because of their maximal size at this level.[25]
2.5.3. Ultrasound
The thickness of Multifidus muscle was measured by the diagnostic ultrasound device (Hitachi Ultra sound, Tokyo, Japan) which is the most reliable and valid method of measurement. The thickness of multifidus was taken from the left and right side of the L4 and L5 level. The subject lies on prone position with a pillow under the abdomen to maintain lordosis. The thickness of the muscle was measured by measuring the distance between the most superficial portion of the facet joint and the plane between the muscle and the skin.[26]
2.5.4. Inflammatory biomarker
Subject's blood samples of 10 ml were taken in sterile tubes between 08:00 to 10:00 am. Serum was separated and centrifuged, which was frozen at -700 C and stored. Serum levels of C-reactive protein (CRP), tumor necrosis factor (TNF)-α, interleukin [IL]-2, IL-4, IL-6 were measured by enzyme-linked immunosorbent assay (ELISA) technique. The kit was used according to the guidelines of the manufacturer. The lower and upper limits of detection were computed for each assay, and the average percentages of samples were reported for statistical analysis.[27]
2.6. Sample size
The subjects required for the study was (N = 60) and in each group was (n = 20) which was obtained through a pilot study by assuming 80% power with 20% changes in pain intensity (VAS) with the standard deviation of 2 and significance level of 5%. It was calculated with the use of software G∗power (version 3.1.9.7, CBS interactive Inc, California) software.
2.7. Randomization
An individual who is not involved in the data collection was used for randomization. The subjects enter in “IKT, CST, and Control” groups following simple random table in 1:1:1 ratio in 3 groups by using free online random table creator (www.stattrek.com). All the prospective subjects who fulfill the eligibility criteria were allowed to participate.
2.8. Blinding
Due to the design and settings of the study, it is not possible to blind the treating therapist involved in the study. The subject and the therapist who is assessing the outcomes at baseline and after 4 weeks were blinded. Hence, the treating and assessing therapists were different persons and the assessing therapist remains blinded to the subject's treatment group assigned at all times. Subjects were instructed not to disclose the study procedures and treatment protocol with fellow subjects and the assessing therapist.
2.9. Statistical analysis
Subject demographic characteristics were measured to decide the study homogeneity using the Levene test. Outcome data were presented as mean and standard deviation and paired t test was performed to determine significant difference within the groups. One way ANOVA test was used for comparison between the groups and Tukey post hoc analysis was used for further analysis and the statistical analysis was conducted under intention to treat analysis. The statistical significance level was set at P < 0.05. SPSS software (version 20.0) SPSS Inc, Chicago, Illinois, USA was used for all statistical analyses.
3. Results
3.1. Participants
Out of 84 participants screened, 60 were selected and allocated equally (n = 20) into IKT, CST and control group as per the selection criteria. One participant from IKT group was dropped out from the study due to personal inconvenience. Descriptive demographic analysis of characters such as age, height, weight and BMI were measured in all the 3 groups at baseline and presented as mean and standard deviation. The 1 way ANOVA test shows no significant difference (P > .05) between these characters in the groups which indicate study homogeneity. Moreover the clinical parameters such as VO2peak, heart rate, years of playing and duration of injury also measured to find the eligibility to participate in the exercise training program. These clinical parameters also show no significant difference (P > .05) between the groups at baseline (Table 1).
Table 1.
Demographic characters of IKT, CST, and control groups.
| Sr.No | Variable | IKT | CST | Control | P-value |
| 1 | Age (yr) | 22.1 ± 1.8 | 22.3 ± 1.7 | 21.9 ± 1.8 | .774∗ |
| 2 | Height (m) | 1.67 ± 0.17 | 1.72 ± 0.18 | 1.71 ± 0.17 | .630∗ |
| 3 | Weight (kg) | 67.6 ± 2.9 | 68.6 ± 2.8 | 69.6 ± 3.1 | .107∗ |
| 4 | BMI (kg/m2) | 24.2 ± 1.4 | 24.6 ± 1.3 | 23.9 ± 1.4 | .275∗ |
| 5 | VO2peak (mL/kg/min) | 37.6 ± 3.9 | 38.2 ± 4.1 | 37.9 ± 4.2 | .897∗ |
| 6 | HR (beats/min) | 172 ± 7.2 | 173 ± 6.9 | 173 ± 7.3 | .877∗ |
| 7 | Years of playing (yr) | 4.5 ± 1.7 | 4.8 ± 1.5 | 4.4 ± 1.5 | .704∗ |
| 8 | Duration of Injury (m) | 4.2 ± 0.8 | 4.6 ± 0.7 | 4.7 ± 0.6 | .068∗ |
3.2. Pain intensity
The baseline scores between IKT, CST and control group of pain intensity (VAS) haven’t shown any statistical difference (P > .05), which represents the homogenous population. Inter group analysis between IKT, CST and control group at 4 weeks show significance difference (P≤.001) after 4 weeks of training. Moreover the intra group analysis of IKT, CST and control group show significance difference (P≤.001) which means each group has considerable amount of improvement (Table 2) in pain intensity. The Tukey's post hoc analysis and percentage of improvement between the groups reported that IKT group has significant reduction in pain intensity CI 95% 2.6 (2.28 to 2.91) than CST group.
Table 2.
Pre and post mean difference and confidence interval (upper limit and lower limit) scores of IKT, CST, and control groups.
| Mean difference CI95% (Upper limit – Lower limit) | ||||||||
| Variable / Time | Baseline | P value | After 4 wk | P value | ||||
| Pain intensity (VAS – cm) | IKT | IKT vs Control | 7.4 ± 0.5 | −0.1 (−0.41 to 0.21) | .720∗ | 1.2 ± 0.3 | 4.3 (3.98 to 4.61) | .838∗ |
| CST | CST vs Control | 7.2 ± 0.4 | 0.10 (−0.21 to 0.41) | .720∗ | 3.8 ± 0.5 | 4.3 (3.98 to 4.61) | .001 | |
| Control | IKT vs CST | 7.3 ± 0.3 | −0.2 (−0.51 to 0.11) | .276∗ | 5.5 ± 0.4 | 2.6 (2.28 to 2.91) | .001 | |
| P value | .308∗ | .001 | ||||||
| Psoas Major CSA (cm2) – R | IKT | IKT vs Control | 8.8 ± 0.4 | −0.3 (−0.63 to 0.03) | .084∗ | 10.9 ± 0.4 | −2.1 (−2.39 to −1.80) | .001 |
| CST | CST vs Control | 8.7 ± 0.5 | −0.2 (−0.53 to 0.13) | .322∗ | 9.2 ± 0.5 | −0.4 (−0.69 to −0.10) | .005 | |
| Control | IKT vs CST | 8.5 ± 0.4 | −0.1 (−0.43 to 0.23) | .749∗ | 8.8 ± 0.2 | −1.7 (−1.99 to −1.40) | .001 | |
| P value | .094∗ | .001 | ||||||
| Psoas Major CSA (cm2) – L | IKT | IKT vs Control | 8.2 ± 0.4 | −0.3 (−0.68 to 0.08) | .807∗ | 10.8 ± 0.4 | −2.4 (−2.68 to −2.11) | .001 |
| CST | CST vs Control | 8.1 ± 0.6 | −0.2 (−0.58 to 0.18) | .430∗ | 8.9 ± 0.3 | −0.5 (−0.78 to −0.21) | .001 | |
| Control | IKT vs CST | 7.9 ± 0.5 | −0.1 (−0.48 to 0.28) | .807∗ | 8.4 ± 0.4 | −1.9 (−2.18 to −1.61) | .001 | |
| P value | .171∗ | .001 | ||||||
| Quadratus. Lumborum CSA (cm2) – R | IKT | IKT vs Control | 4.5 ± 0.7 | 0.30 (−0.20 to 0.80) | .337∗ | 6.9 ± 0.3 | −1.8 (−2.05 to −1.54) | .001 |
| CST | CST vs Control | 4.3 ± 0.6 | 0.50 (−0.00 to 1.00) | .055∗ | 5.5 ± 0.4 | −0.4 (−0.65 to −0.14) | .001 | |
| Control | IKT vs CST | 4.8 ± 0.7 | −0.2 (−0.70 to 0.30) | .613∗ | 5.1 ± 0.3 | −1.4 (−1.65 to −1.14) | .001 | |
| P value | .067∗ | .001 | ||||||
| Quadratus. Lumborum CSA (cm2) – L | IKT | IKT vs Control | 4.5 ± 0.3 | 0.0 (−0.23 to 0.23) | 1.000∗ | 7.1 ± 0.3 | −1.7 (−1.95 to −1.44) | .001 |
| CST | CST vs Control | 4.3 ± 0.4 | 0.20 (−0.03 to 0.43) | .113∗ | 5.6 ± 0.4 | −0.2 (−0.45 to 0.05) | .154∗ | |
| Control | IKT vs CST | 4.5 ± 0.2 | −0.2 (−0.43 to 0.03) | .113∗ | 5.4 ± 0.3 | −1.5 (−1.75 to −1.24) | .001 | |
| P value | .071∗ | .001 | ||||||
| Multifidus CSA (cm2) – R | IKT | IKT vs Control | 5.4 ± 0.5 | 0.10 (−0.23 to 0.43) | .749∗ | 7.7 ± 0.4 | −2.0 (−2.31 to −1.68) | .001 |
| CST | CST vs Control | 5.2 ± 0.4 | 0.30 (−0.03 to 0.63) | .084∗ | 5.9 ± 0.5 | −0.2 (−0.51 to 0.11) | .276∗ | |
| Control | IKT vs CST | 5.5 ± 0.4 | −0.20 (−0.53 to 0.13) | .322∗ | 5.7 ± 0.3 | −1.8 (−2.11 to −1.48) | .001 | |
| P value | .094∗ | .001 | ||||||
| Multifidus CSA (cm2) – L | IKT | IKT vs Control | 5.2 ± 0.7 | 0.50 (−0.00 to 1.00) | .055∗ | 7.8 ± 0.5 | −1.9 (−2.21 to −1.58) | .001 |
| CST | CST vs Control | 5.4 ± 0.7 | 0.30 (−0.20 to 0.80) | .337∗ | 6.2 ± 0.3 | −0.30 (−0.61 to 0.01) | .060∗ | |
| Control | IKT vs CST | 5.7 ± 0.6 | 0.20 (−0.30 to 0.70) | .613∗ | 5.9 ± 0.4 | −1.6 (−1.91 to −1.28) | .001 | |
| P value | .067∗ | .001 | ||||||
| Erector Spinae CSA (cm2) – R | IKT | IKT vs Control | 15.9 ± 0.4 | 0.3 (−0.06 to 0.66) | .123∗ | 19.1 ± 0.3 | −2.2 (−2.48 to −1.91) | .001 |
| CST | CST vs Control | 16.1 ± 0.6 | 0.1 (−0.26 to 0.46) | .785∗ | 17.4 ± 0.4 | −0.5 (−0.78 to −0.21) | .001 | |
| Control | IKT vs CST | 16.2 ± 0.4 | 0.2 (−0.16 to 0.56) | .385∗ | 16.9 ± 0.4 | −1.7 (−1.98 to −1.41) | .001 | |
| P value | .137∗ | .001 | ||||||
| Erector Spinae CSA (cm2) – L | IKT | IKT vs Control | 16.5 ± 0.5 | 0.2 (−0.15 to 0.55) | .374∗ | 18.8 ± 0.5 | −1.7 (−2.01 to −1.38) | .001 |
| CST | CST vs Control | 16.8 ± 0.4 | −0.1 (−0.45 to 0.25) | .779∗ | 17.3 ± 0.4 | −0.2 (−0.51 to 0.11) | .276∗ | |
| Control | IKT vs CST | 16.7 ± 0.5 | 0.3 (−0.05 to 0.65) | .116∗ | 17.1 ± 0.3 | −1.5 (−1.81 to −1.18) | .001 | |
| P value | .129∗ | .001 | ||||||
| Multifidus Thickness (mm) R | IKT | IKT vs Control | 33.5 ± 3.2 | −1.3 (−3.86 to 1.26) | .446∗ | 35.1 ± 1.3 | −2.2 (−3.19 to −1.20) | .001 |
| CST | CST vs Control | 32.8 ± 3.4 | −0.6 (−3.16 to 1.96) | .840∗ | 33.2 ± 1.4 | 0.1 (−0.89 to 1.09) | .968∗ | |
| Control | IKT vs CST | 32.2 ± 3.5 | −0.7 (−3.26 to 1.86) | .789∗ | 32.9 ± 1.2 | −2.3 (−3.29 to −1.30) | .001 | |
| P value | .478∗ | .001 | ||||||
| Multifidus Thickness (mm) L | IKT | IKT vs Control | 31.4 ± 2.8 | −0.3 (−2.61 to 2.01) | .947∗ | 34.8 ± 1.1 | −0.9 (−1.7 to −0.03) | .039 |
| CST | CST vs Control | 31.3 ± 3.1 | −0.2 (−2.51 to 2.11) | .976∗ | 34.5 ± 1.1 | −0.6 (−1.46 to 0.26) | .224∗ | |
| Control | IKT vs CST | 31.1 ± 3.2 | −0.1 (−2.41 to 2.21) | .994∗ | 33.9 ± 1.2 | −0.3 (−1.16 to 0.56) | .682∗ | |
| P value | .950∗ | .045 | ||||||
3.3. MRI analysis
The pre-intervention data on CSA through MRI analysis between the IKT, CST, and control groups shows no statistical difference (P≥.05) in Psoas major (R&L), Quadratus Lumborum (R&L), Multifidus (R&L) and Erector Spinae (R&L) muscles. Over 4 weeks of training with different training protocols, the CSA increased significantly between 3 groups and reported a significant difference (P≤.001) (Table 2). The post hoc Tukey test and graphical representation showed more improvement in CSA of Psoas major (R&L) CI 95% -1.7 (-1.99 to -1.40) and -1.9 (-2.18 to -1.61), Quadratus Lumborum (R&L) CI 95% -1.4 (-1.65 to -1.14) & -1.5 (-1.75 to -1.24), Multifidus (R&L) CI 95% -1.8 (-2.11 to -1.48) and -1.6 (-1.91 to -1.28) and Erector Spinae (R&L) CI 95% -1.7 (-1.98 to -1.41) & -1.5 (-1.81 to -1.18) muscles in IKT group than CST group (Fig. 2) after 4 weeks training. The whole analysis shows a little tendency towards greater gains towards IKT group than the other 2 groups.
Figure 2.
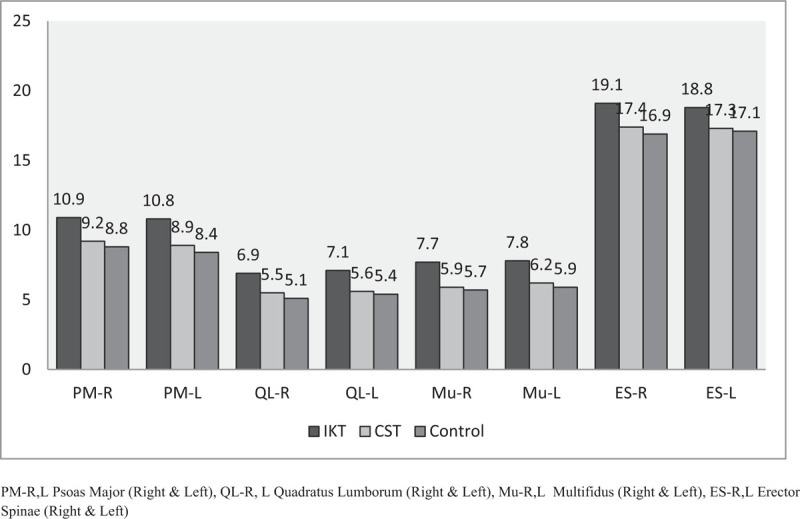
Post MRI analysis of IKT, CST and Control groups.
3.4. US analysis
The last component in (Table 2) shows the thickness of Multifidus muscle (R&L) measured by Ultra sound between the IKT, CST and control groups. The subjects underwent the thickness analysis for Multifidus muscle only, because of its prime role in stability and mobility aspect of the lumbar spine. The pre-intervention data showed no statistical significance (P≥.05) difference between the groups, but the post-intervention showed significant statistical difference (P≤.001) between the groups after 4 weeks of training. However, greater evidence of improvement in Multifidus muscle (R&L) thickness was noted in post hoc Tukeys test in IKT group CI 95% -2.3 (-3.29 to -1.30) and -0.3 (-1.16 to 0.56) than CST group (Fig. 3).
Figure 3.

Pre and Post US analysis of IKT, CST and Control groups.
3.5. Biochemical analysis
Changes in CRP, TNF-α, IL-2, IL-6, and IL-8 between pre and post-intervention were shown in Table 3. The pre intervention data on all these parameters showed no difference between the 3 groups (P≥.05). All the groups showed significant improvements from pre to post (P≤.001) intervention after 4 weeks. However, a greater tendency towards improvement in CRP CI 95% 0.4 (0.26 to 0.53), TNF-α CI 95% 3.5 (3.16 to 3.83), IL-2 CI 95% -1.9 (-2.23 to -1.56), IL-6 CI 95% -11.7 (-13.1 to -10.2), and IL-8 CI 95% 2.5 (2.26 to 2.73) in IKT group was noted by post hoc Tukeys test than CST and control groups (Fig. 4).
Table 3.
Pre and post mean difference and confidence interval (upper limit and lower limit) of pro inflammatory biomarker analysis scores of IKT, CST, and control groups.
| Mean difference CI95% (Upper limit – Lower limit) | ||||||||
| Variable / Time | Baseline | P value | After 4 wk | P value | ||||
| CRP Mg/l | IKT | IKT vs Control | 7.4 ± 0.5 | −0.06 (−0.39 to 0.27) | .901∗ | 1.2 ± 0.3 | 0.8 (0.66 to 0.93) | .001 |
| CST | CST vs Control | 7.2 ± 0.4 | −0.04 (−0.37 to 0.29) | .954∗ | 3.8 ± 0.5 | 0.4 (0.26 to 0.53) | .001 | |
| Control | IKT vs CST | 7.3 ± 0.3 | −0.02 (−0.35 to 0.31) | .988∗ | 5.5 ± 0.4 | 0.4 (0.26 to 0.53) | .001 | |
| P value | .906∗ | .001 | ||||||
| TNF-α Pg/ml | IKT | IKT vs Control | 8.8 ± 0.4 | 0.0 (−0.35 to 0.35) | 1.000∗ | 10.9 ± 0.4 | 6.7 (6.36 to 7.03) | .874∗ |
| CST | CST vs Control | 8.7 ± 0.5 | 0.30 (−0.05 to 0.65) | .116∗ | 9.2 ± 0.5 | 3.2 (2.86 to 3.53) | .014 | |
| Control | IKT vs CST | 8.5 ± 0.4 | −0.30 (−0.65 to 0.05) | .116∗ | 8.8 ± 0.2 | 3.5 (3.16 to 3.83) | .132∗ | |
| P value | .073∗ | .001 | ||||||
| IL-2 | IKT | IKT vs Control | 8.2 ± 0.4 | −0.2 (−0.66 to 0.26) | .522∗ | 10.8 ± 0.4 | −3.1 (−3.43 to −2.76) | .006 |
| CST | CST vs Control | 8.1 ± 0.6 | −0.30 (−0.76 to 0.16) | .268∗ | 8.9 ± 0.3 | −1.2 (−1.53 to −0.86) | .001 | |
| Control | IKT vs CST | 7.9 ± 0.5 | 0.10 (−0.36 to 0.56) | .860∗ | 8.4 ± 0.4 | −1.9 (−2.23 to −1.56) | .001 | |
| P value | .287∗ | .001 | ||||||
| IL-4 | IKT | IKT vs Control | 4.5 ± 0.7 | −0.2 (−0.73 to 0.33) | .644∗ | 6.9 ± 0.3 | −22.1 (−23.5 to −20.6) | .872∗ |
| CST | CST vs Control | 4.3 ± 0.6 | −0.5 (−1.03 to 0.03) | .072∗ | 5.5 ± 0.4 | −10.4 (−11.8 to −8.9) | .001 | |
| Control | IKT vs CST | 4.8 ± 0.7 | 0.3 (−0.23 to 0.83) | .375∗ | 5.1 ± 0.3 | −11.7 (−13.1 to −10.2) | .001 | |
| P value | .086∗ | .001 | ||||||
| IL-6 | IKT | IKT vs Control | 4.5 ± 0.3 | −0.2 (−0.51 to 0.11) | .276∗ | 7.1 ± 0.3 | 3.2 (2.96 to 3.43) | .814∗ |
| CST | CST vs Control | 4.3 ± 0.4 | 0.1 (−0.21 to 0.41) | .720∗ | 5.6 ± 0.4 | 0.7 (0.46 to 0.93) | .001 | |
| Control | IKT vs CST | 4.5 ± 0.2 | −0.30 (−0.61 to 0.01) | .060∗ | 5.4 ± 0.3 | 2.5 (2.26 to 2.73) | .132∗ | |
| P value | .069∗ | .001 | ||||||
Figure 4.

Pre and Post analysis of IL-2, IL-4 and IL-6 of IKT, CST, and Control groups.
4. Discussion
4.1. Radiological effects
This study analyzed the changes in CSA and muscle thickness of para spinal muscles in subjects with chronic LBP after IKT, CST, and conventional training exercises. The CSA and muscle thickness were measured through MRI and US respectively and the mean measurements of above parameters were good, showing that the measurements were reliable. Before the training, the reports of the study show atrophic changes in PM, QL, Mf and ES muscles. This statement was in agreement with Barker KL et al and stated that this weakness is due to pain and muscle inhibition, which leads to a decrease in CSA.[28] Reduction in CSA of paravertebral muscles further progresses to instability of spine and loss of trunk balance.
Our study shows that there is a significant increase in CSA of PM, QL, Mf and ES muscles in IKT group than CST and Control groups. In this study the isokinetic training was given at different angular velocities such as 60 deg/s, 90 deg/s and 120 deg/s with high peak torque. Calmes P et al observed that training at different angular velocities and high peak torque will improve the trunk muscle strength and flexors/extensors ratio in athletes.[14] These biomechanical changes may clinically reduce the pain and improve the trunk muscle strength of the football players with chronic LBP. The current reports on these clinical changes were supported by Ben Moussa et al and Zouita ABM et al and also said that improving trunk muscle strength is the key role in preventing further injuries in back.[29,30]
The clinical improvement in CST group is due to the fact that the Swiss ball provides the difficulty to work, but it was under the control of supervisor focusing on the recruitment of specific muscles. The mechanism behind little changes in CSA in CST group is by the comprehensive improvement in muscle strength, endurance, and flexibility of trunk muscles.[31] In the control group, the balance training was designed by increasing the challenge of the task through either reducing the base of support or sensory input which improves balance ability and the mechanism was yet not defined clearly.[32]
Lee JC et al observed that the changes in thickness of Mf muscle are due to degenerative changes of intervertebral discs at the vertebra.[33] The presence of intramuscular fat could also affect the thickness of this muscle. Our study proved that specific isokinetic training with different velocity exercises may enhance the activity of the fibroblasts in the vertebral discs, which could increase the thickness in the Mf muscles.[34]
4.2. Biochemical effects
The study also analyzed the effects of IKT, CST and conventional training on inflammatory markers in chronic LBP subjects. This study provides the report that IKT reduces the inflammation by changes in CRP, TNF-α, IL-2, IL-4 and IL-6 than other groups. It was noted that greater concentrations of pro-inflammatory markers such as CRP, TNF-α and IL-6 were present in chronic LBP subjects.[35] Generally the concentrations of CRP and TNF-α were influenced by genetic factors and also by the level of fat content.[36] Physical training reduces CRP and TNF-α level, which have been proven by some cross-sectional studies.[37]
We found little response in inflammatory biomarkers such as CRP, TNF-α and IL-6 after isokinetic training. Training the trunk muscles is an important factor in improving the inflammatory biomarkers in LBP. However, so far it is not proved that IKT training in chronic LBP has positive impact on inflammatory biomarkers and this is in accordance with da Cruz Fernandes IM et al.[38] The reports also found considerable changes in force and velocity in IK training may positively helpful in improving inflammatory biomarkers in LBP. The available study on isokinetic training suggests that its balanced controlled exercise will further reduce the joint injury and improve the regeneration process which has positive correlation with the inflammatory biomarkers.[39] In CST the Swiss ball permits the nervous system for neuroplastic changes and transferring into the muscular system and could change the inflammatory process.[17,18]
The strength of this study is its real-time measurements of radiological and biochemical analysis in chronic LBP subjects. Still, few limitations have been noted and considered while executing this study. First, the outcome measures such as balance, and functional status were not considered for the data analysis. Secondly, the follow up measurements were not taken in a long term basis, which could have been measured. Lastly, we haven’t found the association between the radiological and inflammatory effects of IKT training. There are wide beneficial effects of Isokinetic training on radiological and biochemical area, and recent studies were identifying its role in improvement of pain. Still, further researches are required to find the physical and molecular mechanism behind the neuromechanical and anti-inflammatory effect of IKT in chronic LBP subjects.
5. Conclusion
Overall, our study suggests that strength training through isokinetic training protocol improves pain, radiological and biochemical variables than CST and other conventional training in university football players with chronic LBP. Also, isokinetic training is relatively presumed as a new training protocol for different sports injuries in different games. The present study can be used to improve the physical therapist's knowledge and clinical decision skills on LBP in football players.
Acknowledgment
This project was supported by the Deanship of Scientific Research at Prince Sattam Bin Abdulaziz University under the research project no. 2020/03/11877.
Author contributions
Conceptualization: Gopal Nambi, Walid Kamal Abdelbasset, Saud F Alsubaie, Samah A Moawd, Anju Verma, Ayman K. Saleh, Nahla N. Ataalla.
Data curation: Gopal Nambi, Walid Kamal Abdelbasset, Saud F Alsubaie, Samah A Moawd, Anju Verma, Ayman K. Saleh.
Formal analysis: Gopal Nambi, Walid Kamal Abdelbasset, Saud F Alsubaie, Samah A Moawd, Anju Verma, Ayman K. Saleh, Nahla N. Ataalla.
Investigation: Gopal Nambi, Walid Kamal Abdelbasset, Saud F Alsubaie.
Methodology: Gopal Nambi, Walid Kamal Abdelbasset, Saud F Alsubaie, Samah A Moawd, Ayman K. Saleh, Nahla N. Ataalla.
Project administration: Gopal Nambi, Samah A Moawd, Ayman K. Saleh, Nahla N. Ataalla.
Resources: Gopal Nambi, Samah A Moawd, Ayman K. Saleh, Nahla N. Ataalla.
Software: Walid Kamal Abdelbasset, Saud F Alsubaie, Nahla N. Ataalla.
Supervision: Gopal Nambi, Walid Kamal Abdelbasset, Saud F Alsubaie, Anju Verma, Nahla N. Ataalla.
Validation: Gopal Nambi, Saud F Alsubaie, Ayman K. Saleh.
Visualization: Gopal Nambi, Walid Kamal Abdelbasset, Saud F Alsubaie, Ayman K. Saleh.
Writing – original draft: Gopal Nambi, Walid Kamal Abdelbasset, Saud F Alsubaie, Samah A Moawd, Anju Verma, Nahla N. Ataalla.
Writing – review & editing: Gopal Nambi, Walid Kamal Abdelbasset, Samah A Moawd, Anju Verma.
Footnotes
Abbreviations: CRP = C-reactive protein, CSA = cross sectional area, CST = core stabilization training, IKT = isokinetic training, IL = interleukin, LBP = low back pain, TNF = tumor necrosis factor, VAS = visual analog scale.
How to cite this article: Nambi G, Abdelbasset WK, Alsubaie SF, Moawd SA, Verma A, Saleh AK, Ataalla NN. Isokinetic training – its radiographic and inflammatory effects on chronic low back pain: a randomized controlled trial. Medicine. 2020;99:51(e23555).
The project was supported by the Deanship of scientific research, Prince Sattam Bin Abdulaziz University.
Ethical approval RHPT/020/002.
Prince Sattm bin Abdulaziz University.
The authors have no conflicts of interest to disclose.
The datasets generated during and/or analyzed during the current study are not publicly available, but are available from the corresponding author on reasonable request.
BMI = body mass index, CSA = cross sectional area, CST = core stabilization training, IKT = isokinetic training.
Non significant.
CSA = cross sectional area, CST = core stabilization training, IKT = isokinetic training, VAS = visual analog scale.
Non significant.
CST = core stabilization training, IKT = isokinetic training, IL = interleukin.
Non Significant.
References
- [1].Micheli LJ, Wood R. Back pain in young athletes. Arch Pediatr Adolesc Med 1995;149:15–8. [DOI] [PubMed] [Google Scholar]
- [2].Vos T, Allen C, Arora M, et al. Global, regional, and national incidence, prevalence, and years lived with disability for 310 diseases and injuries, 1990-2015: a systematic analysis for the Global Burden of Disease Study 2015. Lancet 2016;388:1545–602. [DOI] [PMC free article] [PubMed] [Google Scholar]
- [3].Ruhe A, Fejer R, Walker B. Is there a relationship between pain intensity and postural sway in patients with non-specific low back pain? BMC Musculoskelet Disord 2011;12:162. [DOI] [PMC free article] [PubMed] [Google Scholar]
- [4].Silsupadol P, Siu KC, Shumway-Cook A, et al. Training of balance under single- and dual-task conditions in older adults with balance impairment. Phys Ther 2006;86:269–81. [PubMed] [Google Scholar]
- [5].Ferreira ML, Sherrington C, Smith K, et al. Physical activity improves strength, balance and endurance in adults aged 40-65 years: a systematic review. J Physiother 2012;58:145–56. [DOI] [PubMed] [Google Scholar]
- [6].Frobell RB, Roos HP, Roos EM, et al. Treatment for acute anterior cruciate ligament tear: five year outcome of randomised trial. BMJ 2013;346:f232. [DOI] [PMC free article] [PubMed] [Google Scholar]
- [7].Emery CA, Meeuwisse WH. The effectiveness of a neuromuscular prevention strategy to reduce injuries in youth soccer: a cluster-randomized controlled trial. Br J Sports Med 2010;44:555–62. [DOI] [PubMed] [Google Scholar]
- [8].Nambi G, Kamal W, Shanmugananath ES, et al. Spinal manipulation plus laser therapy versus laser therapy alone in the treatment of chronic non-specific low back pain: a randomized controlled study. Eur J Phy Rehabil Med 2018;54:880–9. [DOI] [PubMed] [Google Scholar]
- [9].Thorborg K, Krommes KK, Esteve E, et al. Effect of specific exercise-based football injury prevention programmes on the overall injury rate in football: a systematic review and meta-analysis of the FIFA 11 and 11+ programmes. Br J Sports Med 2017;51:562–71. [DOI] [PubMed] [Google Scholar]
- [10].Finch CF, Doyle TL, Dempsey AR, et al. What do community football players think about different exercise training programmes? Implications for the delivery of lower limb injury prevention programmes. Br J Sports Med 2014;48:702–7. [DOI] [PMC free article] [PubMed] [Google Scholar]
- [11].Ho CW, Chen LC, Hsu HH, et al. Isokinetic muscle strength of the trunk and bilateral knees in young subjects with lumbar disc herniation. Spine 2005;30:E528–33. [DOI] [PubMed] [Google Scholar]
- [12].Dvir Z, Keting JL. Trunk extension effort in patients with chronic low back dysfunction. Spine 2003;28:685–92. [DOI] [PubMed] [Google Scholar]
- [13].Storheim K, Holm I, Gunderson R, et al. The effect of comprehensive group training on cross-sectional area, density, and strength of paraspinal muscles in patients sick-listed for subacute low back pain. J Spinal Disord Tech 2003;16:271–9. [DOI] [PubMed] [Google Scholar]
- [14].Calmes P, Jacob JF, Fayolle-Minon I, et al. Use of isokinetic techniques vs Standard physiotherapy in patients with chronic low back pain. Preliminary results. Ann Readapt Med Phys 2004;47:20–7. [DOI] [PubMed] [Google Scholar]
- [15].Lehman GJ, Hoda W, Oliver S. Trunk muscle activity during bridging exercises on and off a Swiss ball. Chiropr Osteopat 2005;13:14. [DOI] [PMC free article] [PubMed] [Google Scholar]
- [16].Hodges PW. Is there a role for transversus abdominis in lumbo-pelvic stability? Man Ther 1999;4:74–86. [DOI] [PubMed] [Google Scholar]
- [17].Marshall PW, Murphy BA. Core stability exercises on and off a Swiss ball. Arch Phys Med Rehabil 2005;86:242–9. [DOI] [PubMed] [Google Scholar]
- [18].Hides JA, Jull GA, Richardson CA. Long-term effects of specific stabilizing exercises for first-episode low back pain. Spine (Phila Pa 1976) 2001;26:E243–8. [DOI] [PubMed] [Google Scholar]
- [19].Prateek S, Nirmala N, Sudeep N, et al. Swiss ball versus mat exercises for core activation of transverse abdominis in recreational athletes. J Clin Diagn Res 2016;10:YC01–3. [DOI] [PMC free article] [PubMed] [Google Scholar]
- [20].Escamilla RF, Lewis C, Bell D, et al. Core muscle activation during Swiss ball and traditional abdominal exercises. J Orthop Sports Phys Ther 2010;40:265–76. [DOI] [PubMed] [Google Scholar]
- [21].Nambi G, Abdelbasset WK, Alqahtani BA, et al. Isokinetic back training is more effective than core stabilization training on pain intensity and sports performances in football players with chronic low back pain: A randomized controlled trial. Medicine 2020;99:21(e20418). [DOI] [PMC free article] [PubMed] [Google Scholar]
- [22].Joo Soo Yoon, Jin Hwan Lee, Jin Sang Kim. The effect of swiss ball stabilization exercise on pain and bone mineral density of patients with chronic low back pain. J Phys Ther Sci 2013;25:953–6. [DOI] [PMC free article] [PubMed] [Google Scholar]
- [23].Shahbandar L, Press J. Diagnosis and nonoperative management of lumbar disk herniation. Oper Tech Sports Med 2005;13:114–21. [Google Scholar]
- [24].Ferraz MB, Quaresma MR, Aquino LR, et al. Reliability of pain scales in the assessment of literature and illiterate patients with rheumatoid arthritis. J Rheumatol 1990;17:1022–4. [PubMed] [Google Scholar]
- [25].D’hooge R, Cagnie B, Crombez G, et al. Increased intramuscular fatty infiltration without differences in lumbar muscle cross sectional area during remission of unilateral recurrent low back pain. Man Ther 2012;12:584–8. [DOI] [PubMed] [Google Scholar]
- [26].Teyhen DS, George SZ, Dugan JL, et al. Inter-rater reliability of ultrasound imaging of the trunk musculature among novice raters. J Ultrasound Med 2011;30:347–56. [DOI] [PubMed] [Google Scholar]
- [27].Stein A, Panjwani A, Sison C, et al. Pilot study: elevated circulating levels of the pro inflammatory cytokine macrophage migration inhibitory factor in patients with chronic spinal cord injury. Arch Phys Med Rehabil 2013;94:1498–507. [DOI] [PubMed] [Google Scholar]
- [28].Barker KL, Shamley DR, Jackson D. Changes in the cross-sectional area of multifidus and psoas in patients with unilateral back pain: the relationship to pain and disability. Spine 2004;29:515–9. [DOI] [PubMed] [Google Scholar]
- [29].Ben Moussa Zouita A, Ben Salah FZ, Dziri C, et al. Comparison of isokinetic trunk flexion and extension torques and powers between athletes and nonathletes. J Exerc Rehabil 2018;14:72–7. [DOI] [PMC free article] [PubMed] [Google Scholar]
- [30].Zouita ABM, Zouita S, Dziri C, et al. Differences in Trunk Strength between Weightlifters and Wrestlers. J Hum Kinet 2019;5:5–15. [DOI] [PMC free article] [PubMed] [Google Scholar]
- [31].Mori A. Electromyographic activity of selected trunk muscles during stabilization exercises using a gym ball. Electromyogr Clin Neurophysiol 2004;44:57–64. [PubMed] [Google Scholar]
- [32].Tiedemann A, Sherrington C, Lord SR. The role of exercise for fall prevention in older age. Motriz-Revista De Educacao Fisica 2013;19:541–7. [Google Scholar]
- [33].Lee JC, Cha JG, Kim Y, et al. Quantitative analysis of back muscle degeneration in the patients with the degenerative lumbar flat back using a digital image analysis: comparison with the normal controls. Spine 2008;33:318–25. [DOI] [PubMed] [Google Scholar]
- [34].Paalanne N, Niinim̈aki J, Karppinen J, et al. Assessment of association between low back pain and para spinal muscle atrophy using opposed-phase magnetic resonance imaging: a population-based study among young adults. Spine 2011;36:1961–8. [DOI] [PubMed] [Google Scholar]
- [35].Gebhardt K, Brenner H, Stürmer T, et al. The course of high-sensitive C-reactive protein in correlation with pain and clinical function in patients with acute lumbosciatic pain and chronic low back pain - a 6 months prospective longitudinal study. Eur J Pain 2006;10:711–9. [DOI] [PubMed] [Google Scholar]
- [36].Perry CD, Alekel DL, Ritland LM, et al. Centrally located body fat is related to inflammatory markers in healthy postmenopausal women. Menopause 2008;15:619–27. [DOI] [PMC free article] [PubMed] [Google Scholar]
- [37].Ford ES. Does exercise reduce inflammation? physical activity and c-reactive protein among us adults. Epidemiology 2002;13:561–8. [DOI] [PubMed] [Google Scholar]
- [38].da Cruz Fernandes IM, Pinto RZ, Ferreira P, et al. Low back pain, obesity, and inflammatory markers: exercise as potential treatment. J Exerc Rehabil 2018;14:168–74. [DOI] [PMC free article] [PubMed] [Google Scholar]
- [39].Libardi CA, De Souza GV, Cavaglieri CR, et al. Effect of resistance, endurance, and concurrent training on TNF-α, IL-6, and CRP. Med Sci Sports Exerc 2012;44:50–6. [DOI] [PubMed] [Google Scholar]