

Abstract
Bile acids (BAs) are known to regulate BA synthesis and transport by the farnesoid X receptor in the liver (FXR-SHP) and intestine (FXR-Fgf15). However, the relative importance of individual BAs in regulating these processes is not known. Therefore, mice were fed various doses of five individual BAs, including cholic acid (CA), chenodeoxycholic acid (CDCA), deoxoycholic acid (DCA), lithocholic acid (LCA), and ursodeoxycholic acid (UDCA) in their diets at various concentrations for one week to increase the concentration of one BA in the enterohepatic circulation. The mRNA of BA synthesis and transporting genes in liver and ileum were quantified. In the liver, the mRNA of SHP, which is the prototypical target gene of FXR, increased in mice fed all concentrations of BAs. In the ileum, the mRNA of the intestinal FXR target gene Fgf15 was increased at lower doses and to a higher extent by CA and DCA than by CDCA and LCA. Cyp7a1, the rate-limiting enzyme in BA synthesis, was decreased more by CA and DCA than CDCA and LCA. Cyp8b1, the enzyme that 12-hydroxylates BAs and is thus responsible for the synthesis of CA, was decreased much more by CA and DCA than CDCA and LCA. Surprisingly, neither a decrease in the conjugated BA uptake transporter (Ntcp) nor increase in BA efflux transporter (Bsep) was observed by FXR activation, but an increase in the cholesterol efflux transporter (Abcg5/Abcg8) was observed with FXR activation. Thus in conclusion, CA and DCA are more potent FXR activators than CDCA and LCA when fed to mice, and thus they are more effective in decreasing the expression of the rate limiting gene in BA synthesis Cyp7a1 and the 12-hydroxylation of BAs Cyp8b1, and are also more effective in increasing the expression of Abcg5/Abcg8, which is responsible for biliary cholesterol excretion. However, feeding BAs do not alter the mRNA or protein levels of Ntcp or Bsep, suggesting that the uptake or efflux of BAs is not regulated by FXR at physiological and pharmacological concentrations of BAs.
Keywords: Bile acids, Transporters, Liver
Introduction
Bile acids (BAs) generate bile flow, and as physiological detergents facilitate intestinal absorption of lipids and vitamins (Russell, 2003; Chiang, 2009). BAs are also critical signaling molecules that mediate nutrient homeostasis and energy expenditure. The BA concentrations in the body are dependent on hepatic synthesis, biliary secretion, intestinal re-absorption, and hepatic uptake of BAs. The BA-biosynthetic enzyme in liver, cytochrome-P450 7a1 (Cyp7a1), is the rate-limiting enzyme in the classic pathway of BA synthesis. Two critical enzymes responsible for the synthesis of BAs in the alternative pathway are Cyp27a1 and Cyp7b1 (Russell, 2003; Chiang, 2009).
Various transporters are important in mediating the disposition of BAs in the body (Zhang and Klaassen, 2010). In liver, conjugated BAs are thought to be actively taken up into hepatocytes by the sodium-dependent taurocholate co-transporting polypeptide (Ntcp/Slc10a1), which is located on the sinusoidal membrane of hepatocytes. In addition, the organic anion transporting polypeptide 1b2 (Oatp1b2/Slco1b2) is responsible for the sodium-independent uptake of unconjugated BAs into liver (Csanaky et al., 2011). BAs in hepatocytes are excreted into bile at the canalicular membrane of hepatocytes by an ATP-dependent transporter, the bile salt export pump (Bsep, Abcb11) (Wang et al., 2001). The heterodimer Abcg5/Abcg8, which is also located on the canalicular membrane of hepatocytes, mediates biliary excretion of cholesterol into bile. There are also BA-efflux transporters located at the sinusoidal membrane of hepatocytes. The multidrug resistance-associated proteins (Mrp3/Abcc3 and Mrp4/Abcc4) and the heterodimer organic solute transporter (Ostα/β) transports BAs and other solutes from hepatocytes back into the systemic circulation (Ballatori et al., 2008; Rao et al., 2008). In the intestine, the apical sodium dependent bile acid transporter (Asbt, Slc10a2) is important for bile acid uptake from the ileal lumen, and it represents a highly efficient mechanism for the conservation of bile acids. Mutation of human ASBT leads to abolished taurocholate transport (Wong et al., 1995), and targeted disruption of Asbt in mice eliminates enterohepatic cycling of bile acids (Dawson et al., 2003).
BAs are thought to regulate their own homeostasis via their sensor, the farnesoid X receptor (FXR/Nr1h4) (Makishima et al., 1999; Parks et al., 1999; Wang et al., 1999). Activation of FXR increases the expression of its target gene SHP/Nr0b2, which represses the key BA-biosynthetic enzyme Cyp7a1 (Goodwin et al., 2000). This is often referred to as the hepatic FXR-SHP signaling pathway. A second mechanism underlying the regulation of Cyp7a1 mRNA expression is through the intestinal FXR-fibroblast growth factor 15 (Fgf15) pathway. Fgf15 is released from the intestine, and thought to travel via the portal vein to the liver, where it activates the cell surface fibroblast growth factor receptor 4 (Fgfr4) (Inagaki et al., 2005). It has been suggested that activation of Fgfr4 triggers the phosphatidylinositol-3-kinase (PI3K) signaling pathway, which inhibits the transcription factor forkhead box protein O1 (FoxO1), ultimately causing repression of hepatic Cyp7a1 (Shin and Osborne, 2009); whereas another study shows that deficiency of both Erk and Jnk prevents the Fgf15-mediated suppression of Cyp7a1 and Cyp8b1 (Kong et al., 2012).
In addition to the major bile acid sensor FXR, this laboratory has also shown that lithocholic acid (LCA) is a ligand for PXR, and activation of PXR is critically involved in the protection against LCA-mediated hepatotoxicity (Staudinger et al., 2001). In addition, Nrf2, a well-known sensor for oxidative stress and electrophiles, has been shown recently to be a major determinant of bile acid homeostasis in liver and intestine during bile acid-mediated cholestatic injuries in mice (Weerachayaphorn et al., 2012). Therefore, the signaling of FXR, PXR and Nrf2 will be examined in the present study.
FXR activation in cholestatic animal models has been shown to repress the expression of BA uptake transporters, such as Ntcp, Oatp1a1, and Oatp1b2 (Gartung and Matern, 1997; Gartung et al., 1997) and enhance the expression of the BA efflux transporter, Bsep (Fickert et al., 2001; Plass et al., 2002; Cui et al., 2009; Tanaka et al., 2009). These studies have provided mechanistic insights into the regulation of bile acid homeostasis during pathological conditions. However, the regulation of bile acid homeostasis during physiologically relevant concentrations remains to be determined. Considering the clinical relevance that bile acids and their sequestrants have been used as dietary supplements to treat diabetes (Kobayashi et al., 2007) and promote cholesterol absorption (Woollett et al., 2004), it is important to investigate the effect of dietary supplementation of bile acids below hepatotoxic concentrations on bile acid signaling pathways in vivo.
This laboratory has recently developed a highly sensitive and quantitative UPLC–MS/MS analytical method to determine various individual BAs in their conjugated and unconjugated forms in liver and other compartments of mice (Alnouti et al., 2008; Zhang and Klaassen, 2010; Zhang et al., 2011; Cui et al., 2012; Fu et al., 2012; Zhang et al., 2012b). Using this method, we have 1) demonstrated that during bile acid dietary supplementation (as utilized in the present study), bile acid feeding increased the hepatic and serum concentrations of that bile acid administered in a dose-dependent manner, as well as their known and novel metabolites; 2) unveiled the minimal concentrations of each BA in the feed that cause hepatotoxicity and compared the relative hepatototoxicity of different BAs; and 3) demonstrated that although individual BA feeding increased that particular BA in liver, the total hepatic BAs in general remained unchanged compared to mice fed a control diet (Zhang and Klaassen, 2010; Song et al., 2011).
Thus, during the last fifteen years, a marked increase in knowledge has accumulated about the regulation of BA synthesis and transport. However, these data have generally been done with a mixture of BAs and with high doses of BAs. Therefore, the purpose of this study is to use an experimental model, which is to feed mice multiple doses of various individual BAs, to determine whether there are differences in individual BAs to activate FXR to decrease BA synthetic enzymes and the uptake transporter Ntcp, as well as increase the BA efflux transporter Bsep in liver.
Materials and methods
Animal experiments.
Male C57BL/6 mice (22 ± 2 g), at 8-weeks of age, were obtained from Charles River Laboratories, Inc. (Wilmington, MA). Mice were housed with a 12:12 h light:dark cycle and fed mouse chow and water ad libitum according to the American Animal Association Laboratory Animal Care Guidelines. Mice were acclimated to the housing facility and placed on ground rodent diet (Teklad Rodent Diet #8064, Harlan Teklad, Madison, WI) for one week. The diet was then replaced with one supplemented with various BAs, including cholic acid (CA, 0.03–0.1%, w/w), chenodeoxycholic acid (CDCA, 0.03–0.3%), deoxycholic acid (DCA, 0.03–0.3%), lithocholic acid (LCA, 0.01–0.3%), or ursodeoxycholic acid (UDCA, 1.0–3.0%) (Sigma, St. Louis, MO) in their diets (n = 5 per group). After 7 days of feeding the BA-supplemented diets, livers and ilea were removed, frozen in liquid nitrogen, and stored at −80 °C before RNA and protein assays. These diets did not affect body weight of the mice (Song et al., 2011). Serum and liver concentrations of the various BAs in these mice as well as measures of hepatotoxicity have been reported in a previous publication (Song et al., 2011). All animal procedures were reviewed and approved by the Institutional Animal Care and Use Committee at KUMC.
Total RNA extraction.
Total RNA was extracted from liver and ileum tissues using RNABee reagent (Tel-test Inc., Friendswood, TX) as suggested by the manufacturer’s protocol. RNA was quantified by UV spectrophotometry at 260 nm and diluted to 25 ng/μl in diethyl pyrocarbamate (DEPC)-treated double distilled water.
QuantiGene Plex assay.
Messenger RNAs for mouse genes involved in BA synthesis and hepatic BA transporters were quantified using the QuantiGene Plex 2.0 assay (Panomics/Affymetrix, Fremont, CA). Individual bead-based oligonucleotide probe sets were designed by Panomics/Affymetrix, Inc. using previously published NCBI gene accession numbers (panel IDs: 21140, 21065, and 21150). Assays were performed following the manufacturer’s protocol (Panomics/Affymetrix, Fremont, CA). Briefly, isolated RNA (250 ng) was hybridized overnight at 54 °C to specific oligonucleotide sequences, corresponding to the genes of interest that were bound to capture beads. A linearity test was done prior to the analysis. The following day the hybridized RNA, oligos, and capture beads were pipetted onto a filter plate. The complex was then sequentially hybridized to the pre-amplifier, followed by the amplifier, and lastly the biotinylated label probe (each for 1 h at 50 °C on a shaking platform). Streptavidin–phycoerythrin was then allowed to bind for 30 min at room temperature on a shaking platform. Fluorescence was detected and analyzed with a Bioplex 200 system array reader with Luminex xMAP technology (Bio-Rad, Hercules, CA). The housekeeper gene, Gapdh, was used to normalize the data. The data are expressed as a ratio of the relative light units of the target gene mRNA relative to Gapdh mRNA.
Membrane protein preparation and Western blotting.
One hundred milligrams of liver were homogenized in 900 μl of ST buffer (150 mM sucrose, 10 mM Tris, proteinase inhibitor 1 tablet/50 ml), followed by centrifugation at 100,000 g at 4 °C for 1 h. The supernatant was removed and the membrane pellet was re-suspended in ST buffer. Fifty micrograms of membrane proteins from each sample was mixed with an equal volume of loading buffer (Laemmli sample buffer containing 5% β-mercaptoethanol). The proteins were resolved by 10% SDS-PAGE and transferred to PVDF membranes. Membranes were blocked using 5% non-fat milk for 10 min each, followed by 3 washes of 10 min each with PBST. The membranes were incubated with primary antibodies, rabbit anti-rat/mouse Ntcp (K4), or rabbit anti-rat/mouse Bsep (K44) (1:2000 dilution in 2% milk/PBS) for 2 h. These primary antibodies were obtained from Dr. Bruno Steiger (University Hospital, Zurich, Switzerland). After washing three times for 10 min each, the membranes were incubated with HRP-coupled secondary antibody (donkey anti-rabbit, Amersham Life Science 1:2000) for 1 h. Membranes were washed three times in PBST buffer for 10 min each. Protein–antibody complexes were detected using an enhanced chemiluminescent kit (Pierce Biotechnology, Rockford, IL). After the film was developed by X-ray, the intensity was quantified using Scion Image beta 4.03 software (Scion Corporation, Frederick, MD). The data were normalized to β-actin protein and expressed as relative protein expression (% β-actin).
Statistics.
Differences between multiple groups were analyzed by one-way ANOVA followed by Duncan’s post-hoc test. Statistical significance was considered at p < 0.05.
Results
Effect of feeding BAs on mRNA expression of BA-synthetic enzymes in liver
To determine the dose response of the five BAs on mRNA expression of BA-synthetic enzymes, mRNAs of enzymes involved in the classic BA-synthetic pathway as well as the alternative BA-biosynthetic pathway were quantified. After feeding BAs for one week, Cyp7a1 mRNA expression was reduced markedly (about 90%) by all BA concentrations fed the mice (Fig. 1). Cyp8b1 was also down-regulated by BAs, namely CA at all doses, CDCA at 0.3%, DCA at all doses, LCA at 0.3%, and UDCA at doses above 0.1%.
Fig. 1.
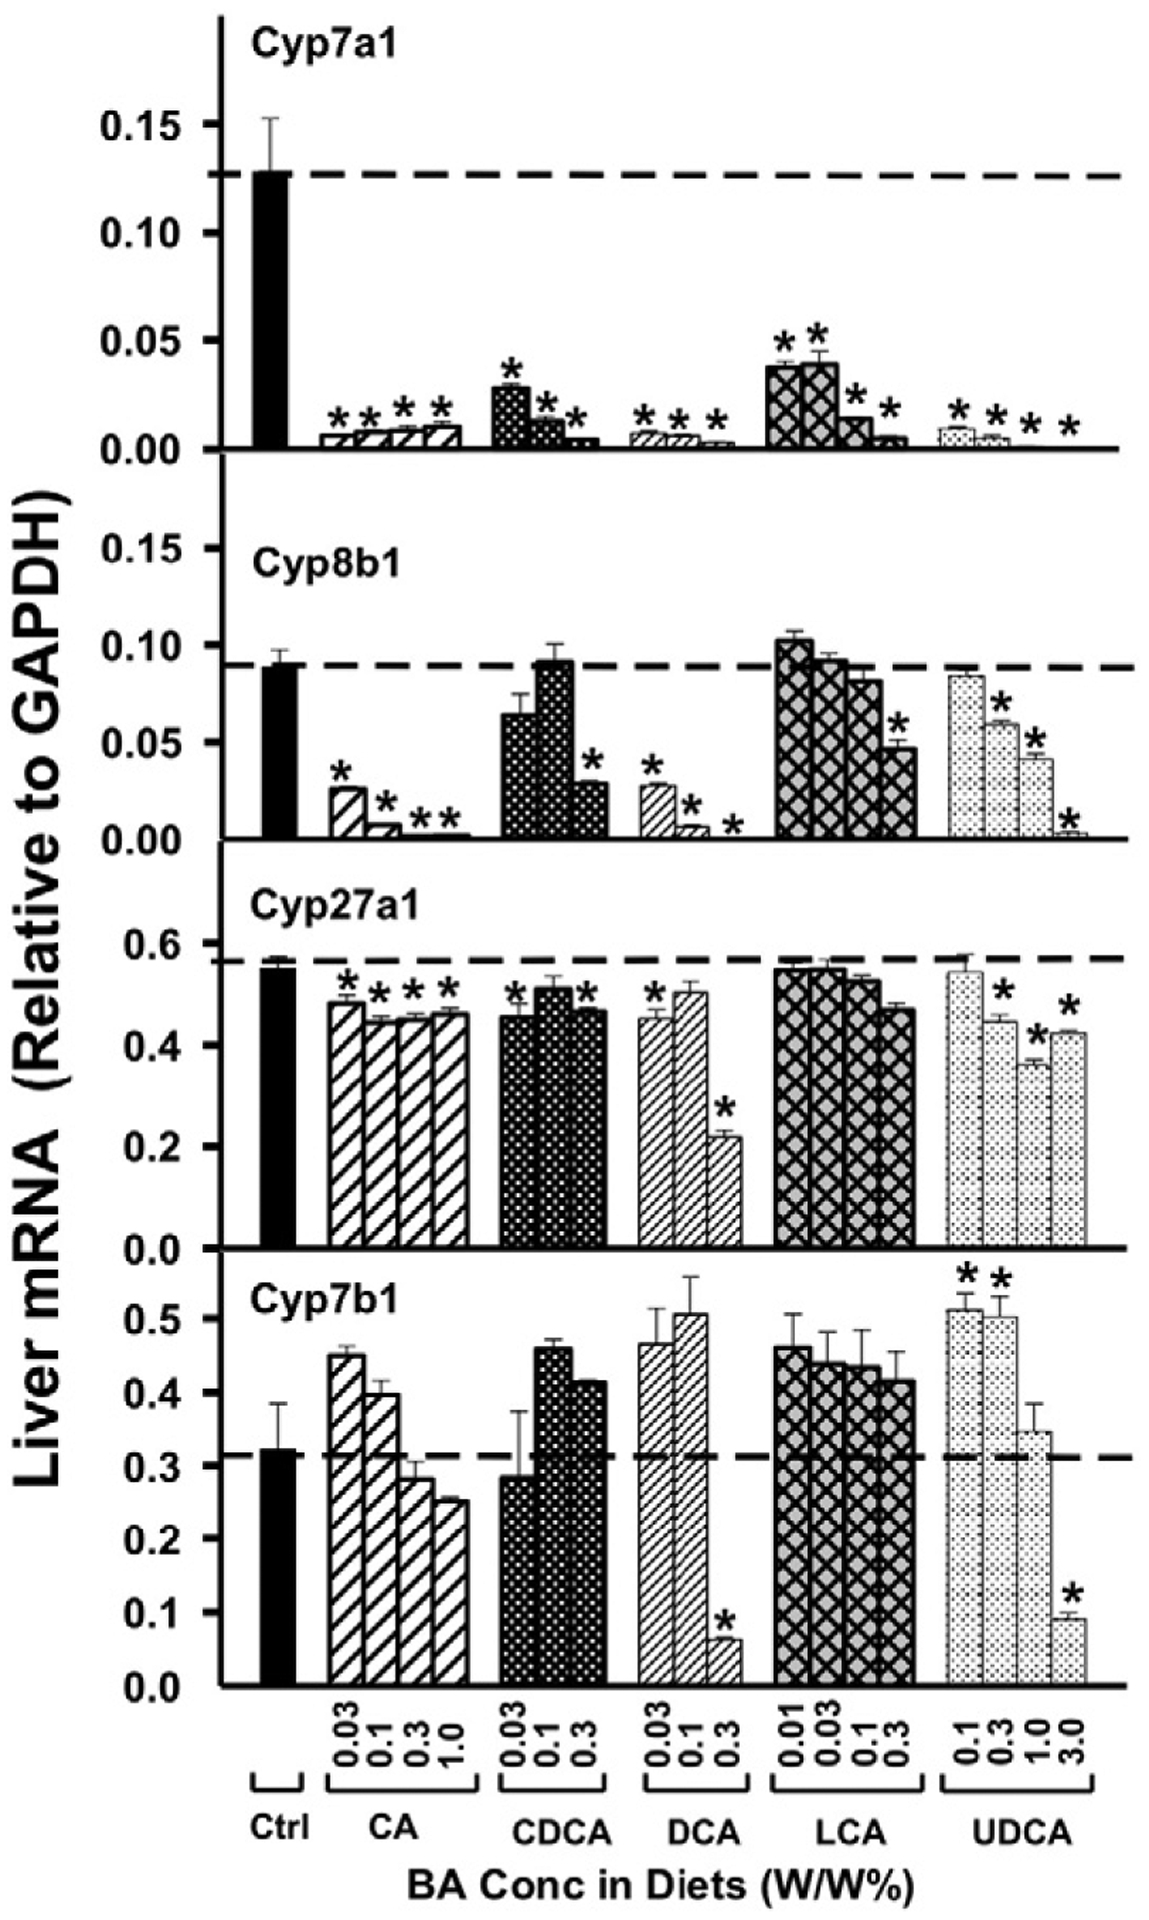
The mRNAs of BA-biosynthetic enzymes in liver, namely Cyp7a1, 8b1, 27a1, and 7b1, were quantified by the QuantiGene Plex 2.0 assay. Total RNAs were isolated from mice treated with various BAs at various concentrations in diets (n = 5 per group). Data are normalized to Gapdh mRNA, and are expressed as mean ± SE. Asterisks represent statistically significant changes compared to Control.
Feeding mice BAs in general resulted in relatively small changes in the mRNA of Cyp27a1 (Fig. 1). Only CA decreased Cyp27a1 mRNA at all doses. Both CDCA and DCA decreased Cyp27a1 mRNA at 0.03%, and UDCA decreased Cyp27a1 mRNA at doses above 0.3%. BA-feeding did not markedly alter the mRNA of Cyp7b1, in that only DCA and UDCA decreased Cyp7b1 at their highest doses (0.3% and 3.0%, respectively), and in fact, UDCA-feeding resulted in a moderate increase in the Cyp7b1 mRNA at 0.1 and 0.3% in the diet.
Effect of feeding BAs on mRNA expression of uptake transporters in liver
As shown in Fig. 2, in contrast to what was expected, there was no marked dose-dependent decrease in the mRNA of Ntcp by BA-feeding. CDCA did not alter Ntcp expression; CA-feeding only decreased moderately the mRNA of Ntcp at 0.3% and 1.0% concentrations; LCA slightly decreased Ntcp mRNA at the highest concentration only; UDCA slightly decreased Ntcp mRNA at 0.3% and 1.0%; and only DCA decreased Ntcp mRNA at all doses.
Fig. 2.
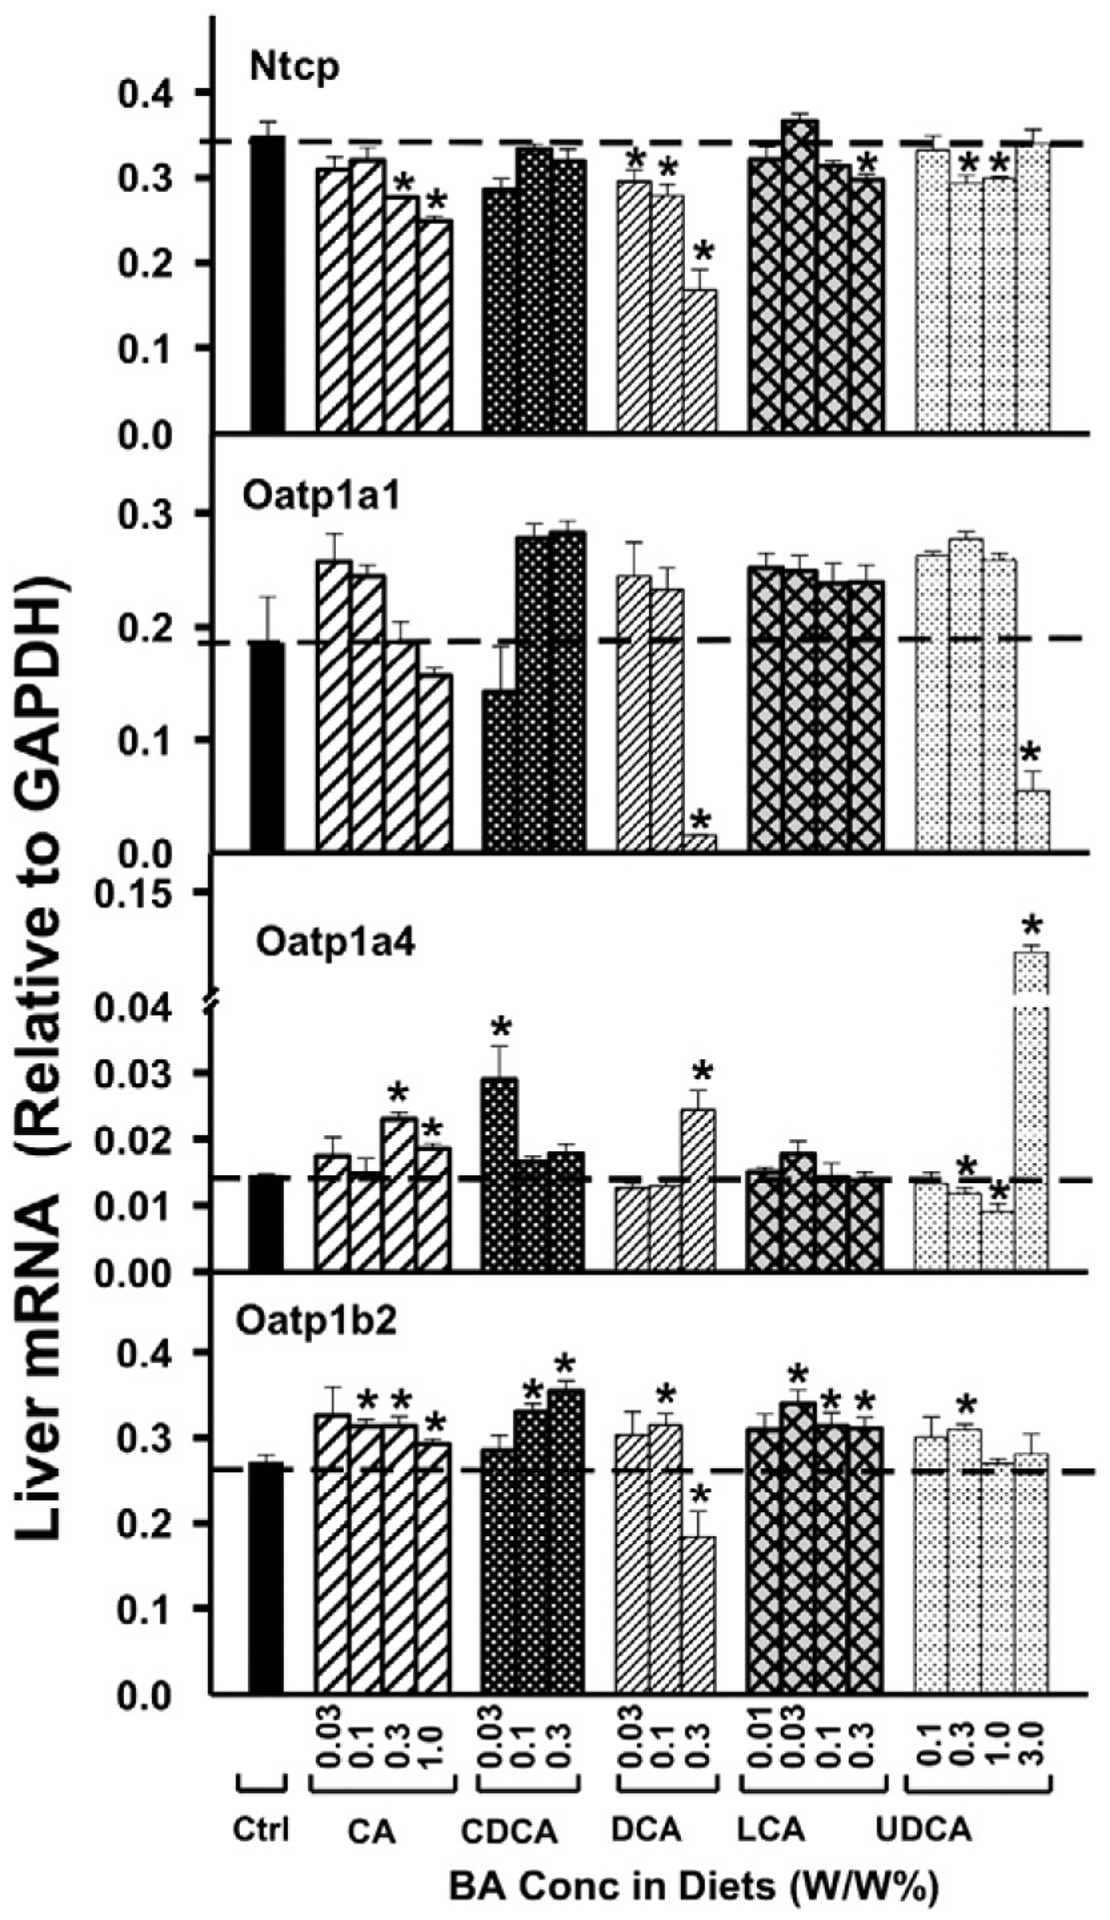
The mRNAs of BA-uptake transporters in liver, namely Ntcp, Oatp1a1, Oatp1a4, and Oatp1b2, were quantified by the QuantiGene Plex 2.0 assay. Total RNAs were isolated from mice treated with various BAs at various concentrations in diets (n = 5 per group). Data are normalized to Gapdh mRNA, and are expressed as mean ± SE. Asterisks represent statistically significant changes compared to Control.
Oatp1a1 mRNA was not altered markedly by BA feeding, except for the highest doses of DCA and UDCA, which decreased Oatp1a1 (Fig. 2). Oatp1a4 mRNA was also not altered markedly by feeding BAs, with the exception of the highest dose of UDCA that increased Oatp1a4 nearly 10 folds. For Oatp1b2, which has been shown to transport BAs in vivo (Csanaky et al., 2011), the BAs produced only small increases in the mRNA, except for the highest concentration of DCA, which modestly decreased it.
Effect of feeding BAs on mRNA expression of hepatic efflux transporters located in the canalicular membrane of hepatocytes
The effects of BA-supplemented diets on Bsep mRNA are shown in Fig. 3. CA was the only BA that increased Bsep mRNA (35%), and this occurred only with the high doses of CA. CDCA and LCA produced small (25–35%), but statistically significant decreases in Bsep mRNA. The three lower concentrations of UDCA also decreased Bsep mRNA. For Mrp2, feeding mice BAs had relatively minor effects on its mRNA content, except for a 60% increase with the highest dose of UDCA (Fig. 3).
Fig. 3.
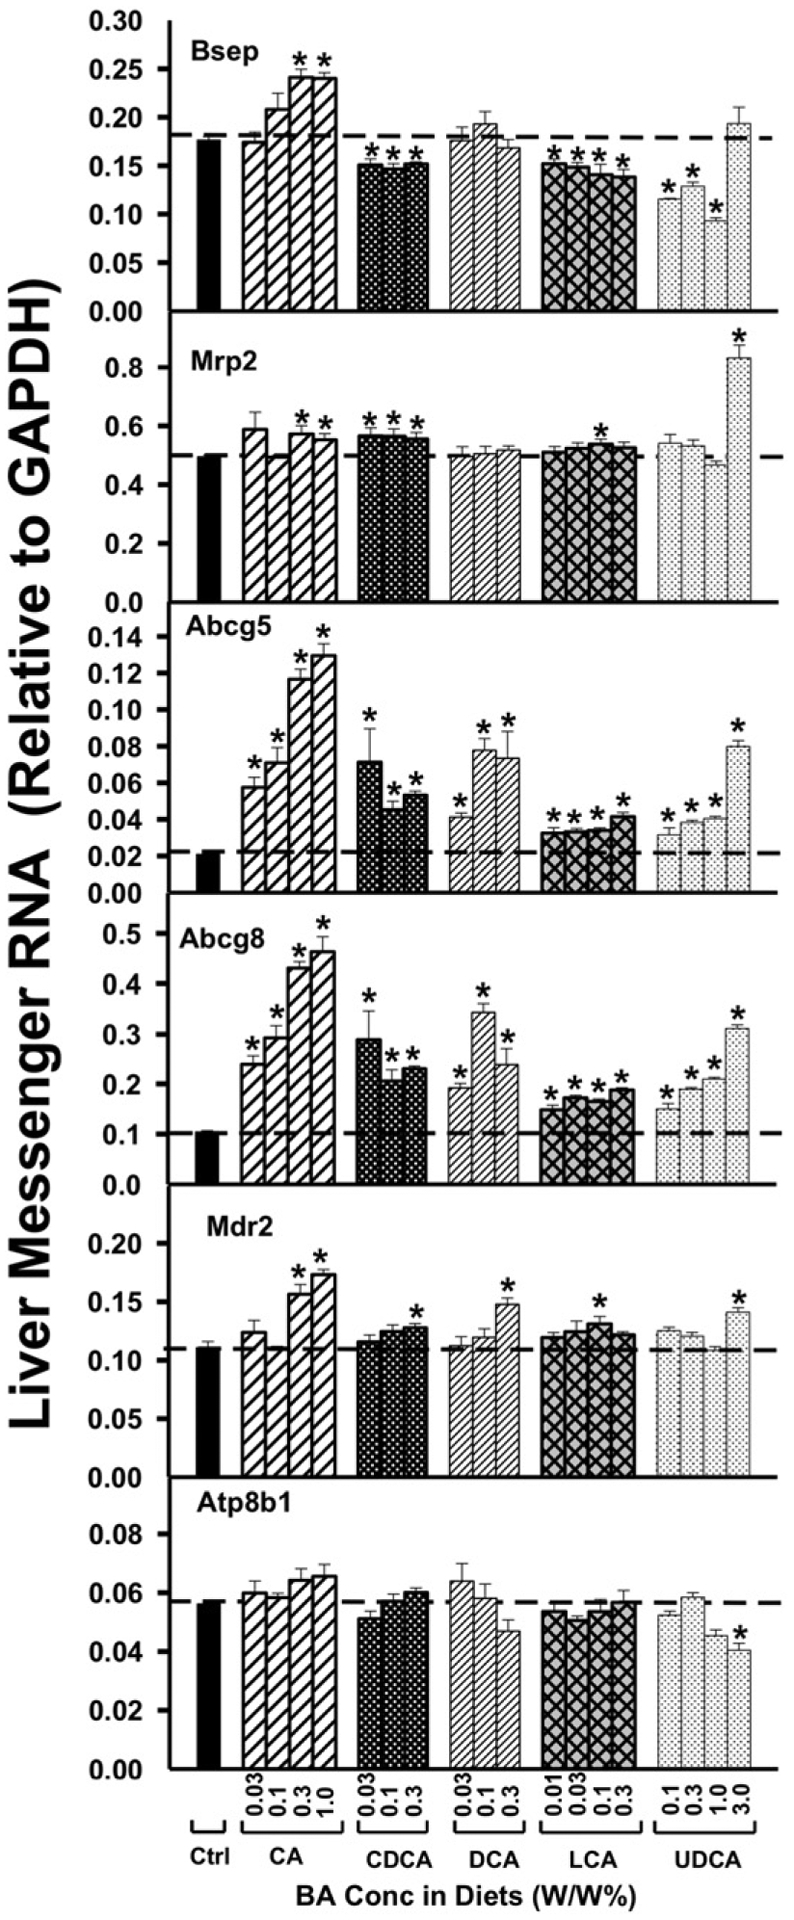
The mRNAs of the canalicular transporters in liver, namely Bsep, Mrp2, Abcg5, Abcg8, Mdr2, and Atp8b1, were quantified by the QuantiGene Plex 2.0 assay. Total RNAs were isolated from mice treated with various BAs at various concentrations in diets (n = 5 per group). Data are normalized to Gapdh mRNA, and are expressed as mean ± SE. Asterisks represent statistically significant changes compared to Control.
Interestingly, for the cholesterol efflux transporters, Abcg5 and Abcg8, all five bile acids at all doses tested increased markedly Abcg5 mRNA expression. More specifically, CA, DCA, and UDCA increased Abcg5 mRNA in a dose-dependent manner. Similarly, Abcg8 mRNA was increased by all bile acids. CA and UDCA increased Abcg8 mRNA in a dose-dependent manner. Collectively, these studies demonstrate that Abcg5 and Abcg8 are up-regulated by all five BAs.
For the phospholipid floppase Mdr2, a moderate increase in its mRNA expression was observed only at high doses of BA-feeding, namely CA above 0.3%; CDCA, DCA and UDCA at their highest doses; and LCA at 0.1%. The mRNA of the amino-phospholipid flippase, Atp8b1 was also not altered markedly by BA-feeding, except for a moderate decrease at the highest dose of UDCA.
Effect of feeding BAs on mRNA expression of hepatic efflux transporters located in sinusoidal membrane of hepatocytes
As shown in Fig. 4, feeding mice BAs (CA, CDCA, and LCA) produced a small (about 20%) but statistically significant increase in Mrp3 mRNA, but UDCA at the highest dose (3.0%) markedly increased Mrp3 mRNA (approximately 4-fold). Similarly, UDCA at the highest dose also markedly increased the mRNA of Mrp4 (approximately 4-fold), however, other BAs did not alter Mrp4 mRNA at any dose.
Fig. 4.
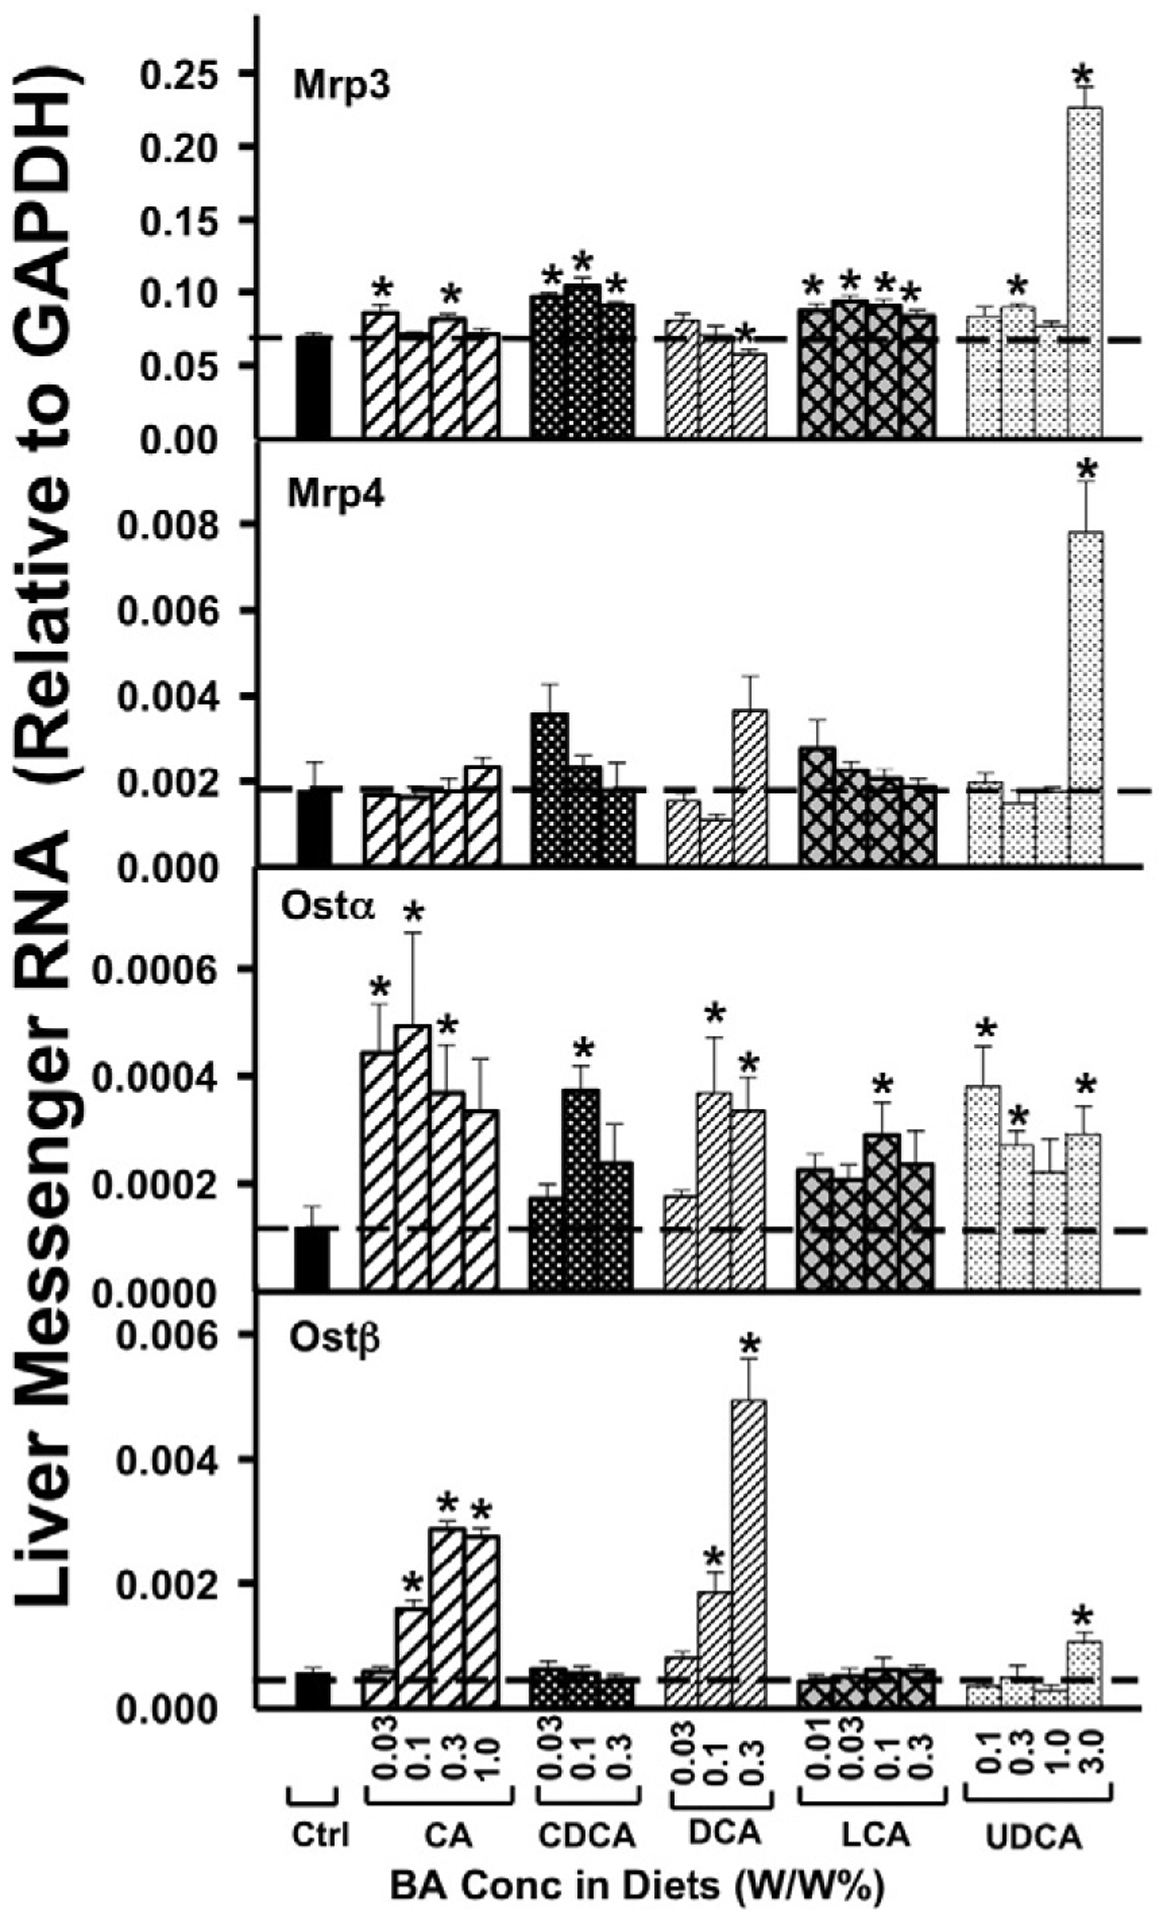
The mRNAs of the sinusoidal BA-efflux transporters in liver, namely Mrp3, Mrp4, Ostα, and Ostβ, were quantified by the QuantiGene Plex 2.0 assay. Total RNAs were isolated from mice treated with various BAs at various concentrations in diets (n = 5 per group). Data are normalized to Gapdh mRNA, and are expressed as mean ± SE. Asterisks represent statistically significant changes compared to Control.
As shown in Fig. 4, in general, each of the five BAs tended to increase Ostα mRNA. However, Ostβ mRNA was only increased dose-dependently by CA and DCA, as well as the highest doses of UDCA. In contrast to Ostα, Ostβ mRNA was not altered by either CDCA or LCA.
Effect of feeding BAs on protein expression of major BA transporters in liver
As shown in Figs. 5a and b, the Western blots indicate that after BA feeding (0.1% in the diets), the major BA-uptake transporter protein, Ntcp, and the major BA-efflux transporter protein, Bsep, were not altered except for feeding 0.1% UDCA, which increased Ntcp protein.
Fig. 5.
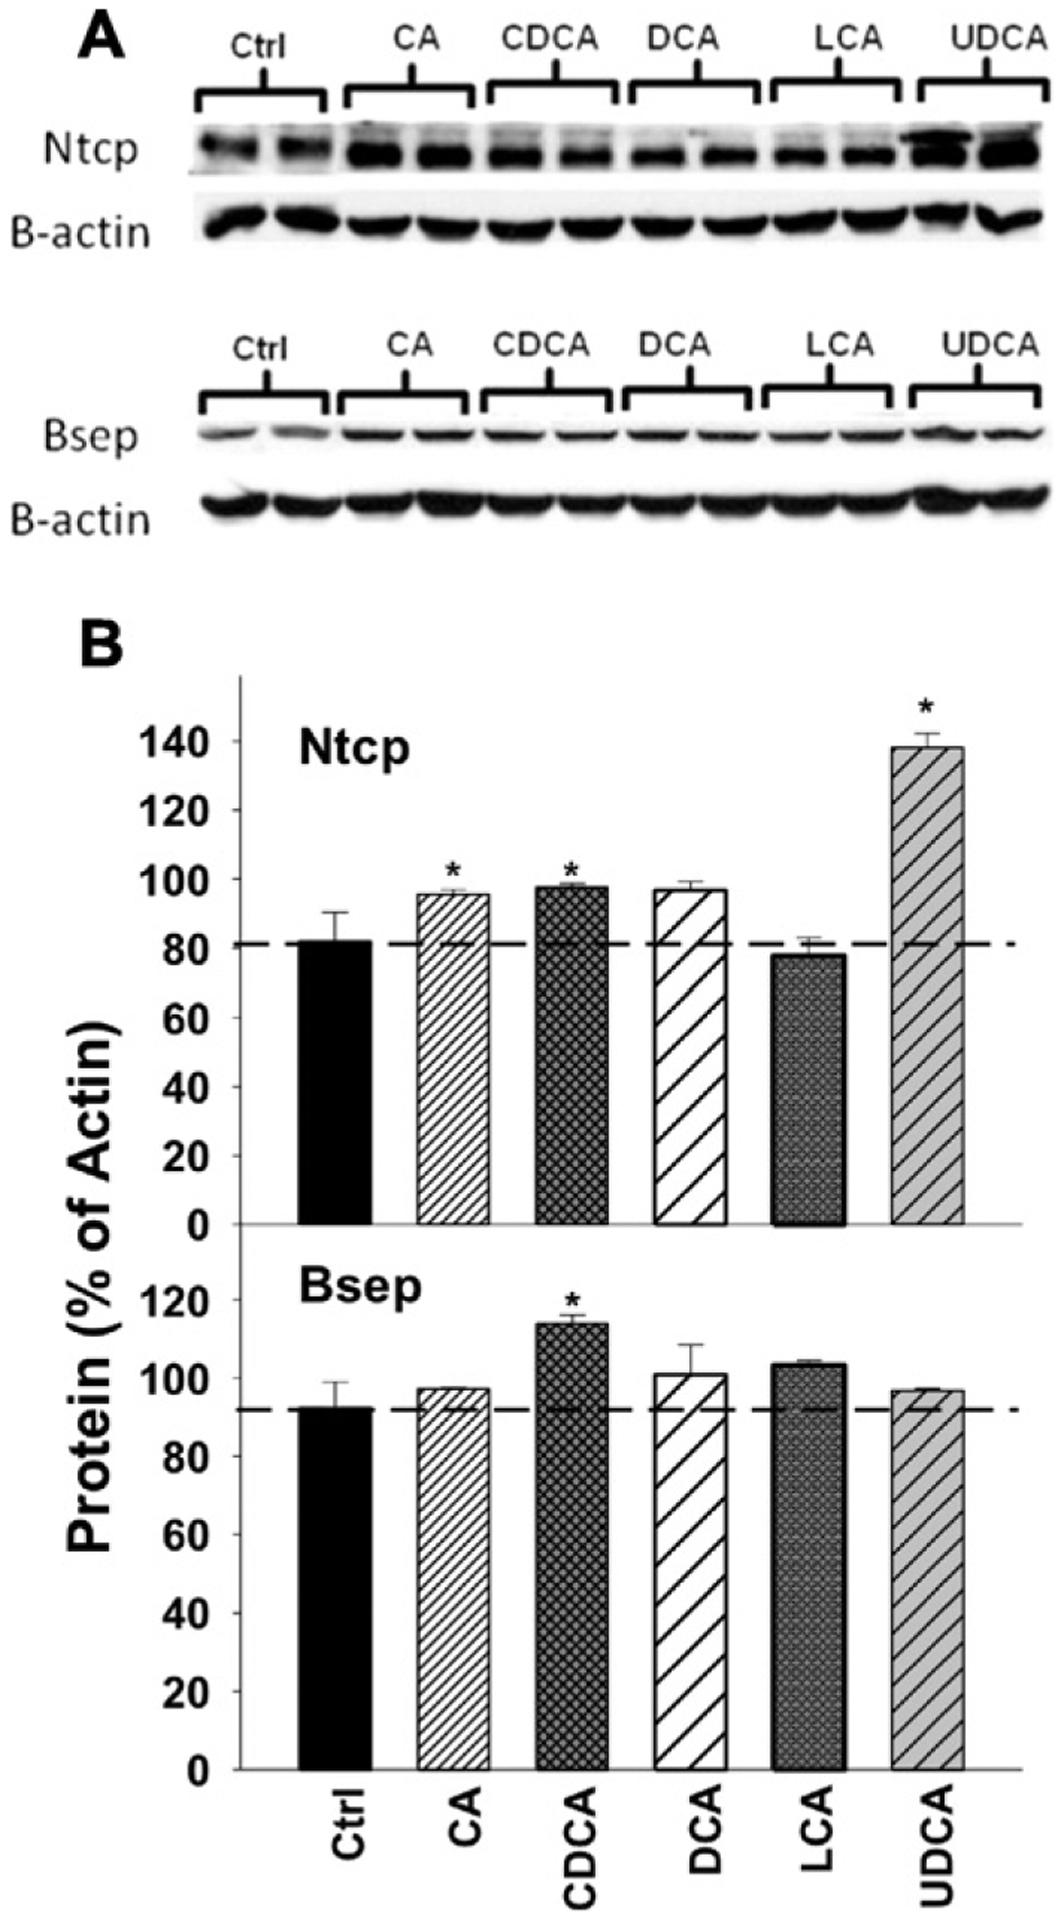
A: The proteins of Ntcp and Bsep were quantified by Western blotting analysis in control and mice fed with 0.1% BAs in diets (n = 2 mice per group per protein). The β-actin protein was used as a loading control. B: The protein densities on the blots were quantified for Ntcp and Bsep protein expression. Data are expressed as mean percentages of β-actin protein ± SE. Asterisks represent statistically significant changes compared to Control.
Effect of feeding BAs on mRNA expression of nuclear receptors and their target genes in liver
As shown in Fig. 6A, FXR mRNA was not altered by any of the BAs, except for the highest dose of UDCA, which increased FXR mRNA. In contrast, the FXR-target gene SHP (Fig. 6B) was increased by all BAs and at all doses tested, suggesting that FXR is activated by all five BAs.
Fig. 6.
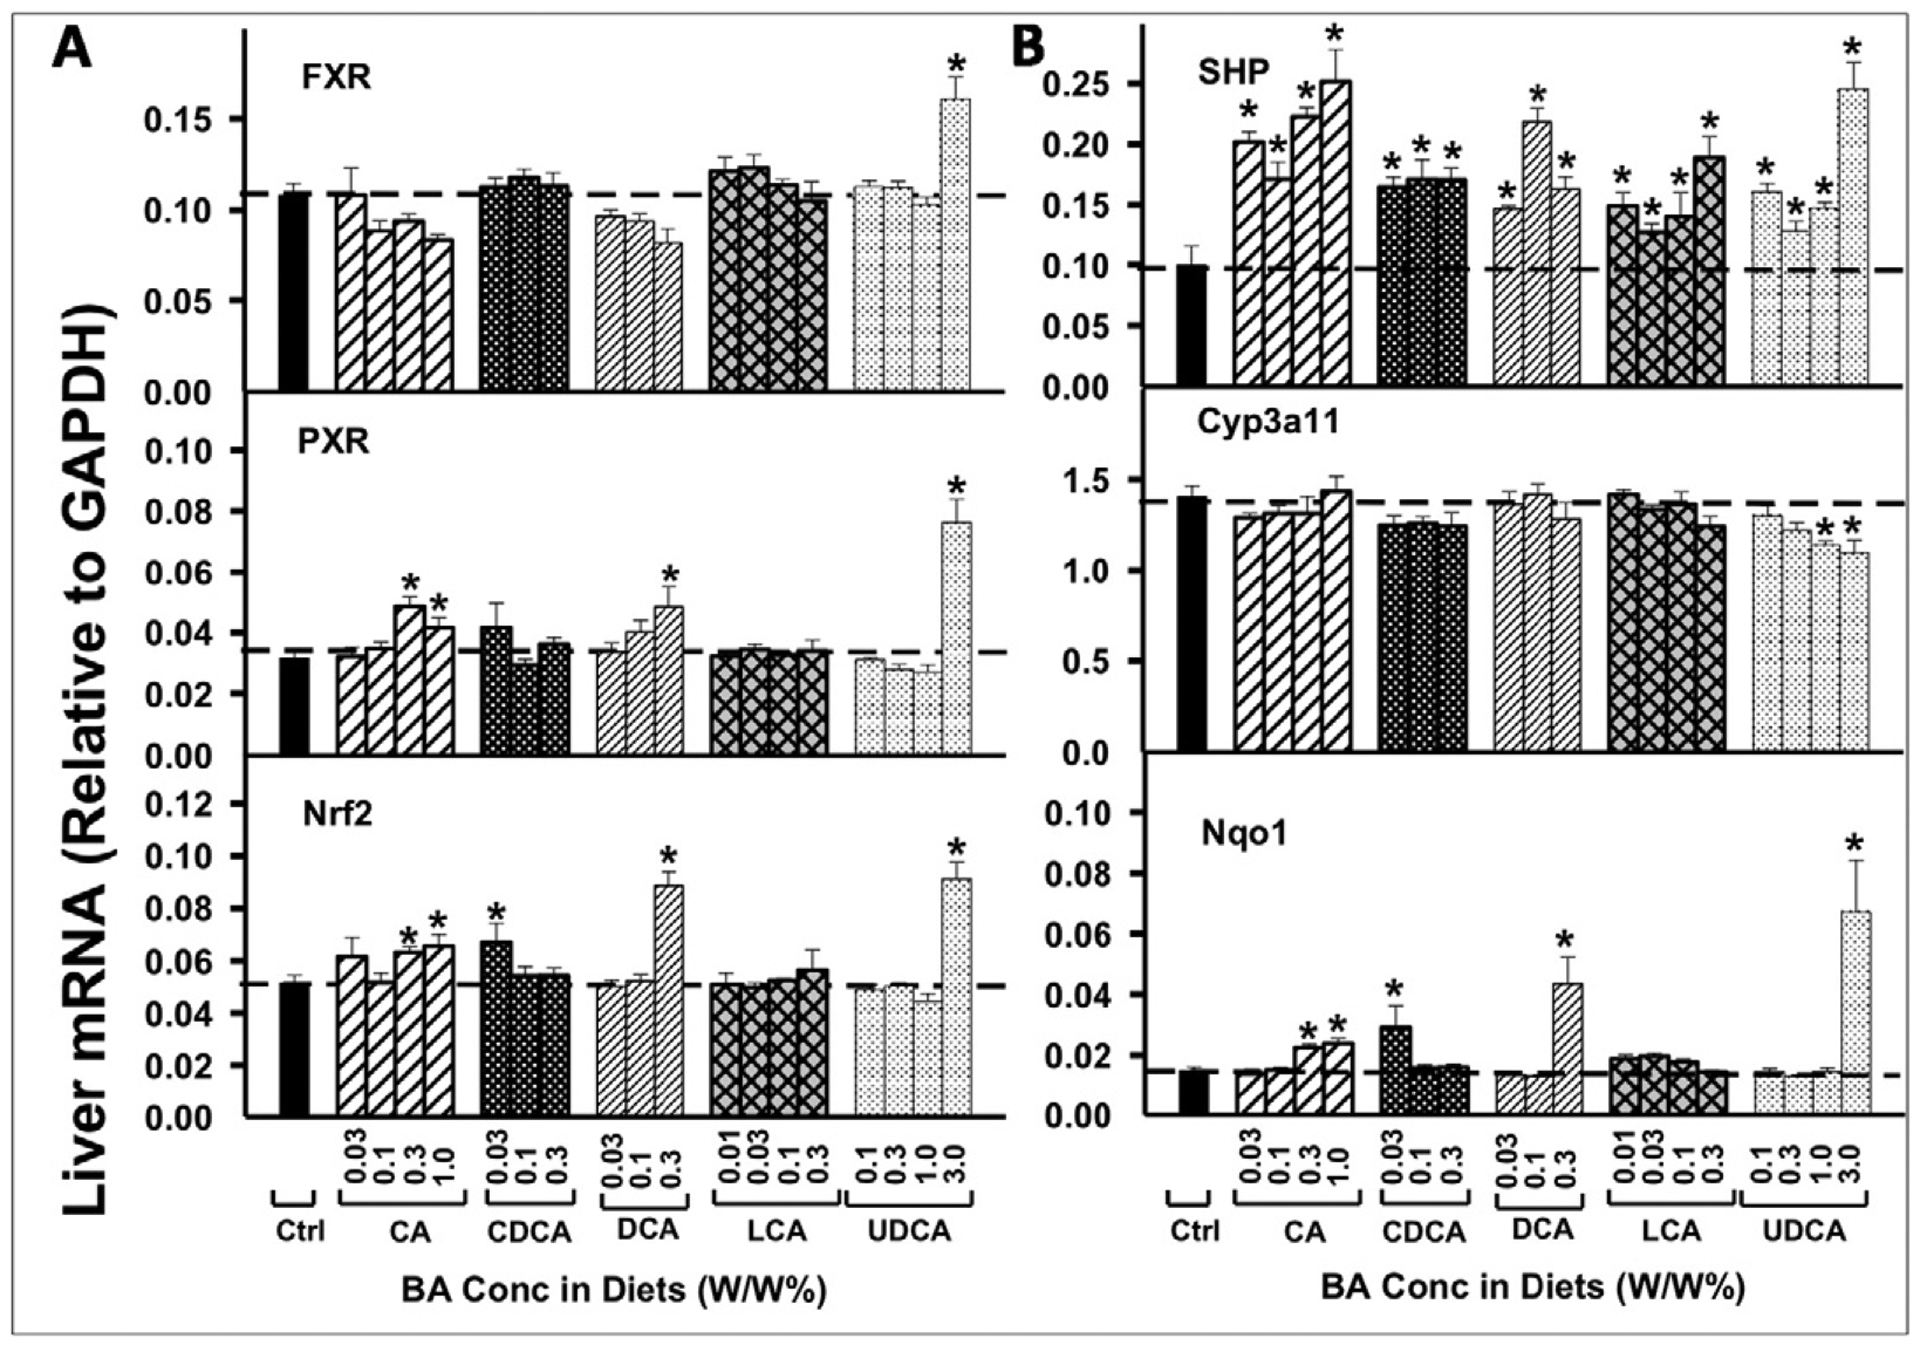
The mRNAs of the BA-sensor FXR, the xenobiotic-sensor PXR, the oxidative-stress-sensor Nrf2 in liver (A), as well as their prototypical target genes (B: SHP for FXR, Cyp3a11 for PXR and Nqo1 for Nrf2), were quantified by the QuantiGene Plex 2.0 assay. Total RNAs were isolated from mice treated with various BAs at various concentrations in diets (n = 5 per group). Data are normalized to Gapdh mRNA, and are expressed as mean ± SE. Asterisks represent statistically significant changes compared to Control.
PXR mRNA was only increased by feeding mice high concentrations of BAs (Fig. 6A), and its target gene Cyp3a11 mRNA (Fig. 6B) was not increased by any of the BAs. Both Nrf2 mRNA and its target gene Nqo1 were increased by very high concentrations of BAs, including CA at 0.3 and 1.0%, and DCA at 0.3% in the diets. UDCA at the highest concentrations (3.0%) in the diet also increased mRNA expression of Nrf2 and its target gene Nqo1 (Fig. 6).
Effect of feeding BAs on mRNA expression of BA transporters in ileum
As shown in Fig. 7, the effects of the five BAs on Asbt mRNA in ilea was not marked, but depended on both the BA and concentration fed to mice. Feeding mice CA at concentrations of 0.3 and 1.0% in the diets decreased the mRNA of Asbt 31 and 41%, respectively. CDCA and DCA had little effect on mRNA expression of Asbt in ileum. In contrast, feeding mice LCA at 0.01 and 0.1% in the diets increased the mRNA of Asbt about 30%, as well as 0.3% UDCA increased Asbt mRNA 23%. However, UDCA at the highest dose (3.0% in the diet) decreased Asbt mRNA expression in ileum 26%.
Fig. 7.
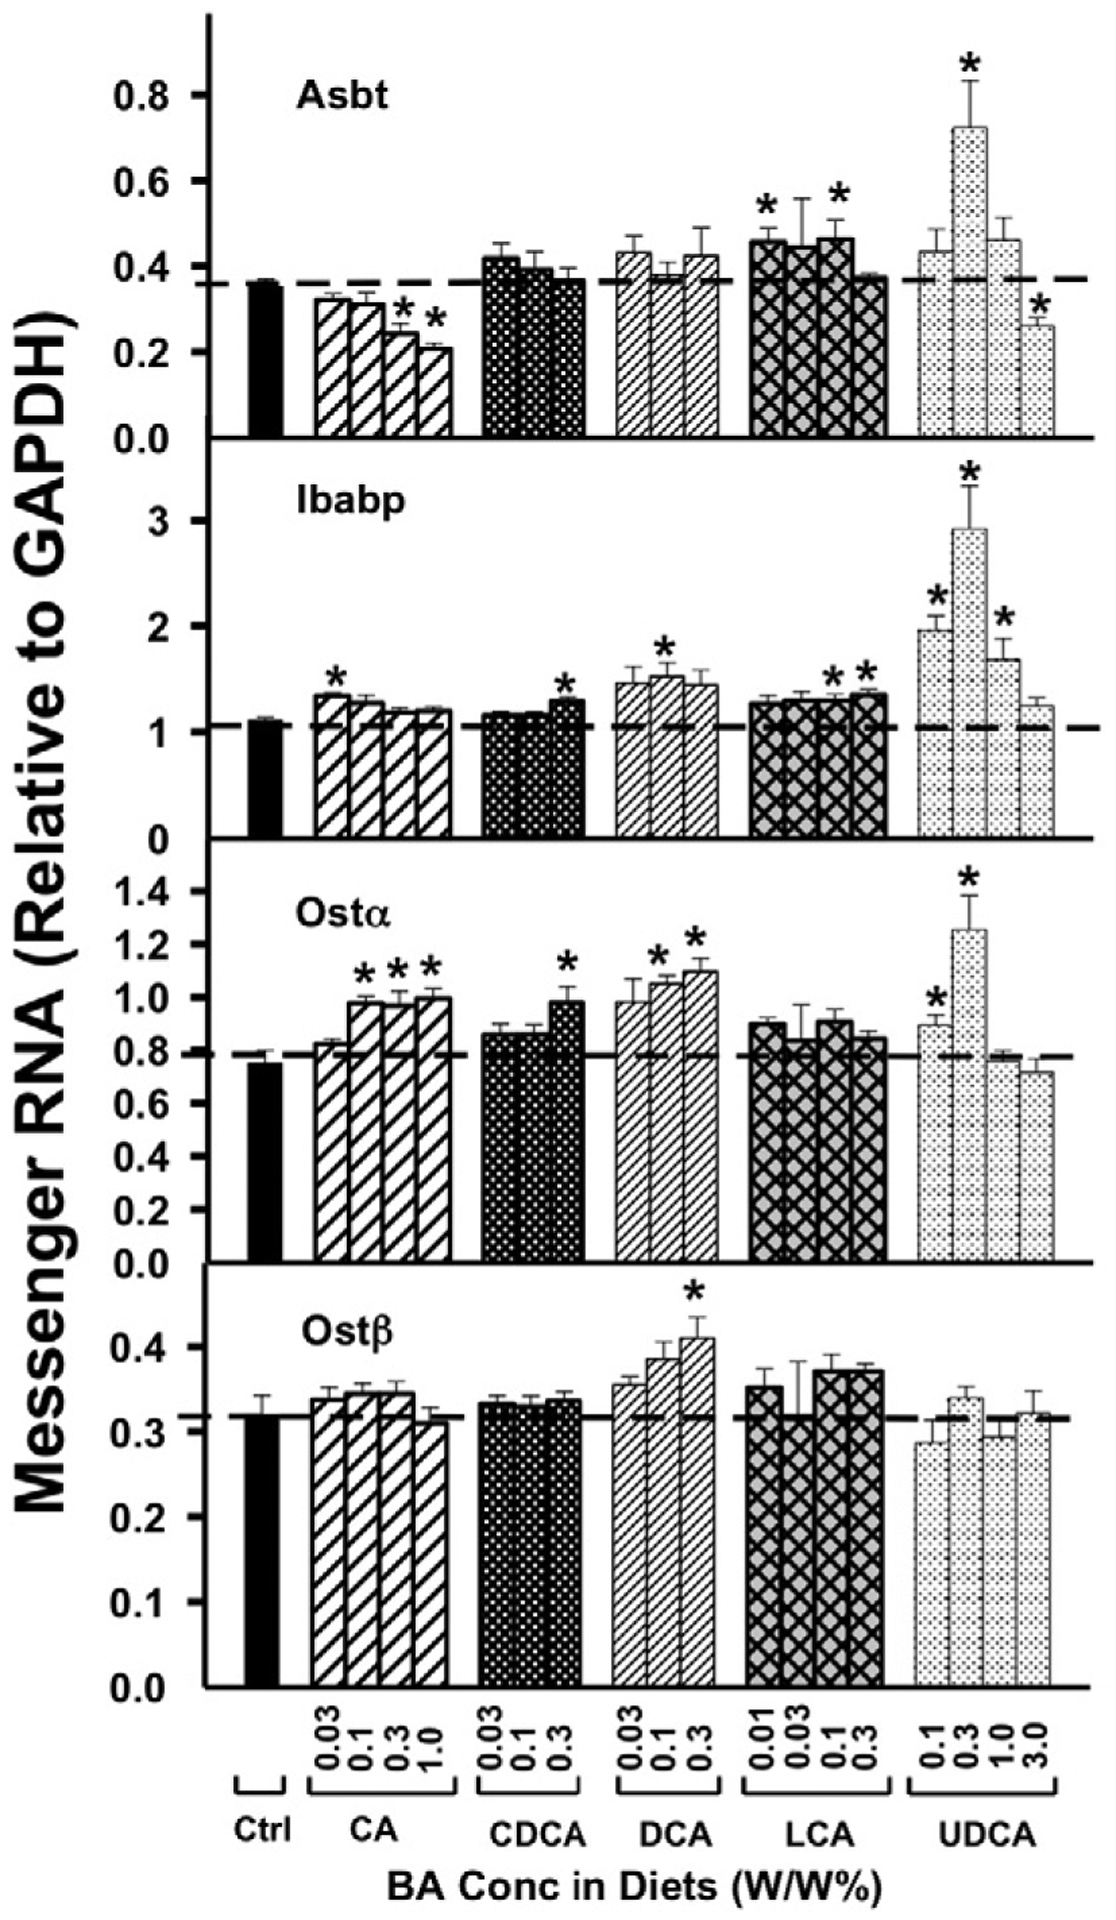
The mRNAs of Asbt, Ibabp, Ostα, and Ostβ in ileum were quantified by the QuantiGene Plex 2.0 assay. Total RNAs were isolated from mice treated with various BAs at various concentrations in diets (n = 5 per group). Data are normalized to Gapdh mRNA, and are expressed as mean ± SE. Asterisks represent statistically significant changes compared to Control.
CA at the lowest dose (0.03% in the diet) increased the intestinal BA binding protein (Ibabp) mRNA 21% (Fig. 7). At higher doses, CA did not affect the mRNA expression of Ibabp. In contrast, only at higher doses did other BAs (CDCA at 0.3%, DCA at 0.1%, LCA at 0.1, and 0.3% in the diets) increase Ibabp mRNA 16–37%. UDCA at 0.1, 0.3, and 1.0% in the diets increased Ibabp mRNA 50–150%.
The mRNA of Ostα was regulated by feeding mice various BAs. Ostα was increased by CA at 0.1, 0.3, and 1.0% in the diets about 30%, CDCA at 0.3% in the diet 31%, as well as DCA at 0.1 and 0.3% in the diets 40–46%. However, Ostα was not regulated by LCA at any concentration. UDCA at 0.1 and 0.3% in the diets also increased Ostα mRNA expression in ileum 19 and 67%, respectively. In contrast to the effect of feeding mice BAs on Ostα mRNA expression, feeding mice BAs had little effect on Ostβ mRNA expression, except that DCA at the highest concentration (0.3% in the diet) increased Ostβ mRNA in ileum 28%.
Effect of feeding BAs on mRNA expression of nuclear receptors in ileum
As shown in Fig. 8, feeding mice BAs did not alter the mRNA expression of FXR in ileum. However, CA and DCA dose-dependently increased the expression of FXR-target genes SHP and Fgf15. Only the highest concentrations of CDCA in the diet increased SHP and Fgf15 mRNA, whereas LCA at the highest concentration and UDCA at all concentrations tested increased Fgf15 mRNA but not SHP mRNA in the ileum.
Fig. 8.
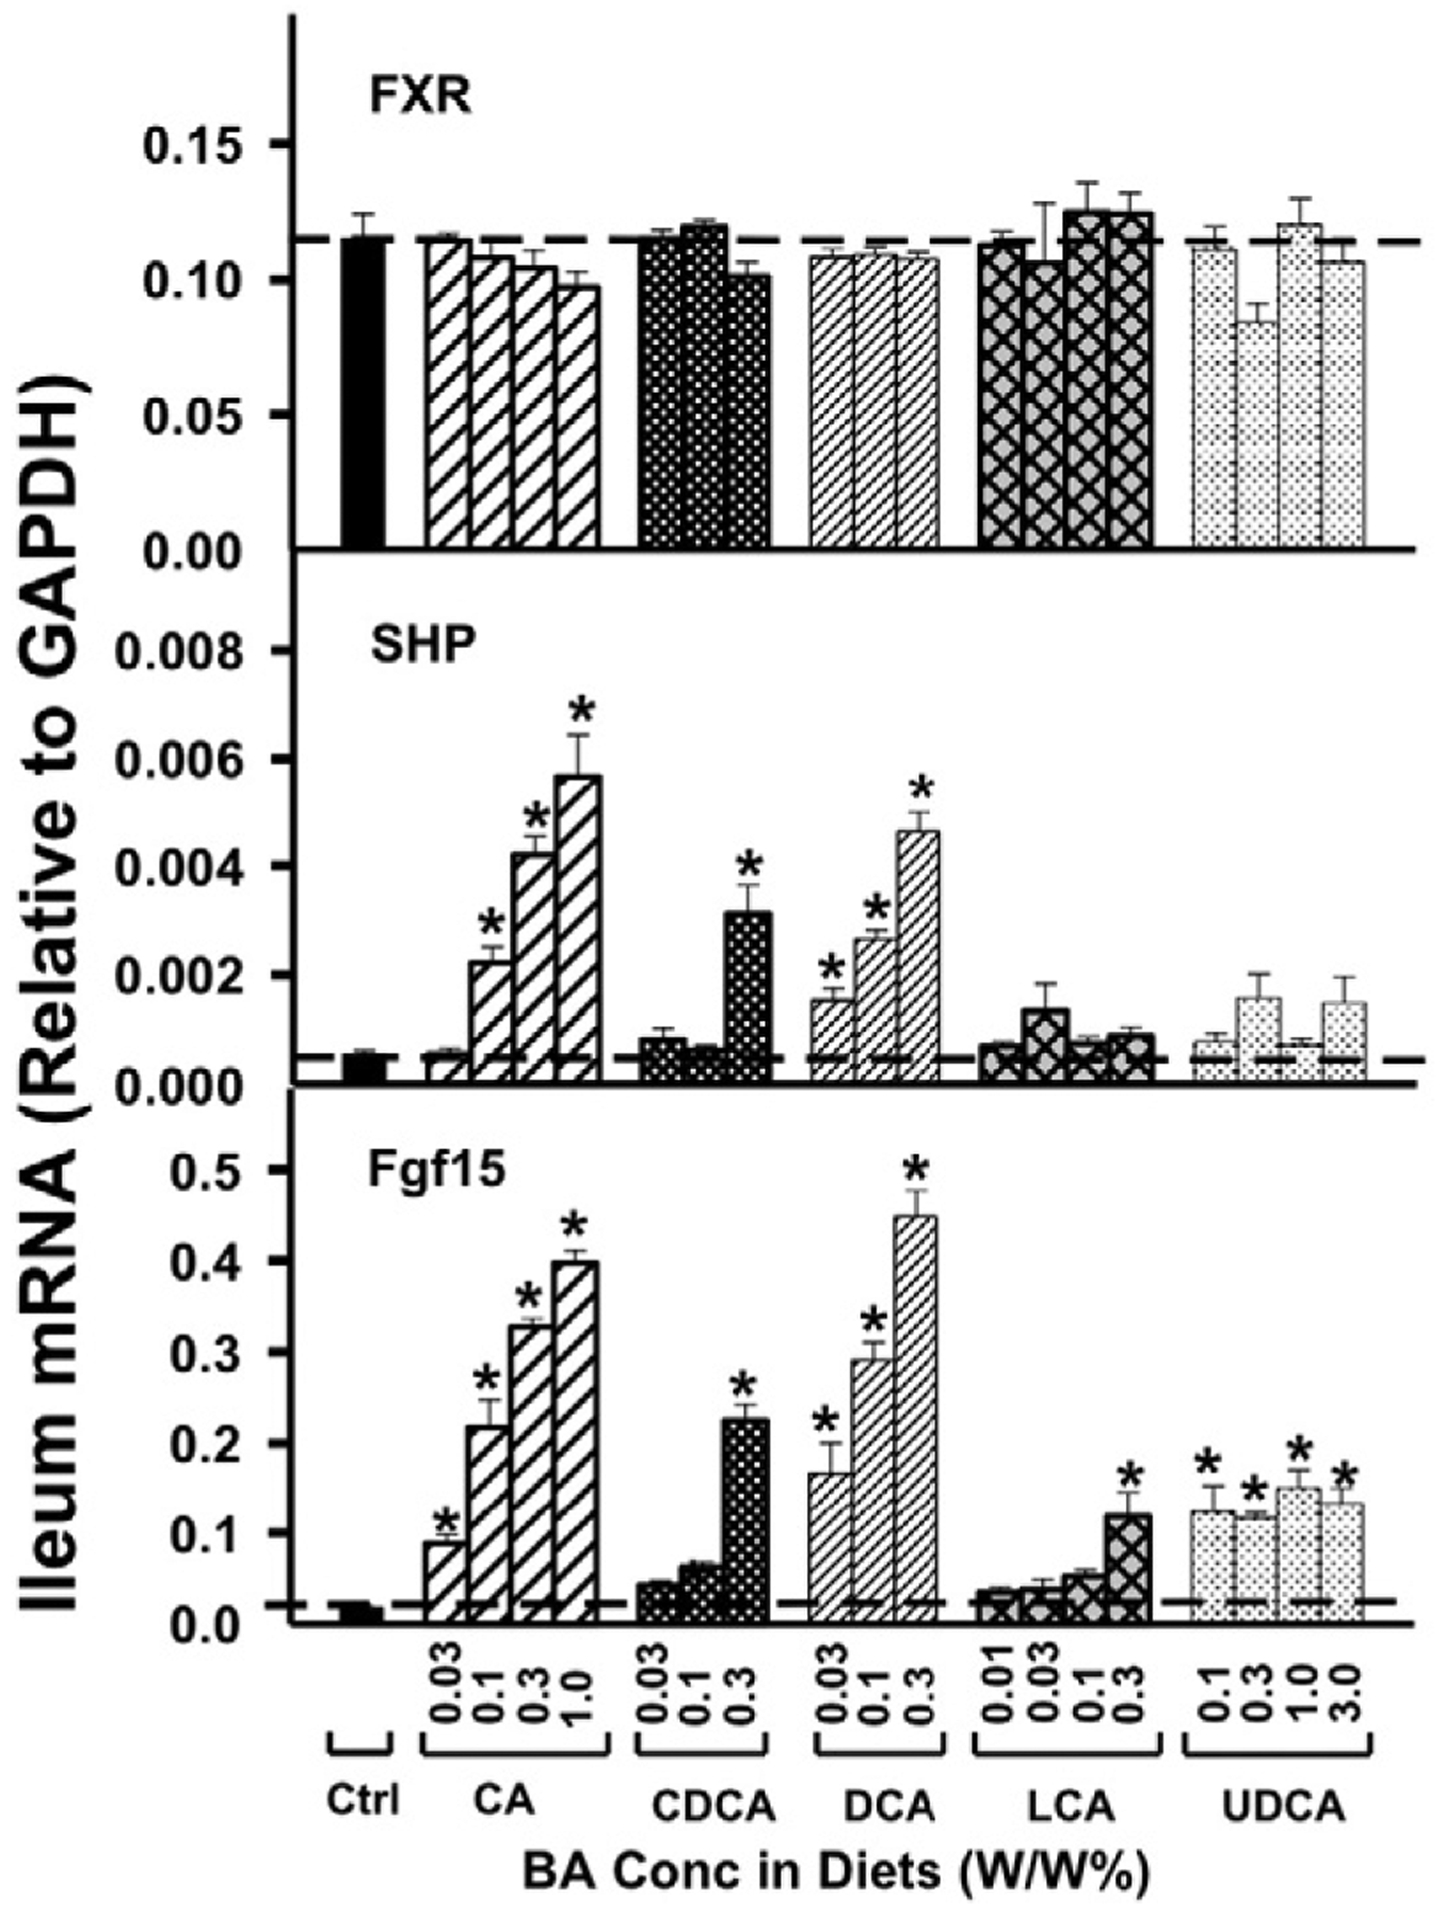
The mRNAs of the FXR, SHP, and Fgf15 in ileum were quantified by the QuantiGene Plex 2.0 assay. Total RNAs were isolated from mice treated with various BAs at various concentrations in diets (n = 5 per group). Data are normalized to Gapdh mRNA, and are expressed as mean ± SE. Asterisks represent statistically significant changes compared to Control.
In summary, the present study using individual dietary-supplementation of BAs shows that at physiologically relevant concentrations, BAs vary in their ability to modulate receptor-signaling in liver and intestine. In liver, all 5 BAs decrease the rate-limiting BA-synthetic enzyme Cyp7a1 mRNA, but CA and DCA are much more effective in suppressing Cyp8b1 mRNA, and this correlates with the induction of the intestinal FXR-Fgf15 pathway by these two BAs. Surprisingly, two major BA-transporters, namely Ntcp and Bsep, which are thought to be BA-target genes, were only minimally affected by BAs at non-toxic doses, thus these transporters do not appear to be BA-target genes during physiological situations. The alterations of other BA-processing genes by feeding five individual BAs at 3 doses were also unveiled in the present study.
Discussion
BAs serve important physiological functions, because they are critical signaling molecules that modulate not only their own synthesis but also have a role in metabolic syndrome, obesity, and diabetes, as well as having detrimental effects in liver diseases (Claudel et al., 2002; Watanabe et al., 2006; Hofmann and Hagey, 2008; Haeusler et al., 2012; Li et al., 2012).
Our understanding of the regulation of BA-synthetic enzymes by BAs has continuously evolved over the past decade (Fig. 9). It was initially thought that BAs activate FXR in the liver that increases the synthesis of SHP, which decreases the transcription of Cyp7a1, the rate limiting enzyme in BA synthesis (Goodwin et al., 2000). It was later demonstrated that there is also an intestinal FXR-Fgf15 pathway, in which BAs activate FXR in the ileocytes to increase the synthesis and secretion of Fgf15 into the blood, which is delivered to the liver where it interacts with the hepatocyte surface receptor Fgfr4 and decreases the expression of Cyp7a1 (Inagaki et al., 2005). The present study supports the existence of these pathways, as increased concentrations of BAs increased SHP mRNA in liver (Fig. 6) and Fgf15 mRNA in intestine (Fig. 8), and a marked decrease in Cyp7a1 in liver. The enzyme that hydroxylates the 12-position of BAs, Cyp8b1, was also decreased by BAs, with CA and DCA being more effective than CDCA and LCA.
Fig. 9.
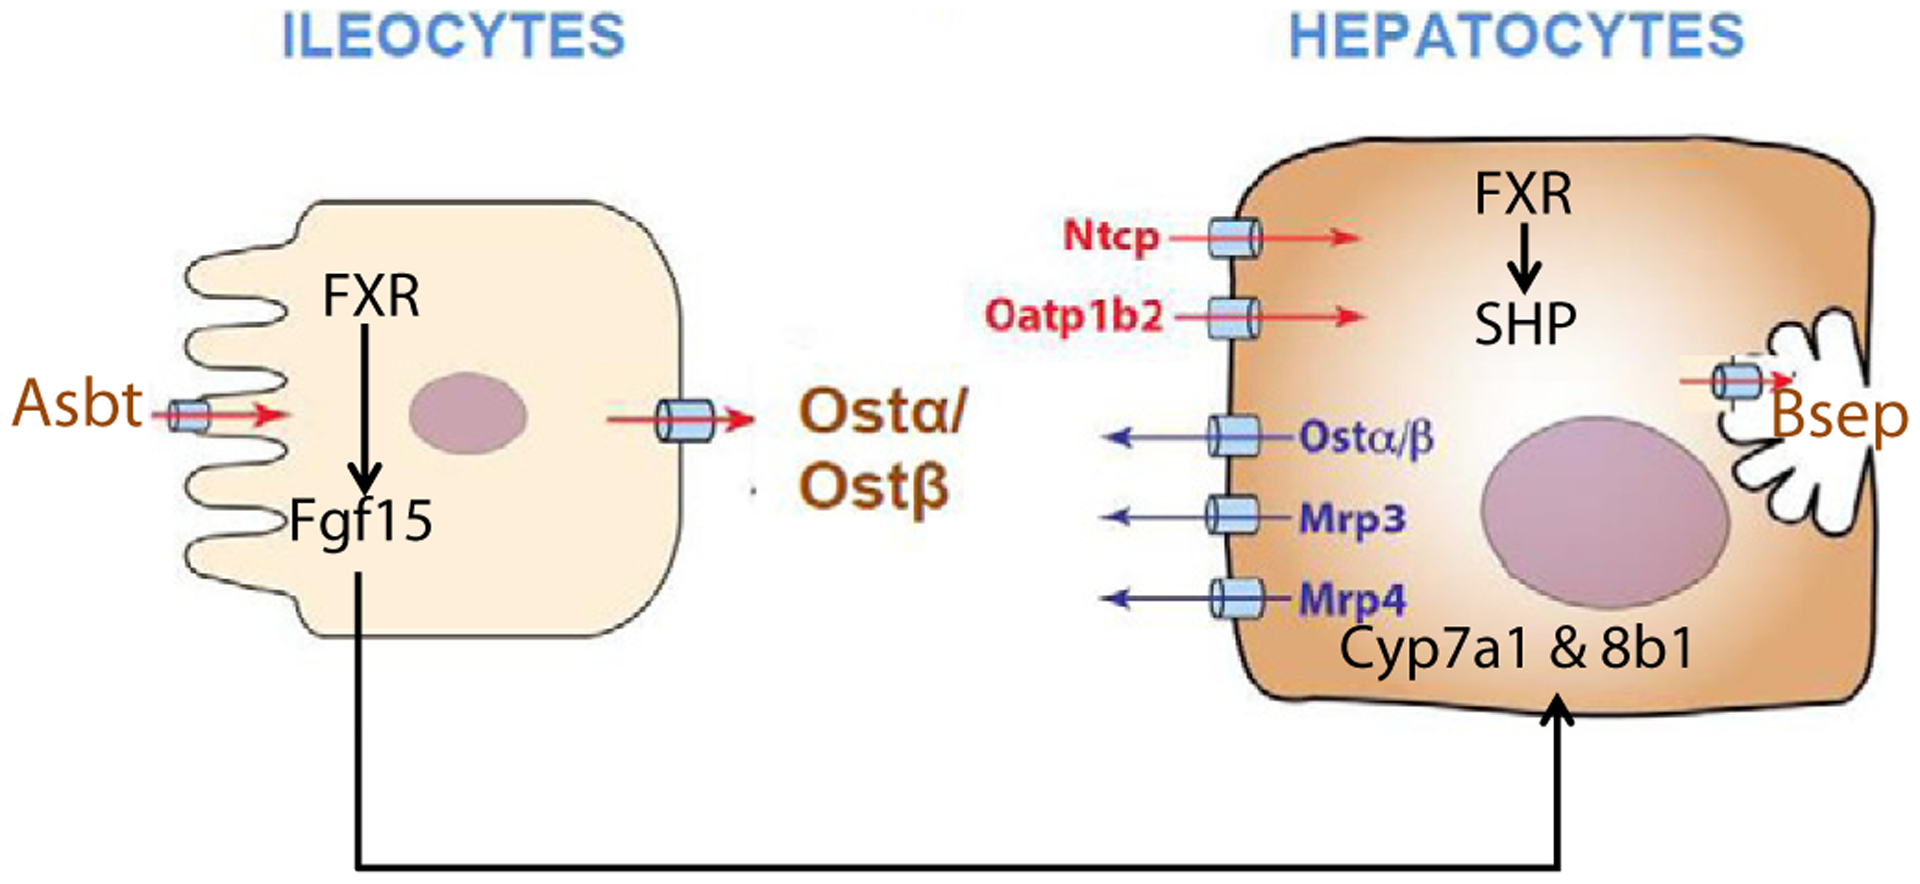
A schematic diagram of BA transport and regulation.
In regard to the potency of various bile acids to activate FXR, very little in-vivo data is available. Most studies that have attempted to investigate the potency and efficacy of BAs in activating their receptors used in vitro non-hepatocyte-derived cultures, and do not necessarily reproduce the in vivo situation. Using cells derived from a monkey kidney (CV-1), FXR was activated the most by CDCA and its conjugate, followed by LCA, and DCA (Makishima et al., 1999; Parks et al., 1999; Wang et al., 1999). However, the present study shows that in vivo dietary supplementation of the five individual BAs all lead to activation of FXR in liver, as evidenced by an increase in the mRNA of the prototypical FXR-target gene SHP (Fig. 6). In the intestine, BAs activated FXR and increased the mRNA of SHP and Fgf15, where dose–response increases were observed, with CA and DCA being more potent and effective than CDCA and LCA. The decrease in Cyp8b1 and Cyp7a1 mRNAs (Fig. 1) were also more after CA and DCA than CDCA and LCA. CDCA, which is considered the most potent in vitro FXR agonist (Makishima et al., 1999; Parks et al., 1999; Wang et al., 1999), only increases SHP and Fgf15 mRNAs in the intestine at the highest concentrations (Fig. 8). Therefore, the in vivo regulation of the BA receptor FXR-signaling by various BAs is different from the previous in vitro results. The reason for the difference is likely due to the relative inability to transport BAs into the in vitro cells, in contrast to the ability of ileocytes and hepatocytes to transport BAs in the intact animal. The pharmacokinetics of BAs appear to be quite different, as the concentration of BAs in the livers of these mice were more than three-fold higher when fed CA than CDCA (Song et al., 2011).
Ntcp is thought to be the major hepatic uptake transporter for conjugated BAs (Hagenbuch et al., 1996) and Oatp1b2 is the hepatic uptake transporter for unconjugated BAs (Csanaky et al., 2011), whereas Bsep is the rate-limiting BA efflux transporter on the canalicular membrane of hepatocytes (Wang et al., 1999). It is generally considered that BAs at high concentrations down-regulate Ntcp and increase Bsep (Wolters et al., 2002; Trauner and Boyer, 2003; Zollner et al., 2003), which appear to serve as compensatory mechanisms to reduce the hepatic load of BAs. Down-regulation of Ntcp mRNA has been observed in several cholestatic animal models, including BDL in rats, in which Ntcp mRNA was decreased 60% (Gartung et al., 1996). When bile salt flux was increased by dietary supplementation with taurocholate (0.5%), the mRNA of Ntcp was slightly decreased, while the mRNA of Bsep was slightly increased (Walters et. al., 2002), but did not alter the mRNA of Ntcp but increased the mRNA of Bsep about 50% but did not increase Bsep protein (Walters et al., 2002). In laboratory models of cholestasis by bile-duct ligation and ANIT administration, the expression of Ntcp is decreased, and Bsep is increased (Slitt et al., 2007; Cui et al., 2009; Tanaka et al., 2009). However, the BA levels in these models are much higher than physiological concentrations. In the present study, using multiple doses of various BAs, no consistent changes in Ntcp or Bsep mRNAs or protein were observed. Thus, Ntcp and Bsep do not appear to be regulated by activating FXR at physiological and pharmacological doses of BAs.
BAs did have effects on other transporters. In liver, BAs markedly increased the canalicular cholesterol half transporters Abcg5/8, the sinusoidal BA efflux transporter Ostα/β, and a small increase in the sinusoidal transporter Mrp3 (Figs. 3 & 4). In the intestine, BAs did not have a major effect on transporters but did produce a small increase in the mRNA of Ostα.
Four of the five BAs used in this study are the major BAs in humans. The fifth BA is used as a drug. It also induces SHP in liver (Fig. 6) and Fgr15 in intestine (Fig. 8) and decreases the BA synthetic enzymes Cyp7a1 and Cyp8b1 in liver. Thus, UDCA is a FXR activator, but in general is not as effective as CA and DCA.
In addition to FXR, PXR has been suggested to regulate Cyp7a1 (Staudinger et al., 2001). However, the present data show little effects of BAs on mRNA expression of either PXR or its target gene Cyp3a11 (Fig. 6), suggesting that PXR may not be easily activated by BAs. LCA, a toxic BA, activates Nrf2 and induces cytoprotective genes to prevent further injury (Tan et al., 2007). Only hepatotoxic doses of CA and DCA activated Nrf2, suggesting that Nrf2 activation may be a compensatory response of the liver to toxic effects of BAs, rather than a direct effect of BAs.
In conclusion, utilizing a dose–response feeding protocol of various BAs to mice, it is clear that all of these BAs activate FXR as noted by an increase of SHP in the liver and Fgf15 in the intestine. This resulted in a decrease in the mRNA of the BA synthetic enzymes Cyp7a1 and Cyp8b1 in liver, but did not change the mRNA and protein of Ntcp and Bsep, which are hepatic uptake and efflux transporters of BA conjugates in liver. It was also shown that CA and DCA are more potent activators of FXR than CDCA and LCA.
Acknowledgments
The authors thank all the graduate students and postdoctoral fellows in Dr. Klaassen’s lab who helped to collect tissues from the mice and carefully proof-read the manuscript.
This study was supported by the National Institutes of Health (Grants ES-09649 and DK-081461).
Footnotes
Conflict of interest
The authors declare that there are no conflicts of interest.
References
- Alnouti Y, Csanaky IL, Klaassen CD, 2008. Quantitative-profiling of bile acids and their conjugates in mouse liver, bile, plasma, and urine using LC–MS/MS. J. Chromatogr. B Anal. Technol. Biomed. Life Sci 873, 209–217. [DOI] [PMC free article] [PubMed] [Google Scholar]
- Ballatori N, Fang F, Christian WV, Li N, Hammond CL, 2008. Ostalpha-Ostbeta is required for bile acid and conjugated steroid disposition in the intestine, kidney, and liver. Am. J. Physiol. Gastrointest. Liver Physiol 295, G179–G186. [DOI] [PMC free article] [PubMed] [Google Scholar]
- Chiang JY, 2009. Bile acids: regulation of synthesis. J. Lipid Res 50, 1955–1966. [DOI] [PMC free article] [PubMed] [Google Scholar]
- Claudel T, Sturm E, Duez H, Torra IP, Sirvent A, Kosykh V, Fruchart JC, Dallongeville J, Hum DW, Kuipers F, Staels B, 2002. Bile acid-activated nuclear receptor FXR suppresses apolipoprotein A-I transcription via a negative FXR response element. J. Clin. Invest 109, 961–971. [DOI] [PMC free article] [PubMed] [Google Scholar]
- Csanaky IL, Lu H, Zhang Y, Ogura K, Choudhuri S, Klaassen CD, 2011. Organic anion-transporting polypeptide 1b2 (Oatp1b2) is important for the hepatic uptake of unconjugated bile acids: studies in Oatp1b2-null mice. Hepatology 53, 272–281. [DOI] [PMC free article] [PubMed] [Google Scholar]
- Cui YJ, Aleksunes LM, Tanaka Y, Goedken MJ, Klaassen CD, 2009. Compensatory induction of liver efflux transporters in response to ANIT-induced liver injury is impaired in FXR-null mice. Toxicol. Sci 110, 47–60. [DOI] [PMC free article] [PubMed] [Google Scholar]
- Cui JY, Aleksunes LM, Tanaka Y, Fu ZD, Guo Y, Guo GL, Lu H, Zhong XB, Klaassen CD, 2012. Bile acids via FXR initiate the expression of major transporters involved in the enterohepatic circulation of bile acids in newborn mice. Am. J. Physiol. Gastrointest. Liver Physiol 302, G979–G996. [DOI] [PMC free article] [PubMed] [Google Scholar]
- Dawson PA, Haywood J, Craddock AL, Wilson M, Tietjen M, Kluckman K, Maeda N, Parks JS, 2003. Targeted deletion of the ileal bile acid transporter eliminates enterohepatic cycling of bile acids in mice. J. Biol. Chem 278, 33920–33927. [DOI] [PubMed] [Google Scholar]
- Fickert P, Zollner G, Fuchsbichler A, Stumptner C, Pojer C, Zenz R, Lammert F, Stieger B, Meier PJ, Zatloukal K, Denk H, Trauner M, 2001. Effects of ursodeoxycholic and cholic acid feeding on hepatocellular transporter expression in mouse liver. Gastroenterology 121, 170–183. [DOI] [PubMed] [Google Scholar]
- Fu ZD, Csanaky IL, Klaassen CD, 2012. Gender-divergent profile of bile acid homeostasis during aging of mice. PLoS One 7, e32551. [DOI] [PMC free article] [PubMed] [Google Scholar]
- Gartung C, Matern S, 1997. Molecular regulation of sinusoidal liver bile acid transporters during cholestasis. Yale J. Biol. Med 70, 355–363. [PMC free article] [PubMed] [Google Scholar]
- Gartung C, Ananthanarayanan M, Rahman MA, Schuele S, Nundy S, Soroka CJ, Stolz A, Suchy FJ, Boyer JL, 1996. Down-regulation of expression and function of the rat liver Na+/bile acid cotransporter in extrahepatic cholestasis. Gastroenterology 110, 199–209. [DOI] [PubMed] [Google Scholar]
- Gartung C, Schuele S, Schlosser SF, Boyer JL, 1997. Expression of the rat liver Na+/taurocholate cotransporter is regulated in vivo by retention of biliary constituents but not their depletion. Hepatology 25, 284–290. [DOI] [PubMed] [Google Scholar]
- Goodwin B, Jones SA, Price RR, Watson MA, McKee DD, Moore LB, Galardi C, Wilson JG, Lewis MC, Roth ME, Maloney PR, Willson TM, Kliewer SA, 2000. A regulatory cascade of the nuclear receptors FXR, SHP-1, and LRH-1 represses bile acid biosynthesis. Mol. Cell 6, 517–526. [DOI] [PubMed] [Google Scholar]
- Haeusler RA, Pratt-Hyatt M, Welch CL, Klaassen CD, Accili D, 2012. Impaired generation of 12-hydroxylated bile acids links hepatic insulin signaling with dyslipidemia. Cell Metab. 15, 65–74. [DOI] [PMC free article] [PubMed] [Google Scholar]
- Hagenbuch B, Scharschmidt BF, Meier PJ, 1996. Effect of antisense oligonucleotides on the expression of hepatocellular bile acid and organic anion uptake systems in Xenopus laevis oocytes. Biochem. J 316 (Pt 3), 901–904. [DOI] [PMC free article] [PubMed] [Google Scholar]
- Hofmann AF, Hagey LR, 2008. Bile acids: chemistry, pathochemistry, biology, pathobiology, and therapeutics. Cell. Mol. Life Sci 65, 2461–2483. [DOI] [PMC free article] [PubMed] [Google Scholar]
- Inagaki T, Choi M, Moschetta A, Peng L, Cummins CL, McDonald JG, Luo G, Jones SA, Goodwin B, Richardson JA, Gerard RD, Repa JJ, Mangelsdorf DJ, Kliewer SA, 2005. Fibroblast growth factor 15 functions as an enterohepatic signal to regulate bile acid homeostasis. Cell Metab. 2, 217–225. [DOI] [PubMed] [Google Scholar]
- Kobayashi M, Ikegami H, Fujisawa T, Nojima K, Kawabata Y, Noso S, Babaya N, Itoi-Babaya M, Yamaji K, Hiromine Y, Shibata M, Ogihara T, 2007. Prevention and treatment of obesity, insulin resistance, and diabetes by bile acid-binding resin. Diabetes 56, 239–247. [DOI] [PubMed] [Google Scholar]
- Kong B, Wang L, Chiang JY, Zhang Y, Klaassen CD, Guo GL, 2012. Mechanism of tissue-specific farnesoid X receptor in suppressing the expression of genes in bile-acid synthesis in mice. Hepatology 56, 1034–1043. [DOI] [PMC free article] [PubMed] [Google Scholar]
- Li T, Francl JM, Boehme S, Ochoa A, Zhang Y, Klaassen CD, Erickson SK, Chiang JY, 2012. Glucose and insulin induction of bile acid synthesis: mechanisms and implication in diabetes and obesity. J. Biol. Chem 287, 1861–1873. [DOI] [PMC free article] [PubMed] [Google Scholar]
- Makishima M, Okamoto AY, Repa JJ, Tu H, Learned RM, Luk A, Hull MV, Lustig KD, Mangelsdorf DJ, Shan B, 1999. Identification of a nuclear receptor for bile acids. Science 284, 1362–1365. [DOI] [PubMed] [Google Scholar]
- Parks DJ, Blanchard SG, Bledsoe RK, Chandra G, Consler TG, Kliewer SA, Stimmel JB, Willson TM, Zavacki AM, Moore DD, Lehmann JM, 1999. Bile acids: natural ligands for an orphan nuclear receptor. Science 284, 1365–1368. [DOI] [PubMed] [Google Scholar]
- Plass JR, Mol O, Heegsma J, Geuken M, Faber KN, Jansen PL, Muller M, 2002. Farnesoid X receptor and bile salts are involved in transcriptional regulation of the gene encoding the human bile salt export pump. Hepatology 35, 589–596. [DOI] [PubMed] [Google Scholar]
- Rao A, Haywood J, Craddock AL, Belinsky MG, Kruh GD, Dawson PA, 2008. The organic solute transporter alpha-beta, Ostalpha-Ostbeta, is essential for intestinal bile acid transport and homeostasis. Proc. Natl. Acad. Sci. U. S. A 105, 3891–3896. [DOI] [PMC free article] [PubMed] [Google Scholar]
- Russell DW, 2003. The enzymes, regulation, and genetics of bile acid synthesis. Annu. Rev. Biochem 72, 137–174. [DOI] [PubMed] [Google Scholar]
- Shin DJ, Osborne TF, 2009. FGF15/FGFR4 integrates growth factor signaling with hepatic bile acid metabolism and insulin action. J. Biol. Chem 284, 11110–11120. [DOI] [PMC free article] [PubMed] [Google Scholar]
- Slitt AL, Allen K, Morrone J, Aleksunes LM, Chen C, Maher JM, Manautou JE, Cherrington NJ, Klaassen CD, 2007. Regulation of transporter expression in mouse liver, kidney, and intestine during extrahepatic cholestasis. Biochim. Biophys. Acta 1768, 637–647. [DOI] [PubMed] [Google Scholar]
- Song P, Zhang Y, Klaassen CD, 2011. Dose–response of five bile acids on serum and liver bile acid concentrations and hepatotoxicity in mice. Toxicol. Sci 123, 359–367. [DOI] [PMC free article] [PubMed] [Google Scholar]
- Staudinger JL, Goodwin B, Jones SA, Hawkins-Brown D, MacKenzie KI, LaTour A, Liu Y, Klaassen CD, Brown KK, Reinhard J, Willson TM, Koller BH, Kliewer SA, 2001. The nuclear receptor PXR is a lithocholic acid sensor that protects against liver toxicity. Proc. Natl. Acad. Sci. U. S. A 98, 3369–3374. [DOI] [PMC free article] [PubMed] [Google Scholar]
- Tan KP, Yang M, Ito S, 2007. Activation of nuclear factor (erythroid-2 like) factor 2 by toxic bile acids provokes adaptive defense responses to enhance cell survival at the emergence of oxidative stress. Mol. Pharmacol 72, 1380–1390. [DOI] [PubMed] [Google Scholar]
- Tanaka Y, Aleksunes LM, Cui YJ, Klaassen CD, 2009. ANIT-induced intrahepatic cholestasis alters hepatobiliary transporter expression via Nrf2-dependent and independent signaling. Toxicol. Sci 108, 247–257. [DOI] [PMC free article] [PubMed] [Google Scholar]
- Trauner M, Boyer JL, 2003. Bile salt transporters: molecular characterization, function, and regulation. Physiol. Rev 83, 633–671. [DOI] [PubMed] [Google Scholar]
- Wang H, Chen J, Hollister K, Sowers LC, Forman BM, 1999. Endogenous bile acids are ligands for the nuclear receptor FXR/BAR. Mol. Cell 3, 543–553. [DOI] [PubMed] [Google Scholar]
- Wang R, Salem M, Yousef IM, Tuchweber B, Lam P, Childs SJ, Helgason CD, Ackerley C, Phillips MJ, Ling V, 2001. Targeted inactivation of sister of P-glycoprotein gene (spgp) in mice results in nonprogressive but persistent intrahepatic cholestasis. Proc. Natl. Acad. Sci. U. S. A 98, 2011–2016. [DOI] [PMC free article] [PubMed] [Google Scholar]
- Watanabe M, Houten SM, Mataki C, Christoffolete MA, Kim BW, Sato H, Messaddeq N, Harney JW, Ezaki O, Kodama T, Schoonjans K, Bianco AC, Auwerx J, 2006. Bile acids induce energy expenditure by promoting intracellular thyroid hormone activation. Nature 439, 484–489. [DOI] [PubMed] [Google Scholar]
- Weerachayaphorn J, Mennone A, Soroka CJ, Harry K, Hagey LR, Kensler TW, Boyer JL, 2012. Nuclear factor-E2-related factor 2 is a major determinant of bile acid homeostasis in the liver and intestine. Am. J. Physiol. Gastrointest. Liver Physiol 302, G925–G936. [DOI] [PMC free article] [PubMed] [Google Scholar]
- Wolters H, Elzinga BM, Baller JF, Boverhof R, Schwarz M, Stieger B, Verkade HJ, Kuipers F, 2002. Effects of bile salt flux variations on the expression of hepatic bile salt transporters in vivo in mice. J. Hepatol 37, 556–563. [DOI] [PubMed] [Google Scholar]
- Wong MH, Oelkers P, Dawson PA, 1995. Identification of a mutation in the ileal sodium-dependent bile acid transporter gene that abolishes transport activity. J. Biol. Chem 270, 27228–27234. [DOI] [PubMed] [Google Scholar]
- Woollett LA, Buckley DD, Yao L, Jones PJ, Granholm NA, Tolley EA, Tso P, Heubi JE, 2004. Cholic acid supplementation enhances cholesterol absorption in humans. Gastroenterology 126, 724–731. [DOI] [PubMed] [Google Scholar]
- Zhang Y, Klaassen CD, 2010. Effects of feeding bile acids and a bile acid sequestrant on hepatic bile acid composition in mice. J. Lipid Res 51, 3230–3242. [DOI] [PMC free article] [PubMed] [Google Scholar]
- Zhang YK, Guo GL, Klaassen CD, 2011. Diurnal variations of mouse plasma and hepatic bile acid concentrations as well as expression of biosynthetic enzymes and transporters. PLoS One 6, e16683. [DOI] [PMC free article] [PubMed] [Google Scholar]
- Zhang Y, Limaye PB, Lehman-McKeeman LD, Klaassen CD, 2012b. Dysfunction of organic anion transporting polypeptide 1a1 alters intestinal bacteria and bile acid metabolism in mice. PLoS One 7, e34522. [DOI] [PMC free article] [PubMed] [Google Scholar]
- Zollner G, Fickert P, Silbert D, Fuchsbichler A, Marschall HU, Zatloukal K, Denk H, Trauner M, 2003. Adaptive changes in hepatobiliary transporter expression in primary biliary cirrhosis. J. Hepatol 38, 717–727. [DOI] [PubMed] [Google Scholar]